Attached files
| file | filename |
|---|---|
| 8-K - META FINANCIAL GROUP, INC. 8-K 1-28-2016 - META FINANCIAL GROUP INC | form8k.htm |
| EX-99.1 - EXHIBIT 99.1 - META FINANCIAL GROUP INC | ex99_1.htm |
Exhibit 99.2

Investor Update First Quarter Fiscal Year 2016

Meta Management Chairman and Chief Executive Officer, Meta Financial GroupTyler Haahr has been with Meta Financial Group since 1997. Previously, he was a partner with the law firm of Lewis and Roca LLP, Phoenix, Arizona. Tyler received his B.S. degree with honors at the University of South Dakota in Vermillion, SD, and he graduated with honors from the Georgetown University Law Center, Washington, D.C. President, Meta Financial Group and MetaBankBrad Hanson founded Meta Payment Systems in 2004. He has more than 20 years of experience in financial services, including numerous banking, card industry and technology-related capacities. During his career, Brad has played a significant role in the development of the prepaid card industry. Brad graduated from the University of South Dakota in Vermillion, SD with a degree in Economics. Chief Financial Officer, Meta Financial Group and MetaBank Glen Herrick joined Meta in 2013 after previously serving in various finance, treasury, and risk management roles at Wells Fargo, including as CFO of Wells Fargo’s student loan division. Glen received his B.S. degree in Engineering Management from the United States Military Academy at West Point, N.Y. and MBA from the University of South Dakota. He also graduated from the Stonier Graduate School of Banking. J. TYLER HAAHR BRAD HANSON GLEN HERRICK CINDY SMITH Head of Technology and Operations, Meta Financial Group and MetaBank Cindy Smith joined Meta in 2015 with 25+ years of industry experience, including serving as EVP & Director of Client Contact Services/Channel Management and as EVP & Director of BankCard Product and Services at Zions Bancorporation. In 2008, she was named by American Banker as one of the “Top 25 Most Powerful Women in Banking”. Cindy has an MBA from Lansbridge University and a Masters in Management from the American Graduate School of Management. *

Meta Financial Group Highlights Net Income (1QFY16 vs 1QFY15)GAAP year over year growth of 13%Core year over year growth of 26%1Earnings ProfileSizable and growing non-interest income Opportunity for NIM expansion in current and higher rate environmentRevenue from business development & new agreements generally lags 9-12 months behind implementation costs; coiled spring effect to future earningsVery strong asset qualityNPAs are less than one fourth of bank industry average at 0.22% of total assets2Acquired Refund Advantage tax payments businessWill contribute sizable revenue and income in Q2FY16 (tax seasonality)Expenses spread throughout full year 11QFY16 excludes $0.02MM gain on sale of securities, $(0.18)MM merger expense, $(1.19)MM amortization expense, and $(1.59)MM of operating losses for our newly acquired Refund Advantage business, less applicable taxes. 1QFY15 excludes $(1.3)MM loss on sale of securities, $(0.4)MM merger expense and $(0.1)MM amortization expense, less applicable taxes.2Meta NPA/Assets as of 12/31/15, all other bank NPA/Assets as of 9/30/2015 Overview Income *

Who We Are PaymentsA top prepaid card issuerRobust deposit growthGrowing “annuity” stream and fee incomeNew partners being added & existing partners expandingNew product introductions have begun with more expected in 2016 Refund Advantage acquisition completed in September 2015 BankingGrowing community bank in regions with strong economies – IA & SDStrong and high-quality commercial, mortgage & ag loan growthAFS/IBEX asset acquisition completed in December 2014Platform for nationwide expansionHigh quality; strong loan growth *

Meta Payment Systems Prepaid card industry leader with payments diversificationDeposit Growth ~25% (qtr. avg.) over prior yearFee income up 17% YoYContinuing to grow “annuity” streamAdjacent and complementary new product introductionRefund Advantage – Tax channelAdditional MPS distributionFasterMoneyNew Credit productsMeta’s strong systems and infrastructure, and upfront regulatory requirements create a competitive advantage with high barriers to entry Growing existing relationshipsNetspendMoney NetworkBlackhawkGlobal CashNew relationships driving accelerating growth, with a strong pipelineInComm UnirushStore FinancialHyperwallet Systems Berkley Payment SolutionsUnivision10 of the top 10 program managers under contract through at least December 2019 Highlights Overview *

Retail Bank Regional Community Bank60+ years in business 10 locations in IA and SD Growing, profitable operationsAttractive combination of commercial, agricultural, retail and national insurance premium lendingLow-cost deposit base gives Bank competitive advantage on terms to attract high-quality creditsNet loan growth of 21% ($105MM) last 12 monthsExpect continued robust loan growth in the next yearExpect continued high credit standards resulting in low non-performing assets *
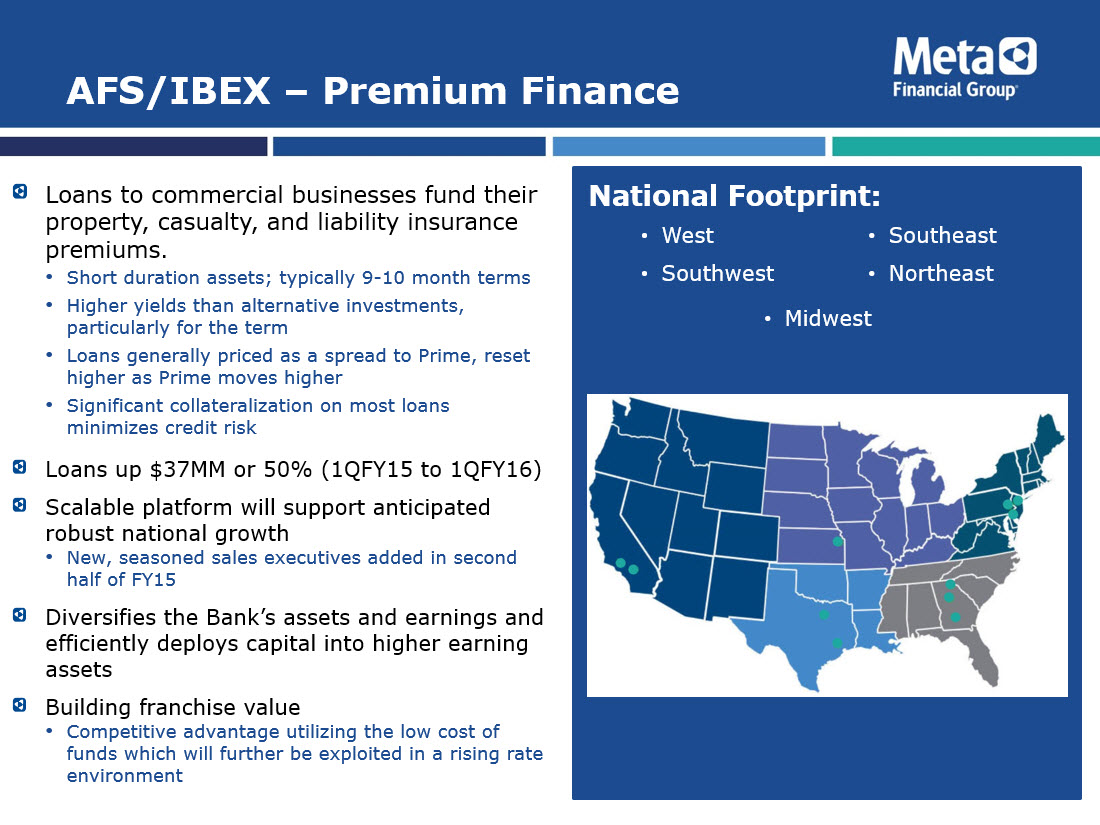
AFS/IBEX – Premium Finance Loans to commercial businesses fund their property, casualty, and liability insurance premiums. Short duration assets; typically 9-10 month termsHigher yields than alternative investments, particularly for the termLoans generally priced as a spread to Prime, reset higher as Prime moves higherSignificant collateralization on most loans minimizes credit riskLoans up $37MM or 50% (1QFY15 to 1QFY16)Scalable platform will support anticipated robust national growthNew, seasoned sales executives added in second half of FY15Diversifies the Bank’s assets and earnings and efficiently deploys capital into higher earning assetsBuilding franchise valueCompetitive advantage utilizing the low cost of funds which will further be exploited in a rising rate environment * WestSouthwest SoutheastNortheast Midwest

Industry Recognition #44 in American Banker Magazine “More double-digit goodness” (June 2015) based on avg. ROE over the past 3 years#48 in American Banker Magazine “Top 200 Community Banks and Thrifts” (June 2015) Top 1% based on 3 year ROETop 100 in ABA Banking Journal’s annual Performance Ranking for $1B-$10B banks (2014)Second largest Prepaid card issuer in the U.S. ranked by purchase volume – The Nilson Report (2015)Top 40 of ACH originators in 2014 (NACHA 2015)Top 30 of ACH receivers in 2014 (NACHA 2015)Added to Russell 2000 Index (RTY) in June 2013Added to NASDAQ’s ABA Community Bank Index (ABQI) in December 2013 Meta Financial Group *

Growth Drivers Optimize synergies: Bank and PaymentsStrong loan growth in local markets, AFS/IBEX and MPSContinue to improve upon earning asset mixLow-cost deposits with long average life (almost 7 years) feed increasingly diverse asset mixUnlock value of non-interest bearing deposit baseRising rates expected to increase yields while funding costs remain lowMBS portfolio yields & related income expected to increase significantly if rates riseLeverage MPS leadership in payments industryIncreasing market share organically and with new partnersExpanded Tax Payments space via Refund Advantage acquisitionEmergent leader in “virtual cards” for electronic settlementsSponsors approximately 65% of U.S. “white label” ATMs43 patents with over two dozen pendingBank entrance into Specialty LendingAFS/IBEX acquisition in December 2014Hired additional experienced executive and sales professionals for AFS/IBEX in fiscal 2015ClearBalance partnership may provide a loan portfolio of up to $100MM in receivables over the next two years with limited credit risk. Rates received adjusted on an annual basis based on a Prime + formula.Hospitals are underwritten and provide credit guarantee *

Oversight and Infrastructure Early adopter of sophisticated compliance systemsOCC consent order removed in August 2014Federal Reserve Bank consent order removed in May 2015Investments in MPS program design, training and technologyImplemented enhanced BSA/AML technologyEnhanced infrastructure supports growthPrior investments allows more focus on growing current business and new development opportunities with expected improving efficiencies coming in late 2016High competitive barriers to enter prepaid Industry = wide “moat”Expertise, Capital, ComplianceOperational infrastructureHigh start-up costsDurbin-related disadvantages for larger banks *

Interest Rate Risk Management Positively leveraged for higher rate environmentOCI volatile relative to peersWe believe GAAP understates balance sheet true value, particularly low-cost depositsMeta MTM of ~50% of assets available for sale (securities) vs. typical “peer” at ~15-20%Significant increased value of non-interest bearing deposits with long average life Expect continued, increasing Net Interest Margin (NIM)Continued robust loan growth at retail bank and AFS/IBEX improves earning asset mixNIM up 12bps from 4Q2015 and 21bps YOYPremium Finance (AFS/IBEX) loan yields should adjust higher if rates rise as loans are generally priced at Prime plus a spreadGrowing Premium Finance loan portfolio increases duration flexibility and thus provides increased yields in the securities portfolioMortgage-Backed Securities (MBS) could provide solid tailwind to incomeReinvestment opportunity promotes NIM expansion in an up-rate environmentCash flow from securities and loans and growing MPS deposits deployed at higher ratesMBS portfolio yields expected to increase with only nominal extension if rates riseValue of deposit base increases if rates rise *

IRR Sensitivity – What We Believe Static interest rate risk (IRR) results do not accurately reflect Meta’s true interest rate sensitivity due to our unique, predictable deposit baseDue to historically predictable weekly, monthly, and yearly deposit volatility, static IRR results can be significantly skewedΔUtilizing quarterly average balances for deposits and borrowings, with cash as the offset, provides a more accurate view of the Company’s IRR positionUnderstanding the predictable, quarterly and yearly, cyclicality in deposits and investments is necessary to interpret interest rate risk resultsMPS related non-interest bearing deposit value will be unlocked if interest rates riseLarge deposit increase in the March quarter is not included in December quarter analysis *

Capital Management Capital enhancementsRecent $26 million and $12 million private placements supporting Refund Advantage acquisition and other growth2014-15 ATM net proceeds of $25.4 million to support growth$61.0 million in 2012-13 via private placements and ATM offeringStrong institutional investor base shows continued supportMaintain strong capital ratio goalsCommon Equity Tier 1 capital > 8%Risk-based >15%Prudent capital management, flexibility to source future needs CAPITAL RATIOS OVERVIEW *

Earnings Power While Growing Equity *

Income Statement Meta Financial Group ($MM) FY11 FY12¹ FY132 FY14 FY153 1Q15⁴ 1Q16⁵ % Change Net Interest Income 34.3 33.7 36.0 46.3 59.2 13.6 17.6 24.0% Non-Interest Income 57.5 69.6 55.5 51.7 58.2 12.7 16.8 32.8% Total Revenue 91.8 103.3 91.5 98.0 117.4 26.2 34.4 28.2% Provision for Loan Loss 0.3 1.0 0.00 1.2 1.5 0.0 0.8 1538.4% Compensation and Benefits 30.5 31.1 34.1 38.2 46.5 10.5 14.7 39.2% Card Processing Expense 23.3 17.4 15.6 15.5 16.5 4.7 5.2 11.4% All Other Expense 29.5 27.0 24.7 24.6 33.5 7.2 10.1 40.8% Net Income Before Taxes 8.3 26.8 17.1 18.6 19.4 3.8 3.6 -5.0% Income Tax Expense 3.6 9.7 3.7 2.9 1.4 0.2 (0.5) -344.8% Net Income 4.6 17.1 13.4 15.7 18.1 3.6 4.1 12.9% ¹ Includes $11.4MM gain on sale of GNMA securities² Includes $2.4MM gain on sale of securities³ Includes $(1.9)MM loss on sale of securities, $(1.5)MM merger expense, $(1.4)MM amortization expense and $1.3MM ins. claim reimbursements and recoveries, less applicable taxes⁴ Includes $(1.3)MM loss on sale of securities, $(0.4)MM merger expense, and $(0.1)MM amortization expense, less applicable taxes⁵ Includes $0.02MM gain on sale of securities, $(0.18)MM merger expense, $(1.19)MM amortization expense, and $(1.59)MM of operating losses for our newly acquired Refund Advantage business, less applicable taxes *

Balance Sheet Meta Financial Group*($MM) 4Q11 4Q12 4Q13 4Q14 4Q15 1Q15 1Q16 % Change Cash And Cash Equivalents 132 106 74 100 81 90 47 -47.2% Investments and MBS 615 999 1,177 1,320 1,534 1,394 1,725 23.8% Loans Receivable Net 315 330 364 485 684 528 728 37.9% Other Assets 65 61 99 97 148 103 186 81.7% Assets 1,127 1,496 1,713 2,002 2,447 2,114 2,687 27.1% Total Deposits 970 1,275 1,405 1,542 1,820 1,646 1,968 19.6% Other Liabilities 78 112 172 290 400 289 444 53.4% Shareholders' Equity 79 109 136 171 226 179 275 53.6% Liabilities and Equity 1,127 1,496 1,713 2,002 2,447 2,114 2,687 27.1% * *Fiscal Quarter Averages

Assets * Total Assets *Fiscal Quarter Average Total Investments 22.7% CAGR

Total Gross Loans *Fiscal Quarter Average * Loan Composition1QFY16 Avg. Loan Portfolio ($MM)*

Non-Performing Assets Non-Performing Assets ($MM) % of Total Assets *

Earning Asset Mix * NIM Expanded 50bps *Fiscal Quarter Average

Deposits and Cost of Funds Deposits ($MM)* Cost of Funds * *Fiscal Quarter Average

Meta’s Value Proposition A leading issuer of prepaid debit cardsSpringboard into other products and services.Significant growth; current partners expanding, new partners added, and new products implemented with more expected to come in 2016.Strong capital positionEarnings and historical access to capital markets to fund our growth objectives.Higher earnings with limited balance sheet related to Refund Advantage and AFS/IBEX should significantly reduce, if not eliminate, the need for additional capital unless additional acquisitions.Stable, low-cost, long duration funding advantagePotential for upward trend in earningsHigher/Normalized interest rates. Asset diversification with higher yields.~90% of deposits are low cost & will remain so in rising rates.Loan & security yields well positioned to increase with rising rates. Increased efficiencies expected late in 2016Steady dividend policy *

Forward Looking Statement Meta Financial Group, Inc.®, (“the Company”) and its wholly-owned subsidiary, MetaBank® (the “Bank” or “MetaBank”), may from time to time make written or oral “forward-looking statements,” including statements contained in this investor update, the Company’s filings with the Securities and Exchange Commission (“SEC”), the Company’s reports to stockholders and in other communications by the Company and the Bank, which are made in good faith by the Company pursuant to the “safe harbor” provisions of the Private Securities Litigation Reform Act of 1995.You can identify forward-looking statements by words such as “may,” “hope,” “will,” “should,” “expect,” “plan,” “anticipate,” “intend,” “believe,” “estimate,” “predict,” “potential,” “continue,” “could,” “future,” or the negative of those terms, or other words of similar meaning. You should carefully read statements that contain these words because they discuss our future expectations or state other “forward-looking” information. These forward-looking statements include statements with respect to the Company’s beliefs, expectations, estimates and intentions that are subject to significant risks and uncertainties, and are subject to change based on various factors, some of which are beyond the Company’s control. Such statements address, among others, the following subjects: the potential benefits of the acquisition of Fort Knox Financial Services Corporation and its wholly-owned subsidiary, Tax Product Services LLC (collectively, “Fort Knox”); important components of the Company's statements of financial condition and operations; growth and expansion; new products and services, such as those offered by MetaBank or Meta Payment Systems® (“MPS”), a division of the Bank; credit quality and adequacy of reserves; technology; and the Company's employees. Actual results may differ materially from those contained in the forward-looking statements. The following factors, among others, could cause the Company's financial performance and results of operations to differ materially from the expectations, estimates, and intentions expressed in such forward-looking statements: the businesses of the Bank and Fort Knox may not be combined successfully, or such combination may take longer, be more difficult, time-consuming or costly to accomplish than expected; the risk that sales of Fort Knox products by the Bank may not be as high as anticipated; the expected growth opportunities or cost savings from the acquisition may not be fully realized or may take longer to realize than expected; customer losses and business disruption following the acquisition, including adverse effects on relationships with former or current employees of Fort Knox, may be greater than expected; regulatory reception to the Fort Knox business may not be as anticipated and the Company may incur unanticipated or unknown losses or liabilities on a post-acquisition basis, including risks similar to those expressed above, especially given the Company’s entry into a new line of business; the risk that the Company may incur unanticipated or unknown losses or liabilities as a result of the completion of the transaction with Fort Knox; the strength of the United States' economy, in general, and the strength of the local economies in which the Company conducts operations; the effects of, and changes in, trade, monetary, and fiscal policies and laws, including interest rate policies of the Board of Governors of the Federal Reserve System (the “Federal Reserve”), as well as efforts of the United States Treasury in conjunction with bank regulatory agencies to stimulate the economy and protect the financial system; inflation, interest rate, market, and monetary fluctuations; the timely development of, and acceptance of new products and services, offered by the Company, as well as risks (including reputational and litigation) attendant thereto, and the perceived overall value of these products and services by users; the risks of dealing with or utilizing third parties; any actions which may be initiated by our regulators; the impact of changes in financial services laws and regulations, including, but not limited to, laws and regulations relating to the tax refund industry, our relationship with our primary regulators, the Office of the Comptroller of the Currency and the Federal Reserve, as well as the Federal Deposit Insurance Corporation, which insures the Bank’s deposit accounts up to applicable limits; technological changes, including, but not limited to, the protection of electronic files or databases; acquisitions; litigation risk, in general, including, but not limited to, those risks involving the MPS division; the growth of the Company’s business, as well as expenses related thereto; continued maintenance by the Bank of its status as a well-capitalized institution, particularly in light of our deposit base, a substantial portion of which has been characterized as “brokered”; changes in consumer spending and saving habits; and the success of the Company at managing and collecting assets of borrowers in default. The foregoing list of factors is not exclusive. Additional discussions of factors affecting the Company’s business and prospects are reflected under the headings “Risk Factors” and in other sections of the Company’s Annual Report on Form 10-K for the fiscal year ended September 30, 2015 and other filings made with the SEC. The Company expressly disclaims any intent or obligation to update any forward-looking statement, whether written or oral, that may be made, from time to time, by or on behalf of the Company or its subsidiaries. *

NASDAQ: CASH *