Attached files
| file | filename |
|---|---|
| 8-K - 8-K - ILLINOIS TOOL WORKS INC | itw8k4q15.htm |
| EX-99.1 - EXHIBIT 99.1 - ILLINOIS TOOL WORKS INC | ex991pressrel4q15.htm |
Fourth Quarter 2015 Conference Call January 27, 2016 E. Scott Santi, Chairman & CEO Michael M. Larsen, Senior Vice President & CFO Aaron H. Hoffman, Vice President, Investor Relations
Forward Looking Statements 2 Safe Harbor Statement This conference call contains forward-looking statements within the meaning of the Private Securities Litigation Reform Act of 1995 including, without limitation, statements regarding the expected impact of product line simplification activities, future financial performance, operating performance, growth in free cash flow, organic and total revenue growth, operating margin growth, growth in diluted income per share from continuing operations, restructuring expenses and related benefits, tax rates, exchange rates, timing and amount of share repurchases, return on invested capital, end market economic conditions, and the company’s related 2016 guidance. These statements are subject to certain risks, uncertainties, and other factors which could cause actual results to differ materially from those anticipated. Important risks that could cause actual results to differ materially from the company’s expectations include those that are detailed in ITW’s Form 10-K for 2014 and Form 10-Q for the third quarter of 2015. Non-GAAP Measures The company uses certain non-GAAP measures in discussing the company’s performance. The reconciliation of those measures to the most comparable GAAP measures are detailed in ITW’s press release for the fourth quarter of 2015, which is available at www.itw.com, together with this presentation.

2015 Highlights ● 2015 financial results driven by solid execution of ITW’s Enterprise Strategy – $5.13 EPS +10%, record 21.4% operating margin +150 bps, record 20.4% ROIC* +140 bps ● Invested ~$560 million in growth and productivity ● 110 basis points of margin improvement from “self-help” Enterprise Initiatives ● Solid progress in our “pivot to growth” … 60% of ITW’s revenues achieved “ready to grow” status and 45% grew at 6% in 2015 ●Returned more than $2.7 billion to shareholders through dividends and share repurchases ●Remain on-track to deliver on our end of 2017 Enterprise performance goals: – Operating margin 23%+ – ROIC 20%+ – Organic growth of 200 bps or more above global GDP 3 Continuing to make strong progress in positioning ITW for solid growth with best-in-class margins and returns * See ITW’s fourth quarter 2015 press release for the reconciliation from GAAP to non-GAAP measurements.
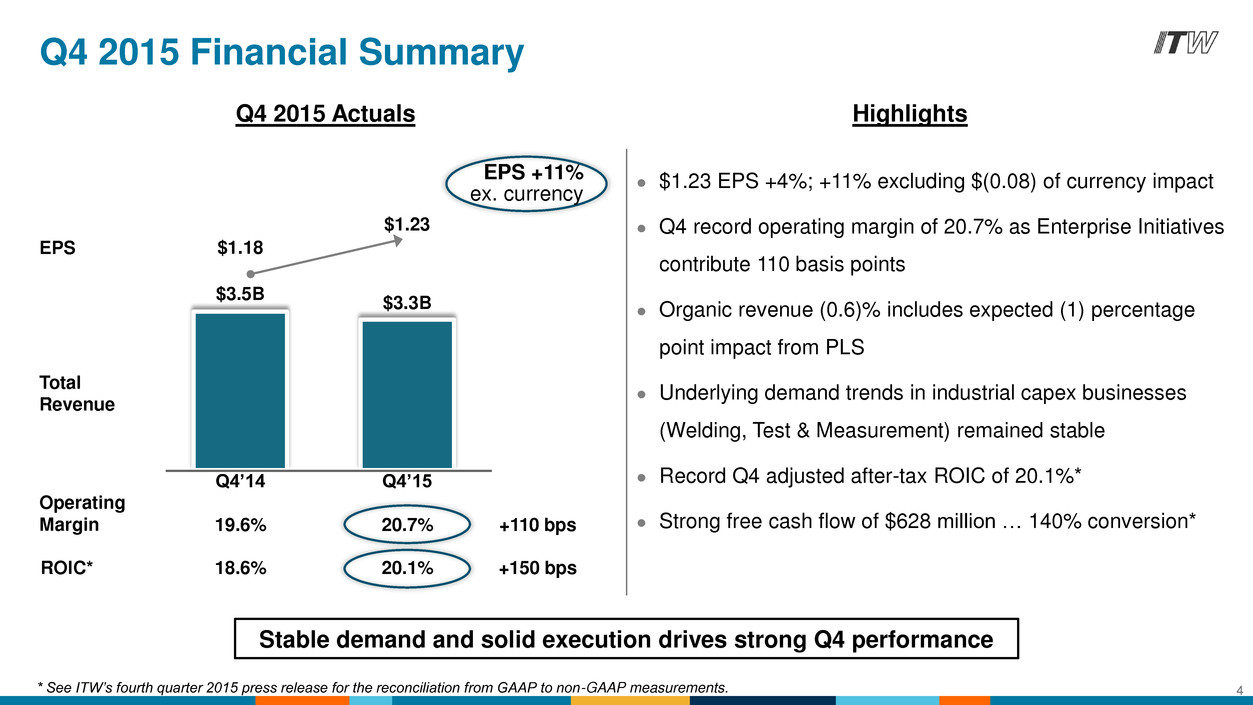
$3.3B $3.5B Q4’14 Q4’15 Total Revenue $1.23 $1.18 EPS Operating Margin EPS +11% ex. currency Q4 2015 Financial Summary Stable demand and solid execution drives strong Q4 performance 20.7% 19.6% +110 bps ROIC* 20.1% 18.6% +150 bps * See ITW’s fourth quarter 2015 press release for the reconciliation from GAAP to non-GAAP measurements. Q4 2015 Actuals ● $1.23 EPS +4%; +11% excluding $(0.08) of currency impact ● Q4 record operating margin of 20.7% as Enterprise Initiatives contribute 110 basis points ● Organic revenue (0.6)% includes expected (1) percentage point impact from PLS ● Underlying demand trends in industrial capex businesses (Welding, Test & Measurement) remained stable ● Record Q4 adjusted after-tax ROIC of 20.1%* ● Strong free cash flow of $628 million … 140% conversion* 4 Highlights
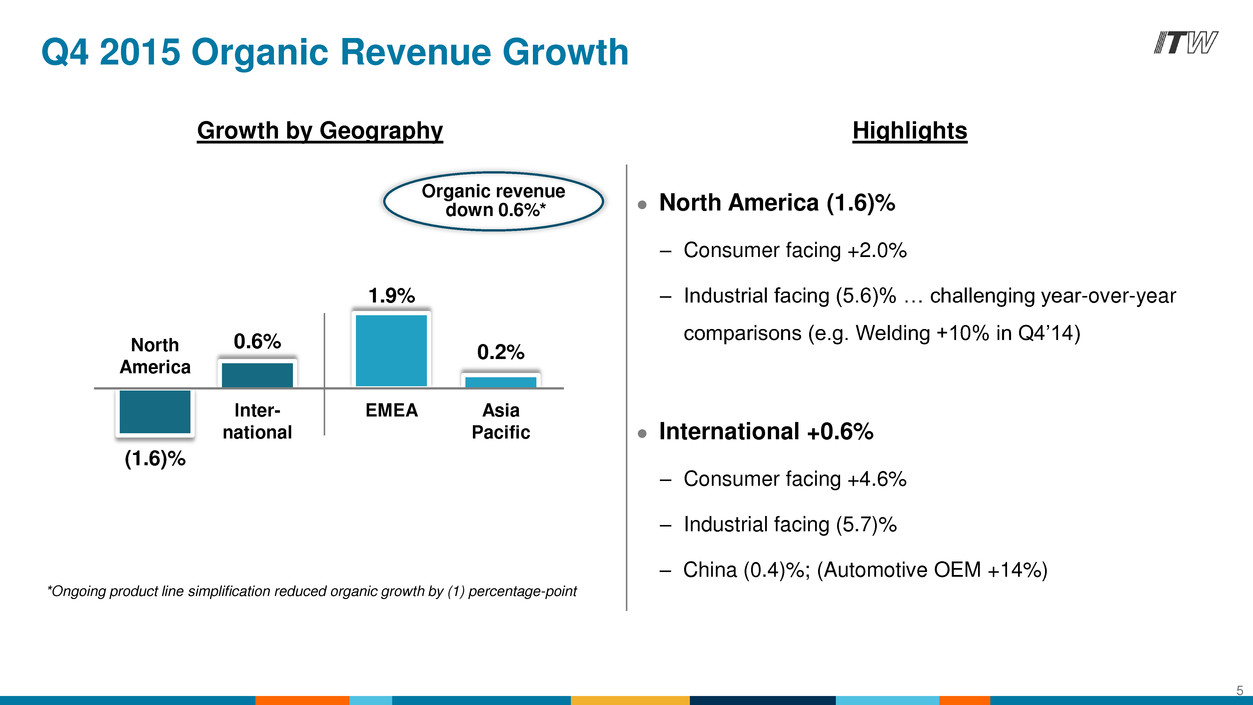
Q4 2015 Organic Revenue Growth Growth by Geography ● North America (1.6)% – Consumer facing +2.0% – Industrial facing (5.6)% … challenging year-over-year comparisons (e.g. Welding +10% in Q4’14) ● International +0.6% – Consumer facing +4.6% – Industrial facing (5.7)% – China (0.4)%; (Automotive OEM +14%) (1.6)% 1.9% 0.2% 0.6% North America Inter- national Asia Pacific EMEA 5 Highlights *Ongoing product line simplification reduced organic growth by (1) percentage-point Organic revenue down 0.6%*
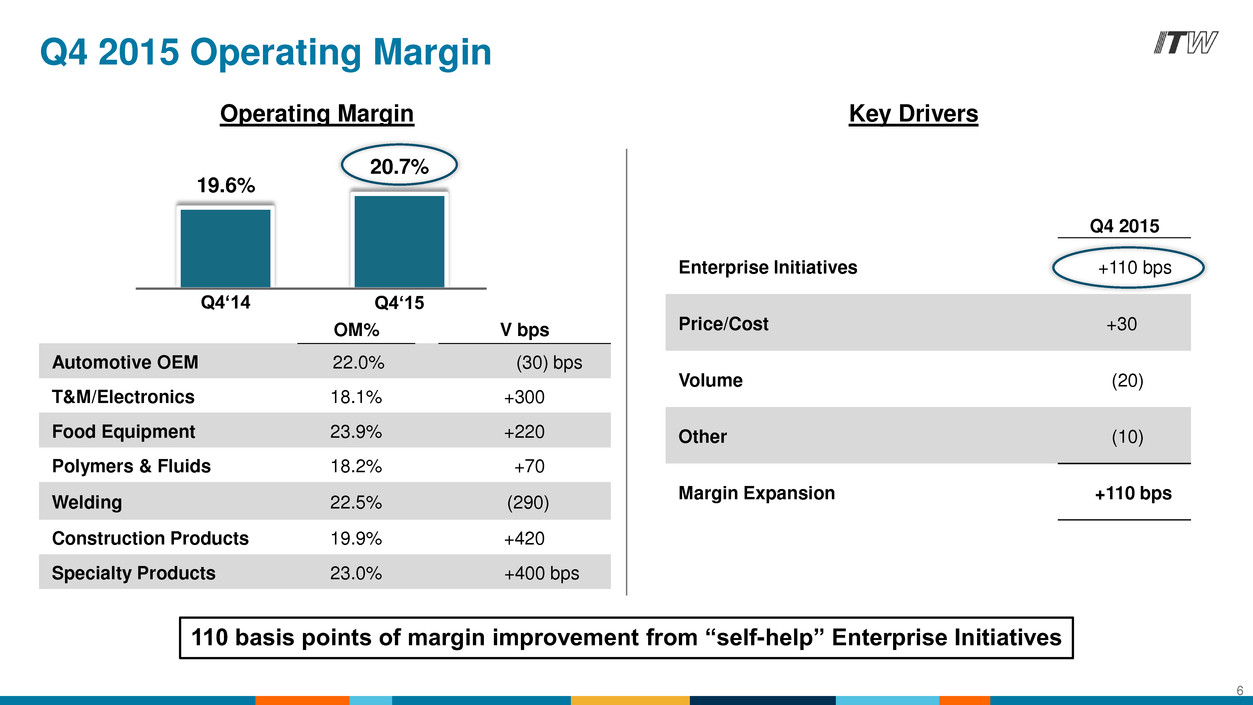
Q4 2015 Enterprise Initiatives +110 bps Price/Cost +30 Volume (20) Other (10) Margin Expansion +110 bps Operating Margin Q4‘15 20.7% Q4‘14 19.6% Key Drivers OM% V bps Automotive OEM 22.0% (30) bps T&M/Electronics 18.1% +300 Food Equipment 23.9% +220 Polymers & Fluids 18.2% +70 Welding 22.5% (290) Construction Products 19.9% +420 Specialty Products 23.0% +400 bps Q4 2015 Operating Margin 6 110 basis points of margin improvement from “self-help” Enterprise Initiatives
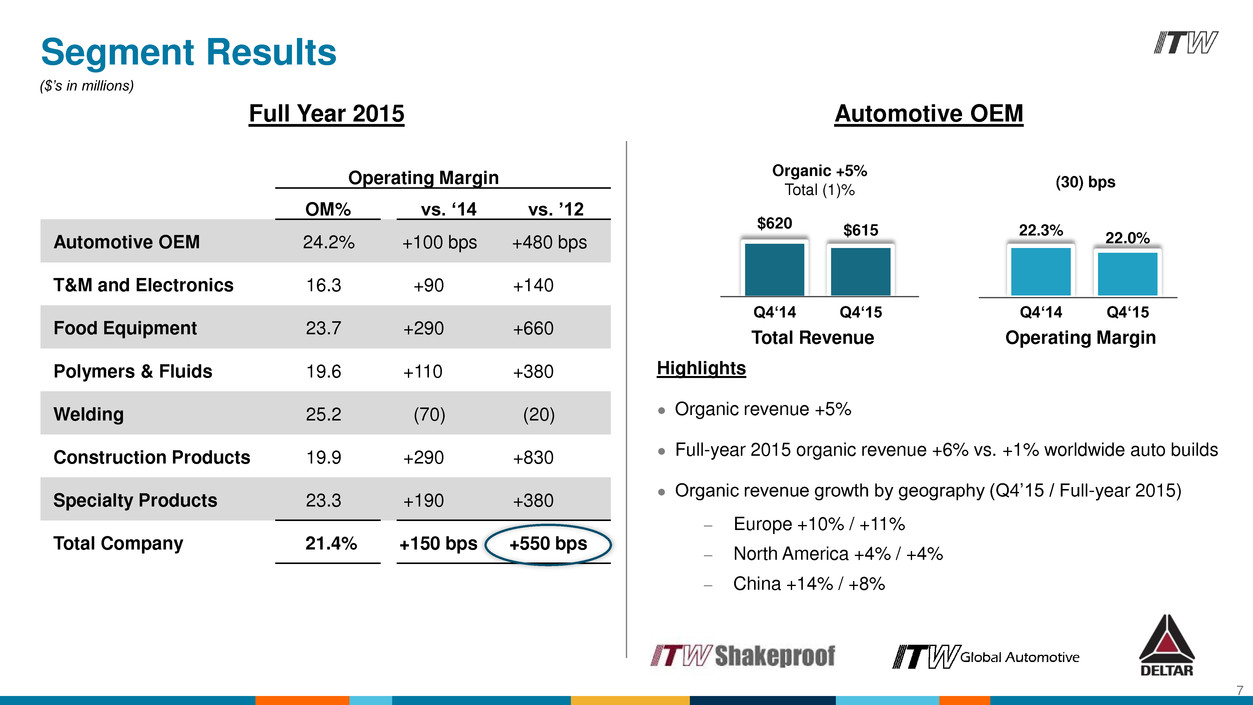
Full Year 2015 Automotive OEM Organic +5% Total (1)% (30) bps $620 $615 Q4‘14 Q4‘15 Total Revenue 22.0% Operating Margin Segment Results Highlights ● Organic revenue +5% ● Full-year 2015 organic revenue +6% vs. +1% worldwide auto builds ● Organic revenue growth by geography (Q4’15 / Full-year 2015) – Europe +10% / +11% – North America +4% / +4% – China +14% / +8% 22.3% ($’s in millions) Q4‘14 Q4‘15 7 Operating Margin OM% vs. ‘14 vs. ’12 Automotive OEM 24.2% +100 bps +480 bps T&M and Electronics 16.3 +90 +140 Food Equipment 23.7 +290 +660 Polymers & Fluids 19.6 +110 +380 Welding 25.2 (70) (20) Construction Products 19.9 +290 +830 Specialty Products 23.3 +190 +380 Total Company 21.4% +150 bps +550 bps
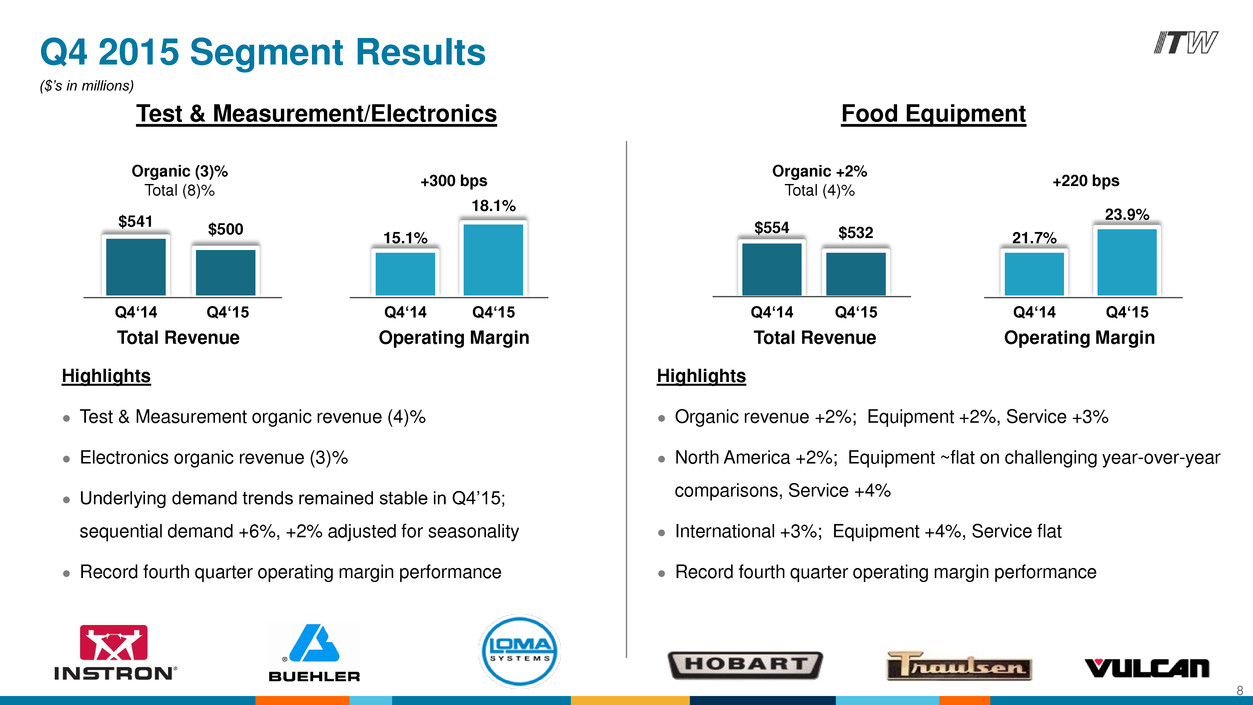
Food Equipment Q4 2015 Segment Results Highlights ● Test & Measurement organic revenue (4)% ● Electronics organic revenue (3)% ● Underlying demand trends remained stable in Q4’15; sequential demand +6%, +2% adjusted for seasonality ● Record fourth quarter operating margin performance Highlights ● Organic revenue +2%; Equipment +2%, Service +3% ● North America +2%; Equipment ~flat on challenging year-over-year comparisons, Service +4% ● International +3%; Equipment +4%, Service flat ● Record fourth quarter operating margin performance Test & Measurement/Electronics $500 $541 18.1% 15.1% Organic (3)% Total (8)% +300 bps $532 $554 Organic +2% Total (4)% +220 bps Total Revenue Operating Margin Q4‘14 Total Revenue Operating Margin Q4‘14 Q4‘14 21.7% Q4‘14 Q4‘15 23.9% Q4‘15 Q4‘15 8 ($’s in millions) Q4‘15
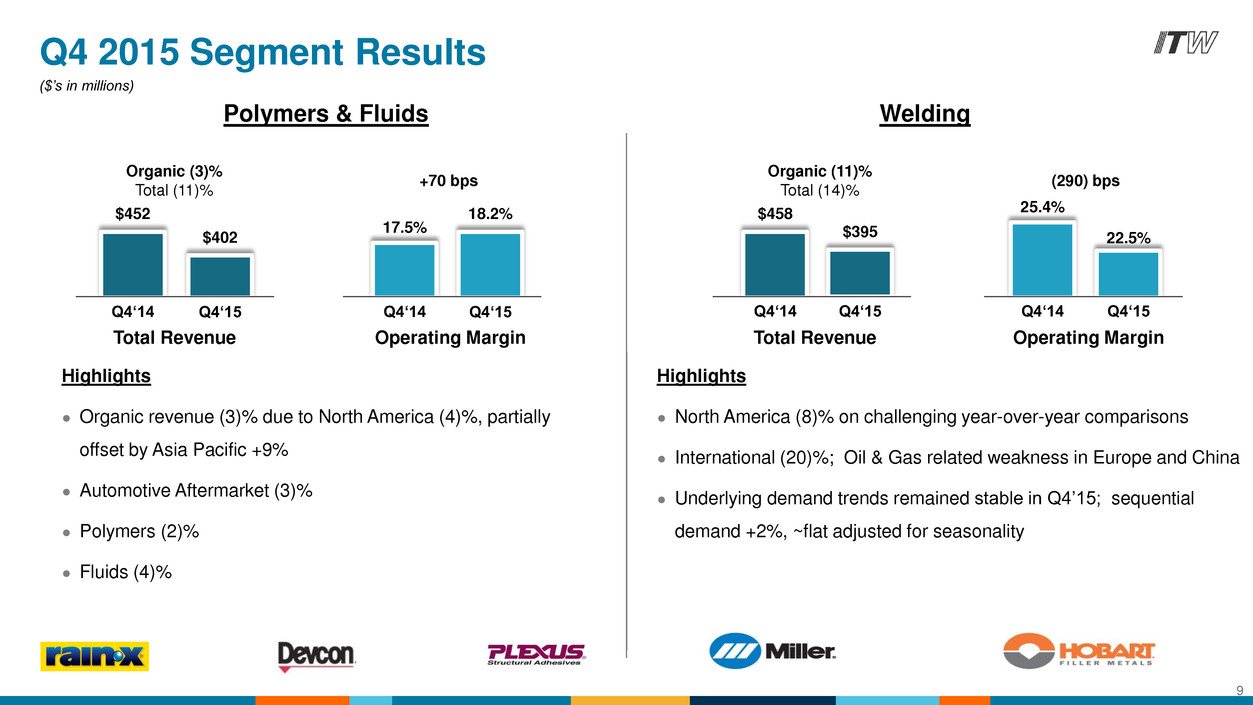
Highlights ● Organic revenue (3)% due to North America (4)%, partially offset by Asia Pacific +9% ● Automotive Aftermarket (3)% ● Polymers (2)% ● Fluids (4)% Highlights ● North America (8)% on challenging year-over-year comparisons ● International (20)%; Oil & Gas related weakness in Europe and China ● Underlying demand trends remained stable in Q4’15; sequential demand +2%, ~flat adjusted for seasonality $458 $395 22.5% 25.4% Organic (11)% Total (14)% (290) bps Welding Total Revenue Operating Margin Q4‘14 Q4‘14 Q4‘15 Q4‘15 Polymers & Fluids $452 17.5% 18.2% Organic (3)% Total (11)% +70 bps $402 Total Revenue Operating Margin Q4‘15 Q4‘15 Q4‘14 Q4‘14 Q4 2015 Segment Results 9 ($’s in millions)
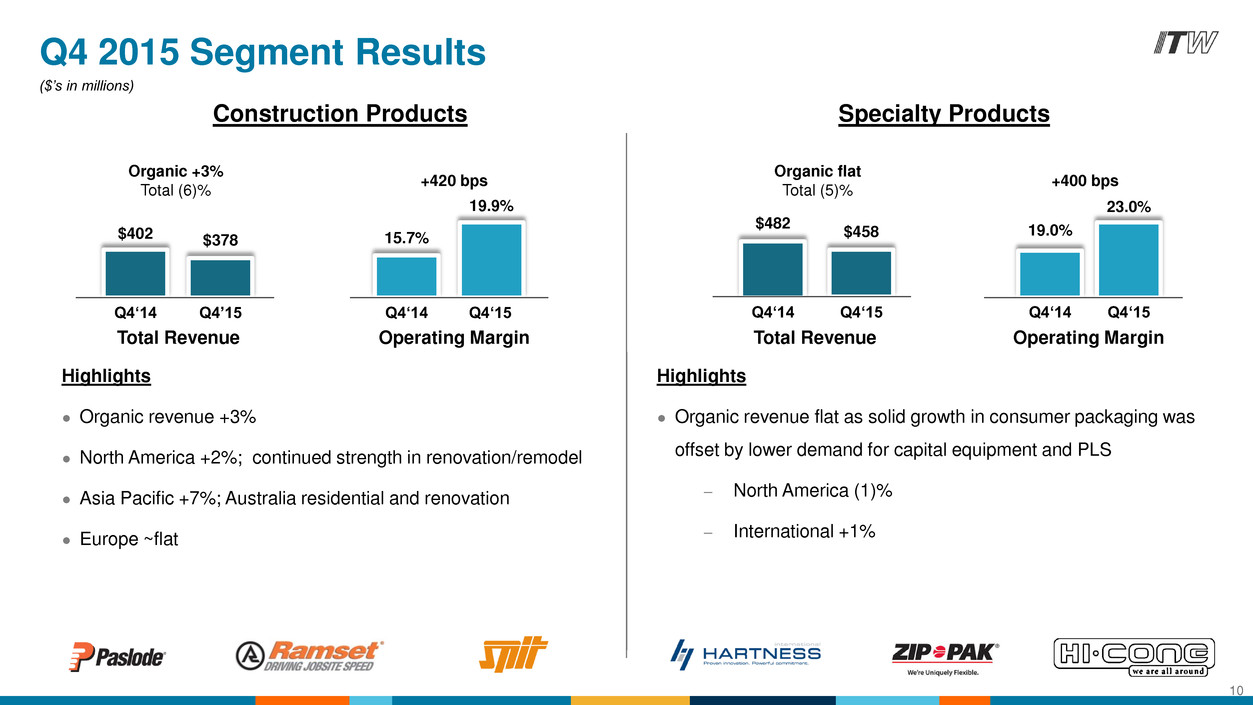
Highlights ● Organic revenue +3% ● North America +2%; continued strength in renovation/remodel ● Asia Pacific +7%; Australia residential and renovation ● Europe ~flat Highlights ● Organic revenue flat as solid growth in consumer packaging was offset by lower demand for capital equipment and PLS – North America (1)% – International +1% $378 $402 15.7% 19.9% Organic +3% Total (6)% +420 bps Construction Products $458 $482 19.0% 23.0% Organic flat Total (5)% +400 bps Specialty Products Total Revenue Operating Margin Total Revenue Operating Margin Q4‘14 Q4‘14 Q4‘15 Q4‘15 Q4‘15 Q4’15 Q4‘14 Q4‘14 Q4 2015 Segment Results 10 ($’s in millions)
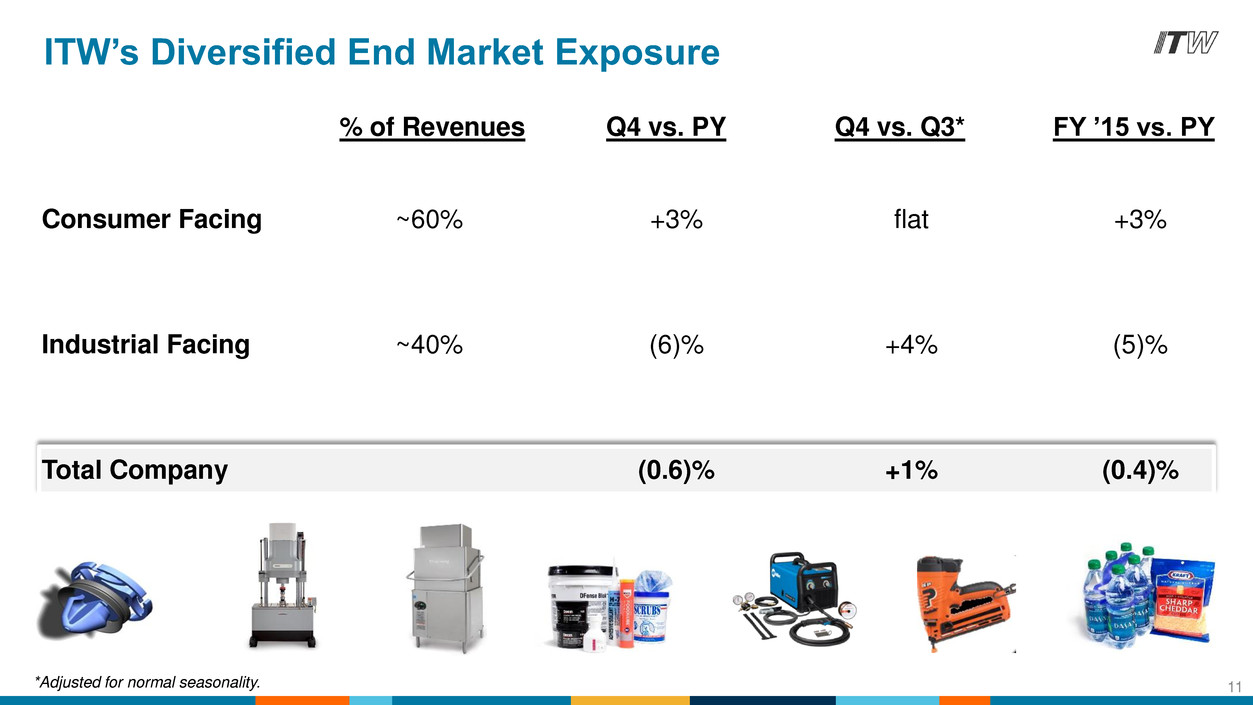
ITW’s Diversified End Market Exposure 11 Consumer Facing ~60% +3% flat +3% Industrial Facing ~40% (6)% +4% (5)% Total Company (0.6)% +1% (0.4)% % of Revenues Q4 vs. PY Q4 vs. Q3* FY ’15 vs. PY *Adjusted for normal seasonality.
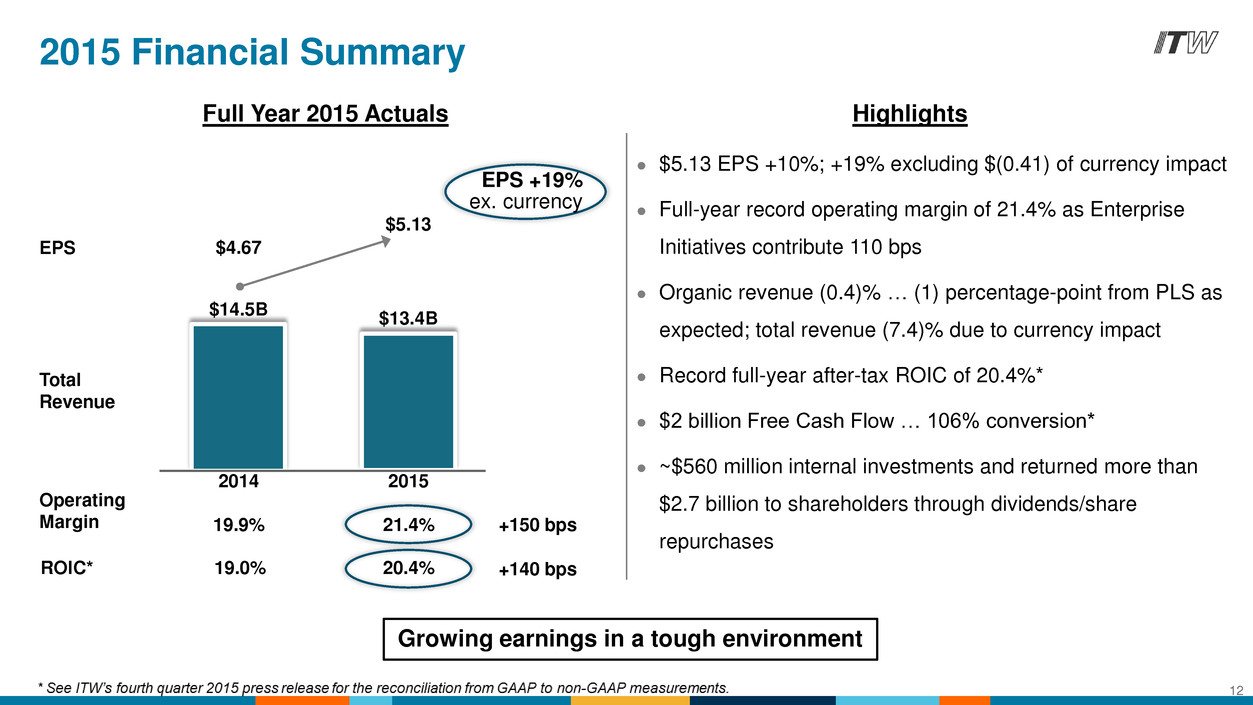
$13.4B $14.5B 2014 2015 Total Revenue $5.13 $4.67 EPS Operating Margin EPS +19% ex. currency 2015 Financial Summary Growing earnings in a tough environment 21.4% 19.9% +150 bps ROIC* 20.4% 19.0% +140 bps 12 Full Year 2015 Actuals Highlights ● $5.13 EPS +10%; +19% excluding $(0.41) of currency impact ● Full-year record operating margin of 21.4% as Enterprise Initiatives contribute 110 bps ● Organic revenue (0.4)% … (1) percentage-point from PLS as expected; total revenue (7.4)% due to currency impact ● Record full-year after-tax ROIC of 20.4%* ● $2 billion Free Cash Flow … 106% conversion* ● ~$560 million internal investments and returned more than $2.7 billion to shareholders through dividends/share repurchases
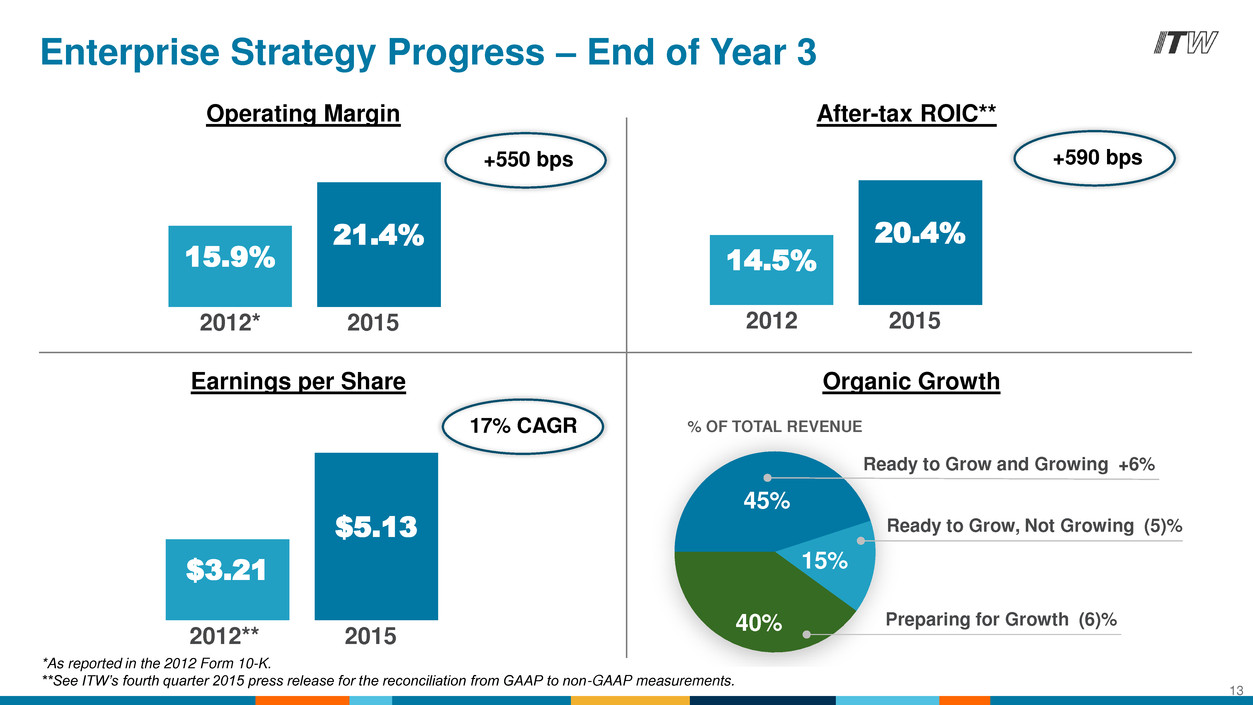
Enterprise Strategy Progress – End of Year 3 13 Operating Margin After-tax ROIC** Earnings per Share Organic Growth 2012* 21.4% 15.9% 2015 +550 bps 2012 20.4% 14.5% 2015 +590 bps 2012** $5.13 $3.21 2015 17% CAGR 45% 15% 40% % OF TOTAL REVENUE Ready to Grow and Growing +6% Ready to Grow, Not Growing (5)% Preparing for Growth (6)% *As reported in the 2012 Form 10-K. **See ITW’s fourth quarter 2015 press release for the reconciliation from GAAP to non-GAAP measurements.
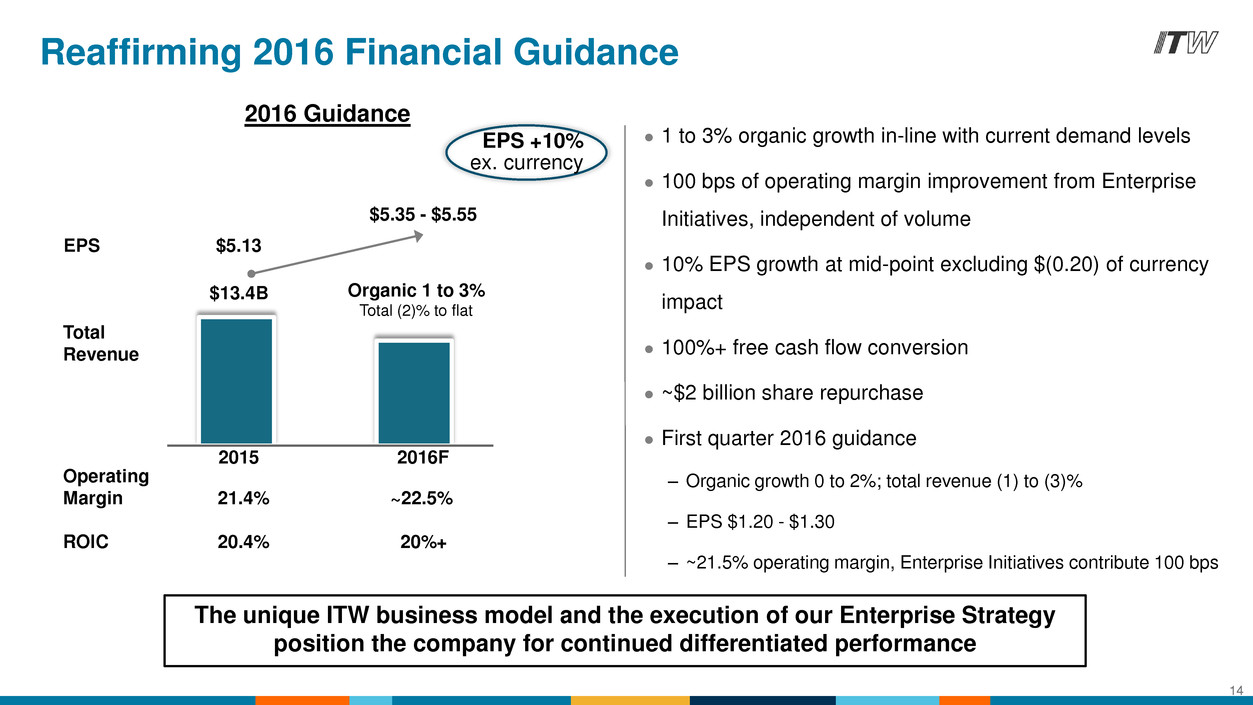
Reaffirming 2016 Financial Guidance 2016 Guidance EPS $5.13 $13.4B 2015 2016F $5.35 - $5.55 Total Revenue Organic 1 to 3% Total (2)% to flat 14 The unique ITW business model and the execution of our Enterprise Strategy position the company for continued differentiated performance ● 1 to 3% organic growth in-line with current demand levels ● 100 bps of operating margin improvement from Enterprise Initiatives, independent of volume ● 10% EPS growth at mid-point excluding $(0.20) of currency impact ● 100%+ free cash flow conversion ● ~$2 billion share repurchase ● First quarter 2016 guidance – Organic growth 0 to 2%; total revenue (1) to (3)% – EPS $1.20 - $1.30 – ~21.5% operating margin, Enterprise Initiatives contribute 100 bps Operating Margin 21.4% ~22.5% ROIC 20.4% 20%+ EPS +10% ex. currency
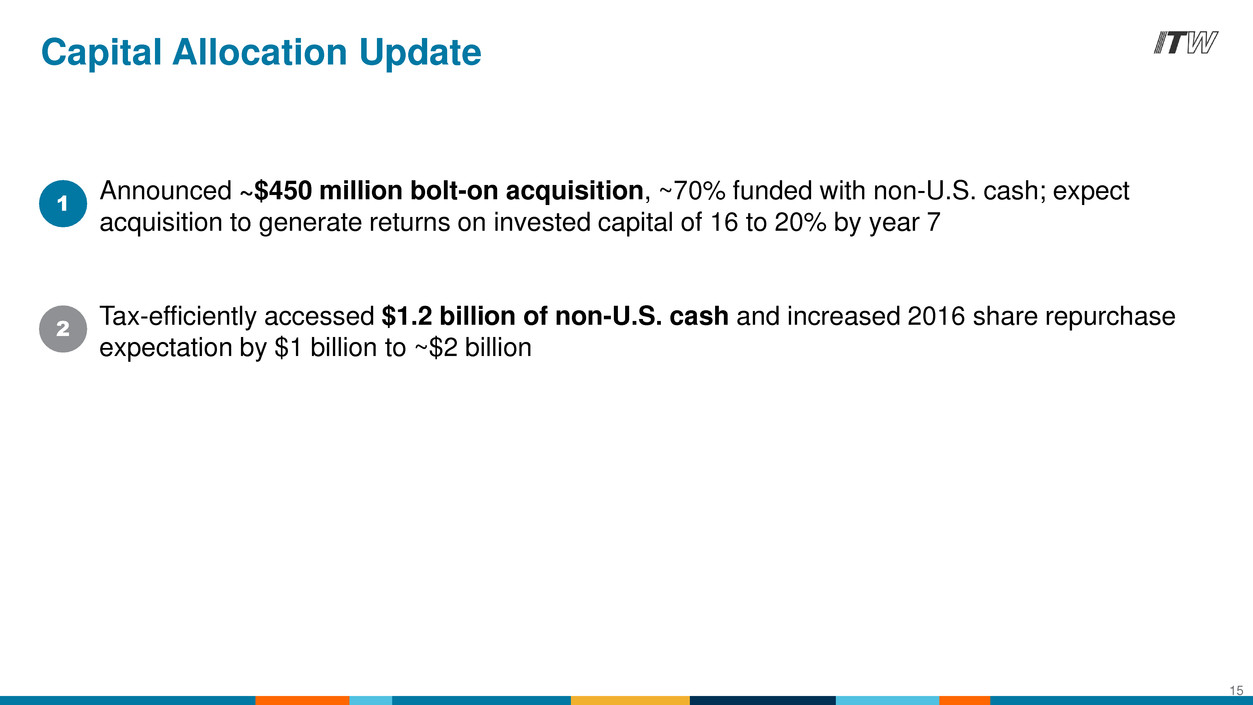
Capital Allocation Update 15 Announced ~$450 million bolt-on acquisition, ~70% funded with non-U.S. cash; expect acquisition to generate returns on invested capital of 16 to 20% by year 7 Tax-efficiently accessed $1.2 billion of non-U.S. cash and increased 2016 share repurchase expectation by $1 billion to ~$2 billion 1 2
ITW to Acquire Engineered Fasteners and Components from ZF TRW
Acquisition of Engineered Fasteners & Components (EF&C) from ZF TRW ITW Automotive OEM segment: – Highly focused niche supplier of value-added solutions to automotive OEM’s/tier suppliers – $2.5 billion revenues in 2015; 8% organic growth CAGR since 2012 – Attractive long-term growth fundamentals within ITW’s niche positioning – Proven strategies in place to drive significant additional growth in ITW’s global content per vehicle over the next five years 17 ITW’s Automotive OEM segment has grown faster than global auto builds by an average of 400 basis points since 2012
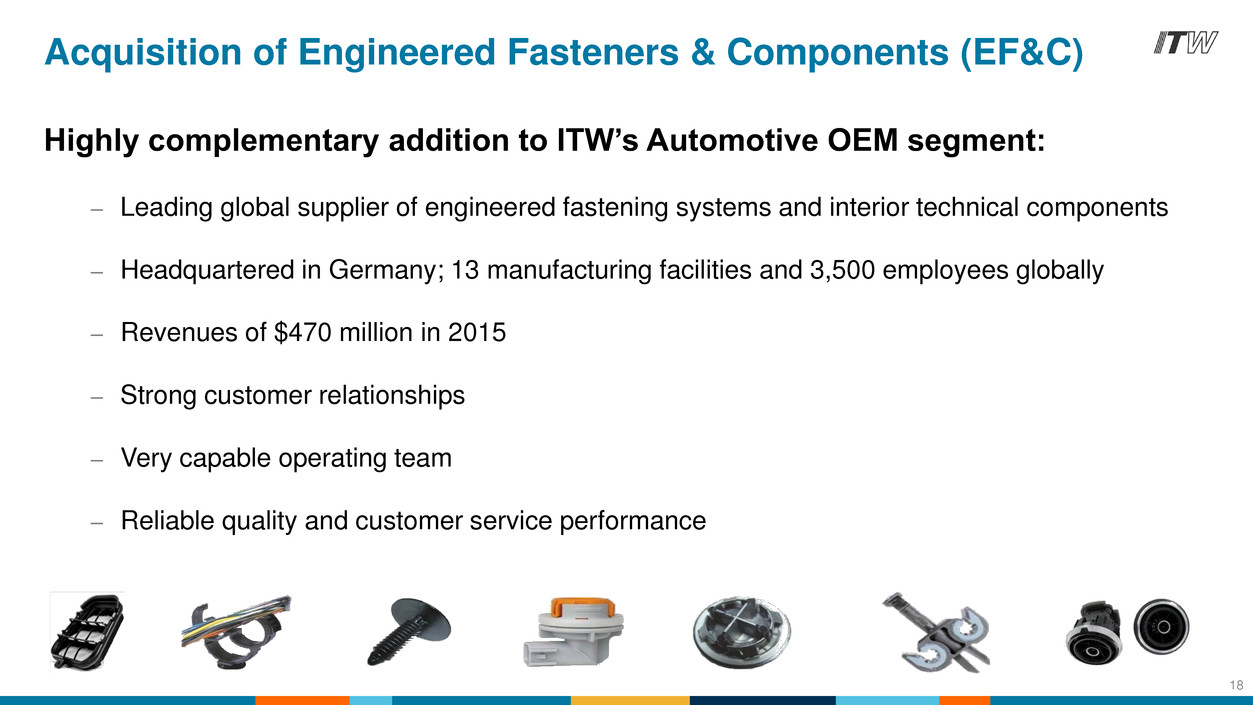
Acquisition of Engineered Fasteners & Components (EF&C) Highly complementary addition to ITW’s Automotive OEM segment: – Leading global supplier of engineered fastening systems and interior technical components – Headquartered in Germany; 13 manufacturing facilities and 3,500 employees globally – Revenues of $470 million in 2015 – Strong customer relationships – Very capable operating team – Reliable quality and customer service performance 18
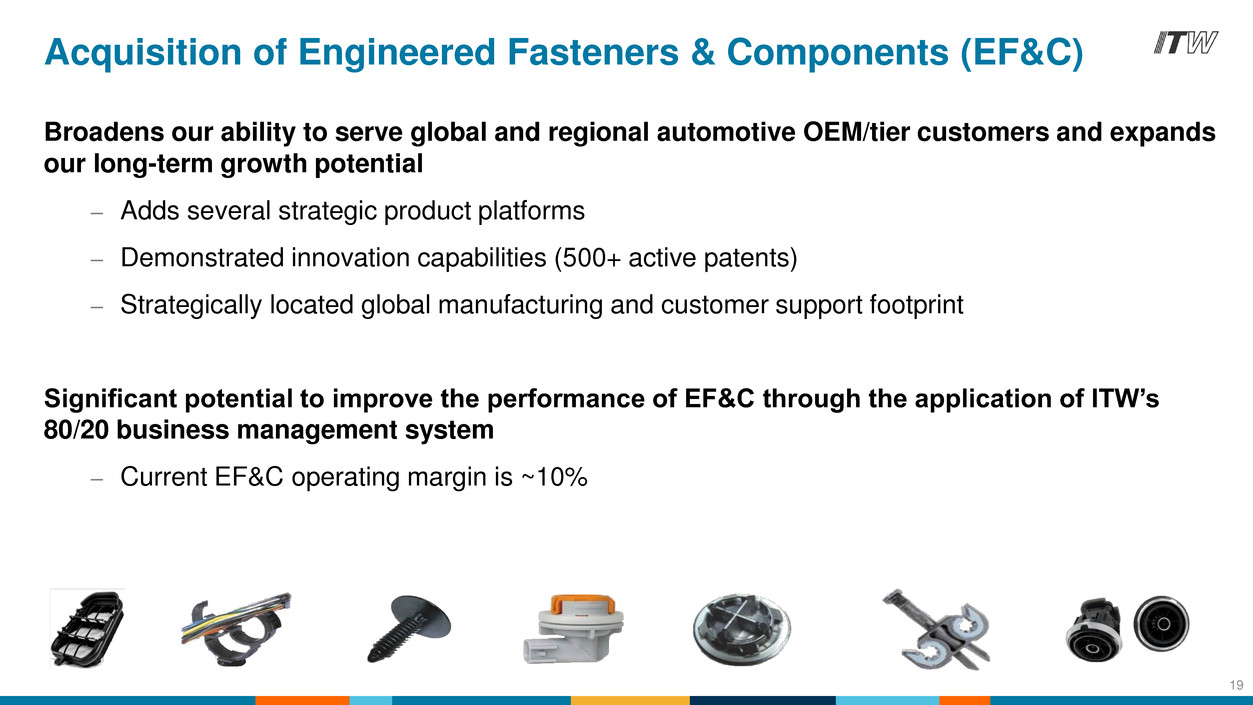
Acquisition of Engineered Fasteners & Components (EF&C) Broadens our ability to serve global and regional automotive OEM/tier customers and expands our long-term growth potential – Adds several strategic product platforms – Demonstrated innovation capabilities (500+ active patents) – Strategically located global manufacturing and customer support footprint Significant potential to improve the performance of EF&C through the application of ITW’s 80/20 business management system – Current EF&C operating margin is ~10% 19
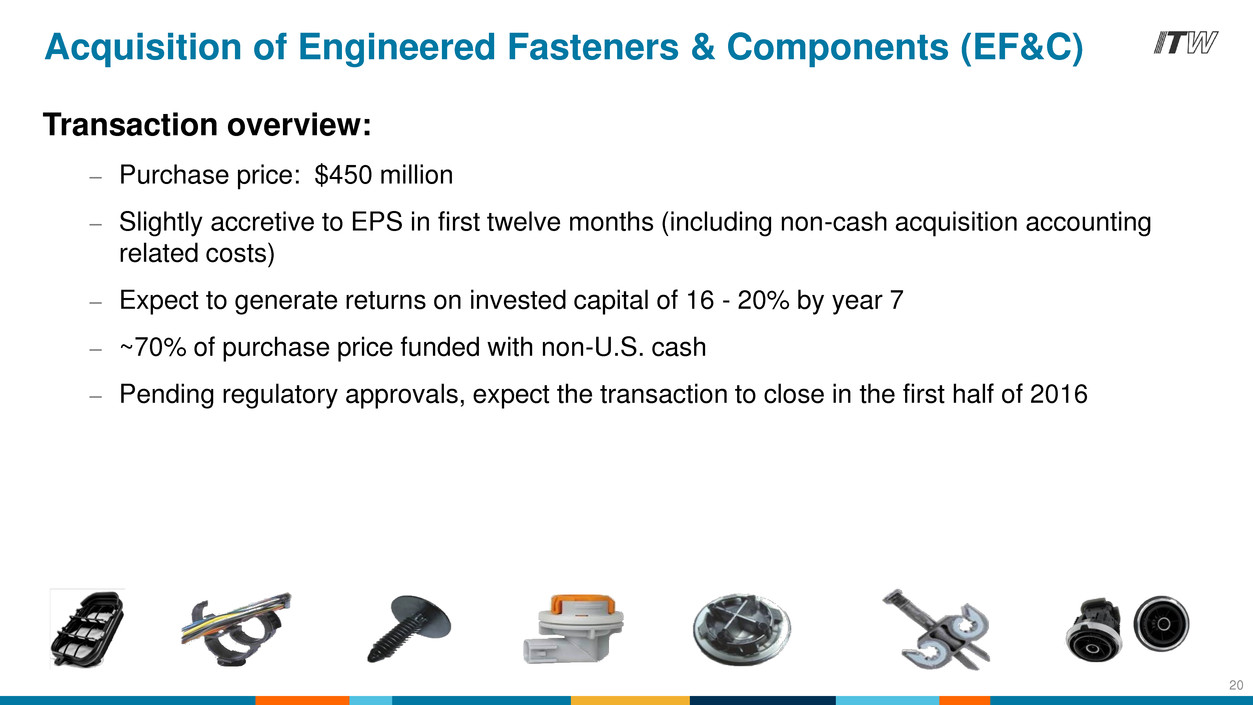
Acquisition of Engineered Fasteners & Components (EF&C) Transaction overview: – Purchase price: $450 million – Slightly accretive to EPS in first twelve months (including non-cash acquisition accounting related costs) – Expect to generate returns on invested capital of 16 - 20% by year 7 – ~70% of purchase price funded with non-U.S. cash – Pending regulatory approvals, expect the transaction to close in the first half of 2016 20
Q&A
