Attached files
| file | filename |
|---|---|
| 8-K - 8-K - Great Western Bancorp, Inc. | gwb-20151231x8xkxearnings.htm |
| EX-99.1 - EXHIBIT 99.1 - Great Western Bancorp, Inc. | gwb-20151231xerxex991.htm |

Earnings Release | January 27, 2016

About GWB 2 Company Snapshot Stock Performance Strong Earnings Results Market Presence • Business bank with unique agribusiness expertise • 7th largest farm lender bank in the U.S. as of September 30, 2015 (1) • 158 banking branches across 7 states • Announced a transaction to acquire HF Financial Corp. and its bank, Home Federal Bank, on Nov. 30, 2015: • Expected close in calendar 2Q 2016 and pro- forma entity projected to have $11.3 billion total assets and locations in 9 states Stock Performance 12/31/14 – 12/31/15: • Price Range: $19.76 – 31.13 • Avg. Close: $24.77 • 12-month Price Increase: 27.3% (1) Source: American Bankers Association. (2) Efficiency ratio is a non-GAAP measure. See appendix for reconciliation. (2) Great Western Bank Branches Home Federal Bank Branches

• Net charge-offs for the quarter were negligible ($0.8 million recoveries and $0.7 million charge- offs) and the ratio of ALLL to total loans increased to 0.81% • Loans graded “Substandard” increased by 25.2% compared to September 30, 2015, while nonaccrual loans decreased by 20.4% and “Watch” loans decreased 3.8% • Management remains comfortable with secondary sources of repayment and overall ALLL levels Executing on Strategy Focused Business Banking Franchise with Agribusiness Expertise • Loan balances increased by $205.5 million, a 2.8% increase compared to September 30, 2015 • Lending growth focused in Ag and CRE portfolio segments • Deposit balances increased by $275.6 million or 3.7%, with deposit growth balanced across business and consumer accounts Strong Profitability and Growth Driven by a Highly Efficient Operating Model • EPS of $0.55 for the quarter compared to $0.46 for the same quarter in FY15 • Attractive profitability metrics continue: 1.23% ROAA and 16.2% ROATCE(1) for the quarter • Efficiency ratio(1) of 45.1% for the quarter compared to 48.5% for the same quarter of FY15 Risk Management Driving Strong Credit Quality Strong Capital Generation and Attractive Dividend • All key regulatory capital ratios remained stable or increased slightly compared to September 30, 2015 including 10.9% tier 1 capital and 12.2% total capital • Quarterly dividend of $0.14 per share announced January 27, 2016; payable February 23 to stockholders of record as of the close of business on February 11 (1) This is a non-GAAP measure. See appendix for reconciliation. 3

(1) Chart excludes changes related to loans and derivatives at fair value which netted $(5.5) million for the quarter. Dollars in thousands. (2) Adjusted NIM (FTE) is a non-GAAP measure. See appendix for reconciliations. Revenue 4 Revenue Highlights Net Interest Income ($MM) and NIM NIM Analysis Noninterest Income (1) • Net interest income (FTE) increased by 4% compared to 1QFY15 driven primarily by higher loan interest income and lower interest expense on deposits • Sequentially, reported NIM remained flat while adjusted NIM (FTE)(2) increased by 1 basis point; both measures higher than 1QFY15 because of higher cash balances in that period related to NAB’s IPO proceeds on deposit • Increases in commercial deposit service charges, interchange and other fee revenue sources offset declining OD/NSF revenue (down $0.6 million compared to 1QFY15) (2) +4% QoQ
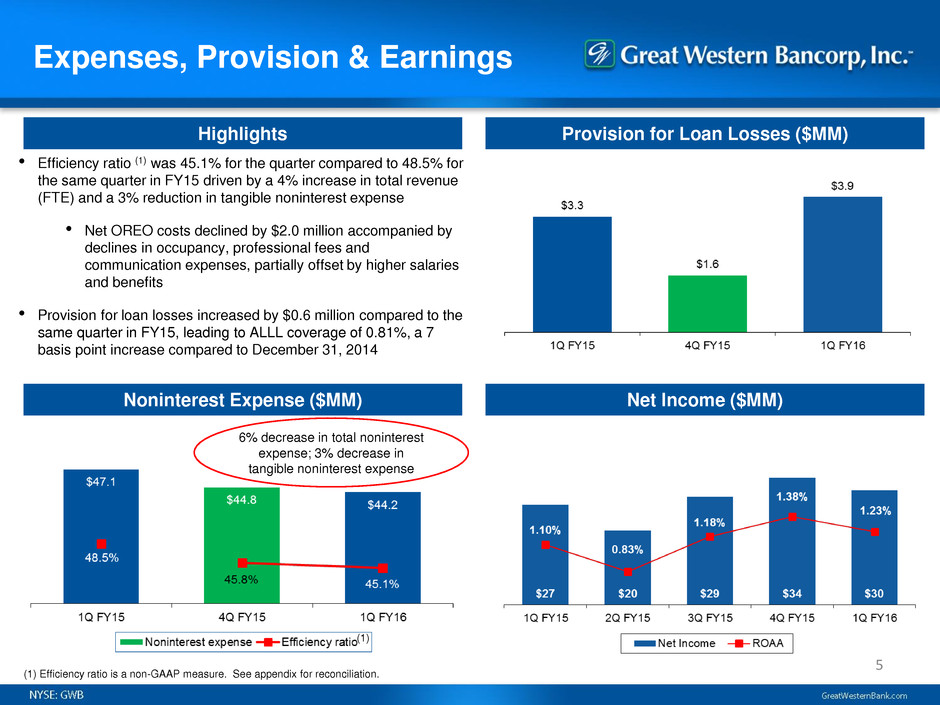
Expenses, Provision & Earnings 5 Highlights Provision for Loan Losses ($MM) Noninterest Expense ($MM) Net Income ($MM) • Efficiency ratio (1) was 45.1% for the quarter compared to 48.5% for the same quarter in FY15 driven by a 4% increase in total revenue (FTE) and a 3% reduction in tangible noninterest expense • Net OREO costs declined by $2.0 million accompanied by declines in occupancy, professional fees and communication expenses, partially offset by higher salaries and benefits • Provision for loan losses increased by $0.6 million compared to the same quarter in FY15, leading to ALLL coverage of 0.81%, a 7 basis point increase compared to December 31, 2014 6% decrease in total noninterest expense; 3% decrease in tangible noninterest expense (1) Efficiency ratio is a non-GAAP measure. See appendix for reconciliation. (1)

Balance Sheet Overview 6 Balance Sheet Highlights Total Loans ($MM) Deposits ($MM) Capital • Total loans grew 2.8% during the quarter, focused in ag and CRE • Some ag growth results from customers’ tax planning and is expected to reverse in 2QFY16 • CRE growth primarily focused in commercial construction • Deposits grew 3.7% with growth balanced across commercial and consumer accounts • All key regulatory capital ratios remained stable or increased slightly compared to September 30, 2015 driven by strong earnings, net of dividends, and partially offset by higher RWAs due to lending growth 2.8% FYTD growth 3.7% FYTD growth (1) Cost of Deposits annualized for 1Q FY16. (2) TCE / TA is a non-GAAP measure. See appendix for reconciliation. (2) (1)

Asset Quality 7 Highlights Net Charge-offs Reserves / NALs Strong Credit Quality • Net charge-offs for the quarter were negligible ($0.8 million recoveries and $0.7 million charge-offs) • Ratio of ALLL / total loans was 0.81% at December 31, 2015 compared to 0.78% at September 30, 2015 and 0.74% at December 31, 2014 • Nonaccrual loans declined by $13.9 million compared to September 30, 2015 driven by payments (vs. charge-offs) • Loans graded “Substandard” increased but management remains comfortable with workout strategies in place, secondary sources of repayment and overall ALLL levels
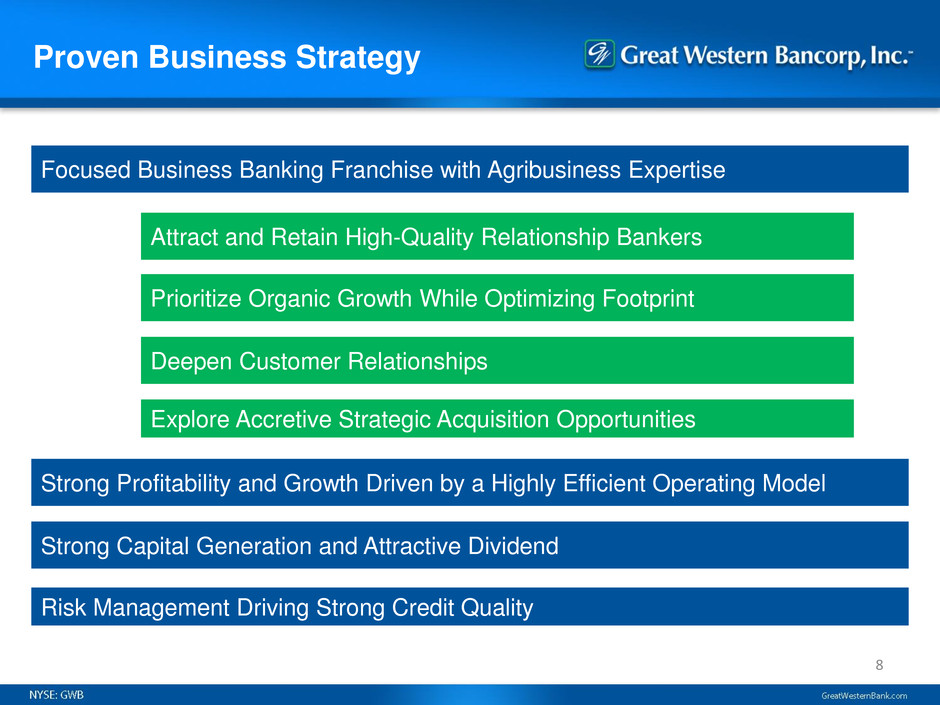
Proven Business Strategy 8 Focused Business Banking Franchise with Agribusiness Expertise Risk Management Driving Strong Credit Quality Attract and Retain High-Quality Relationship Bankers Prioritize Organic Growth While Optimizing Footprint Deepen Customer Relationships Strong Profitability and Growth Driven by a Highly Efficient Operating Model Strong Capital Generation and Attractive Dividend Explore Accretive Strategic Acquisition Opportunities

Forward-Looking Statements: This presentation contains forward-looking statements within the meaning of the Private Securities Litigation Reform Act of 1995, including forward-looking statements about our proposed acquisition of HF Financial Corp. and certain anticipated benefits of the merger and our expected timeline for completing the transaction. Statements about our expectations, beliefs, plans, predictions, forecasts, objectives, assumptions or future events or performance are not historical facts and may be forward-looking. These statements are often, but not always, made through the use of words or phrases such as “anticipates,” “believes,” “can,” “could,” “may,” “predicts,” “potential,” “should,” “will,” “estimate,” “plans,” “projects,” “continuing,” “ongoing,” “expects,” “intends” and similar words or phrases. Accordingly, these statements are only predictions and involve estimates, known and unknown risks, assumptions and uncertainties that could cause actual results to differ materially from those expressed. All forward-looking statements are necessarily only estimates of future results, and there can be no assurance that actual results will not differ materially from expectations, and, therefore, you are cautioned not to place undue reliance on such statements. Any forward-looking statements are qualified in their entirety by reference to the factors discussed in the sections titled “Item 1A. Risk Factors” and “Cautionary Note Regarding Forward-Looking Statements” in our Annual Report on Form 10-K for the fiscal year ended September 30, 2015, including the Risk Factor related to risks associated with completed and potential acquisitions, all of which apply to our pending acquisition of HF Financial Corp. Further, any forward-looking statement speaks only as of the date on which it is made, and we undertake no obligation to update any forward-looking statement to reflect events or circumstances after the date on which the statement is made or to reflect the occurrence of unanticipated events. Disclosures 9
Important Additional Information and Where to Find It: In connection with the Agreement and Plan of Merger by and between Great Western and HF Financial, Great Western will file with the Securities and Exchange Commission (“SEC”) a Registration Statement on Form S-4 that will contain a proxy statement of HF Financial and a prospectus of Great Western, as well as other relevant documents concerning the proposed transaction. STOCKHOLDERS OF HF FINANCIAL ARE URGED TO READ THE REGISTRATION STATEMENT AND THE PROXY STATEMENT/PROSPECTUS REGARDING THE PROPOSED TRANSACTION WHEN IT BECOMES AVAILABLE AND ANY OTHER RELEVANT DOCUMENTS FILED WITH THE SEC, AS WELL AS ANY AMENDMENTS OR SUPPLEMENTS TO THOSE DOCUMENTS, BECAUSE THEY WILL CONTAIN IMPORTANT INFORMATION ABOUT GREAT WESTERN, HF FINANCIAL AND THE PROPOSED TRANSACTION. The Registration Statement, including the proxy statement/prospectus, and other relevant materials (when they become available), and any other documents filed by Great Western and HF Financial with the SEC, may be obtained free of charge at the SEC’s website at www.sec.gov. Documents filed by Great Western with the SEC, including the Registration Statement, may also be obtained free of charge from Great Western’s website (www.greatwesternbank.com) under the “Investor Relations” heading and the “SEC Filings” sub-heading, or by directing a request to Great Western’s Investor Relations contact, David Hinderaker at david.hinderaker@greatwesternbank.com. Documents filed by HF Financial with the SEC may also be obtained free of charge from HF Financial's website (www.homefederal.com) under the “Investor Relations” heading and the “SEC Filings” sub-heading, or by directing a request to HF Financial's Investor Relations contact, Pamela F. Russo at prusso@homefederal.com. Great Western, HF Financial, and certain of their respective directors and executive officers may be deemed to be participants in the solicitation of proxies from the stockholders of HF Financial, in connection with the proposed merger transaction. Information about the directors and executive officers of Great Western is available in Great Western’s definitive proxy statement for its 2016 annual meeting of stockholders as filed with the SEC on January 4, 2016, and other documents subsequently filed by Great Western with the SEC. Information about the directors and executive officers of HF Financial, is available in HF Financial’s definitive proxy statement, for its 2015 annual meeting of stockholders as previously filed with the SEC on October 16, 2015. Other information regarding the participants and a description of their direct and indirect interests, by security holdings or otherwise, will be contained in the Registration Statement and including the proxy statement/prospectus, and other relevant documents regarding the transaction filed with the SEC when they become available. Explanatory Note: In this presentation, all financial information presented refers to the financial results of Great Western Bancorp, Inc. combined with those of its predecessor, Great Western Bancorporation, Inc. Disclosures 10

No Offer or Solicitation: This communication is not a solicitation of a proxy from any stockholder of HF Financial and is not a substitute for the proxy statement/prospectus that will be sent to the stockholders of HF Financial in connection with the proposed merger. This communication is for informational purposes only and is neither an offer to purchase, nor a solicitation of an offer to sell, any securities in any jurisdiction pursuant to the proposed transaction or otherwise, nor shall there be any sale, issuance or transfer of securities in any jurisdiction in contravention of any applicable law. No offer of securities shall be made except by means of a prospectus meeting the requirements of Section 10 of the Securities Act of 1933. Non-GAAP Financial Measures: This presentation contains non-GAAP measures which our management relies on in making financial and operational decisions about our business and which exclude certain items that we do not consider reflective of our business performance. We believe that the presentation of these measures provides investors with greater transparency and supplemental data relating to our financial condition and results of operations. These non-GAAP measures should be considered in context with our GAAP results. A reconciliation of these non- GAAP measures appears in our earnings release dated January 27, 2016 and in Appendix 1 to this presentation. Our earnings release and this presentation are available in the Investor Relations section of our website at www.greatwesternbank.com. Our earnings release and this presentation are also available as part of our Current Report on Form 8-K filed with the SEC on January 27, 2016. Explanatory Note: In this presentation, all financial information presented refers to the financial results of Great Western Bancorp, Inc. combined with those of its predecessor, Great Western Bancorporation, Inc. Disclosures 11

Appendix 1 Non-GAAP Measures
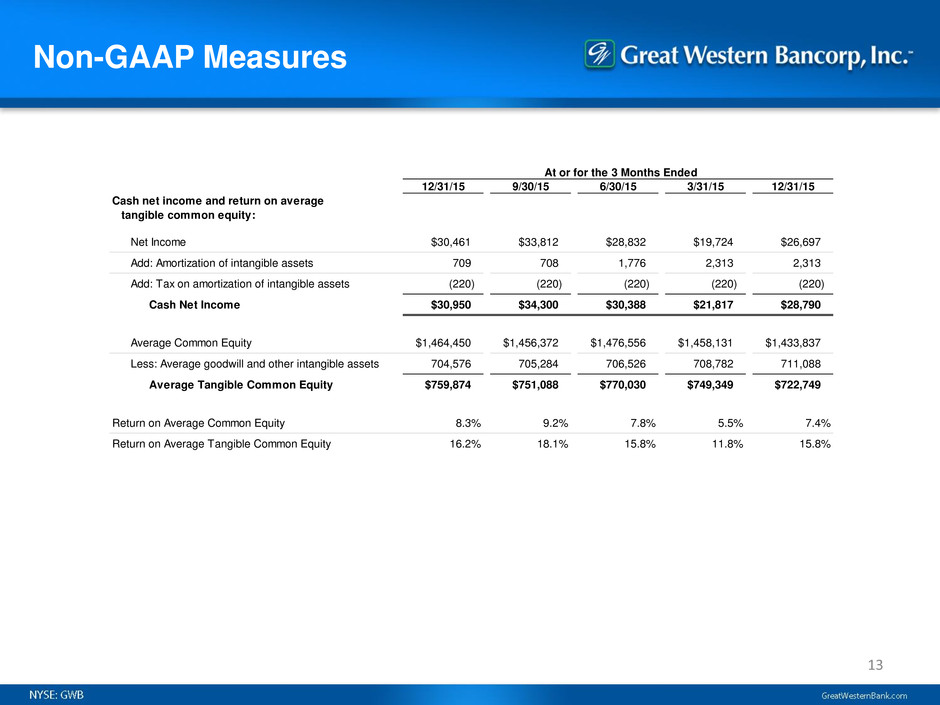
Non-GAAP Measures 13 At or for the 3 Months Ended 12/31/15 9/30/15 6/30/15 3/31/15 12/31/15 Cash net income and return on average tangible common equity: Net Income $30,461 $33,812 $28,832 $19,724 $26,697 Add: Amortization of intangible assets 709 708 1,776 2,313 2,313 Add: Tax on amortization of intangible assets (220) (220) (220) (220) (220) Cash Net Income $30,950 $34,300 $30,388 $21,817 $28,790 Average Common Equity $1,464,450 $1,456,372 $1,476,556 $1,458,131 $1,433,837 Less: Average goodwill and other intangible assets 704,576 705,284 706,526 708,782 711,088 Average Tangible Common Equity $759,874 $751,088 $770,030 $749,349 $722,749 Return on Average Common Equity 8.3% 9.2% 7.8% 5.5% 7.4% Return on Average Tangible Common Equity 16.2% 18.1% 15.8% 11.8% 15.8%
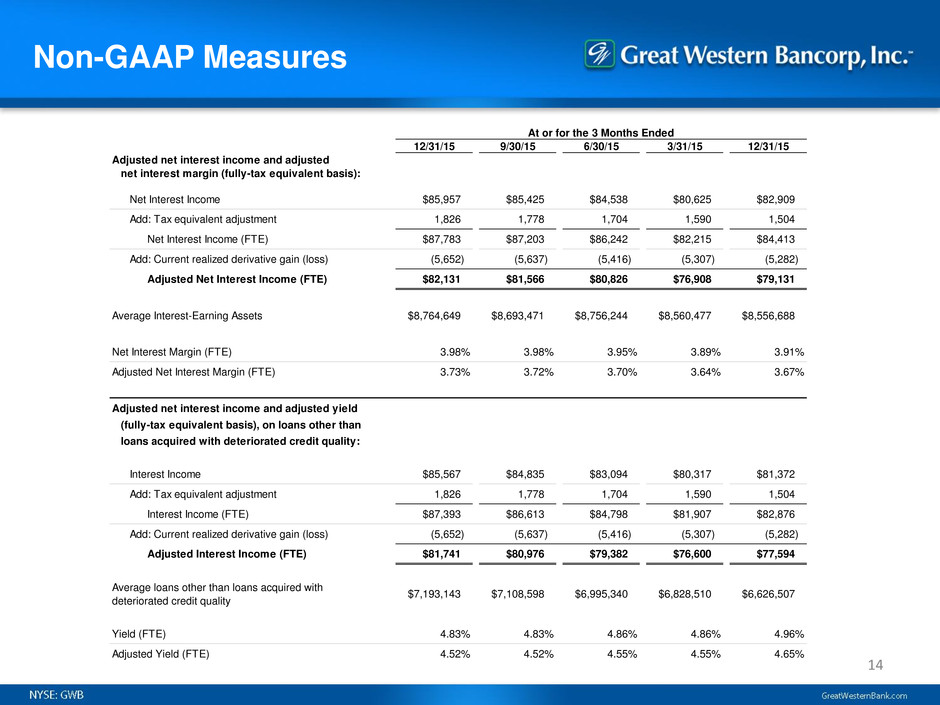
Non-GAAP Measures 14 At or for the 3 Months Ended 12/31/15 9/30/15 6/30/15 3/31/15 12/31/15 Adjusted net interest income and adjusted net interest margin (fully-tax equivalent basis): Net Interest Income $85,957 $85,425 $84,538 $80,625 $82,909 Add: Tax equivalent adjustment 1,826 1,778 1,704 1,590 1,504 Net Interest Income (FTE) $87,783 $87,203 $86,242 $82,215 $84,413 Add: Current realized derivative gain (loss) (5,652) (5,637) (5,416) (5,307) (5,282) Adjusted Net Interest Income (FTE) $82,131 $81,566 $80,826 $76,908 $79,131 Average Interest-Earning Assets $8,764,649 $8,693,471 $8,756,244 $8,560,477 $8,556,688 Net Interest Margin (FTE) 3.98% 3.98% 3.95% 3.89% 3.91% Adjusted Net Interest Margin (FTE) 3.73% 3.72% 3.70% 3.64% 3.67% Adjusted net interest income and adjusted yield (fully-tax equivalent basis), on loans other than loans acquired with deteriorated credit quality: Interest Income $85,567 $84,835 $83,094 $80,317 $81,372 Add: Tax equivalent adjustment 1,826 1,778 1,704 1,590 1,504 Interest Income (FTE) $87,393 $86,613 $84,798 $81,907 $82,876 Add: Current realized derivative gain (loss) (5,652) (5,637) (5,416) (5,307) (5,282) Adjusted Interest Income (FTE) $81,741 $80,976 $79,382 $76,600 $77,594 Average loans other than loans acquired with deteriorated credit quality $7,193,143 $7,108,598 $6,995,340 $6,828,510 $6,626,507 Yield (FTE) 4.83% 4.83% 4.86% 4.86% 4.96% Adjusted Yield (FTE) 4.52% 4.52% 4.55% 4.55% 4.65%

Non-GAAP Measures 15 At or for the 3 Months Ended 12/31/15 9/30/15 6/30/15 3/31/15 12/31/15 Efficiency Ratio: Total Revenue $94,601 $94,474 $94,543 $87,561 $90,809 Add: Tax equivalent adjustment 1,826 1,778 1,704 1,590 1,504 Total Revenue (FTE) $96,427 $96,252 $96,247 $89,151 $92,313 Noninterest Expense $44,220 $44,835 $46,430 $48,438 $47,091 Less: Amortization of intangible assets 709 708 1,776 2,313 2,313 Tangible Noninterest Expense $43,511 $44,127 $44,654 $46,125 $44,778 Efficiency Ratio 45.1% 45.8% 46.4% 51.7% 48.5% Tangible common equity and tangible common equity to assets: Total Stockholders' Equity $1,475,516 $1,459,346 $1,487,851 $1,469,552 $1,451,370 Less: Goodwill and other intangible assets 704,217 704,926 705,634 707,410 709,723 Tangible Common Equity $771,299 $754,420 $782,217 $762,142 $741,647 Total Assets $9,957,215 $9,798,654 $9,764,159 $9,781,645 $9,641,261 Less: Goodwill and other intangible assets 704,217 704,926 705,634 707,410 709,723 Tangible Assets $9,252,998 $9,093,728 $9,058,525 $9,074,235 $8,931,538 Tangible Common Equity to Tangible Assets 8.3% 8.3% 8.6% 8.4% 8.3%

Appendix 2 Accounting for Loans at FV and Related Derivatives

Loans at FV and Related Derivatives 17 Overview • For all loans with an original term greater than 5 years with a fixed rate to the customer, GWB has entered into equal and offsetting fixed-to-floating interest rate swaps with two US counterparties (prior to NAB’s divestiture NAB London was the counterparty; all swaps have been novated to a US counterparty) • Total size of the portfolio was $1.1 billion at December 31, 2015 • GWB has elected the Fair Value Option (ASC 825) on these loans and applies a similar treatment to the related derivatives: • Changes in the fair value of the loans and the derivatives and the current period realized cost (benefit) of the derivatives (i.e., the net pay fixed/receive floating settlement) are recorded in earnings through noninterest income • This differs significantly from most peers who have elected Hedge Accounting treatment • The historical election is irrevocable so the concept will be present for the foreseeable future in GWB’s financial statements even if different accounting elections are made on future originations • Management presents non-GAAP measures and is including the supplemental disclosures here to provide more clarity on the underlying economics Summary Net increase (decrease) in fair value of loans at fair value Net realized and unrealized gain (loss) on derivatives Net Relationship Notes Increase (decrease) in FV related to interest rates (15,090)$ 15,090$ -$ (1) Increas ( crease) in FV related to credit 189 - 189 (2) Cu r t period r alized cost of derivatives - (5,651) (5,651) (3) Subt tal, oans at FV and related derivatives (14,901)$ 9,439$ (5,462)$ (4) (1) (2) (3) (4) Equal and ffs tting each period. Changes in the FV of each financial asset and liability driven by current compared to contractual rates. Management records an adjustment for credit risk in noninterest income based on loss history for similar loans, adjusted for an assessment of existing market conditions for each loan segment. The FV adjustment related to credit is not included in the ALLL but loans are included in the ALLL coverage ratio denominator. Current period actual cost of fixed-to-float interest rate swaps. Within non-GAAP financial measures, management reclassifies this component to interest income, resulting in adjusted interest income, adjusted net interest income and adjusted NIM, reflecting the underlying economics of the transactions. All else equal, this drag on earnings will reduce as short-term LIBOR rates increase. While US GAAP mandates the presentation of these items in noninterest income, management belives the residual net amount economically represents the net credit exposure of this segment of the portfolio - presented as a "credit-related charge" in the earnings release and elsewhere (see note (2)) - and the current period derivative cost which should be analyzed relative to gross interest income received from the loan customers (see note (3)) as presented in non-GAAP measures. Income Statement Line Item:
