Attached files
| file | filename |
|---|---|
| 8-K - 8-K - Zayo Group Holdings, Inc. | a16-2014_18k.htm |
Exhibit 99.1
Supplemental Earnings information FY 2016 Q1 Zayo Group Holdings, Inc. Additional Segment Financials

Zayo Dark Fiber Solutions Segment Financial Data 1 Pro-forma annualized growth for revenue and Adjusted EBITDA are calculated as if the acquisitions occurred on the first day of the quarter preceding the respective quarter in which the acquisitions closed Financial Data
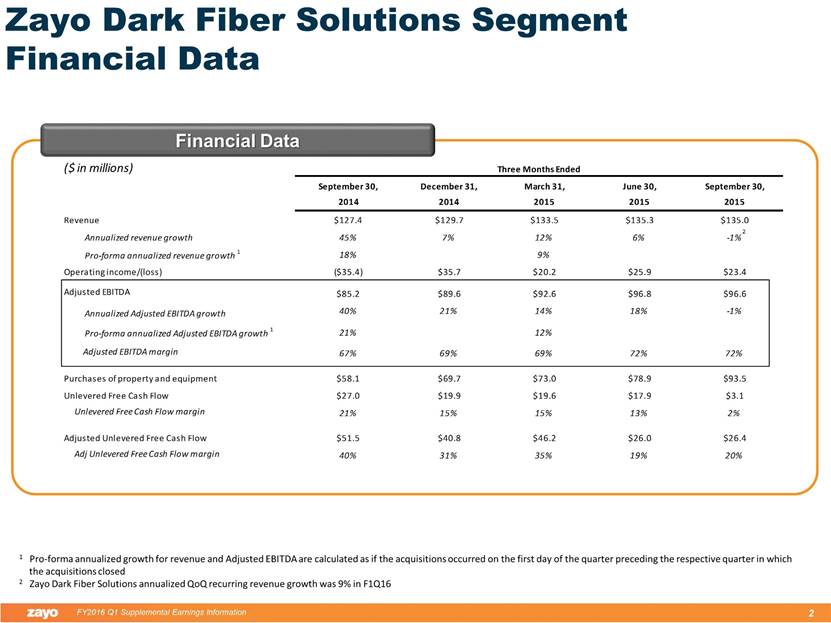
millions Revenue Stratification Estimated Capital and Upfront Expenditures associated with Net New Sales (Bookings) less Upfront Charges millions Zayo Dark Fiber Solutions Segment Revenue Stratification & Operational Data thousands Churn Processed Gross Installations MRR and MAR MRR and MAR thousands Net Installations thousands MRR and MAR Churn % = Net New Sales (Bookings) thousands MRR and MAR $1,555 $1,618 $1,914 $1,907 $1,960 $1,816 $1,672 $1,914 $0 $500 $1,000 $1,500 $2,000 $2,500 $3,000 $3,500 $4,000 $4,500 Dec-13 Mar-14 Jun-14 Sep-14 Dec-14 Mar-15 Jun-15 Sep-15 $89.6 $91.6 $97.5 $107.4 $109.0 $111.3 $113.4 $115.4 $0.1 $0.3 $0.4 $0.2 $0.3 $0.2 $0.3 $0.3 $10.5 $10.9 $11.6 $13.3 $13.4 $14.3 $14.9 $15.7 $2.5 $2.7 $5.0 $6.4 $7.0 $7.6 $6.7 $3.6 $102.7 $105.5 $114.4 $127.4 $129.7 $133.5 $135.3 $135.0 $0 $25 $50 $75 $100 $125 $150 $175 $200 Dec-13 Mar-14 Jun-14 Sep-14 Dec-14 Mar-15 Jun-15 Sep-15 MRR Usage MAR Other Revenue $39 $35 $36 $134 $9 $157 $141 $10 $0 $25 $50 $75 $100 $125 $150 $175 $200 Dec-13 Mar-14 Jun-14 Sep-14 Dec-14 Mar-15 Jun-15 Sep-15 ($900) ($597) ($725) ($945) ($818) ($993) ($836) ($761) -0.9% -0.6% -0.7% -0.8% -0.7% -0.8% -0.7% -0.6% ($4,500) ($4,000) ($3,500) ($3,000) ($2,500) ($2,000) ($1,500) ($1,000) ($500) $0 Dec-13 Mar-14 Jun-14 Sep-14 Dec-14 Mar-15 Jun-15 Sep-15 $655 $1,021 $1,189 $962 $1,141 $824 $837 $1,153 $0 $500 $1,000 $1,500 $2,000 $2,500 $3,000 $3,500 $4,000 $4,500 Dec-13 Mar-14 Jun-14 Sep-14 Dec-14 Mar-15 Jun-15 Sep-15 $2,255 $1,592 $2,115 $1,956 $1,239 $2,272 $2,136 $1,668 $310 $325 $327 $531 $212 $546 $484 $330 $2,565 $1,917 $2,442 $2,488 $1,450 $2,818 $2,619 $1,998 $434M $240M $326M $439M $101M $429M $392M $256M $0 $500 $1,000 $1,500 $2,000 $2,500 $3,000 $3,500 $4,000 $4,500 Dec-13 Mar-14 Jun-14 Sep-14 Dec-14 Mar-15 Jun-15 Sep-15 Net Sales - MRR Net Sales - MAR Contract Value =

% of Revenue millions Purchases of Property and Equipment % of Revenue millions Adjusted EBITDA % of Revenue millions Net Capital1 % of Revenue millions Adj Unlevered FCF3 % of Revenue millions Unlevered Free Cash Flow (FCF)2 Zayo Dark Fiber Solutions Segment Cash Flow Stratification 1 Net Capital is equal to “Cash Outflows for Purchases of Property and Equipment” less “Additions to Deferred Revenue” 2 Unlevered Free Cash Flow is equal to Adjusted EBITDA less “Cash Outflows for Purchases of Property and Equipment” 3 Adjusted Unlevered Free Cash Flow is equal to Adjusted EBITDA less “Net Capital” less “Monthly Amortized Revenue” $41 $48 $50 $58 $70 $73 $79 $94 40% 45% 44% 46% 54% 55% 58% 69% $0 $25 $50 $75 $100 $125 Dec-13 Mar-14 Jun-14 Sep-14 Dec-14 Mar-15 Jun-15 Sep-15 $71 $73 $77 $85 $90 $93 $97 $97 69% 69% 68% 67% 69% 69% 72% 72% $0 $25 $50 $75 $100 $125 Dec-13 Mar-14 Jun-14 Sep-14 Dec-14 Mar-15 Jun-15 Sep-15 $20 ($14) $4 $20 $35 $32 $56 $54 19% -14% 4% 16% 27% 24% 41% 40% ($25) $0 $25 $50 $75 $100 Dec-13 Mar-14 Jun-14 Sep-14 Dec-14 Mar-15 Jun-15 Sep-15 $41 $76 $61 $52 $41 $46 $26 $26 40% 72% 54% 40% 31% 35% 19% 20% $0 $25 $50 $75 $100 $125 Dec-13 Mar-14 Jun-14 Sep-14 Dec-14 Mar-15 Jun-15 Sep-15 $30 $25 $27 $27 $20 $20 $18 $3 29% 24% 24% 21% 15% 15% 13% 2% $0 $25 $50 $75 $100 $125 Dec-13 Mar-14 Jun-14 Sep-14 Dec-14 Mar-15 Jun-15 Sep-15

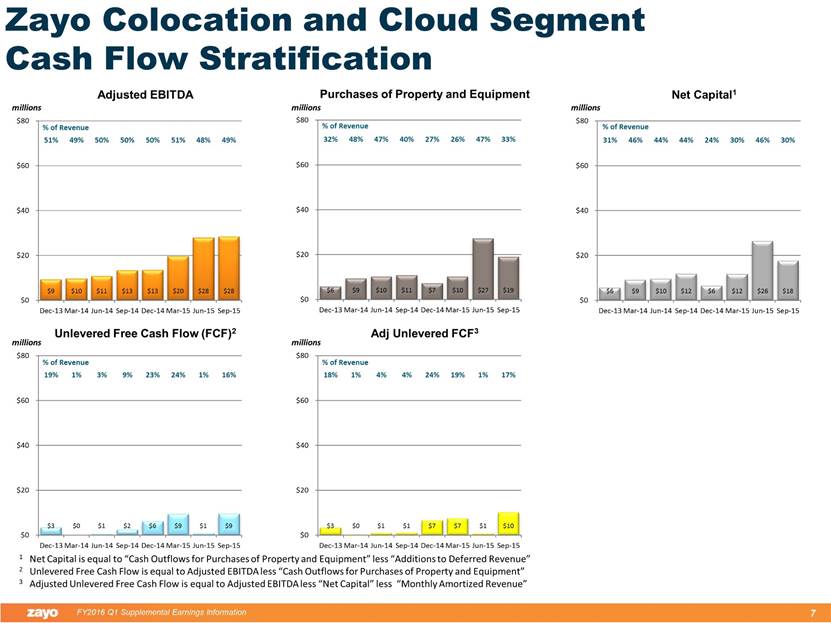
Zayo Colocation and Cloud Segment Financial Data 1 Pro-forma annualized growth for revenue and Adjusted EBITDA are calculated as if the acquisitions occurred on the first day of the quarter preceding the respective quarter in which the acquisitions closed Financial Data
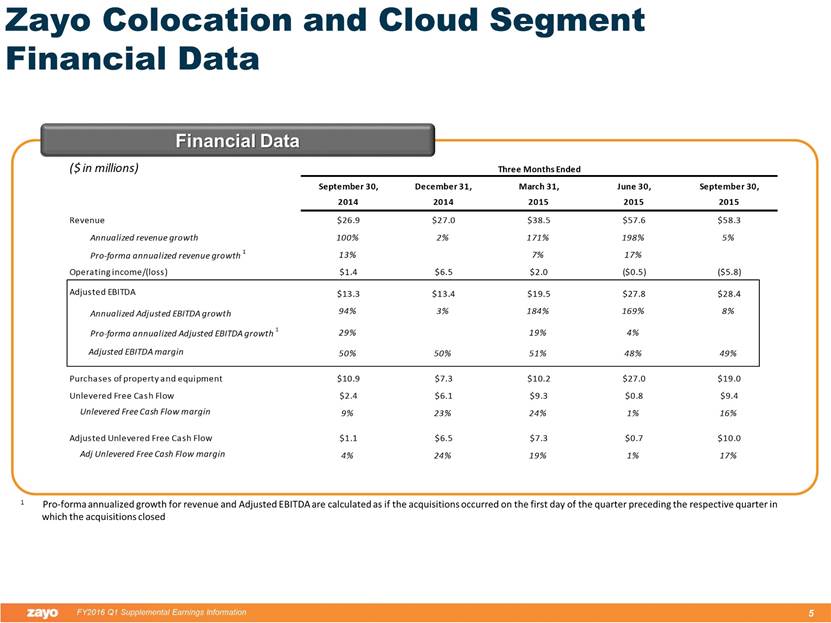
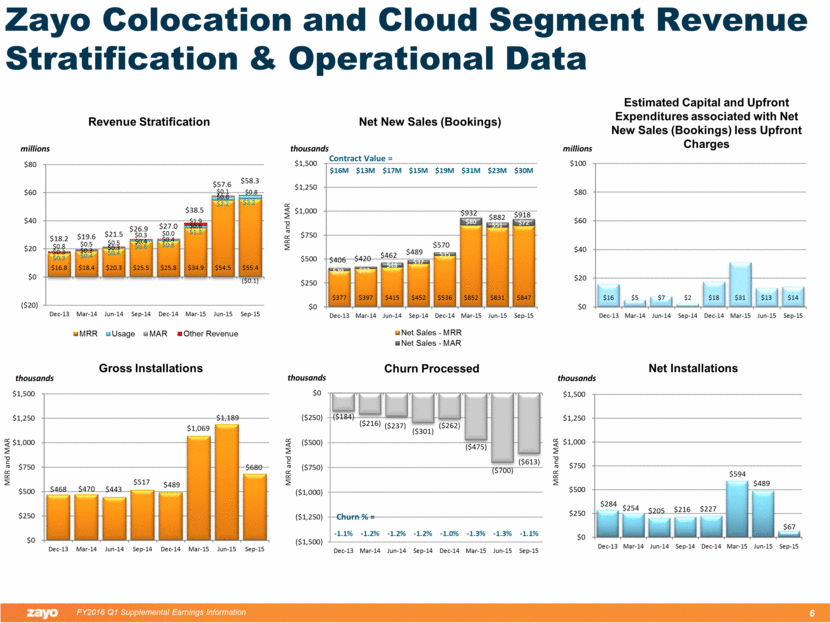
millions Revenue Stratification Estimated Capital and Upfront Expenditures associated with Net New Sales (Bookings) less Upfront Charges millions Zayo Colocation and Cloud Segment Revenue Stratification & Operational Data thousands Churn Processed Gross Installations MRR and MAR MRR and MAR thousands Net Installations thousands MRR and MAR Churn % = Net New Sales (Bookings) thousands MRR and MAR $468 $470 $443 $517 $489 $1,069 $1,189 $680 $0 $250 $500 $750 $1,000 $1,250 $1,500 Dec-13 Mar-14 Jun-14 Sep-14 Dec-14 Mar-15 Jun-15 Sep-15 $16.8 $18.4 $20.3 $25.5 $25.8 $34.9 $54.5 $55.4 $0.3 $0.4 $0.4 $0.6 $0.8 $1.3 $2.2 $2.2 $0.3 $0.3 $0.3 $0.4 $0.4 $0.6 $0.8 $0.8 $0.8 $0.5 $0.5 $0.3 $0.0 $1.9 $0.1 ($0.1) $18.2 $19.6 $21.5 $26.9 $27.0 $38.5 $57.6 $58.3 ($20) $0 $20 $40 $60 $80 Dec-13 Mar-14 Jun-14 Sep-14 Dec-14 Mar-15 Jun-15 Sep-15 MRR Usage MAR Other Revenue $16 $5 $7 $2 $18 $31 $13 $14 $0 $20 $40 $60 $80 $100 Dec-13 Mar-14 Jun-14 Sep-14 Dec-14 Mar-15 Jun-15 Sep-15 ($184) ($216) ($237) ($301) ($262) ($475) ($700) ($613) -1.1% -1.2% -1.2% -1.2% -1.0% -1.3% -1.3% -1.1% ($1,500) ($1,250) ($1,000) ($750) ($500) ($250) $0 Dec-13 Mar-14 Jun-14 Sep-14 Dec-14 Mar-15 Jun-15 Sep-15 $284 $254 $205 $216 $227 $594 $489 $67 $0 $250 $500 $750 $1,000 $1,250 $1,500 Dec-13 Mar-14 Jun-14 Sep-14 Dec-14 Mar-15 Jun-15 Sep-15 $377 $397 $415 $452 $536 $852 $831 $847 $29 $22 $48 $37 $35 $80 $51 $72 $406 $420 $462 $489 $570 $932 $882 $918 $16M $13M $17M $15M $19M $31M $23M $30M $0 $250 $500 $750 $1,000 $1,250 $1,500 Dec-13 Mar-14 Jun-14 Sep-14 Dec-14 Mar-15 Jun-15 Sep-15 Net Sales - MRR Net Sales - MAR Contract Value =
% of Revenue millions Purchases of Property and Equipment % of Revenue millions Adjusted EBITDA % of Revenue millions Net Capital1 % of Revenue millions Adj Unlevered FCF3 % of Revenue millions Unlevered Free Cash Flow (FCF)2 Zayo Colocation and Cloud Segment Cash Flow Stratification 1 Net Capital is equal to “Cash Outflows for Purchases of Property and Equipment” less “Additions to Deferred Revenue” 2 Unlevered Free Cash Flow is equal to Adjusted EBITDA less “Cash Outflows for Purchases of Property and Equipment” 3 Adjusted Unlevered Free Cash Flow is equal to Adjusted EBITDA less “Net Capital” less “Monthly Amortized Revenue” $6 $9 $10 $11 $7 $10 $27 $19 32% 48% 47% 40% 27% 26% 47% 33% $0 $20 $40 $60 $80 Dec-13 Mar-14 Jun-14 Sep-14 Dec-14 Mar-15 Jun-15 Sep-15 $9 $10 $11 $13 $13 $20 $28 $28 51% 49% 50% 50% 50% 51% 48% 49% $0 $20 $40 $60 $80 Dec-13 Mar-14 Jun-14 Sep-14 Dec-14 Mar-15 Jun-15 Sep-15 $6 $9 $10 $12 $6 $12 $26 $18 31% 46% 44% 44% 24% 30% 46% 30% $0 $20 $40 $60 $80 Dec-13 Mar-14 Jun-14 Sep-14 Dec-14 Mar-15 Jun-15 Sep-15 $3 $0 $1 $1 $7 $7 $1 $10 18% 1% 4% 4% 24% 19% 1% 17% $0 $20 $40 $60 $80 Dec-13 Mar-14 Jun-14 Sep-14 Dec-14 Mar-15 Jun-15 Sep-15 $3 $0 $1 $2 $6 $9 $1 $9 19% 1% 3% 9% 23% 24% 1% 16% $0 $20 $40 $60 $80 Dec-13 Mar-14 Jun-14 Sep-14 Dec-14 Mar-15 Jun-15 Sep-15
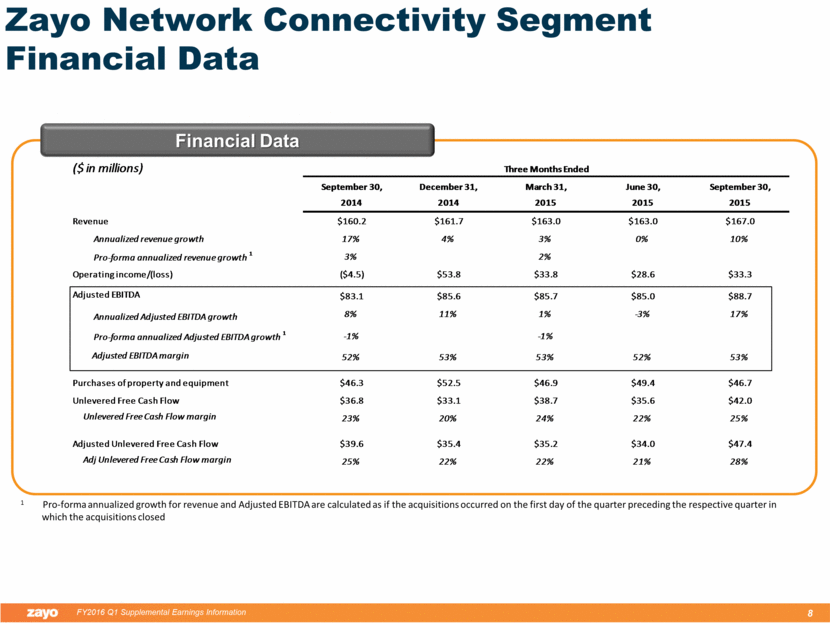
Zayo Network Connectivity Segment Financial Data Financial Data 1 Pro-forma annualized growth for revenue and Adjusted EBITDA are calculated as if the acquisitions occurred on the first day of the quarter preceding the respective quarter in which the acquisitions closed
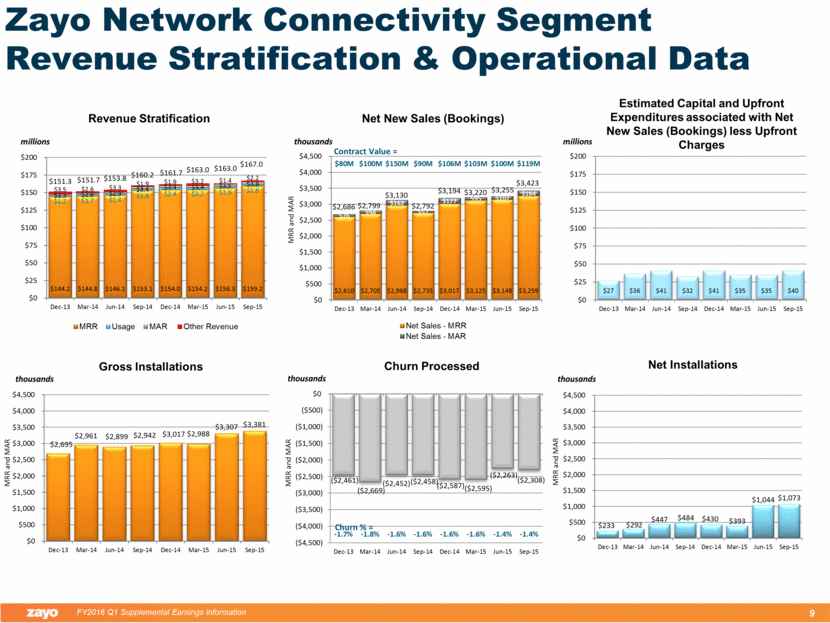
millions Revenue Stratification Net New Sales (Bookings) thousands MRR and MAR Zayo Network Connectivity Segment Revenue Stratification & Operational Data thousands Churn Processed Gross Installations MRR and MAR MRR and MAR thousands Net Installations thousands MRR and MAR Churn % = Estimated Capital and Upfront Expenditures associated with Net New Sales (Bookings) less Upfront Charges millions $2,695 $2,961 $2,899 $2,942 $3,017 $2,988 $3,307 $3,381 $0 $500 $1,000 $1,500 $2,000 $2,500 $3,000 $3,500 $4,000 $4,500 Dec-13 Mar-14 Jun-14 Sep-14 Dec-14 Mar-15 Jun-15 Sep-15 $144.2 $144.8 $146.1 $153.1 $154.0 $154.2 $156.3 $159.2 $1.2 $1.7 $1.4 $1.8 $2.4 $2.2 $1.9 $1.8 $2.3 $2.6 $2.9 $3.4 $3.4 $3.4 $3.5 $3.8 $3.5 $2.6 $3.3 $1.9 $1.9 $3.2 $1.4 $2.2 $151.3 $151.7 $153.8 $160.2 $161.7 $163.0 $163.0 $167.0 $0 $25 $50 $75 $100 $125 $150 $175 $200 Dec-13 Mar-14 Jun-14 Sep-14 Dec-14 Mar-15 Jun-15 Sep-15 MRR Usage MAR Other Revenue $2,610 $2,705 $2,968 $2,735 $3,017 $3,125 $3,148 $3,259 $76 $94 $162 $57 $177 $95 $107 $164 $2,686 $2,799 $3,130 $2,792 $3,194 $3,220 $3,255 $3,423 $80M $100M $150M $90M $106M $103M $100M $119M $0 $500 $1,000 $1,500 $2,000 $2,500 $3,000 $3,500 $4,000 $4,500 Dec-13 Mar-14 Jun-14 Sep-14 Dec-14 Mar-15 Jun-15 Sep-15 Net Sales - MRR Net Sales - MAR Contract Value = ($2,461) ($2,669) ($2,452) ($2,458) ($2,587) ($2,595) ($2,263) ($2,308) -1.7% -1.8% -1.6% -1.6% -1.6% -1.6% -1.4% -1.4% ($4,500) ($4,000) ($3,500) ($3,000) ($2,500) ($2,000) ($1,500) ($1,000) ($500) $0 Dec-13 Mar-14 Jun-14 Sep-14 Dec-14 Mar-15 Jun-15 Sep-15 $233 $292 $447 $484 $430 $393 $1,044 $1,073 $0 $500 $1,000 $1,500 $2,000 $2,500 $3,000 $3,500 $4,000 $4,500 Dec-13 Mar-14 Jun-14 Sep-14 Dec-14 Mar-15 Jun-15 Sep-15 $27 $36 $41 $32 $41 $35 $35 $40 $0 $25 $50 $75 $100 $125 $150 $175 $200 Dec-13 Mar-14 Jun-14 Sep-14 Dec-14 Mar-15 Jun-15 Sep-15
% of Revenue millions Purchases of Property and Equipment % of Revenue millions Adjusted EBITDA % of Revenue millions Net Capital1 % of Revenue millions Adj Unlevered FCF3 % of Revenue millions Unlevered Free Cash Flow (FCF)2 Zayo Network Connectivity Segment Cash Flow Stratification 1 Net Capital is equal to “Cash Outflows for Purchases of Property and Equipment” less “Additions to Deferred Revenue” 2 Unlevered Free Cash Flow is equal to Adjusted EBITDA less “Cash Outflows for Purchases of Property and Equipment” 3 Adjusted Unlevered Free Cash Flow is equal to Adjusted EBITDA less “Net Capital” less “Monthly Amortized Revenue” $42 $34 $35 $46 $53 $47 $49 $47 27% 22% 23% 29% 32% 29% 30% 28% $0 $25 $50 $75 $100 $125 Dec-13 Mar-14 Jun-14 Sep-14 Dec-14 Mar-15 Jun-15 Sep-15 $81 $82 $82 $83 $86 $86 $85 $89 54% 54% 53% 52% 53% 53% 52% 53% $0 $25 $50 $75 $100 $125 Dec-13 Mar-14 Jun-14 Sep-14 Dec-14 Mar-15 Jun-15 Sep-15 $40 $31 $32 $40 $47 $47 $48 $38 26% 20% 21% 25% 29% 29% 29% 22% $0 $25 $50 $75 $100 $125 Dec-13 Mar-14 Jun-14 Sep-14 Dec-14 Mar-15 Jun-15 Sep-15 $39 $49 $46 $40 $35 $35 $34 $47 26% 32% 30% 25% 22% 22% 21% 28% $0 $25 $50 $75 $100 $125 Dec-13 Mar-14 Jun-14 Sep-14 Dec-14 Mar-15 Jun-15 Sep-15 $40 $49 $47 $37 $33 $39 $36 $42 26% 32% 30% 23% 20% 24% 22% 25% $0 $25 $50 $75 $100 $125 Dec-13 Mar-14 Jun-14 Sep-14 Dec-14 Mar-15 Jun-15 Sep-15

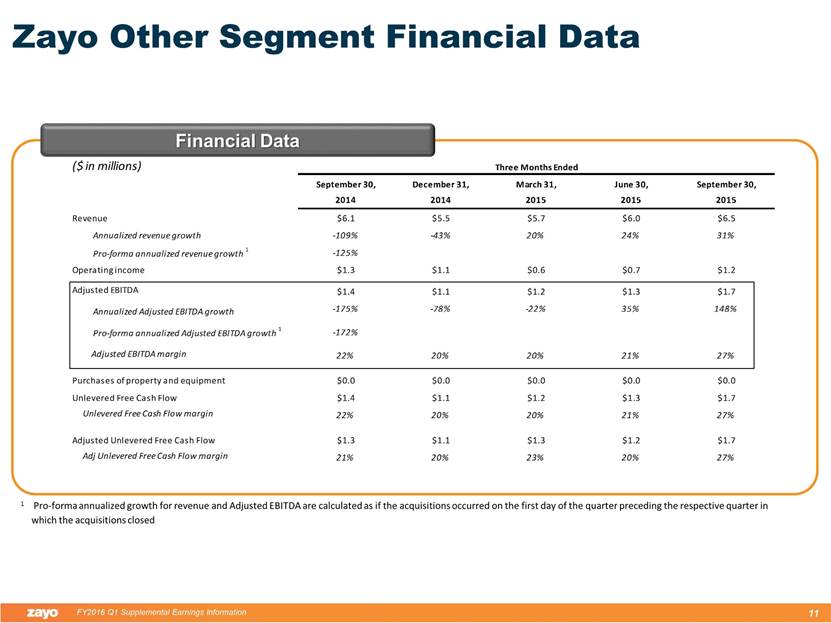
Zayo Other Segment Financial Data 1 Pro-forma annualized growth for revenue and Adjusted EBITDA are calculated as if the acquisitions occurred on the first day of the quarter preceding the respective quarter in which the acquisitions closed Financial Data
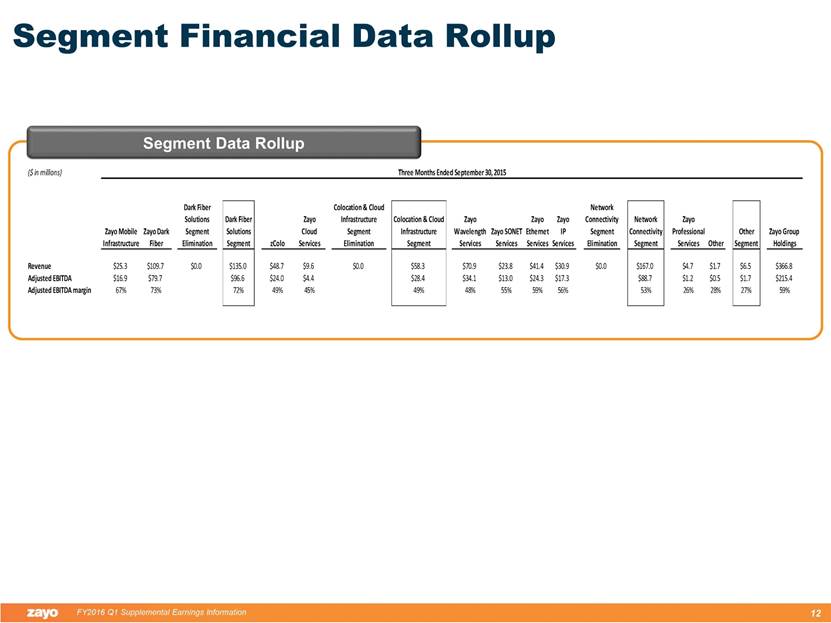
Segment Financial Data Rollup Segment Data Rollup
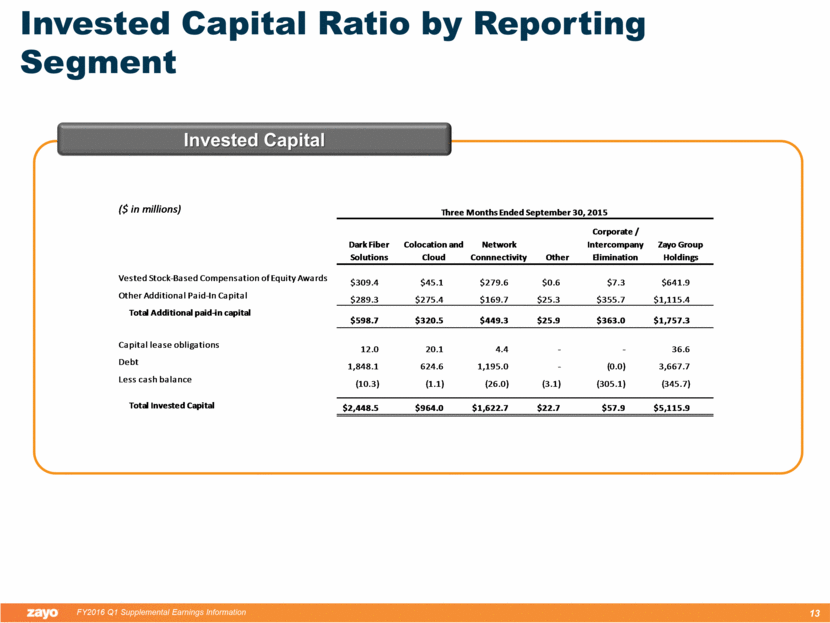
Invested Capital Ratio by Reporting Segment Invested Capital
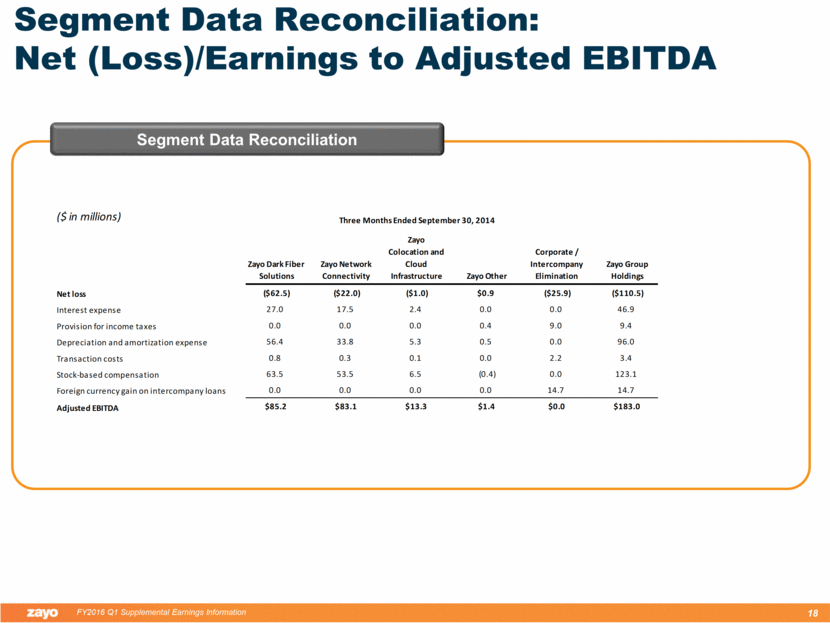
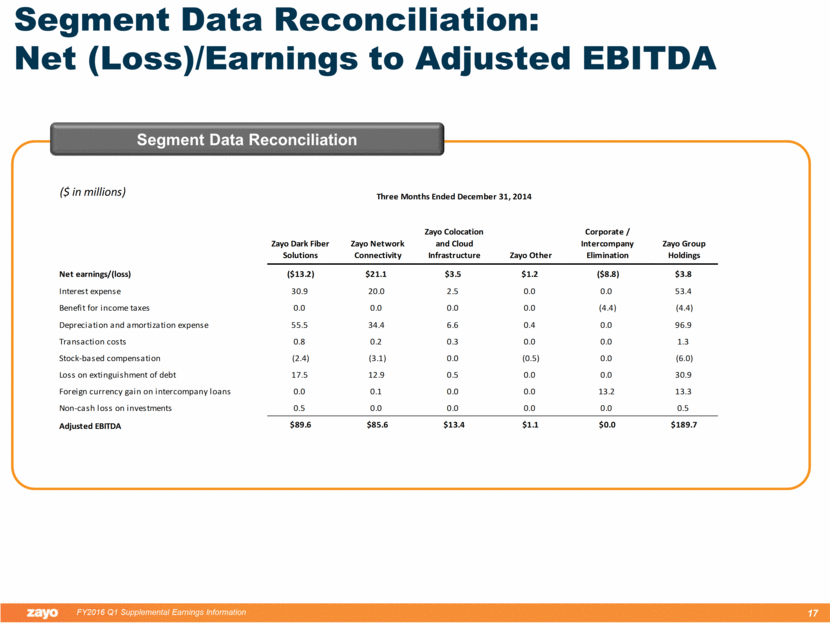
Segment Data Reconciliation: Net (Loss)/Earnings to Adjusted EBITDA Segment Data Reconciliation1 1 A reconciliation of previous quarters’ legacy segment information can be found in our historical earnings supplements found on our website at http://www.zayo.com/financial-earnings-release

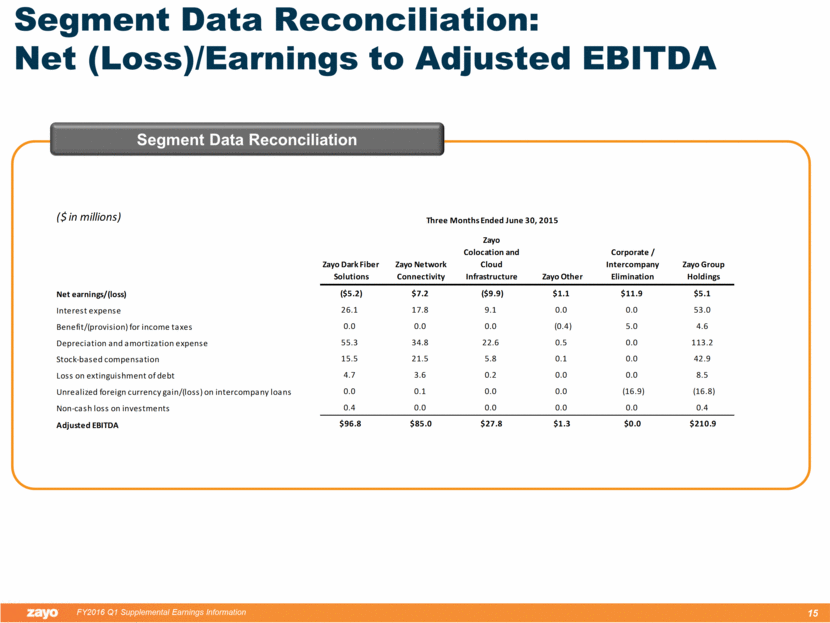
Segment Data Reconciliation: Net (Loss)/Earnings to Adjusted EBITDA Segment Data Reconciliation ($ in millions) Zayo Dark Fiber Solutions Zayo Network Connectivity Zayo Colocation and Cloud Infrastructure Zayo Other Corporate / Intercompany Elimination Zayo Group Holdings Net earnings/(loss) ($5.2) $7.2 ($9.9) $1.1 $11.9 $5.1 Interest expense 26.1 17.8 9.1 0.0 0.0 53.0 Benefit/(provision) for income taxes 0.0 0.0 0.0 (0.4) 5.0 4.6 Depreciation and amortization expense 55.3 34.8 22.6 0.5 0.0 113.2 Stock-based compensation 15.5 21.5 5.8 0.1 0.0 42.9 Loss on extinguishment of debt 4.7 3.6 0.2 0.0 0.0 8.5 Unrealized foreign currency gain/(loss) on intercompany loans 0.0 0.1 0.0 0.0 (16.9) (16.8) Non-cash loss on investments 0.4 0.0 0.0 0.0 0.0 0.4 Adjusted EBITDA $96.8 $85.0 $27.8 $1.3 $0.0 $210.9 Three Months Ended June 30, 2015
Segment Data Reconciliation: Net (Loss)/Earnings to Adjusted EBITDA Segment Data Reconciliation
Segment Data Reconciliation: Net (Loss)/Earnings to Adjusted EBITDA Segment Data Reconciliation
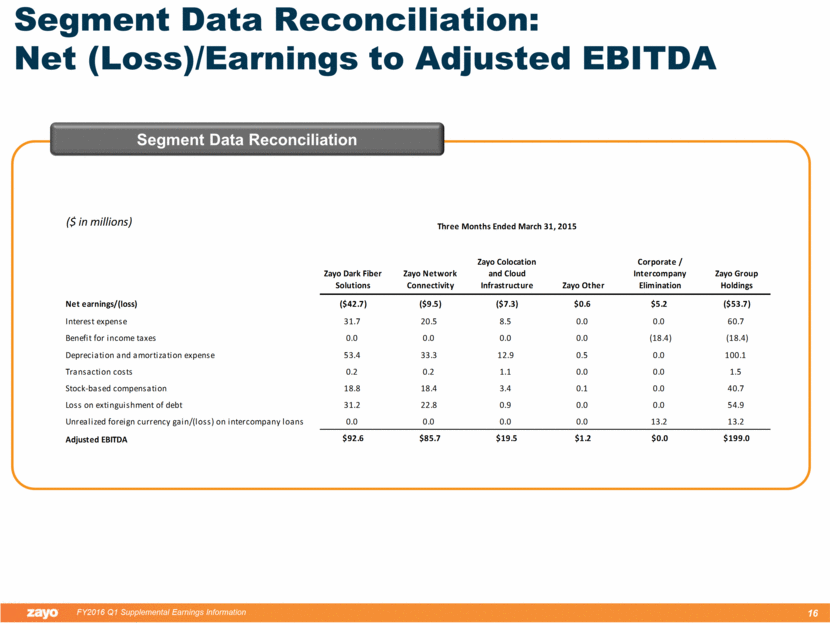
Segment Data Reconciliation: Net (Loss)/Earnings to Adjusted EBITDA Segment Data Reconciliation ($ in millions) Zayo Dark Fiber Solutions Zayo Network Connectivity Zayo Colocation and Cloud Infrastructure Zayo Other Corporate / Intercompany Elimination Zayo Group Holdings Net loss ($62.5) ($22.0) ($1.0) $0.9 ($25.9) ($110.5) Interest expense 27.0 17.5 2.4 0.0 0.0 46.9 Provision for income taxes 0.0 0.0 0.0 0.4 9.0 9.4 Depreciation and amortization expense 56.4 33.8 5.3 0.5 0.0 96.0 Transaction costs 0.8 0.3 0.1 0.0 2.2 3.4 Stock-based compensation 63.5 53.5 6.5 (0.4) 0.0 123.1 Foreign currency gain on intercompany loans 0.0 0.0 0.0 0.0 14.7 14.7 Adjusted EBITDA $85.2 $83.1 $13.3 $1.4 $0.0 $183.0 Three Months Ended September 30, 2014