Attached files
| file | filename |
|---|---|
| 8-K - 8-K - DiamondRock Hospitality Co | a16-2871_18k.htm |
Exhibit 99.1
Investor Presentation January 2016

Forward Looking Statements Certain statements made during this presentation are forward-looking statements that are subject to risks and uncertainties. Forward-looking statements generally include the words “believe,” “expect,” “anticipate,” “plan,” “estimate,” “project,” “will,” “intend” or other similar expressions. Forward-looking statements include, without limitation, statements regarding, industry outlook, results of operations, cash flows, business strategies, growth and value opportunities, capital and other expenditures, financing plans, expense reduction initiatives and projected dispositions. Factors that could cause actual results to materially differ from those contained in the forward-looking statements include, without limitation, those risks and uncertainties discussed in the Company’s most recent Annual Report on Form 10-K, quarterly report on Form 10-Q and current reports on Form 8-K, which have been filed with the Securities and Exchange Commission, all of which you should carefully review. The forward-looking statements made are based on our beliefs, assumptions and expectations of future performance, taking into account all information currently available to us. Actual results could differ materially from the forward-looking statements made during this presentation. The forward-looking statements made during this presentation are subject to the safe harbor of the Private Securities Litigation Reform Act of 1995. Any forward-looking statement speaks only as of the date on which it is made. Although the Company believes the expectations reflected in such forward-looking statements are based upon reasonable assumptions, it can give no assurance that the expectations will be attained or that any deviation will not be material. All information in this presentation is as of the date of this presentation, and the Company undertakes no obligation to update any forward-looking statement to conform the statement to actual results or changes in the Company's expectations. This presentation contains statistics and other data that has been obtained or compiled from information made available by third-party service providers.
DIAMONDROCK OVERVIEW

Why DiamondRock? 1 Strategic Portfolio Transformation 2 3 4 Westin San Diego Hotel Rex Significantly upgraded portfolio through strategic capital recycling Average RevPAR of acquired assets >80% higher than sold assets Strategically diversified brands, managers, and geographic distribution Intense Asset Management Focus 2015F RevPAR and EBITDA margin growth among highest in peer group >100 bps of 2015F margin growth 260 basis points upside to prior peak Prudent Capital Allocation & Value Creation Nimble capital allocation strategy Sensitive to changes in cost of capital Recently announced $150 million share repurchase program Unique Capital Structure 2015 refinancings to generate $8.0M of interest rate savings next year Approaching 3.0x Net Debt / EBITDA in 2016 No corporate debt 18 hotels unencumbered by debt Well laddered maturity schedule
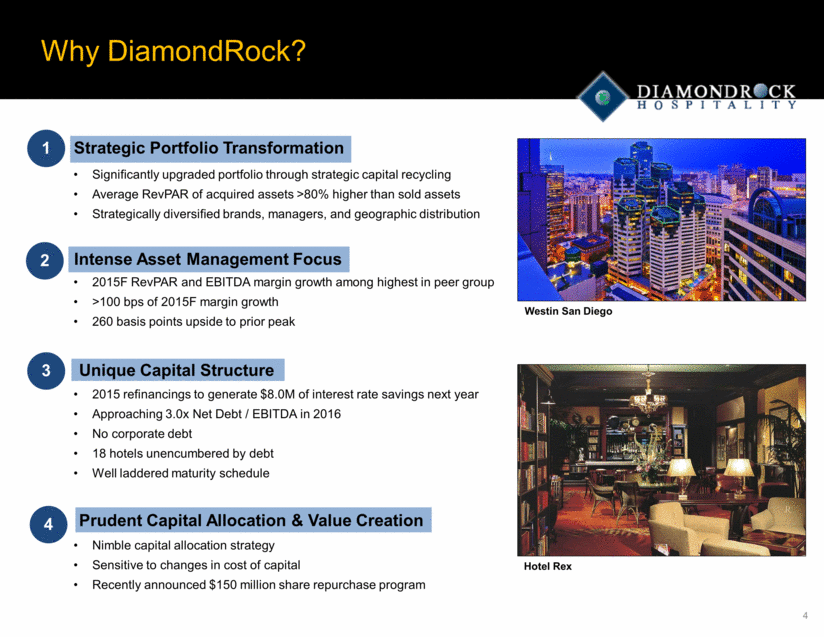
DiamondRock at a Glance KEY STATISTICS Hotels 29 Rooms 10,928 Enterprise Value $2.7B Enterprise Value / Key $251K Net Debt/EBITDA(1) 3.6x Based on 2015 EBITDA and 2015 year-end net debt. Current Company Guidance FY 2015 RevPAR Guidance: +4.25% – 5.00% FY 2015 EBITDA: $264M - $269M FY 2015 Margin Expansion: >100 bps Adjusted FFO per Share: $1.00 - $1.02 16 OF 29 HOTELS THIRD-PARTY OPERATED(1) DIVERSE COLLECTION OF BRANDS(1) Note: Data as of 1/21/2016. Marriott 27.2% Renaissance 8.7% Autograph 6.5% Courtyard 6.3% JW Marriott 3.0% Luxury Collection 2.2% Westin 22.7% Hilton 11.6% Hilton Garden Inn 5.3% Boutique / Lifestyle 6.5% Marriott 37% Starwood 9% Hilton 4% Third - Party 50%
Premier Portfolio With Urban and Resort Concentration
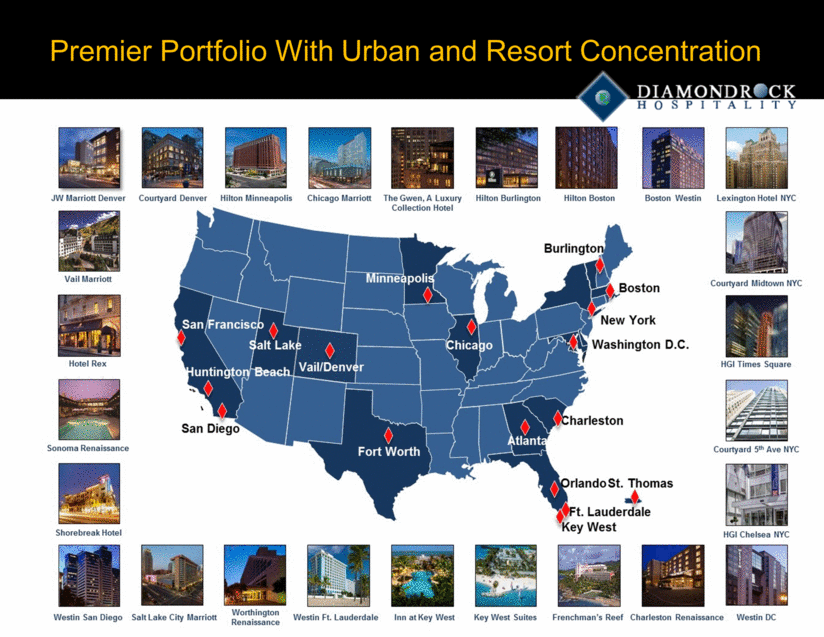
Strategically Transformed Portfolio Strategically Enhanced Portfolio Brand Diversity Average 2015 RevPAR of Recent Acquisitions of ~$205 ~50% of Portfolio Managed by Third-Party Operators (2 hotels in 2008 to 16 in 2015) Enhanced Geographic Diversity Improved to >90% Urban and Resort & Destination Hotels HIGHER QUALITY, HIGHER PORTFOLIO REVPAR(1) >90% URBAN AND RESORT & DESTINATION HOTELS IN TOP U.S. MARKETS(2) Based on midpoint of 2015F RevPAR guidance. Pro forma for acquisitions of Key West Suites and Shorebreak Hotel. Based on 2015F EBITDA for all properties. Pro forma for acquisitions of Key West Suites and Shorebreak Hotel. +35% New York 16% Destination Resorts 15% Boston 14% Chicago 12% Other CBD 10% South Florida 9% Washington, DC 6% Denver 5% Minneapolis 4% Other 4% San Diego 4% San Francisco 1% $126.95 $170.81 $120.00 $130.00 $140.00 $150.00 $160.00 $170.00 $180.00 2008A 2015 Guidance
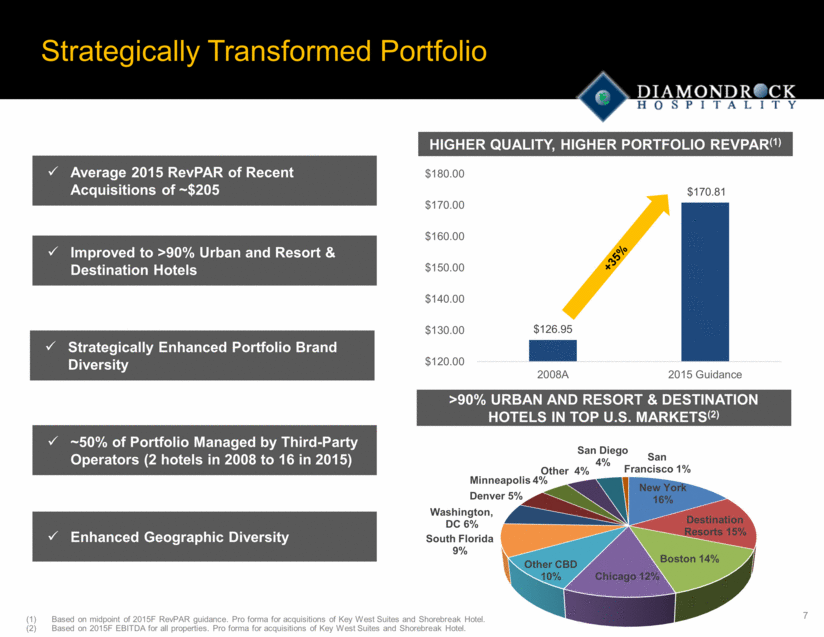
Strong F&B Revenue and Profitability Growth (360 bps margin growth in 3Q15) 2015 Hotel Adj. EBITDA Margin Expansion of >100 basis points Portfolio ROI Projects Expected to Deliver Outsized Growth (e.g., Boston Hilton, Boston Westin) 260 Basis Points Below Prior Peak Margins Equating to ~$24M of EBITDA(1) Cost Containment Initiatives Paying Off (74% Flow-Thru in 3Q15) Rigorous Asset Management Driving Significant Growth ABOVE AVERAGE EBITDA Margin Expansion Based on mid-point of 2015F Total Revenues. Peer group includes Chesapeake, Host, LaSalle, Pebblebrook, Hersha, Sunstone, Ashford Prime and Ashford Trust. Significant MARGIN UPSIDE TO PRIOR PEAK (2) 30.9% 33.5% 28% 30% 32% 34% 2015F Prior Peak (2007) 132 80 275 114 - 50 100 150 200 250 300 2014A YTD 2015 (bps) Peer Set Average DRH
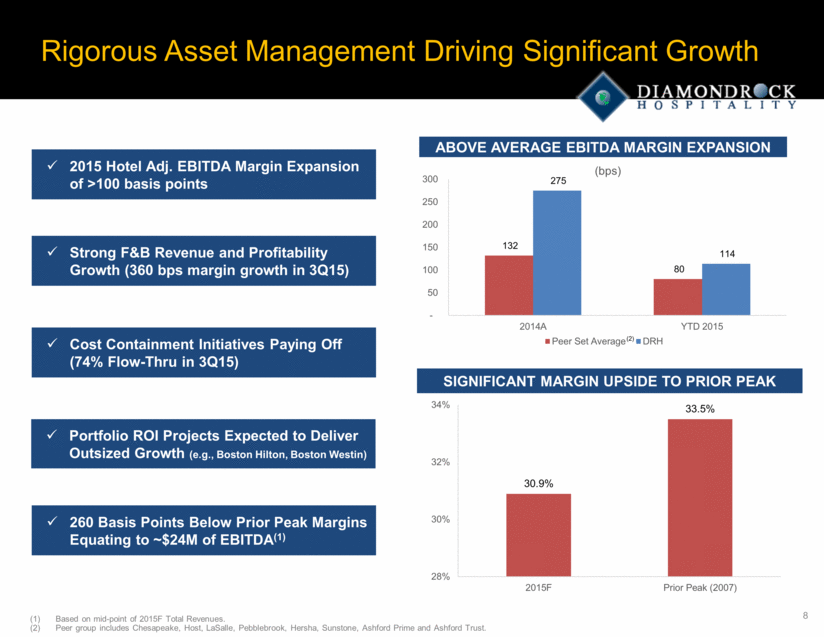
Creating Value at the Chicago Marriott Downtown New, Modernized Guestrooms Rush Street Pantry: New grab-and-go F&B outlet Multi-Year Renovation Amended Management Agreement Creates Significant Long-term Value Amended management agreement to permanently reduce management and incentive fees owed Annual total fee savings of $1.5 to $2.0 million Successfully Completed First Phase of Hotel Renovation Renovated rooms commanding $50 rate premium to standard rooms Successfully created Rush Street Pantry, new prototype F&B grab-n-go concept centrally located in hotel lobby Successfully able to reduce room service expenses F&B sales per occupied room higher than same period last year; Departmental profit improved >$100K during first operational quarter Second Phase of Renovation to Begin in Winter 2015 450 rooms to be renovated in winter 2015/2016 Balance of rooms will be completed over next several years in winter months to avoid any material disruption New, state-of-the-art fitness will be created to enhance guest experience
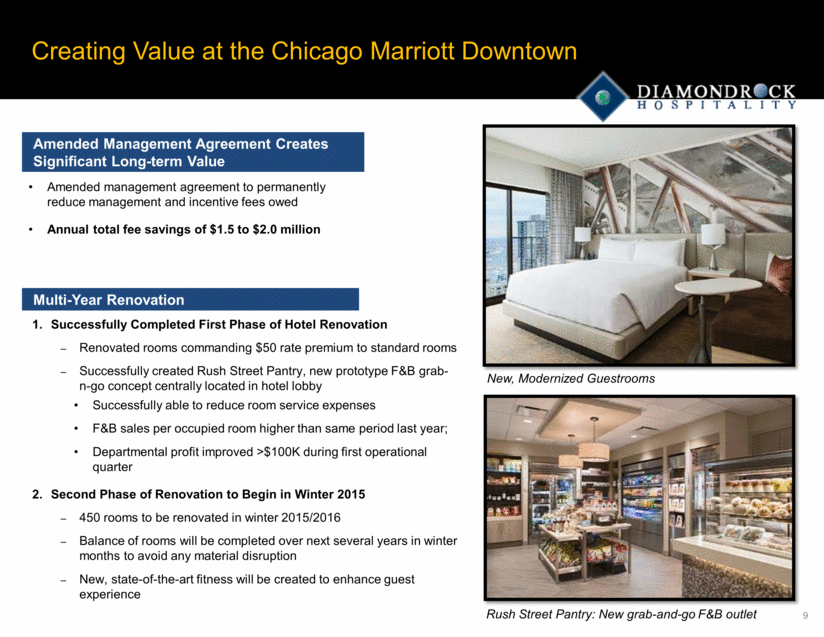
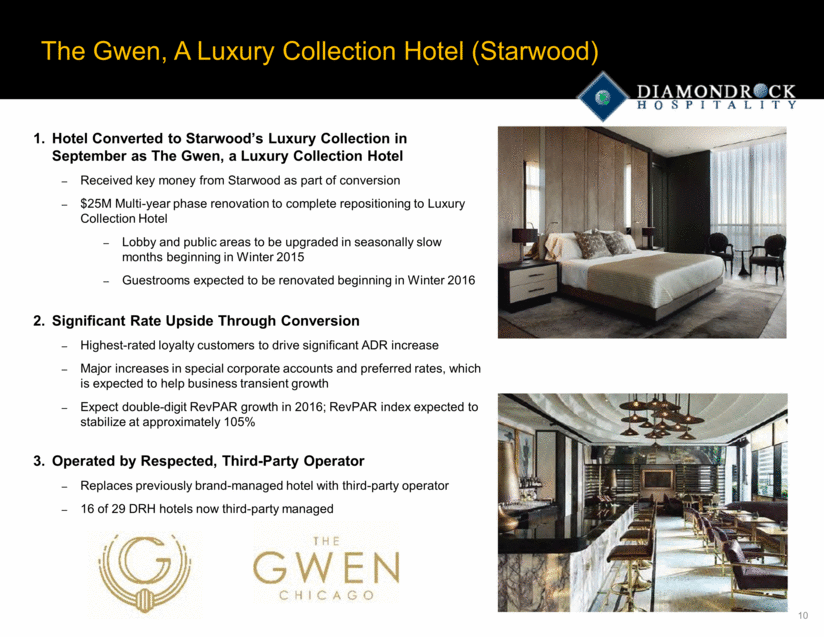
The Gwen, A Luxury Collection Hotel (Starwood) Hotel Converted to Starwood’s Luxury Collection in September as The Gwen, a Luxury Collection Hotel Received key money from Starwood as part of conversion $25M Multi-year phase renovation to complete repositioning to Luxury Collection Hotel Lobby and public areas to be upgraded in seasonally slow months beginning in Winter 2015 Guestrooms expected to be renovated beginning in Winter 2016 Significant Rate Upside Through Conversion Highest-rated loyalty customers to drive significant ADR increase Major increases in special corporate accounts and preferred rates, which is expected to help business transient growth Expect double-digit RevPAR growth in 2016; RevPAR index expected to stabilize at approximately 105% Operated by Respected, Third-Party Operator Replaces previously brand-managed hotel with third-party operator 16 of 29 DRH hotels now third-party managed
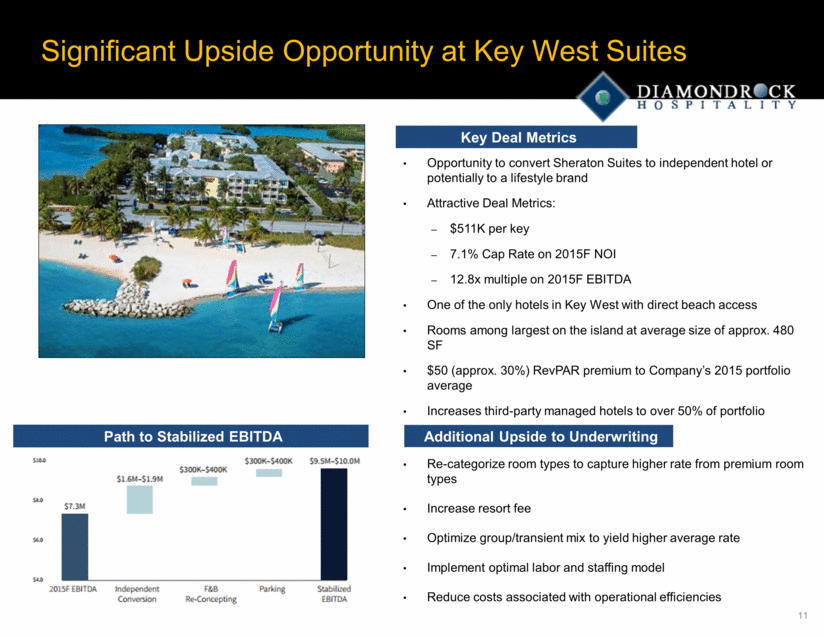
Significant Upside Opportunity at Key West Suites Opportunity to convert Sheraton Suites to independent hotel or potentially to a lifestyle brand Attractive Deal Metrics: $511K per key 7.1% Cap Rate on 2015F NOI 12.8x multiple on 2015F EBITDA One of the only hotels in Key West with direct beach access Rooms among largest on the island at average size of approx. 480 SF $50 (approx. 30%) RevPAR premium to Company’s 2015 portfolio average Increases third-party managed hotels to over 50% of portfolio Underwriting 500 bps margin expansion Re-categorize room types to capture higher rate from premium room types Increase resort fee Optimize group/transient mix to yield higher average rate Implement optimal labor and staffing model Reduce costs associated with operational efficiencies Key Deal Metrics Additional Upside to Underwriting Path to Stabilized EBITDA
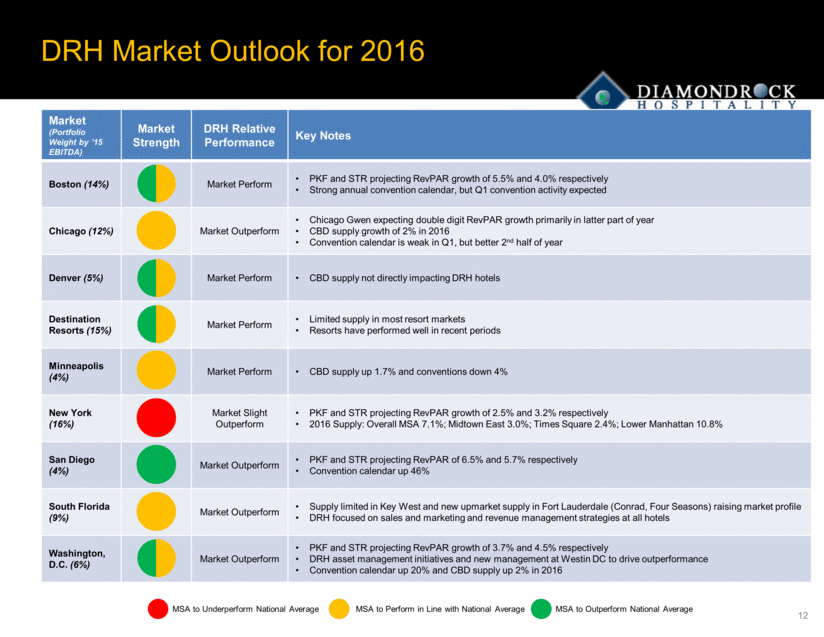
DRH Market Outlook for 2016 Market (Portfolio Weight by ’15 EBITDA) Market Strength DRH Relative Performance Key Notes Boston (14%) Market Perform PKF and STR projecting RevPAR growth of 5.5% and 4.0% respectively Strong annual convention calendar, but Q1 convention activity expected Chicago (12%) Market Outperform Chicago Gwen expecting double digit RevPAR growth primarily in latter part of year CBD supply growth of 2% in 2016 Convention calendar is weak in Q1, but better 2nd half of year Denver (5%) Market Perform CBD supply not directly impacting DRH hotels Destination Resorts (15%) Market Perform Limited supply in most resort markets Resorts have performed well in recent periods Minneapolis (4%) Market Perform CBD supply up 1.7% and conventions down 4% New York (16%) Market Slight Outperform PKF and STR projecting RevPAR growth of 2.5% and 3.2% respectively 2016 Supply: Overall MSA 7.1%; Midtown East 3.0%; Times Square 2.4%; Lower Manhattan 10.8% San Diego (4%) Market Outperform PKF and STR projecting RevPAR of 6.5% and 5.7% respectively Convention calendar up 46% South Florida (9%) Market Outperform Supply limited in Key West and new upmarket supply in Fort Lauderdale (Conrad, Four Seasons) raising market profile DRH focused on sales and marketing and revenue management strategies at all hotels Washington, D.C. (6%) Market Outperform PKF and STR projecting RevPAR growth of 3.7% and 4.5% respectively DRH asset management initiatives and new management at Westin DC to drive outperformance Convention calendar up 20% and CBD supply up 2% in 2016 MSA to Underperform National Average MSA to Perform in Line with National Average MSA to Outperform National Average
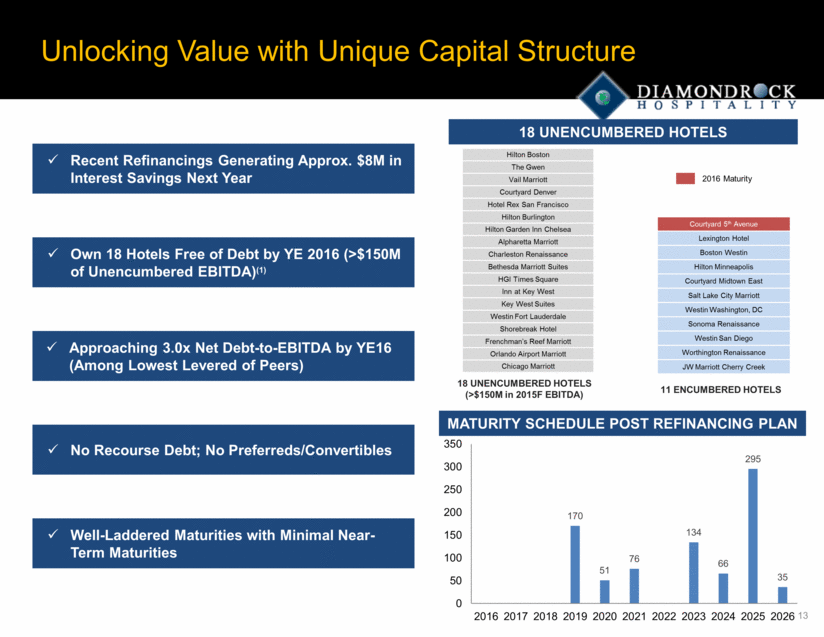
Unlocking Value with Unique Capital Structure Own 18 Hotels Free of Debt by YE 2016 (>$150M of Unencumbered EBITDA)(1) Recent Refinancings Generating Approx. $8M in Interest Savings Next Year No Recourse Debt; No Preferreds/Convertibles Well-Laddered Maturities with Minimal Near-Term Maturities Approaching 3.0x Net Debt-to-EBITDA by YE16 (Among Lowest Levered of Peers) MATURITY SCHEDULE POST REFINANCING PLAN 18 UNENCUMBERED HOTELS 11 ENCUMBERED HOTELS 2016 Maturities Courtyard 5th Avenue Lexington Hotel Boston Westin Hilton Minneapolis Courtyard Midtown East Salt Lake City Marriott Westin Washington, DC Sonoma Renaissance Westin San Diego Worthington Renaissance JW Marriott Cherry Creek Hilton Boston The Gwen Vail Marriott Courtyard Denver Hotel Rex San Francisco Hilton Burlington Hilton Garden Inn Chelsea Alpharetta Marriott Charleston Renaissance Bethesda Marriott Suites HGI Times Square Inn at Key West Key West Suites Westin Fort Lauderdale Shorebreak Hotel Frenchman’s Reef Marriott Orlando Airport Marriott Chicago Marriott 18 UNENCUMBERED HOTELS (>$150M in 2015F EBITDA) 2016 Maturity 170 51 76 134 66 295 35 0 50 100 150 200 250 300 350 2016 2017 2018 2019 2020 2021 2022 2023 2024 2025 2026
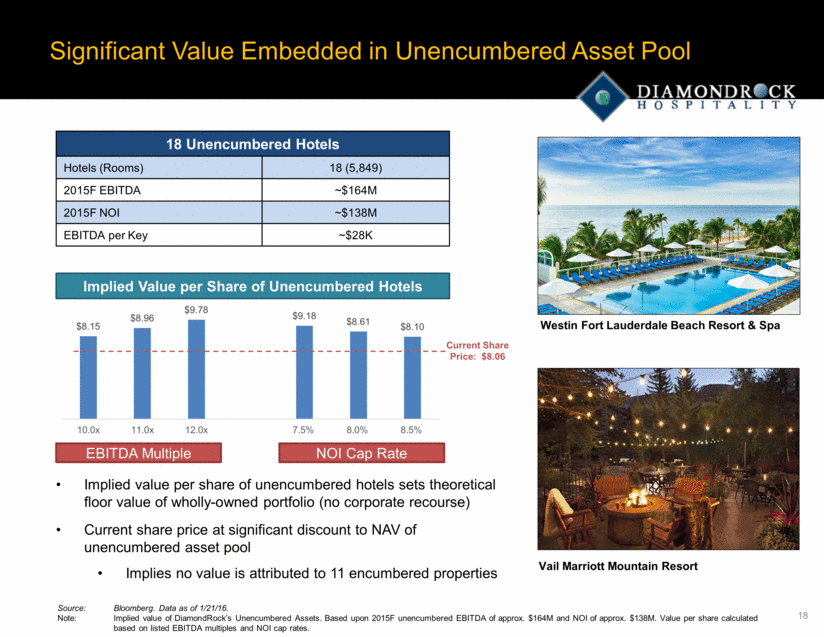
Entered into historically lowest fixed interest rate loan for DRH and amongst peers Locked in excess proceeds of $33M Lowered interest rate by 214 basis points Locked in excess proceeds of $27M Entered into largest new loan for DRH in current cycle Proceeds funded Chicago Marriott ~$200M debt maturity in early 2016 Successfully Completed 2015-2016 Refinancing Activity Refinanced JW Marriott Cherry Creek $65M, 4.33%, 10-Year Term Refinanced Worthington Renaissance $85M, 3.66%, 10-Year Term Encumbered Westin Boston $205M, 4.36%, 10-Year Term Prepaid Orlando Airport Marriott $55M, 5.68% Prepaid Frenchman’s Reef $56M, 5.44% Prepaid Chicago Marriott Downtown $201M, 5.98%
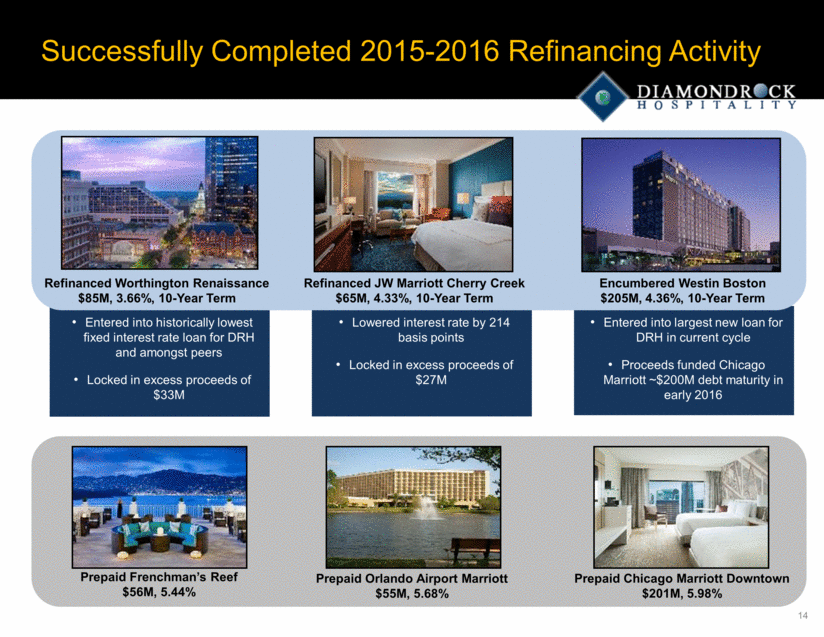
Strategically Allocating Capital Throughout Cycle Cost of Capital Higher Lower Match-fund Near-term Accretive Acquisitions By Issuing Equity At or Above NAV Consider Opportunistically Raising Equity Above NAV Limit Non-core Asset Sales Sell Non-Core Assets Consider All Options for Use of Dispositions Proceeds Sell Non-Core Assets and Deploy Proceeds Into Share Repurchases Consider Using Leverage Capacity to Exhaust Current $150M Share Repurchase Program as Stock Price Declines Evaluate Additional Non-Core Asset Sales Value Creation Playbook
COMPELLING VALUATION

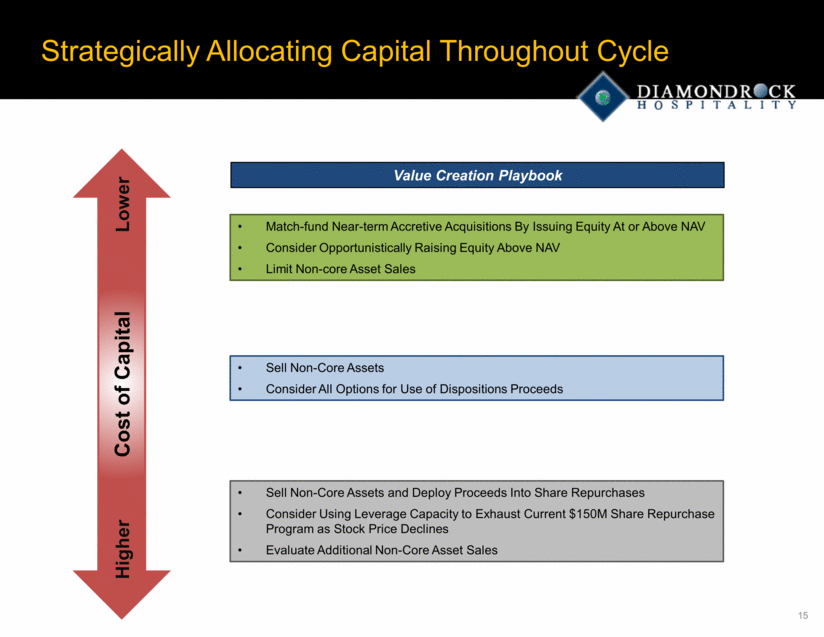
Compelling Valuation Presents Opportunity Source: Bloomberg; FactSet Consensus. Data as of 1/21/16. Peer group includes Chesapeake, Host, LaSalle, Pebblebrook, Hersha, Sunstone, Ashford Prime, and Ashford Trust. 2015 EBITDA Multiple based upon midpoint of guidance. 2016 EBITDA multiple based upon consensus EBITDA. KEY VALUATION METRICS Dividend Yield 6.2% Dividend Coverage 2.7x 2015F NOI Cap Rate 9.9% Implied Price-per-Key $251K Discount to Replacement Cost > 30% 2015 Total Shareholder Returns DRH EBITDA Multiple Below Long-Run Average Long-Run Average: 12.2x ABOVE AVERAGE EBITDA Margin Expansion (1) (1) (1) (2) (32.3%) 0.2% 2.5% (24.2%) (26.5%) (35.0%) (30.0%) (25.0%) (20.0%) (15.0%) (10.0%) (5.0%) 0.0% 5.0% DRH DJIA RMZ Lodging REIT Index Simple Peer Avg. 132 80 275 114 - 50 100 150 200 250 300 2014A YTD 2015 (bps) Peer Set Average DRH 10.3x 9.3x 10.4x 9.6x 2015 2016 DRH Simple Peer Avg.
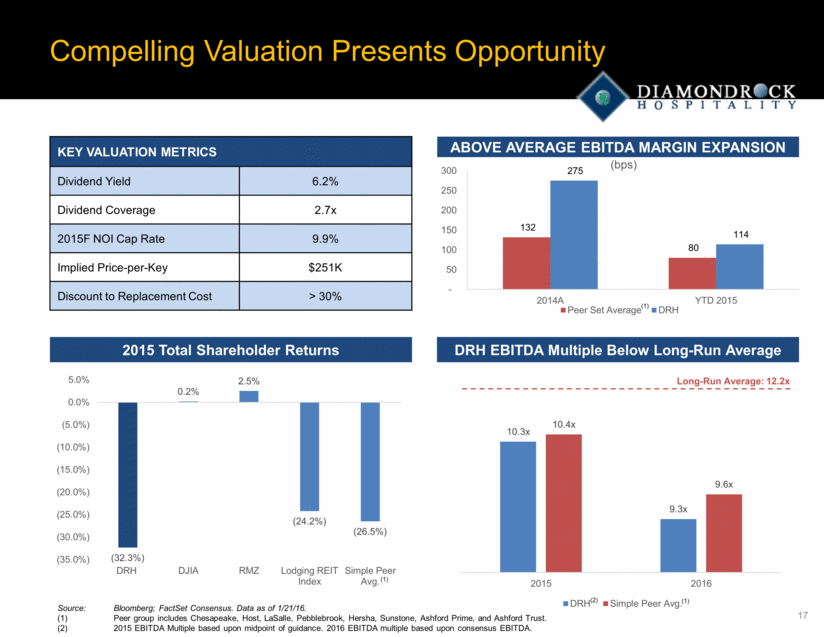
Significant Value Embedded in Unencumbered Asset Pool EBITDA Multiple Implied Value per Share of Unencumbered Hotels NOI Cap Rate Current Share Price: $8.06 Westin Fort Lauderdale Beach Resort & Spa Vail Marriott Mountain Resort 18 Unencumbered Hotels Hotels (Rooms) 18 (5,849) 2015F EBITDA ~$164M 2015F NOI ~$138M EBITDA per Key ~$28K Source: Bloomberg. Data as of 1/21/16. Note: Implied value of DiamondRock’s Unencumbered Assets. Based upon 2015F unencumbered EBITDA of approx. $164M and NOI of approx. $138M. Value per share calculated based on listed EBITDA multiples and NOI cap rates. Implied value per share of unencumbered hotels sets theoretical floor value of wholly-owned portfolio (no corporate recourse) Current share price at significant discount to NAV of unencumbered asset pool Implies no value is attributed to 11 encumbered properties $8.15 $8.96 $9.78 $9.18 $8.61 $8.10 10.0x 11.0x 12.0x 7.5% 8.0% 8.5%
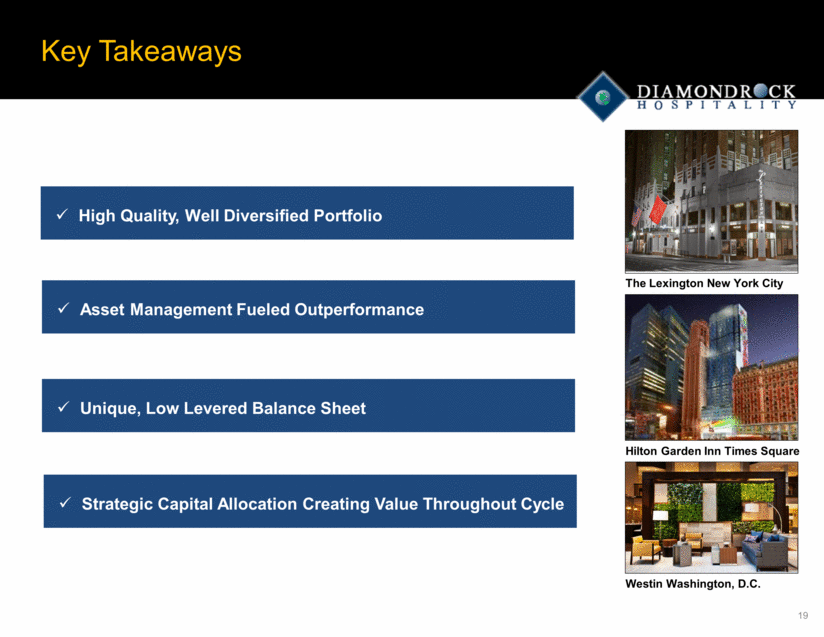
Key Takeaways Asset Management Fueled Outperformance High Quality, Well Diversified Portfolio Unique, Low Levered Balance Sheet Strategic Capital Allocation Creating Value Throughout Cycle The Lexington New York City Hilton Garden Inn Times Square Westin Washington, D.C.
Macroeconomic & lodging Overview

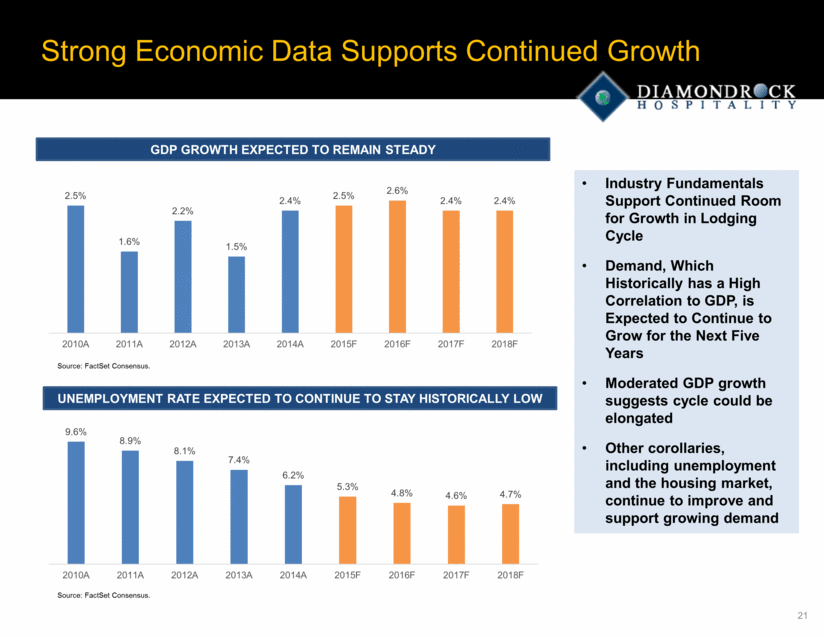
Strong Economic Data Supports Continued Growth GDP GROWTH EXPECTED TO REMAIN STEADY UNEMPLOYMENT RATE EXPECTED TO CONTINUE TO STAY HISTORICALLY LOW Source: FactSet Consensus. Source: FactSet Consensus. Industry Fundamentals Support Continued Room for Growth in Lodging Cycle Demand, Which Historically has a High Correlation to GDP, is Expected to Continue to Grow for the Next Five Years Moderated GDP growth suggests cycle could be elongated Other corollaries, including unemployment and the housing market, continue to improve and support growing demand 2.5% 1.6% 2.2% 1.5% 2.4% 2.5% 2.6% 2.4% 2.4% 2010A 2011A 2012A 2013A 2014A 2015F 2016F 2017F 2018F 9.6% 8.9% 8.1% 7.4% 6.2% 5.3% 4.8% 4.6% 4.7% 2010A 2011A 2012A 2013A 2014A 2015F 2016F 2017F 2018F
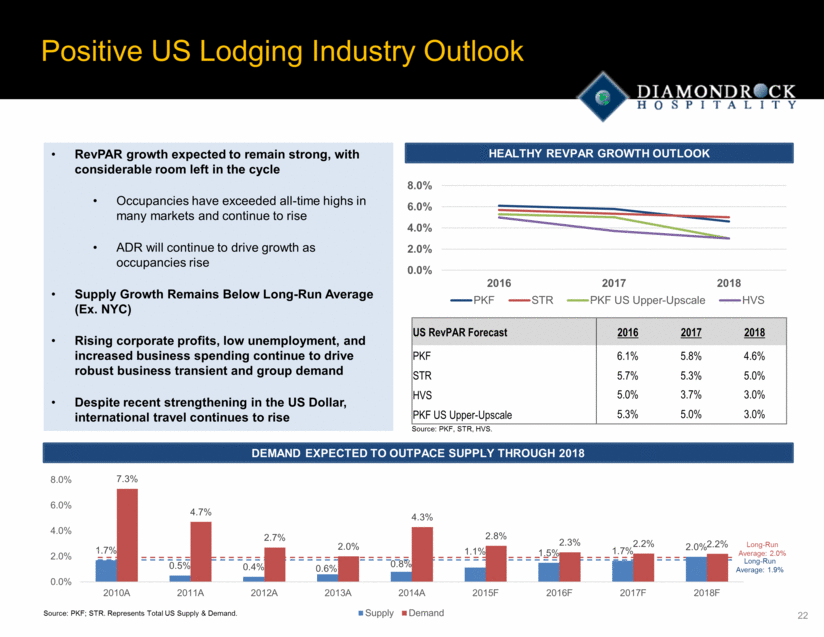
Positive US Lodging Industry Outlook RevPAR growth expected to remain strong, with considerable room left in the cycle Occupancies have exceeded all-time highs in many markets and continue to rise ADR will continue to drive growth as occupancies rise Supply Growth Remains Below Long-Run Average (Ex. NYC) Rising corporate profits, low unemployment, and increased business spending continue to drive robust business transient and group demand Despite recent strengthening in the US Dollar, international travel continues to rise Long-Run Average: 2.0% Long-Run Average: 1.9% DEMAND EXPECTED TO OUTPACE SUPPLY THROUGH 2018 HEALTHY REVPAR GROWTH OUTLOOK Source: PKF; STR. Represents Total US Supply & Demand. US RevPAR Forecast 2016 2017 2018 PKF 6.1% 5.8% 4.6% STR 5.7% 5.3% 5.0% HVS 5.0% 3.7% 3.0% PKF US Upper-Upscale 5.3% 5.0% 3.0% Source: PKF, STR, HVS. 0.0% 2.0% 4.0% 6.0% 8.0% 2016 2017 2018 PKF STR PKF US Upper-Upscale HVS 1.7% 0.5% 0.4% 0.6% 0.8% 1.1% 1.5% 1.7% 2.0% 7.3% 4.7% 2.7% 2.0% 4.3% 2.8% 2.3% 2.2% 2.2% 0.0% 2.0% 4.0% 6.0% 8.0% 2010A 2011A 2012A 2013A 2014A 2015F 2016F 2017F 2018F Supply Demand
APPENDIX
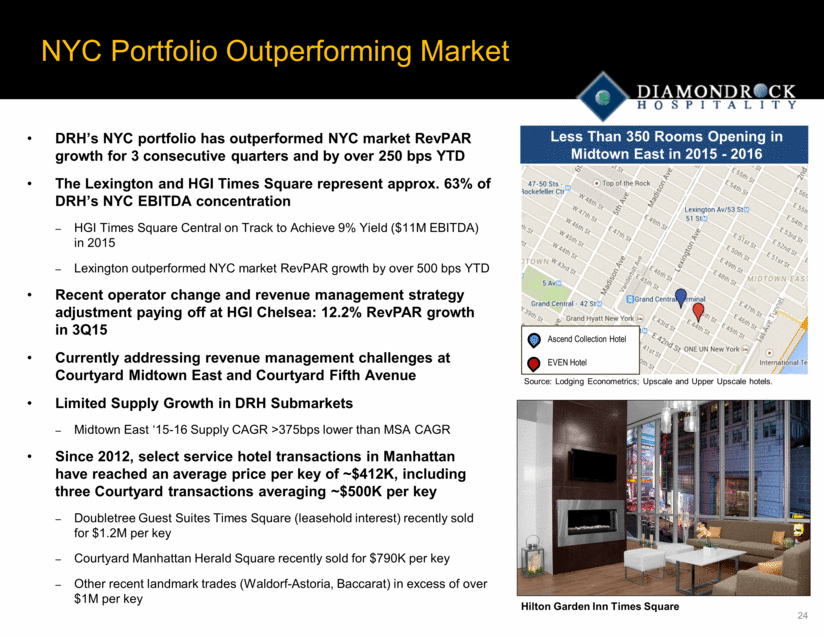
NYC Portfolio Outperforming Market DRH’s NYC portfolio has outperformed NYC market RevPAR growth for 3 consecutive quarters and by over 250 bps YTD The Lexington and HGI Times Square represent approx. 63% of DRH’s NYC EBITDA concentration HGI Times Square Central on Track to Achieve 9% Yield ($11M EBITDA) in 2015 Lexington outperformed NYC market RevPAR growth by over 500 bps YTD Recent operator change and revenue management strategy adjustment paying off at HGI Chelsea: 12.2% RevPAR growth in 3Q15 Currently addressing revenue management challenges at Courtyard Midtown East and Courtyard Fifth Avenue Limited Supply Growth in DRH Submarkets Midtown East ‘15-16 Supply CAGR >375bps lower than MSA CAGR Since 2012, select service hotel transactions in Manhattan have reached an average price per key of ~$412K, including three Courtyard transactions averaging ~$500K per key Doubletree Guest Suites Times Square (leasehold interest) recently sold for $1.2M per key Courtyard Manhattan Herald Square recently sold for $790K per key Other recent landmark trades (Waldorf-Astoria, Baccarat) in excess of over $1M per key Hilton Garden Inn Times Square Ascend Collection Hotel EVEN Hotel Less Than 350 Rooms Opening in Midtown East in 2015 - 2016 Source: Lodging Econometrics; Upscale and Upper Upscale hotels.
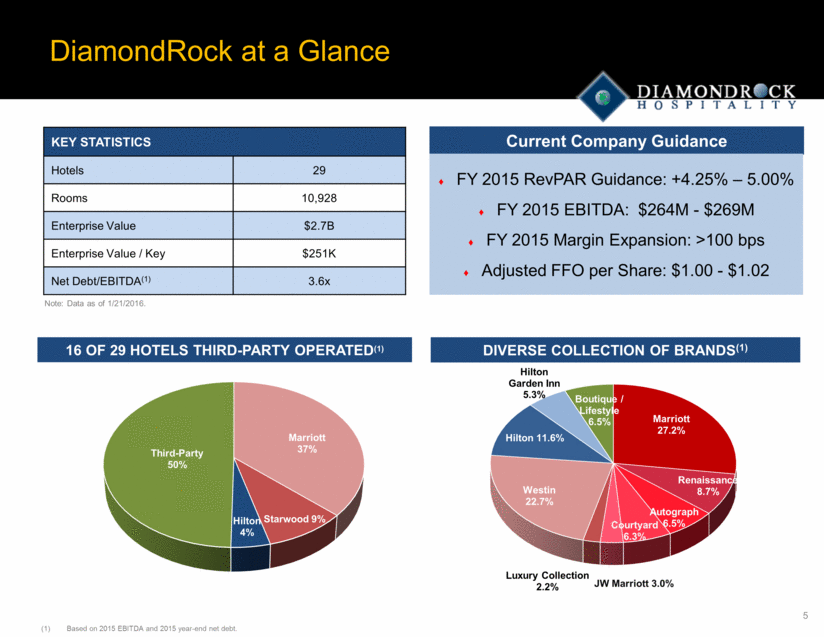
Differentiated Resort & Destination Portfolio Resort & Destination Hotels Command Rate & Margin Premium DRH 2015F Resort RevPAR of $193, represents premium of >10% to broader portfolio >82% average occupancy; ~200bps higher occupancy than broader portfolio 5 of 8 resorts run margins higher than portfolio average Diverse Mix of Demand Generators Approximately one-third group and two-thirds transient demand(1) Resort Group ADR 20% higher than rest of portfolio(1) Leisure transient is highest rated segment with ~30% higher ADR than broader portfolio(1) Strong Performance Through Last Cycle Resort RevPAR CAGR outperformed Upper Upscale CAGR ~150bps from 2007-2014(2) >400bps of net margin growth this cycle(2) Highly favorable supply dynamics with limited new construction for foreseeable future ‘14-16 resort supply CAGR >100bps lower than overall US supply CAGR ‘14-16 Supply CAGR >230bps lower than CBD supply CAGR >10% RevPAR PREMIUM PREMIER RESORT & DESTINATION PORTFOLIO Represents 2015 1H figures and excludes newly acquired Key West Suites. Excludes Frenchman’s Reef, Westin Fort Lauderdale, and Shorebreak Hotel due to major renovation disruption or hotel opening during cycle. DIVERSIFIED DEMAND(1) +10% $ 171 $193 2015 Guidance Resort RevPAR 31% 67% 2% Group Transient Contract
