Attached files
| file | filename |
|---|---|
| 8-K - CHEMICAL FORM 8-K - TCF FINANCIAL CORP | chem8kid_012616.htm |
EXHIBIT 99.1

Strategic Merger: Creating Michigan’s Community Bank And Building Scale in Neighboring States January 26, 2016
| |
Forward – Looking Statements 2 This presentation and the accompanying audio presentation contains forward - looking statements regarding the outlook and expectations of Chemical Financial Corporation (“Chemical” or “CHFC”) and Talmer Bancorp, Inc . (“Talmer” or “TLMR ”) with respect to their planned strategic partnership, including the expected costs to be incurred and cost savings to be realized in connection with the transaction, the expected impact of the transaction on Chemical's future financial performance (including anticipated accretion to earnings per share, tangible book value earn - back period and internal rate of return), the assumed purchase accounting adjustments, credit marks, and intangibles and other key transaction assumptions, anticipated regulatory cost, timing of closing of transaction, and consequences of Talmer’s integration into Chemical . Words such as "anticipated," "estimated," "expected," "projected," "assumed," "approximately," "continued," "should," "will" and variations of such words and similar expressions are intended to identify such forward - looking statements . Pro forma financial information is not a guaranty of future results and is presented for informational purposes only . Forward - looking statements are not guarantees of future financial performance and are subject to risks, uncertainties and assumptions ("risk factors") that are difficult to predict with regard to timing, extent, likelihood and degree of occurrence . Therefore, actual results and outcomes may materially differ from what may be expressed or forecasted in such forward - looking statements . Neither Chemical nor Talmer undertakes any obligation to update, amend or clarify forward - looking statements, whether as a result of new information, future events or otherwise . Risk factors relating both to the transaction and the integration of Talmer into Chemical after closing include, without limitation : • Completion of the transaction is dependent on, among other things, receipt of regulatory approvals and Talmer and Chemical shareholder approvals, the timing of which cannot be predicted with precision at this point and which may not be received at all . • The impact of the completion of the transaction on Chemical's and Talmer’s financial statements will be affected by the timing of the transaction . • The transaction may be more expensive to complete and the anticipated benefits, including anticipated cost savings and strategic gains, may be significantly harder or take longer to achieve than expected or may not be achieved in their entirety as a result of unexpected factors or events . • The integration of Talmer's business and operations into Chemical, which will include conversion of Talmer’s operating systems and procedures, may take longer than anticipated or be more costly than anticipated or have unanticipated adverse results relating to Talmer’s or Chemical's existing businesses . • Chemical’s ability to achieve anticipated results from the transaction is dependent on the state of the economic and financial markets going forward . Specifically, Chemical may incur more credit losses than expected and customer attrition may be greater than expected . In addition, risk factors include, but are not limited to, the risk factors described in Item 1 A of each of Chemical's and Talmer’s Annual Report on Form 10 - K for the year ended December 31 , 2014 . These and other factors are representative of the risk factors that may emerge and could cause a difference between an ultimate actual outcome and a forward - looking statement .
| |
Additional Information 3 Non - GAAP Financial Measures This presentation and the accompanying audio presentation may contain certain non - GAAP financial disclosures that are not in accordance with U . S . generally accepted accounting principles (GAAP) . Chemical and Talmer use certain non - GAAP financial measures to provide meaningful, supplemental information regarding their operational results and to enhance investors’ overall understanding of Chemical’s and Talmer’s financial performance . The limitations associated with non - GAAP financial measures include the risk that persons might disagree as to the appropriateness of items comprising these measures and that different companies might calculate these measures differently . These disclosures should not be considered an alternative to Chemical’s and Talmer’s GAAP results . Additional Information about the Transaction This communication is being made in respect of the merger involving Talmer and Chemical . This communication does not constitute an offer to sell or the solicitation of an offer to buy any securities or a solicitation of any vote or approval . Chemical will file a registration statement on Form S - 4 with the Securities and Exchange Commission (SEC) to register the securities that the Talmer shareholders will receive if the transaction is consummated . The registration statement will contain a prospectus for Chemical and a joint proxy statement to be used by Chemical and Talmer to solicit the required approvals of their respective shareholders of the merger and other relevant documents concerning the transaction . Chemical and Talmer may also file other documents with the SEC concerning the proposed merger . BEFORE MAKING AN INVESTMENT OR VOTING DECISION, INVESTORS AND SHAREHOLDERS OF CHEMICAL AND TALMER ARE URGED TO READ THE REGISTRATION STATEMENT, THE PROSPECTUS AND JOINT PROXY STATEMENT, AND ANY OTHER RELEVANT DOCUMENTS WHEN THEY BECOME AVAILABLE BECAUSE THEY WILL CONTAIN IMPORTANT INFORMATION ABOUT CHEMICAL, TALMER, AND THE TRANSACTION . Investors will be able to obtain these documents free of charge at the SEC’s website at www . sec . gov . Copies of the documents filed with the SEC in connection with the merger can also be obtained, when available, without charge, from Chemical’s website at http : //www . chemicalbankmi . com (which website is not incorporated herein by reference), or by contacting Chemical Financial Corporation, 235 East Main Street, P . O . Box 569 , Midland, MI 48640 - 0569 , Attention : Ms . Lori A . Gwizdala, Investor Relations, telephone 800 - 867 - 9757 , or at Talmer’s website at http : //www . talmerbank . com (which website is not incorporated herein by reference), or by contacting Talmer Bancorp, Inc . , 2301 West Big Beaver Road, Suite 525 , Troy, Michigan 48084 , Attention : Mr . Brad Adams, Investor Relations, telephone 248 - 498 - 2862 . Participants in the Merger Solicitation Chemical and Talmer , and their respective directors, executive officers, and certain other members of management and employees, may be soliciting proxies from Chemical and Talmer shareholders in favor of the transaction . Information regarding the persons who may, under the rules of the SEC, be considered participants in the solicitation of Chemical and Talmer shareholders in connection with the proposed transaction will be set forth in the prospectus and joint proxy statement when it is filed with the SEC . Free copies of this document may be obtained as described above . Information about Chemical’s directors and executive officers can be found in Chemical’s definitive proxy statement in connection with its 2015 annual meeting of shareholders, as filed with the SEC on March 6 , 2015 , and other documents subsequently filed by Chemical with the SEC . Information about Talmer’s directors and executive officers can be found in Talmer’s definitive proxy statement in connection with its 2015 annual meeting of shareholders, as filed with the SEC on April 27 , 2015 , and other documents subsequently filed by Talmer with the SEC . Additional information regarding the interests of such participants will be included in the prospectus and joint proxy statement and other relevant documents regarding the merger filed with the SEC when they become available .
| |
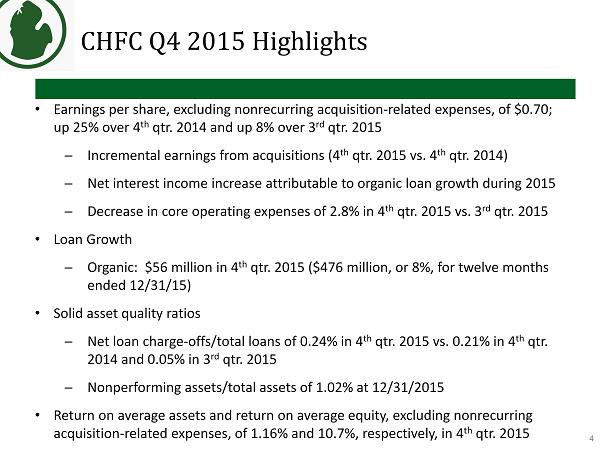
CHFC Q4 2015 Highlights • Earnings per share, excluding nonrecurring acquisition - related expenses, of $0.70; up 25% over 4 th qtr. 2014 and up 8% over 3 rd qtr. 2015 ─ Incremental earnings from acquisitions (4 th qtr. 2015 vs. 4 th qtr. 2014) ─ Net interest income increase attributable to organic loan growth during 2015 ─ Decrease in core operating expenses of 2.8% in 4 th qtr. 2015 vs. 3 rd qtr. 2015 • Loan Growth ─ Organic: $56 million in 4 th qtr. 2015 ($476 million, or 8%, for twelve months ended 12/31/15) • Solid asset quality ratios ─ Net loan charge - offs/total loans of 0.24% in 4 th qtr. 2015 vs. 0.21% in 4 th qtr. 2014 and 0.05% in 3 rd qtr. 2015 ─ Nonperforming assets/total assets of 1.02% at 12/31/2015 • Return on average assets and return on average equity, excluding nonrecurring acquisition - related expenses, of 1.16% and 10.7%, respectively, in 4 th qtr. 2015 4
| |

CHFC Income Statement Highlights Financial Highlights (in thousands except per share data) 2015 4 th Qtr. 2014 4 th Qtr. 2015 3 rd Qtr. Net interest income $75,476 $58,244 $73,617 Provision for loan losses 2,000 1,500 1,500 Noninterest income 20,052 18,227 20,215 Operating expenses (1) 55,739 48,477 57,365 Acquisition - related expenses 2,085 4,139 900 Net income 25,504 15,305 24,467 Diluted EPS 0.66 0.46 0.64 Diluted EPS – excl. nonrecurring acquisition - related expenses 0.70 0.56 0.65 Avg. Diluted Shares Outstanding 38,498 33,033 38,393 Prior - Year Quarter Comparison • Significant increase in net interest income; attributable to $476 million, or 8%, organic growth in total loans during the twelve months ended December 31, 2015 • Impact of acquisitions of Northwestern Bancorp, Inc. (“Northwestern”), Monarch Community Bancorp, Inc. (“Monarch”) and Lake Michigan Financial Corporation (“LMFC”) Prior Quarter Comparison • Increase in net interest income • Reduction in operating expenses Return on Avg. Assets 1.10% 0.87% 1.05% Return on Avg. Shareholders’ Equity 10.1% 7.5% 9.8% Efficiency Ratio 57.1% 62.2% 59.9% Tangible Equity/ Total Assets 8.0% 8.4% 7.8% Tangible Book Value/Share $18.78 $18.57 $18.32 (1) Excludes acquisition - related expenses 5
| |
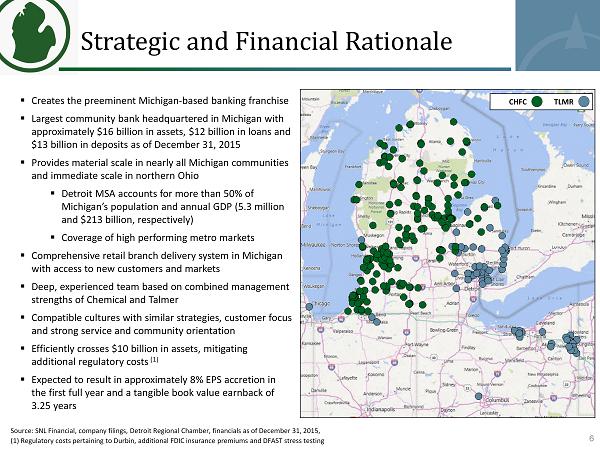
Strategic and Financial Rationale 6 ▪ Creates the preeminent Michigan - based banking franchise ▪ Largest community bank headquartered in Michigan with approximately $16 billion in assets, $12 billion in loans and $13 billion in deposits as of December 31, 2015 ▪ Provides material scale in nearly all Michigan communities and immediate scale in northern Ohio ▪ Detroit MSA accounts for more than 50% of Michigan’s population and annual GDP (5.3 million and $213 billion, respectively) ▪ Coverage of high performing metro markets ▪ Comprehensive retail branch delivery system in Michigan with access to new customers and markets ▪ Deep, experienced team based on combined management strengths of Chemical and Talmer ▪ Compatible cultures with similar strategies, customer focus and strong service and community orientation ▪ Efficiently crosses $10 billion in assets, mitigating additional regulatory costs (1) ▪ Expected to result in approximately 8% EPS accretion in the first full year and a tangible book value earnback of 3.25 years CHFC TLMR Source: SNL Financial, company filings, Detroit Regional Chamber, financials as of December 31, 2015, (1) Regulatory costs pertaining to Durbin, additional FDIC insurance premiums and DFAST stress testing
| |
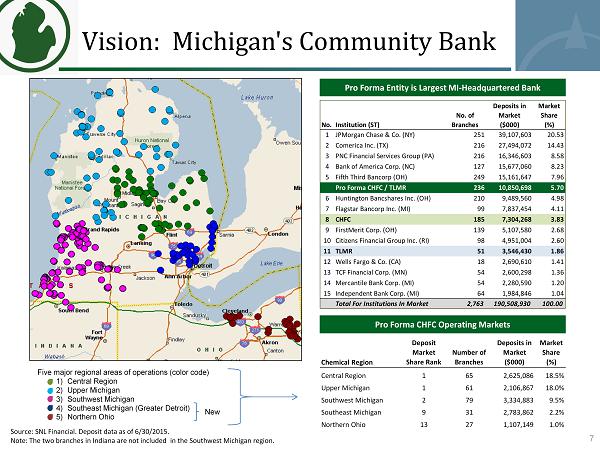
No.Institution (ST) No. of Branches Deposits in Market ($000) Market Share (%) 1 JPMorgan Chase & Co. (NY) 251 39,107,603 20.53 2 Comerica Inc. (TX) 216 27,494,072 14.43 3 PNC Financial Services Group (PA) 216 16,346,603 8.58 4 Bank of America Corp. (NC) 127 15,677,060 8.23 5 Fifth Third Bancorp (OH) 249 15,161,647 7.96 Pro Forma CHFC / TLMR 236 10,850,698 5.70 6 Huntington Bancshares Inc. (OH) 210 9,489,560 4.98 7 Flagstar Bancorp Inc. (MI) 99 7,837,454 4.11 8 CHFC 185 7,304,268 3.83 9 FirstMerit Corp. (OH) 139 5,107,580 2.68 10 Citizens Financial Group Inc. (RI) 98 4,951,004 2.60 11 TLMR 51 3,546,430 1.86 12 Wells Fargo & Co. (CA) 18 2,690,610 1.41 13 TCF Financial Corp. (MN) 54 2,600,298 1.36 14 Mercantile Bank Corp. (MI) 54 2,280,590 1.20 15 Independent Bank Corp. (MI) 64 1,984,846 1.04 Total For Institutions In Market 2,763 190,508,930 100.00 Vision: Michigan's Community Bank Pro Forma Entity is Largest MI - Headquartered Bank Pro Forma CHFC Operating Markets Five major regional areas of operations (color code) 1) Central Region 2) Upper Michigan 3) Southwest Michigan 4) Southeast Michigan (Greater Detroit) 5) Northern Ohio New 7 Source: SNL Financial. Deposit data as of 6/30/2015 . Note: The two branches in Indiana are not included in the Southwest Michigan region. Chemical Region Deposit Market Share Rank Number of Branches Deposits in Market ($000) Market Share (%) Central Region 1 65 2,625,086 18.5% Upper Michigan 1 61 2,106,867 18.0% Southwest Michigan 2 79 3,334,883 9.5% Southeast Michigan 9 31 2,783,862 2.2% Northern Ohio 13 27 1,107,149 1.0%
| |
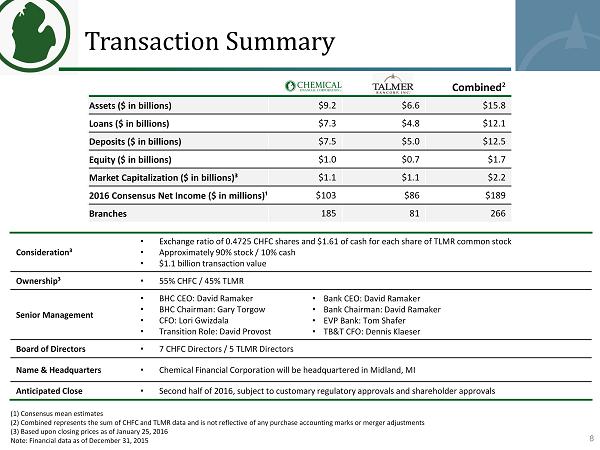
Transaction Summary 8 Combined ² Assets ($ in billions) $9.2 $6.6 $15.8 Loans ($ in billions) $7.3 $4.8 $12.1 Deposits ($ in billions) $7.5 $5.0 $12.5 Equity ($ in billions) $1.0 $0.7 $1.7 Market Capitalization ($ in billions)³ $1.1 $1.1 $2.2 2016 Consensus Net Income ($ in millions)¹ $103 $86 $189 Branches 185 81 266 (1) Consensus mean estimates (2) Combined represents the sum of CHFC and TLMR data and is not reflective of any purchase accounting marks or merger adjustments (3) Based upon closing prices as of January 25, 2016 Note: Financial data as of December 31, 2015 Consideration³ • Exchange ratio of 0.4725 CHFC shares and $1.61 of cash for each share of TLMR common stock • Approximately 90% stock / 10% cash • $1.1 billion transaction value Ownership³ • 55% CHFC / 45% TLMR Senior Management • BHC CEO: David Ramaker • BHC Chairman: Gary Torgow • CFO: Lori Gwizdala • Transition Role: David Provost Board of Directors • 7 CHFC Directors / 5 TLMR Directors Name & Headquarters • Chemical Financial Corporation will be headquartered in Midland, MI Anticipated Close • Second half of 2016, subject to customary regulatory approvals and shareholder approvals • Bank CEO: David Ramaker • Bank Chairman : David Ramaker • EVP Bank: Tom Shafer • TB&T CFO : Dennis Klaeser
| |
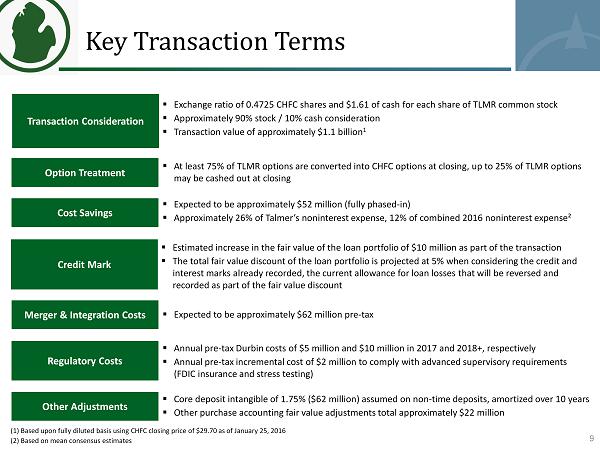
▪ Exchange ratio of 0.4725 CHFC shares and $1.61 of cash for each share of TLMR common stock ▪ Approximately 90% stock / 10% cash consideration ▪ Transaction value of approximately $ 1.1 billion 1 Transaction Consideration Other Adjustments ▪ Core deposit intangible of 1.75% ($62 million) assumed on non - time deposits, amortized over 10 years ▪ Other purchase accounting fair value adjustments total approximately $22 million Key Transaction Terms 9 Merger & Integration Costs ▪ Expected to be approximately $62 million pre - tax Regulatory Costs ▪ Annual pre - tax Durbin costs of $5 million and $ 10 million in 2017 and 2018+, respectively ▪ Annual pre - tax incremental cost of $2 million to comply with advanced supervisory requirements (FDIC insurance and stress testing) Cost Savings ▪ Expected to be approximately $52 million (fully phased - in) ▪ Approximately 26% of Talmer’s noninterest expense, 12% of combined 2016 noninterest expense² ▪ At least 75% of TLMR options are converted into CHFC options at closing, up to 25% of TLMR options may be cashed out at closing Option Treatment Credit Mark ▪ Estimated increase in the fair value of the loan portfolio of $10 million as part of the transaction ▪ The total fair value discount of the loan portfolio is projected at 5% when considering the credit and interest marks already recorded , the current allowance for loan losses that will be reversed and recorded as part of the fair value discount (1) Based upon fully diluted basis using CHFC closing price of $29.70 as of January 25, 2016 (2) Based on mean consensus estimates
| |

2017e EPS Accretion ¹ IRR ² Tangible Book Value Earnback Period ³ As of December 31, 2015 Pro Capital Ratios CHFC TLMR Forma ⁴ TCE/TA Leverage Ratio Common Equity Tier 1 Ratio Tier 1 Ratio Total Risk-based Capital Ratio Strong EPS Accretion, IRR & Robust Capital Position 10 10 Key Transaction Impacts to CHFC 20 - 21% 8 % 3.25 years 8.1% 8.6% 10.6% 10.7% 11.8% 10.8% 10.2% 12.0% 12.0% 13.0% 8.2% 8.4% 10.1% 10.3% 10.9% (1) Estimated financial impact is presented solely for illustrative purposes using mean analyst estimates per research analyst re por ts. Includes purchase accounting marks and cost savings (2) From the perspective of CHFC assuming a terminal multiple of 13.0x (3) Tangible Book Value Earnback Period per the cross - over method (4) Pro Forma Capital Ratios projected for a June 30, 2016 close, including purchase accounting for the transaction
| |
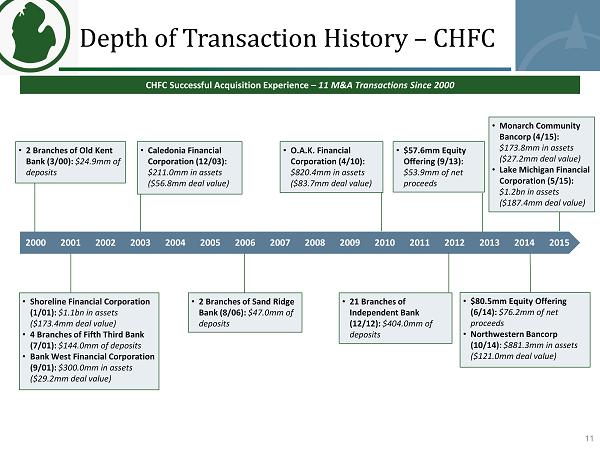
Depth of Transaction History – CHFC CHFC Successful Acquisition Experience – 11 M&A Transactions Since 2000 • 2 Branches of Old Kent Bank (3/00): $24.9mm of deposits • $80.5mm Equity Offering (6/14): $76.2mm of net proceeds • Northwestern Bancorp (10/14): $881.3mm in assets ($121.0mm deal value) 2000 2001 2002 2003 2004 2005 2006 2007 2008 2009 2010 2011 2012 2013 2014 2015 • Shoreline Financial Corporation (1/01): $1.1bn in assets ($173.4mm deal value) • 4 Branches of Fifth Third Bank (7/01): $144.0mm of deposits • Bank West Financial Corporation (9/01): $300.0mm in assets ($ 29.2mm deal value) • Caledonia Financial Corporation (12/03): $ 211.0mm in assets ($ 56.8mm deal value) • 2 Branches of Sand Ridge Bank (8/06): $47.0mm of deposits • O.A.K . Financial Corporation (4/10): $ 820.4mm in assets ($83.7mm deal value) • Monarch Community Bancorp (4/15): $173.8mm in assets ($27.2mm deal value) • Lake Michigan Financial Corporation (5/15): $1.2bn in assets ($ 187.4mm deal value) • $ 57.6mm Equity Offering (9/13): $53.9mm of net proceeds • 21 Branches of Independent Bank (12/12): $404.0mm of deposits 11
| |
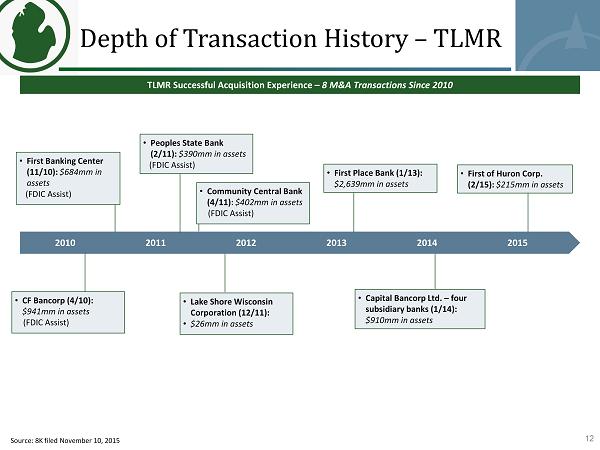
2010 2011 2012 2013 2014 2015 Depth of Transaction History – TLMR TLMR Successful Acquisition Experience – 8 M&A Transactions Since 2010 • Capital Bancorp Ltd. – four subsidiary banks (1/14 ): $ 910mm in assets • First Banking Center (11/10): $684mm in assets ( FDIC Assist) • First of Huron Corp. (2/15): $215mm in assets • First Place Bank (1/13): $2,639mm in assets • Lake Shore Wisconsin Corporation (12/11): • $26mm in assets • Community Central Bank (4/11): $402mm in assets ( FDIC Assist ) • Peoples State Bank (2/11): $390mm in assets (FDIC Assist) • CF Bancorp (4/10): $941mm in assets ( FDIC Assist) 12 Source: 8K filed November 10, 2015
| |

Q&A 13 David B. Ramaker Chairman, Chief Executive Officer and President Lori A. Gwizdala Executive Vice President and Chief Financial Officer David T. Provost Chief Executive Officer and President Dennis L. Klaeser Chief Financial Officer and Executive Managing Director Presented by:
| |
14 Hunter Green: 0 98 37 Grey: 136 163 182 Blue: 51 102 153 Light Green: 153 204 0 Appendix
| |
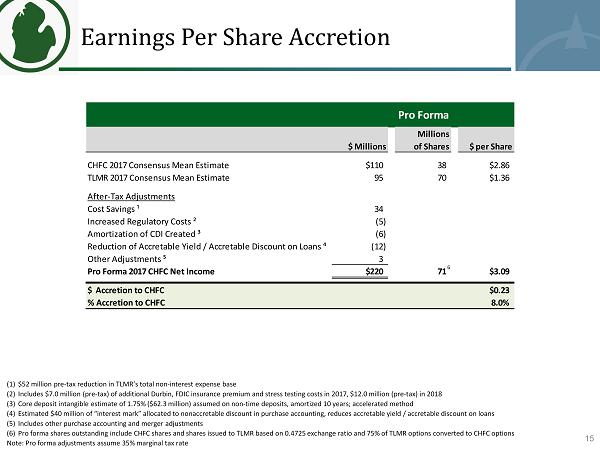
Earnings Per Share Accretion 15 (1) $52 million pre - tax reduction in TLMR’s total non - interest expense base (2) Includes $7.0 million (pre - tax) of additional Durbin , FDIC insurance premium and stress testing costs in 2017, $ 12.0 million (pre - tax) in 2018 (3) Core deposit intangible estimate of 1.75% ($62.3 million) assumed on non - time deposits, amortized 10 years; accelerated method (4) Estimated $40 million of “interest mark” allocated to nonaccretable discount in purchase accounting, reduces accretable yield / accretable discount on loans (5) Includes other purchase accounting and merger adjustments (6) Pro forma shares outstanding include CHFC shares and shares issued to TLMR based on 0.4725 exchange ratio and 75% of TLMR opt ion s converted to CHFC options Note : Pro forma adjustments assume 35% marginal tax rate Pro Forma $ Millions Millions of Shares $ per Share CHFC 2017 Consensus Mean Estimate $110 38 $2.86 TLMR 2017 Consensus Mean Estimate 95 70 $1.36 After-Tax Adjustments Cost Savings ¹ 34 Increased Regulatory Costs ² (5) Amortization of CDI Created ³ (6) Reduction of Accretable Yield / Accretable Discount on Loans ⁴ (12) Other Adjustments ⁵ 3 Pro Forma 2017 CHFC Net Income $220 71 $3.09 $ Accretion to CHFC $0.23 % Accretion to CHFC 8.0% 6
| |
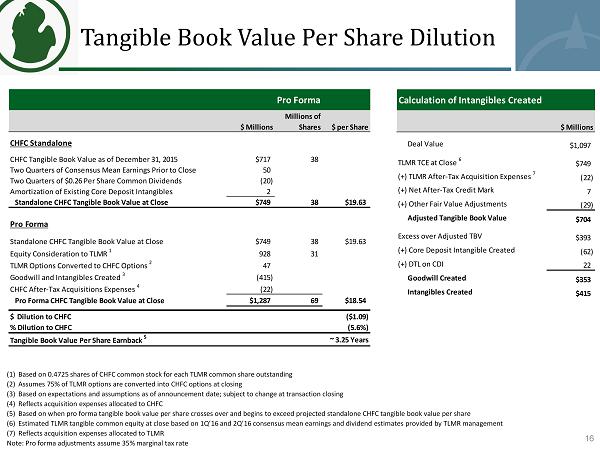
Tangible Book Value Per Share Dilution 16 (1) Based on 0.4725 shares of CHFC common stock for each TLMR common share outstanding (2) Assumes 75% of TLMR options are converted into CHFC options at closing (3) Based on expectations and assumptions as of announcement date; subject to change at transaction closing (4) Reflects acquisition expenses allocated to CHFC (5) Based on when pro forma tangible book value per share crosses over and begins to exceed projected standalone CHFC tangible bo ok value per share (6) Estimated TLMR tangible common equity at close based on 1Q’16 and 2Q’16 consensus mean earnings and dividend estimates provid ed by TLMR management (7) Reflects acquisition expenses allocated to TLMR Note: Pro forma adjustments assume 35% marginal tax rate Pro Forma $ Millions Millions of Shares $ per Share CHFC Standalone CHFC Tangible Book Value as of December 31, 2015 $717 38 Two Quarters of Consensus Mean Earnings Prior to Close 50 Two Quarters of $0.26 Per Share Common Dividends (20) Amortization of Existing Core Deposit Intangibles 2 Standalone CHFC Tangible Book Value at Close $749 38 $19.63 Pro Forma Standalone CHFC Tangible Book Value at Close $749 38 $19.63 Equity Consideration to TLMR 1 928 31 TLMR Options Converted to CHFC Options 2 47 Goodwill and Intangibles Created 3 (415) CHFC After-Tax Acquisitions Expenses 4 (22) Pro Forma CHFC Tangible Book Value at Close $1,287 69 $18.54 $ Dilution to CHFC ($1.09) % Dilution to CHFC (5.6%) Tangible Book Value Per Share Earnback 5 ~ 3.25 Years Calculation of Intangibles Created $ Millions Deal Value $1,097 TLMR TCE at Close 6 $749 (+) TLMR After-Tax Acquisition Expenses 7 (22) (+) Net After-Tax Credit Mark 7 (+) Other Fair Value Adjustments (29) Adjusted Tangible Book Value $704 Excess over Adjusted TBV $393 (+) Core Deposit Intangible Created (62) (+) DTL on CDI 22 Goodwill Created $353 Intangibles Created $415
| |

(1) Defined as noninterest expense divided by total revenue, adjusted for (expense)/benefit due to change in the fair value of lo an servicing rights, FDIC loss sharing income, transaction and integration related costs and net loss on early termination of FDIC loss share and warra nt agreements (2) Excludes $13.9mm after - tax net loss on early termination of FDIC loss share and warrant agreements ▪ $6.6 billion bank h olding c ompany - Headquartered in Troy, MI (Greater Detroit MSA) ▪ A high performing Midwest Bank - Built through o rganic g rowth & successful a cquisitions - Experience and accomplished Executive Management team - 81 branches (51 in South MI, 27 in Northern OH) ▪ Strong operating performance - Attractive NIM, even when excluding Excess Accretable Yield - Core efficiency ratio (1) of 59.5% in 4Q’15 - Low cost deposit funding ▪ Recapitalized and retooled several banking platforms following the distress of the previous credit crisis (recession) - Completed 8 acquisitions in 5 years - Streamlining and redundancy work complete - Well past pruning phase, well into net growth phase ▪ 4Q’15 Financial Performance - Record core earnings (2) ($ 27.0 mm) for quarter - 10.8% TCE ratio, 12.0% CET1 ratio - NPLs / Loans – 1.2% - Loss share agreement extinguished in 4Q’15 ● $9.2 billion financial holding c ompany - Headquartered in Midland, MI ● Preeminent Michigan banking franchise outside of Detroit MSA - Capitalizing on and contributing to Michigan’s vibrant economy - Recent strategic acquisitions have enhanced organization’s market presence, banking capabilities and earnings power ● Strong operating performance history through cycles ● Scalable core strategies ● Proven ability to increase market share in core markets through: - Strong organic growth - Accretive acquisitions (4 deals since 2010) ● Clean balance sheet - Well capitalized (8.1% TCE ratio, 11.8% Total RBC ratio) - High asset quality ● 4Q’15 Financial Performance - Earnings per share, excluding nonrecurring acquisition - related expenses, of $0.70; up 25% over 4th qtr. 2014 and up 8% over 3rd qtr. 2015 Overview of Merger Partners 17
| |
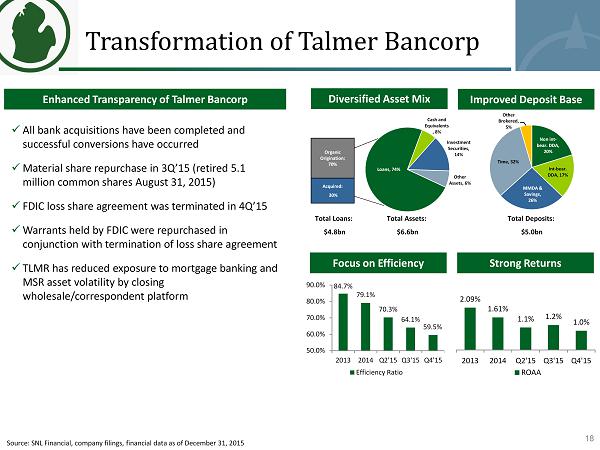
Transformation of Talmer Bancorp 18 Enhanced Transparency of Talmer Bancorp x All bank acquisitions have been completed and successful conversions have occurred x Material share repurchase in 3Q’15 (retired 5.1 million common shares August 31, 2015) x FDIC loss share agreement was terminated in 4Q’15 x Warrants held by FDIC were repurchased in conjunction with termination of loss share agreement x TLMR has reduced exposure to mortgage banking and MSR asset volatility by closing wholesale/correspondent platform 18 Diversified Asset Mix Improved Deposit Base 84.7% 79.1% 70.3% 64.1% 59.5% 50.0% 60.0% 70.0% 80.0% 90.0% 2013 2014 Q2'15 Q3'15 Q4'15 Efficiency Ratio Focus on Efficiency Strong Returns 2.09% 1.61% 1.1% 1.2% 1.0% 2013 2014 Q2'15 Q3'15 Q4'15 ROAA Total Deposits: $5.0bn Organic Origination: 70% Acquired: 30% Loans, 74% Cash and Equivalents , 8% Investment Securities, 14% Other Assets, 6% Total Loans: $4.8bn Total Assets: $6.6bn Non int - bear. DDA, 20% Int - bear. DDA, 17% MMDA & Savings, 26% Time, 32% Other Brokered, 5% Source: SNL Financial, company filings, financial data as of December 31, 2015
| |
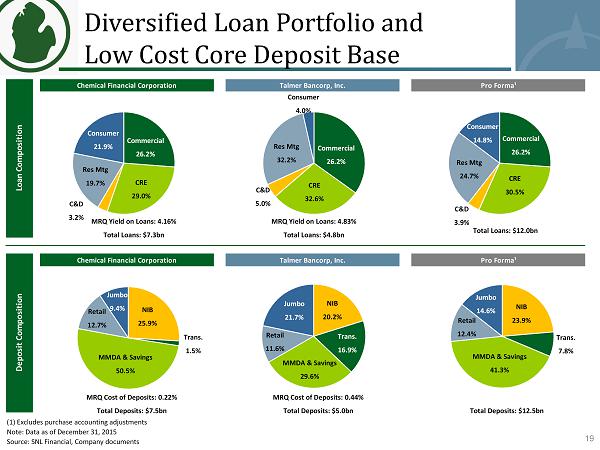
Diversified Loan Portfolio and Low Cost Core Deposit Base 19 (1) Excludes purchase accounting adjustments Note: Data as of December 31, 2015 Source: SNL Financial, Company documents Chemical Financial Corporation Talmer Bancorp, Inc. Pro Forma¹ MRQ Yield on Loans: 4.54% Total Loans: $12.0 Chemical Financial Corporation Talmer Bancorp, Inc. Pro Forma¹ MRQ Cost of Deposits: 0.23% MRQ Cost of Deposits: 0.33% MRQ Cost of Deposits: 0.27% Loan Composition Deposit Composition Commercial 26.2% CRE 32.6% C&D 5.0% Res Mtg 32.2% Jumbo 9.4% NIB 25.9% Trans. 1.5% MMDA & Savings 50.5% Retail 12.7% Jumbo 21.7% NIB 20.2% Trans. 16.9% MMDA & Savings 29.6% Retail 11.6% Jumbo 14.6% NIB 23.9% Trans. 7.8% MMDA & Savings 41.3% Retail 12.4% MRQ Yield on Loans: 4.16% Total Loans: $7.3bn MRQ Yield on Loans: 4.83% Total Loans: $4.8bn Total Loans: $12.0bn MRQ Cost of Deposits: 0.22% Total Deposits: $7.5bn MRQ Cost of Deposits: 0.44% Total Deposits: $5.0bn Total Deposits: $12.5bn Consumer 4.0% Commercial 26.2% CRE 29.0% C&D 3.2% Res Mtg 19.7% Consumer 21.9% Commercial 26.2% CRE 30.5% C&D 3.9% Res Mtg 24.7% Consumer 14.8%