Attached files
| file | filename |
|---|---|
| 8-K - INDEPENDENT BANK CORPORATION 8-K 1-25-2016 - INDEPENDENT BANK CORP /MI/ | form8k.htm |
| EX-99.1 - EXHIBIT 99.1 - INDEPENDENT BANK CORP /MI/ | ex99_1.htm |
| EX-99.2 - EXHIBIT 99.2 - INDEPENDENT BANK CORP /MI/ | ex99_2.htm |
Exhibit 99.3

Independent Bank Corporation Earnings Conference Call 4th Quarter 2015 (january 25, 2016)

2 Cautionary Note Regarding Forward-Looking Statements This presentation contains forward-looking statements within the meaning of the Private Securities Litigation Reform Act of 1995, including statements of goals, intentions, and expectations as to future trends, plans, events, or results of Independent Bank Corporation’s operations and policies, including, but not limited to, Independent Bank Corporation’s outlook on earnings and the sufficiency of the allowance for loan losses, and statements regarding asset quality, projections of future revenue, earnings or other measures of economic performance, Independent Bank Corporation’s plans and expectations regarding non-performing assets, business opportunities, and general economic conditions. Forward-looking statements include expressions such as “will,” “may,” “should,” “believe,” “expect,” “forecast,” “anticipate,” “estimate,” “project,” “intend,” “likely,” “optimistic” and “plan,” and similar words or phrases, which are necessarily statements of belief as to expected outcomes of future events. These statements are based on current and anticipated economic conditions, nationally and in Independent Bank Corporation’s markets, interest rates and interest rate policy, competitive factors, and other conditions which by their nature are not susceptible to accurate forecast and are subject to significant uncertainty. Because of these uncertainties and the assumptions on which this presentation and the forward-looking statements are based, actual future operations and results may differ materially from those indicated in this presentation. For a discussion of certain factors, risks and uncertainties which could cause actual future operations and results to differ from estimates and projections discussed in these forward-looking statements, please read the “Risk Factors” section in Independent Bank Corporation’s 2014 Annual Report on Form 10-K. You should not place undue reliance on any such forward-looking statement. These forward-looking statements are not guarantees of future performance. Independent Bank Corporation does not undertake to publicly revise or update forward-looking statements in this presentation to reflect events or circumstances that arise after the date of this presentation.

3 Agenda Formal Remarks.William B. (Brad) Kessel, President and Chief Executive OfficerRobert N. Shuster, Executive Vice President and Chief Financial OfficerQuestion and Answer session.Closing Remarks.Note: This presentation is available at www.IndependentBank.com in the Investor Relations area under the “Presentations” tab.
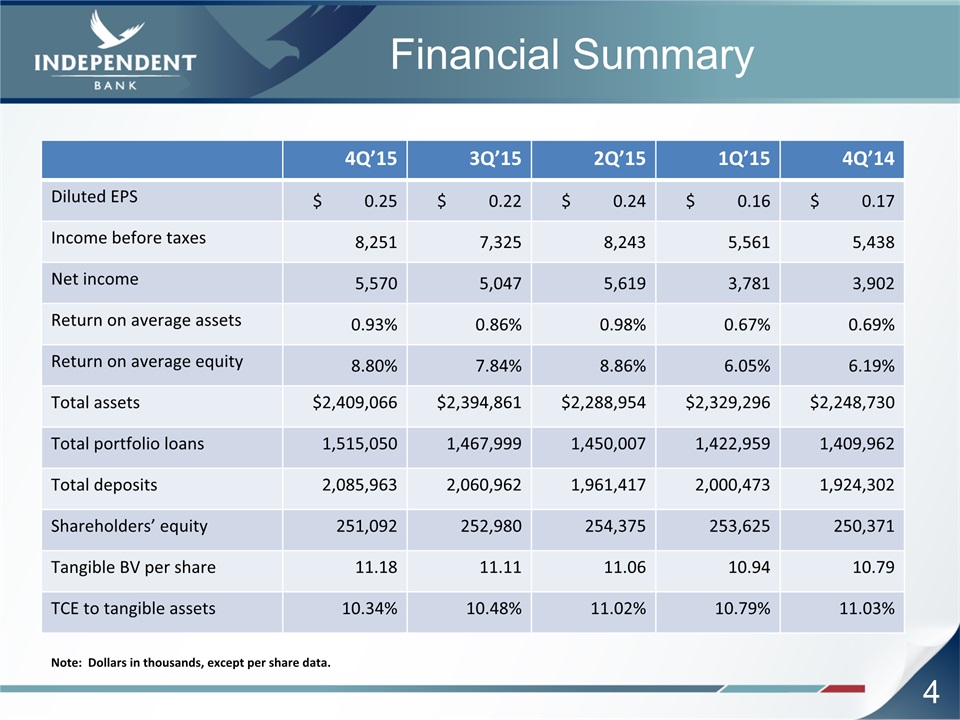
4 Financial Summary 4Q’15 3Q’15 2Q’15 1Q’15 4Q’14 Diluted EPS $ 0.25 $ 0.22 $ 0.24 $ 0.16 $ 0.17 Income before taxes 8,251 7,325 8,243 5,561 5,438 Net income 5,570 5,047 5,619 3,781 3,902 Return on average assets 0.93% 0.86% 0.98% 0.67% 0.69% Return on average equity 8.80% 7.84% 8.86% 6.05% 6.19% Total assets $2,409,066 $2,394,861 $2,288,954 $2,329,296 $2,248,730 Total portfolio loans 1,515,050 1,467,999 1,450,007 1,422,959 1,409,962 Total deposits 2,085,963 2,060,962 1,961,417 2,000,473 1,924,302 Shareholders’ equity 251,092 252,980 254,375 253,625 250,371 Tangible BV per share 11.18 11.11 11.06 10.94 10.79 TCE to tangible assets 10.34% 10.48% 11.02% 10.79% 11.03% Note: Dollars in thousands, except per share data.

5 4Q 2015 Financial Highlights Income StatementNet income of $5.6 million, or $0.25 per diluted share.Net interest income of $19.4 million, up $1.3 million, or 7.2%, from year ago quarter.$1.7 million credit loan loss provision.Gains on mortgage loans of $1.7 million, up $0.2 million, or 15.0% from year ago quarter.Impairment charge recovery on MSR’s of $0.8 million ($0.024 per diluted share after tax). Continue to focus on long-term profitability through organic growth.Balance Sheet/CapitalTotal portfolio loans grew $47.1 million, or 12.7% annualized (4.0% annualized, excluding bulk loan purchase).Investment securities totaled $585 million at 12/31/15 compared to $605 million at 9/30/15.Deposits totaled $2.09 billion at 12/31/15 compared to $2.06 billion at 9/30/15.Repurchased 308,037 shares at an average price of $14.52 per share. TBV per share increased to $11.18 at 12/31/15 from $11.11 at 9/30/15.Paid an eight cent per share cash dividend on common stock on 11/16/15.

6 2015 Annual Financial Highlights Income StatementNet income of $20.0 million, up $2.0 million, or 11.1%, over 2014.Diluted EPS of 86 cents, up nine cents, or 11.7%, over 2014.Net interest income of $75.0 million, up $1.7 million, or 2.4% over 2014.Improved asset quality metrics led to $2.7 million credit loan loss provision. Loan net charge-offs declined by $2.5 million, or 77.9% year-over year.Non-interest expenses reduced by $1.5 million, or 1.7% year-over-year.Balance Sheet/CapitalTotal portfolio loans grew $105.1 million, or 7.5% year-over-year (5.2% growth excluding bulk loan purchase).NPAs reduced $3.8 million, or 17.6% year-over-year. NPA’s equaled 0.74% of total assets at 12/31/15.Total deposits grew $161.7 million, or 8.4% year-over-year.Repurchased 967,199 shares at an average price of $13.96 per share. TBV per share increased by 3.6% to $11.18 at 12/31/15, from $10.79 at 12/31/14.

7 Our Michigan Markets Since 2012, substantial changes have been implemented to streamline and optimize our branch delivery network.Significant market presence and opportunity to gain market share in attractive Michigan markets. Michigan’s unemployment rate was 5.1% in November 2015 (1.4% lower than one year ago).Michigan payroll jobs totaled 4.279 million in November 2015 (72K higher than one year ago).S&P/Case-Shiller MI Detroit Home Price Index up 5.3% year over year (October 2015 vs. October 2014).

8 Our Markets – Regional Region Cities Branches 12/31/15 Loans(1) % ofLoans(1) 12/31/15Deposits(3) % of Deposits(3) 12/31/14 Loans(2) 12/31/14 Deposits(3) East / “Thumb” Bay City / Saginaw 23 $304 23% $715 36% $295 $696 West Grand Rapids / Ionia 22 499 37% 649 32% 454 579 Central Lansing 11 194 15% 321 16% 184 298 Southeast Troy 7 334 25% 314 16% 309 247 Total 63 $1,331 100% $1,999 100% $1,242 $1,820 Note: Dollars are in millions.Loans exclude those related to resort lending ($116 million), payment plan receivables ($35 million) and purchased mortgage loans ($33 million).Loans exclude those related to resort lending ($128 million) and payment plan receivables ($40 million). Deposits exclude reciprocal deposits, brokered deposits and certain other “non-market” deposits.

9 Low Cost Deposit Franchise Focused on Core Deposit Growth Deposit Highlights$2.09 billion in total deposits at 12/31/15.Substantially all core funding.$1.66 billion of transaction accounts (79.6% of total deposits).Total deposits increased $161.7 million, or 8.4% since 12/31/14.Average deposits per branch of $33.1 million at 12/31/15 vs. $20.2 million at 12/31/11 (an increase of 63.9%).2015 recap:Commercial – small to middle market business and public funds.Treasury management services.Retail – checking accounts and debit card services. Introduced new retail checking line up and direct mail program in October 2015.Branch consolidation completed on 4/30/15.Sale of Midland branch closed on 8/28/15. Deposit Composition – 12/31/15 Cost of Deposits (%)
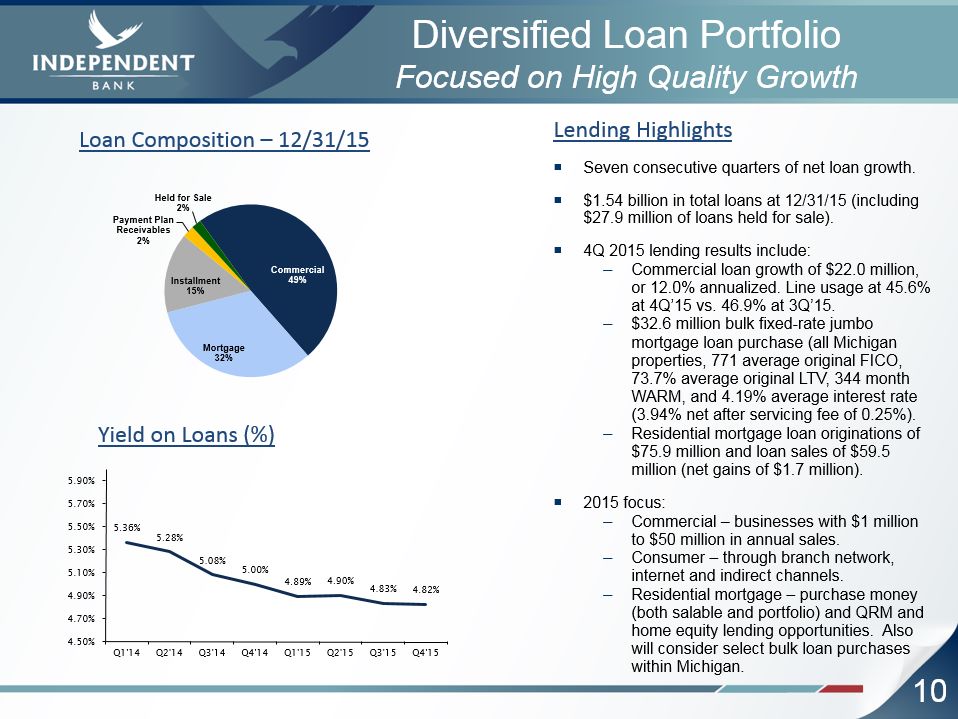
10 Diversified Loan PortfolioFocused on High Quality Growth Lending HighlightsSeven consecutive quarters of net loan growth.$1.54 billion in total loans at 12/31/15 (including $27.9 million of loans held for sale).4Q 2015 lending results include:Commercial loan growth of $22.0 million, or 12.0% annualized. Line usage at 45.6% at 4Q’15 vs. 46.9% at 3Q’15.$32.6 million bulk fixed-rate jumbo mortgage loan purchase (all Michigan properties, 771 average original FICO, 73.7% average original LTV, 344 month WARM, and 4.19% average interest rate (3.94% net after servicing fee of 0.25%). Residential mortgage loan originations of $75.9 million and loan sales of $59.5 million (net gains of $1.7 million).2015 focus:Commercial – businesses with $1 million to $50 million in annual sales.Consumer – through branch network, internet and indirect channels.Residential mortgage – purchase money (both salable and portfolio) and QRM and home equity lending opportunities. Also will consider select bulk loan purchases within Michigan. Loan Composition – 12/31/15 Yield on Loans (%)

11 Net Interest Margin/Income HighlightsInterest rate sensitivity profile of the loan and securities portfolios, in combination with a low cost core deposit base, positions us to benefit from a rising interest rate environment.Net interest income increased in 4Q’15 vs. 3Q’15 due to a $66.2 million increase in average interest-earning assets that was partially offset by a 2 bps decline in the NIM.Absolute low interest rate environment continues to place some pressure on the net interest margin. 2016 goal is to grow net interest income by 5% to 6% as NIM compression abates and average loans increase. Net Interest Margin (TE)(%) Net Interest Income ($ in Millions)
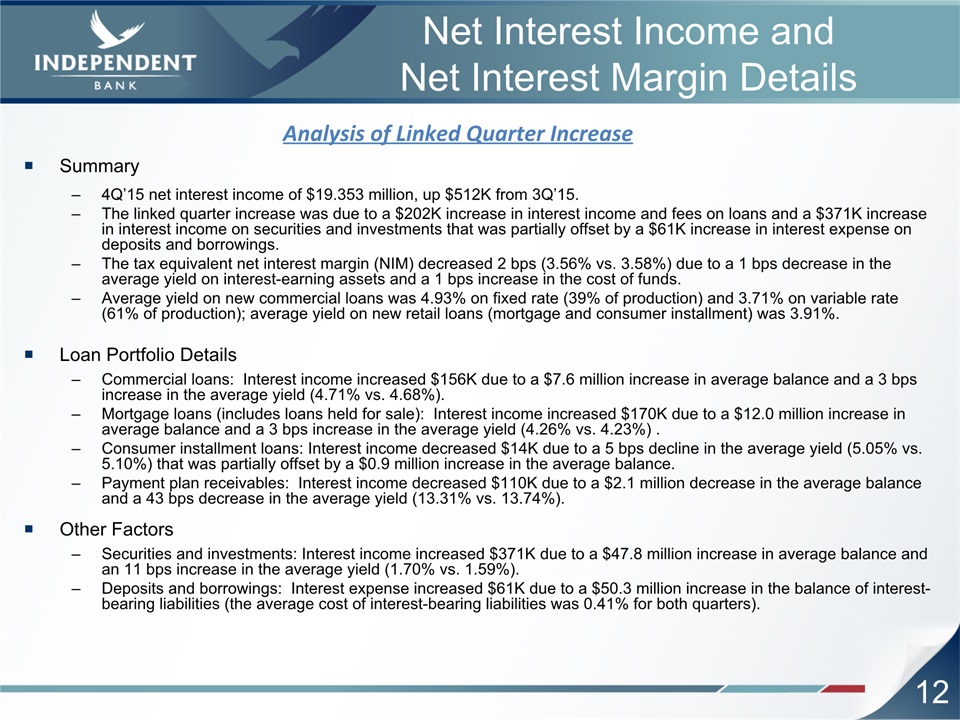
12 Net Interest Income and Net Interest Margin Details Summary4Q’15 net interest income of $19.353 million, up $512K from 3Q’15. The linked quarter increase was due to a $202K increase in interest income and fees on loans and a $371K increase in interest income on securities and investments that was partially offset by a $61K increase in interest expense on deposits and borrowings. The tax equivalent net interest margin (NIM) decreased 2 bps (3.56% vs. 3.58%) due to a 1 bps decrease in the average yield on interest-earning assets and a 1 bps increase in the cost of funds.Average yield on new commercial loans was 4.93% on fixed rate (39% of production) and 3.71% on variable rate (61% of production); average yield on new retail loans (mortgage and consumer installment) was 3.91%.Loan Portfolio DetailsCommercial loans: Interest income increased $156K due to a $7.6 million increase in average balance and a 3 bps increase in the average yield (4.71% vs. 4.68%).Mortgage loans (includes loans held for sale): Interest income increased $170K due to a $12.0 million increase in average balance and a 3 bps increase in the average yield (4.26% vs. 4.23%) .Consumer installment loans: Interest income decreased $14K due to a 5 bps decline in the average yield (5.05% vs. 5.10%) that was partially offset by a $0.9 million increase in the average balance. Payment plan receivables: Interest income decreased $110K due to a $2.1 million decrease in the average balance and a 43 bps decrease in the average yield (13.31% vs. 13.74%). Other FactorsSecurities and investments: Interest income increased $371K due to a $47.8 million increase in average balance and an 11 bps increase in the average yield (1.70% vs. 1.59%). Deposits and borrowings: Interest expense increased $61K due to a $50.3 million increase in the balance of interest-bearing liabilities (the average cost of interest-bearing liabilities was 0.41% for both quarters). Analysis of Linked Quarter Increase
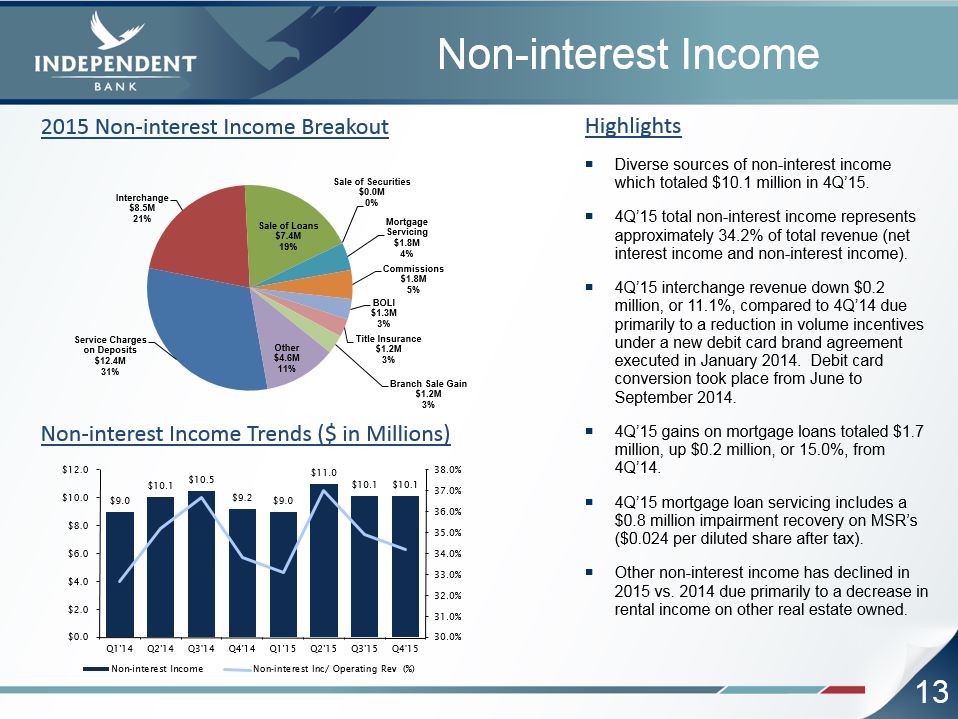
13 Non-interest Income HighlightsDiverse sources of non-interest income which totaled $10.1 million in 4Q’15.4Q’15 total non-interest income represents approximately 34.2% of total revenue (net interest income and non-interest income).4Q’15 interchange revenue down $0.2 million, or 11.1%, compared to 4Q’14 due primarily to a reduction in volume incentives under a new debit card brand agreement executed in January 2014. Debit card conversion took place from June to September 2014.4Q’15 gains on mortgage loans totaled $1.7 million, up $0.2 million, or 15.0%, from 4Q’14.4Q’15 mortgage loan servicing includes a $0.8 million impairment recovery on MSR’s ($0.024 per diluted share after tax). Other non-interest income has declined in 2015 vs. 2014 due primarily to a decrease in rental income on other real estate owned. 2015 Non-interest Income Breakout Non-interest Income Trends ($ in Millions)
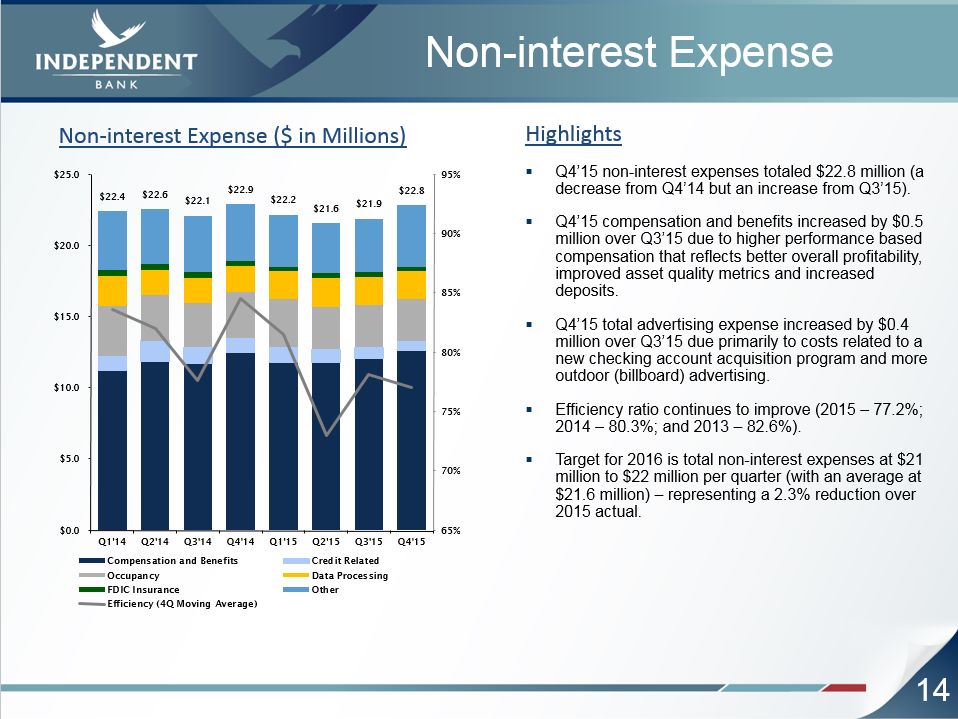
14 Non-interest Expense HighlightsQ4’15 non-interest expenses totaled $22.8 million (a decrease from Q4’14 but an increase from Q3’15).Q4’15 compensation and benefits increased by $0.5 million over Q3’15 due to higher performance based compensation that reflects better overall profitability, improved asset quality metrics and increased deposits.Q4’15 total advertising expense increased by $0.4 million over Q3’15 due primarily to costs related to a new checking account acquisition program and more outdoor (billboard) advertising.Efficiency ratio continues to improve (2015 – 77.2%; 2014 – 80.3%; and 2013 – 82.6%).Target for 2016 is total non-interest expenses at $21 million to $22 million per quarter (with an average at $21.6 million) – representing a 2.3% reduction over 2015 actual. Non-interest Expense ($ in Millions)

15 Investment Securities Portfolio HighlightsHigh quality, liquid, diverse portfolio with short duration.76% of the portfolio is AAA rated (or backed by the U.S. Government).2.0 year estimated average duration with a weighted average yield of 1.76% (without TE gross up).Approximately 33% of the portfolio is variable rate.Fair value of $597.4 million(1) at 12/31/15.Net unrealized loss of $0.4 million at 12/31/15. (1) Includes investments in bank CD’s of $11.9 million but excludes trading securities of $0.1 million. Investment Portfolio by Type (12/31/15) Investment Portfolio by Rating (12/31/15)

16 Credit Quality Summary Note: Non-performing loans and non-performing assets exclude troubled debt restructurings that are performing. Non-performing Assets ($ in Millions) ORE/ORA ($ in Millions) Non-performing Loans ($ in Millions) 30 to 89 Days Delinquent ($ in Millions)

17 Credit Cost Summary Note: Dollars all in millions. Provision for Loan Losses Loan Net Charge-Offs Allowance for Loan Losses
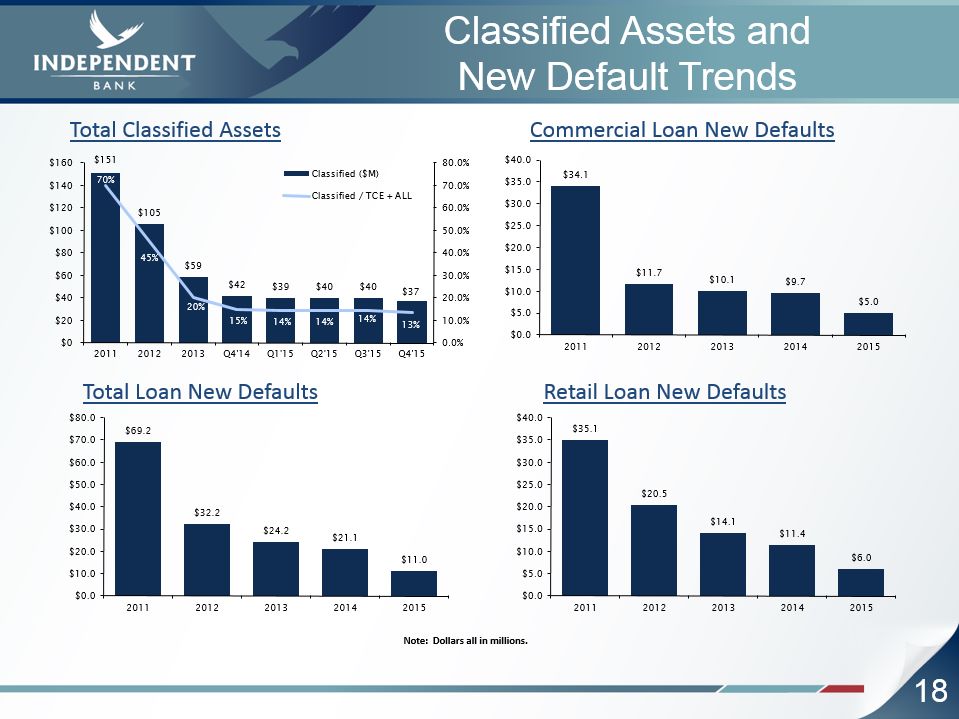
18 Classified Assets and New Default Trends Note: Dollars all in millions. Total Classified Assets Commercial Loan New Defaults Total Loan New Defaults Retail Loan New Defaults

19 Troubled Debt Restructurings (TDRs) TDR HighlightsWorking with client base to maximize sustainable performance.The specific reserves allocated to TDRs totaled $10.9 million at 12/31/15.A majority of our TDRs are performing under their modified terms but remain in TDR status for the life of the loan.89.4% of TDRs are current as of 12/31/15.Commercial TDR Statistics:78 loans with $16.4 million book balance.81.7% performing.WAR of 5.18% (accruing loans).Well seasoned portfolio; over 89% of accruing loans are not only performing but have been for over a year since modification.Retail TDR Statistics:766 loans with $72.0 million book balance.94.8% performing.WAR of 4.24% (accruing loans).Well seasoned portfolio; over 89% of accruing loans are not only performing but have been for over a year since modification. TDRs ($ in Millions) 89% of TDRs are Current
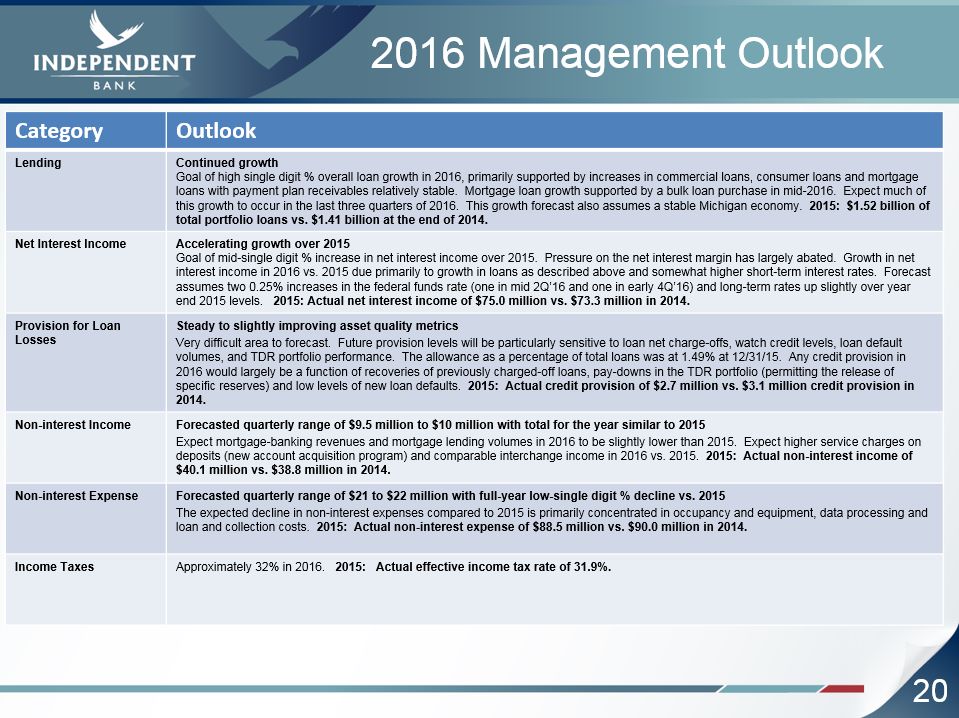
20 2016 Management Outlook Category Outlook Lending Continued growthGoal of high single digit % overall loan growth in 2016, primarily supported by increases in commercial loans, consumer loans and mortgage loans with payment plan receivables relatively stable. Mortgage loan growth supported by a bulk loan purchase in mid-2016. Expect much of this growth to occur in the last three quarters of 2016. This growth forecast also assumes a stable Michigan economy. 2015: $1.52 billion of total portfolio loans vs. $1.41 billion at the end of 2014. Net Interest Income Accelerating growth over 2015Goal of mid-single digit % increase in net interest income over 2015. Pressure on the net interest margin has largely abated. Growth in net interest income in 2016 vs. 2015 due primarily to growth in loans as described above and somewhat higher short-term interest rates. Forecast assumes two 0.25% increases in the federal funds rate (one in mid 2Q’16 and one in early 4Q’16) and long-term rates up slightly over year end 2015 levels. 2015: Actual net interest income of $75.0 million vs. $73.3 million in 2014. Provision for Loan Losses Steady to slightly improving asset quality metricsVery difficult area to forecast. Future provision levels will be particularly sensitive to loan net charge-offs, watch credit levels, loan default volumes, and TDR portfolio performance. The allowance as a percentage of total loans was at 1.49% at 12/31/15. Any credit provision in 2016 would largely be a function of recoveries of previously charged-off loans, pay-downs in the TDR portfolio (permitting the release of specific reserves) and low levels of new loan defaults. 2015: Actual credit provision of $2.7 million vs. $3.1 million credit provision in 2014. Non-interest Income Forecasted quarterly range of $9.5 million to $10 million with total for the year similar to 2015Expect mortgage-banking revenues and mortgage lending volumes in 2016 to be slightly lower than 2015. Expect higher service charges on deposits (new account acquisition program) and comparable interchange income in 2016 vs. 2015. 2015: Actual non-interest income of $40.1 million vs. $38.8 million in 2014. Non-interest Expense Forecasted quarterly range of $21 to $22 million with full-year low-single digit % decline vs. 2015The expected decline in non-interest expenses compared to 2015 is primarily concentrated in occupancy and equipment, data processing and loan and collection costs. 2015: Actual non-interest expense of $88.5 million vs. $90.0 million in 2014. Income Taxes Approximately 32% in 2016. 2015: Actual effective income tax rate of 31.9%.
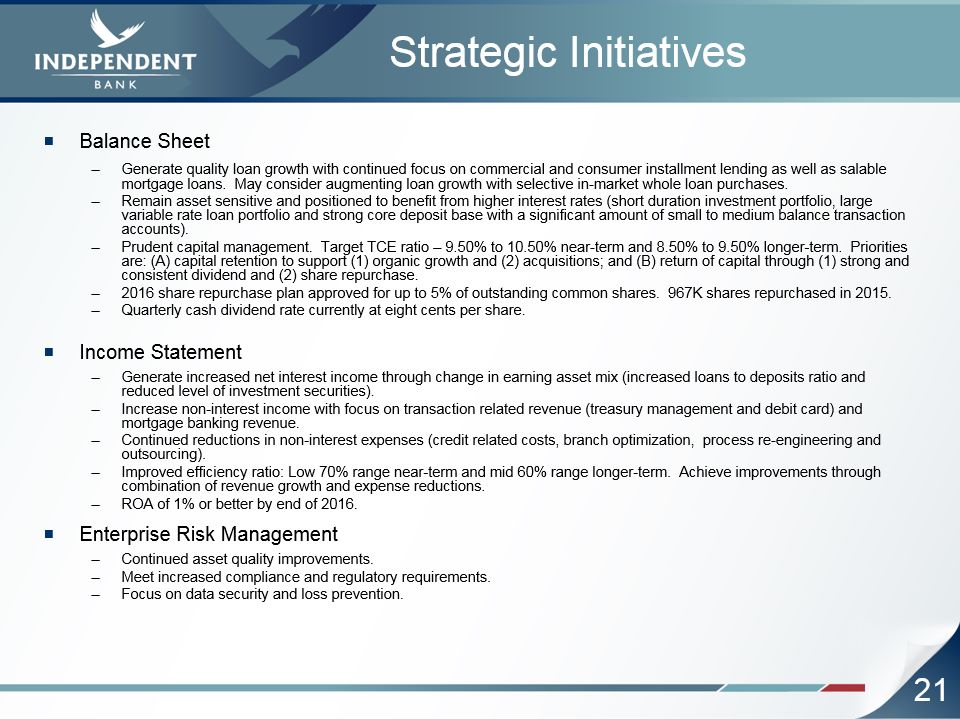
21 Strategic Initiatives Balance SheetGenerate quality loan growth with continued focus on commercial and consumer installment lending as well as salable mortgage loans. May consider augmenting loan growth with selective in-market whole loan purchases.Remain asset sensitive and positioned to benefit from higher interest rates (short duration investment portfolio, large variable rate loan portfolio and strong core deposit base with a significant amount of small to medium balance transaction accounts).Prudent capital management. Target TCE ratio – 9.50% to 10.50% near-term and 8.50% to 9.50% longer-term. Priorities are: (A) capital retention to support (1) organic growth and (2) acquisitions; and (B) return of capital through (1) strong and consistent dividend and (2) share repurchase.2016 share repurchase plan approved for up to 5% of outstanding common shares. 967K shares repurchased in 2015.Quarterly cash dividend rate currently at eight cents per share. Income StatementGenerate increased net interest income through change in earning asset mix (increased loans to deposits ratio and reduced level of investment securities).Increase non-interest income with focus on transaction related revenue (treasury management and debit card) and mortgage banking revenue.Continued reductions in non-interest expenses (credit related costs, branch optimization, process re-engineering and outsourcing).Improved efficiency ratio: Low 70% range near-term and mid 60% range longer-term. Achieve improvements through combination of revenue growth and expense reductions. ROA of 1% or better by end of 2016.Enterprise Risk ManagementContinued asset quality improvements.Meet increased compliance and regulatory requirements.Focus on data security and loss prevention.

22 Q&A and Closing Remarks Question and Answer SessionClosing RemarksThank you for attending !NASDAQ: IBCP