Attached files
| file | filename |
|---|---|
| EX-99.1 - PDF OF EXHIBIT 99.1 - UNITED COMMUNITY BANKS INC | q4-15earnings_announcement.pdf |
| EX-99.2 - PDF OF EXHIBIT 99.2 - UNITED COMMUNITY BANKS INC | q4-15ir_presentation.pdf |
| 8-K - FORM 8-K - UNITED COMMUNITY BANKS INC | t1600007_8k.htm |
| EX-99.1 - EXHIBIT 99.1 - UNITED COMMUNITY BANKS INC | t1600007_ex99-1.htm |
Exhibit 99.2

ucbi.com | 1
ucbi.com | 2 ucbi.com | 2 Disclosures efficiency ratio, operating dividend payout ratio, core fee revenue, core operating expense, core earnings, tangible common equity to tangible assets, tangible equity to tangible assets and tangible common equity to risk - weighted assets . The most comparable GAAP measures to these measures are : net income, net income available to common shareholders, diluted income per common share, ROE, ROA, efficiency ratio, dividend payout ratio, fee revenue, operating expense, net income, and equity to assets . Management uses these non - GAAP financial measures because we believe they are useful for evaluating our operations and performance over periods of time, as well as in managing and evaluating our business and in discussions about our operations and performance . Management believes these non - GAAP financial measures provide users of our financial information with a meaningful measure for assessing our financial results and credit trends, as well as for comparison to financial results for prior periods . These non - GAAP financial measures should not be considered as a substitute for financial measures determined in accordance with GAAP and may not be comparable to other similarly titled financial measures used by other companies . For a reconciliation of the differences between our non - GAAP financial measures and the most comparable GAAP measures, please refer to the ‘Non - GAAP Reconcilement Tables’ at the end of this presentation . CAUTIONARY STATEMENT This investor presentation may contain forward - looking statements, as defined by federal securities laws, including statements about United’s financial outlook and business environment . These statements are based on current expectations and are provided to assist in the understanding of future financial performance . Such performance involves risks and uncertainties that may cause actual results to differ materially from those expressed or implied in any such statements . For a discussion of some of the risks and other factors that may cause such forward - looking statements to differ materially from actual results, please refer to United Community Banks, Inc . ’s filings with the Securities and Exchange Commission, including its 2014 Annual Report on Form 10 - K and its most recent quarterly report on Form 10 - Q under the sections entitled “Forward - Looking Statements . ” Forward - looking statements speak only as of the date they are made, and we undertake no obligation to update or revise forward - looking statements . NON - GAAP MEASURES This presentation also contains financial measures determined by methods other than in accordance with generally accepted accounting principles (“GAAP”) . Such non - GAAP financial measures include : operating net income, operating net income available to common shareholders, operating diluted income per common share, operating ROE, operating ROA, operating

ucbi.com | 3 Fourth Quarter 2015 Highlights ucbi.com | 3 (in millions) 4Q15 3Q15 4Q14 Net Income ($ in millions) Operating (1) $ 23.8 $ 21.7 $ 18.2 GAAP 18.2 17.9 18.2 EPS Operating (1) .33 .33 .30 GAAP .25 .27 .30 ROA Operating (1) .99 1.00 .96 GAAP .76 .82 .96 ROTCE Operating (1) 10.87 10.29 9.74 ROCE GAAP 7.02 7.85 9.60 Improving Quarterly Results Net Interest Revenue ► $74.0 Million – Loan Growth and Margin Yields Positive Net Interest Revenue Results ● Increased $8.3 million (Palmetto - $7.0 million) from 3Q15 and $15.7 million from 4Q14 ● Average loans totaled $6.0 billion in 4Q15 up $518 million (9.5%) from 3Q15 and $1.6 billion (29.3%) from 4Q14 ● Margin increased to 3.34% vs. 3.26% in 3Q15 and 3.31% in 4Q14 o Loan yield of 4.22%, up 6 bps from 3Q15; taxable securities yield of 2.29%, up 16 bps from 3Q15 o Lower funding costs – down 2 bps from 3Q15 and down 11 bps from 4Q14 Core Fee Revenue ► $20.8 Million – Growing Fee Revenue ● Increased $2.3 million (Palmetto - $2.1 million) from 3Q15 and $6.2 million from 4Q14 ● Interchange fees of $5.4 million vs. $4.4 million in 3Q15 and $4.0 million in 4Q2014 ● Gain on sales of SBA loans of $2.0 million vs. $1.6 million in 3Q15 and $926 thousand in 4Q14 ● Mortgage revenue of $3.3 million vs. $3.8 million in 3Q15 and $2.1 million in 4Q14 ( 1) Excludes the effect of merger - related and other non - operating charges of $9.1 million in 4Q15 and $5.7 million in 3Q15 % % %

ucbi.com | 4 Fourth Quarter 2015 Highlights ucbi.com | 4 Improving Quarterly Results Loan Growth ► Growth in Many Sectors of the Portfolio ● Loan growth, excluding healthcare sale and acquisitions, of $162 million, or 11% annualized, from 3Q15 and $444 million year - to - date, or 10% ● Strong loan production of $590 million vs. $452 million in 3Q15 and $401 million in 4Q14 Core Transactio n Deposits ► $5.3 Billion – Growing Lower Cost Core Transaction Deposits (Excludes Time Deposits) ● Increased $524 million (14%) from 4Q14 (excluding acquisitions) ● Represents 70% of total customer deposits Credit Quality ► Outstanding Credit Performance ● Provision $300 thousand – decreased $400 thousand from 3Q15 and $1.5 million from 4Q14 ● Net charge - offs to loans of 9bps (or .09%) - decreased 1bp from 3Q15 and 13bp from 4Q14 ● NPAs were .29% of total assets vs. .29% in 3Q15 and .26% in 4Q14 ● Allowance 1.14% (1.35% excluding mergers) of total loans vs. 1.15% (1.37% excluding mergers) at 3Q15 and 1.53% at 4Q14 Capital Ratios ► Solid and Well - Capitalized (1) ● Quarterly dividend of 6 cents per share ● Tier I Common to Risk Weighted Assets of 11.5% and Tier I Leverage of 8.3% ● Tier I Risk Based Capital of 11.5% and Total Risk Based Capital of 12.5% Acquisitions ► Executing on Acquisitions and Integration in 2015 ● Closed merger with Palmetto Bancshares, Inc. (The Palmetto Bank: “Palmetto”) on Sept. 1 o Systems conversion for Palmetto scheduled for February 20, 2016 ● Closed merger with MoneyTree Corporation (First National Bank: “FNB”) on May 1 o Completed systems conversion for FNB in July (1) 4Q15 capital ratios are preliminary estimates

ucbi.com | 5 $58.3 $57.6 $61.3 $65.7 $74.0 $42.1 $42.2 $45.1 $48.8 $56.5 $30.8 $30.5 $33.4 $35.4 $38.3 $14.6 $15.1 $17.2 $18.4 $20.8 $10 $20 $30 $40 $50 $60 $70 $80 4Q14 1Q15 2Q15 3Q15 4Q15 Net Interest Revenue Core Operating Expenses Core Earnings Core Fee Revenue Trends Core Earnings, Fee Revenue, and Operating Expenses Core Earnings $38.3 Million Up $2.9 million from 3Q15 and Up $7.5 million from 4Q14 ucbi.com | 5 4Q15 3Q15 4Q14 Salaries & Employee Benefits 32,603$ 3,044$ 6,426$ Communications & Equipment 4,735 772 1,582 Occupancy 4,666 653 1,218 FDIC Assessment 1,463 327 580 Advertising & Public Relations 978 166 176 Postage, Printing & Supplies 1,293 244 207 Professional Fees 3,331 663 1,297 Other Expense 7,408 1,844 2,910 Core Operating Expenses 56,477 7,713 14,396 Non-Core Operating Expenses (1) 9,011 3,506 9,173 Reported - GAAP 65,488$ 11,219$ 23,569$ Variance - Incr/(Decr) 4Q15 3Q15 4Q14 Overdraft Fees 3,872$ 568$ 936$ Interchange Fees 5,445 1,081 1,468 Other Service Charges 2,183 516 650 Total Service Charges and Fees 11,500 2,165 3,054 Mortgage Loan & Related Fees 3,290 (550) 1,179 Brokerage Fees 1,058 (142) (118) Gains from SBA Loan Sales 1,995 349 1,069 Other 2,913 486 1,019 Core Fee Revenue 20,756 2,308 6,203 Non-Core Fee Revenue (1) 528 679 258 Reported - GAAP 21,284$ 2,987$ 6,461$ Variance - Incr/(Decr) 4Q15 3Q15 4Q14 Net Interest Revenue 74,048$ 8,330$ 15,716$ Core Fee Revenue 20,756 2,308 6,203 Gross Revenue 94,804 10,638 21,919 Core Operating Expenses 56,477 7,713 14,396 Core Earnings 38,327 2,925 7,523 Non-Core Fee Revenue (1) 528 679 258 Non-Core Operating Expenses (1) (9,011) (3,506) (9,173) Provision for credit losses (300) 400 1,500 Income taxes (11,336) (177) (147) Reported - GAAP 18,208$ 321$ (39)$ Net Interest Margin 3.34 % .08 % .03 % Variance - Incr/(Decr) $ in t housands $ in thousands (1) See Non - GAAP Reconciliation Tables slide at the conclusion of this presentation for a reconciliation of core disclosures to GA AP disclosures $ in thousands Core Operating Expenses Core Earnings (pre - tax, pre - credit) Core Fee Revenue M illions
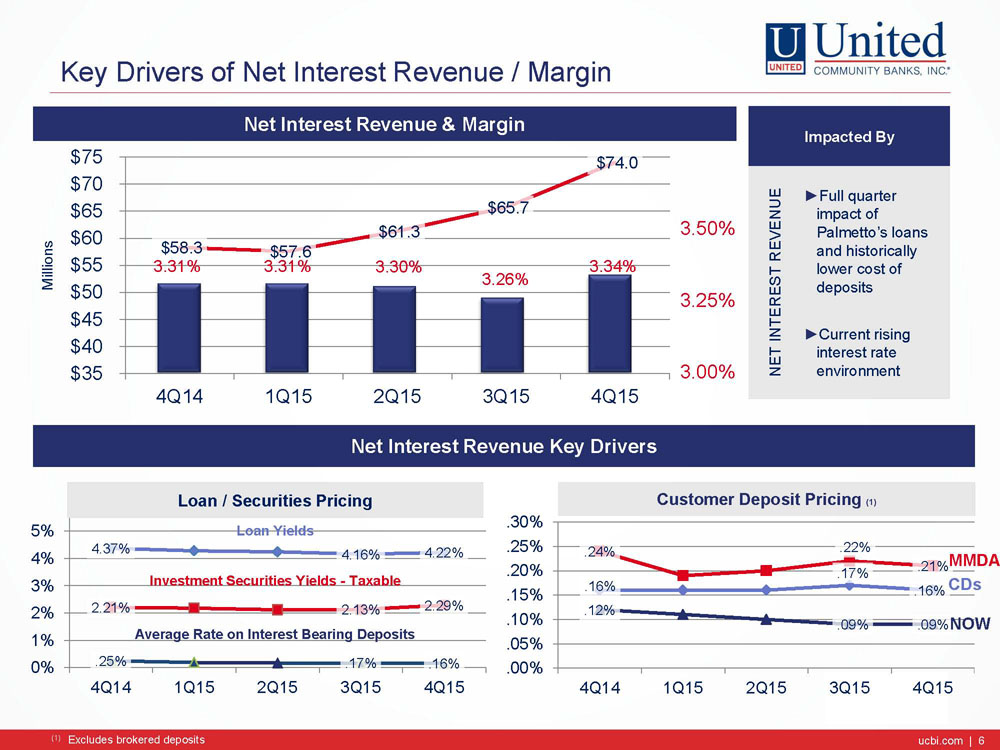
ucbi.com | 6 $58.3 $57.6 $61.3 $65.7 $74.0 $35 $40 $45 $50 $55 $60 $65 $70 $75 4Q14 1Q15 2Q15 3Q15 4Q15 4.37% 4.16% 4.22% 2.21% 2.13% 2.29% .25% .17% .16% 0% 1% 2% 3% 4% 5% 4Q14 1Q15 2Q15 3Q15 4Q15 .16% .17% .16% .24% .22% .21% .12% .09% .09% .00% .05% .10% .15% .20% .25% .30% 4Q14 1Q15 2Q15 3Q15 4Q15 3.31% 3.31% 3.30% 3.26% 3.34% 3.00% 3.25% 3.50% Key Drivers of Net Interest Revenue / Margin ucbi.com | 6 Net Interest Revenue Key Drivers Net Interest Revenue & Margin Impacted By NET INTEREST REVENUE ► Full quarter impact of Palmetto’s loans and historically lower cost of deposits ► Current rising interest rate environment Millions Loan / Securities Pricing Customer Deposit Pricing (1) Loan Yields Investment Securities Yields - Taxable Average Rate on Interest Bearing Deposits ( 1) E xcludes brokered deposits CDs MMDA NOW
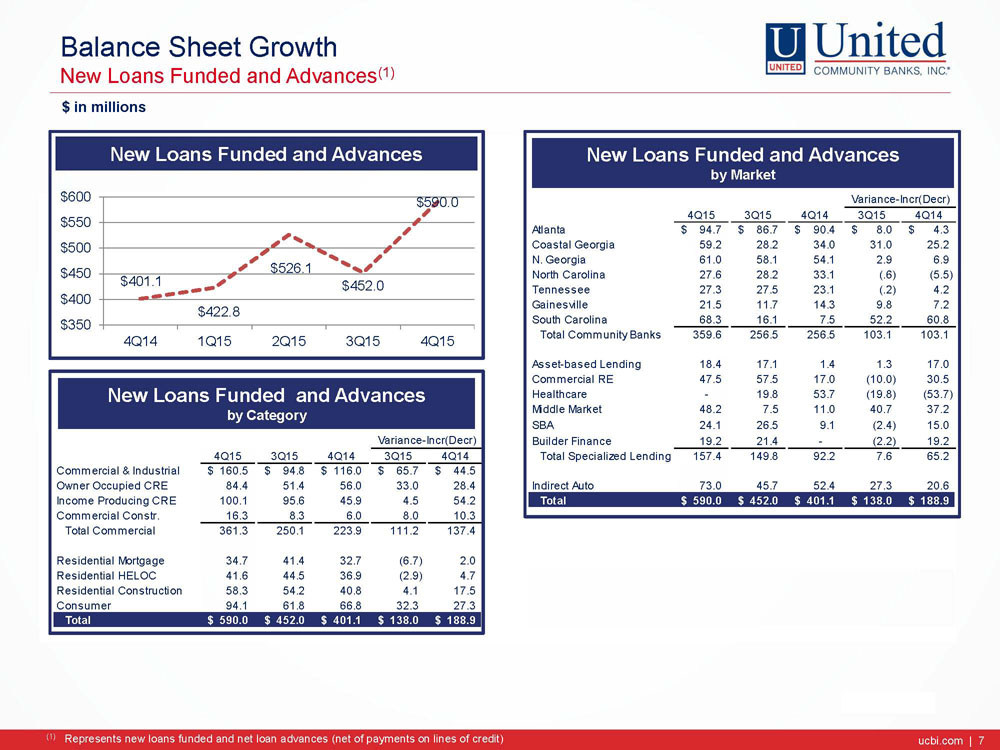
ucbi.com | 7 Balance Sheet Growth New Loans Funded and Advances (1) $ in millions ucbi.com | 7 4Q15 3Q15 4Q14 3Q15 4Q14 Atlanta 94.7$ 86.7$ 91.6$ 8.0$ 3.1$ Coastal Georgia 59.2 28.2 34.0 31.0 25.2 N. Georgia 61.0 58.1 54.9 2.9 6.1 North Carolina 27.6 28.2 33.1 (.6) (5.5) Tennessee 27.3 27.5 24.1 (.2) 3.2 Gainesville 21.5 11.7 14.3 9.8 7.2 South Carolina 68.3 16.1 9.0 52.2 59.3 Total Community Banks 359.6 256.5 261.0 103.1 98.6 Asset-based Lending 18.4 17.1 1.3 1.3 17.1 Commercial RE 47.5 57.5 17.0 (10.0) 30.5 Healthcare - 19.8 53.7 (19.8) (53.7) Middle Market 48.2 7.5 10.9 40.7 37.3 SBA 24.1 26.5 4.8 (2.4) 19.3 Builder Finance 19.2 21.4 - (2.2) 19.2 4Q15 3Q15 4Q14 3Q15 4Q14 Total Specialized Lending 157.4 149.8 87.7 7.6 69.7 Commercial & Industrial 160.5$ 94.8$ 116.0$ 65.7$ 44.5$ Owner Occupied CRE 84.4 51.4 56.0 33.0 28.4 Indirect Auto 73.0 45.7 52.4 27.3 20.6 Income Producing CRE 100.1 95.6 45.9 4.5 54.2 Total 590.0$ 452.0$ 401.1$ 138.0$ 188.9$ Commercial Constr. 16.3 8.3 6.0 8.0 10.3 Total Commercial 361.3 250.1 223.9 111.2 137.4 Residential Mortgage 34.7 41.4 32.7 (6.7) 2.0 Residential HELOC 41.6 44.5 36.9 (2.9) 4.7 Residential Construction 58.3 54.2 40.8 4.1 17.5 Consumer 94.1 61.8 66.8 32.3 27.3 Total 590.0$ 452.0$ 401.1$ 138.0$ 188.9$ Variance-Incr(Decr) Variance-Incr(Decr) (1) Represents new loans funded and net loan advances (net of payments on lines of credit) New Loans Funded and Advances $401.1 $422.8 $526.1 $452.0 $590.0 $350 $400 $450 $500 $550 $600 4Q14 1Q15 2Q15 3Q15 4Q15 New Loans Funded and Advances by Market New Loans Funded and Advances by Category
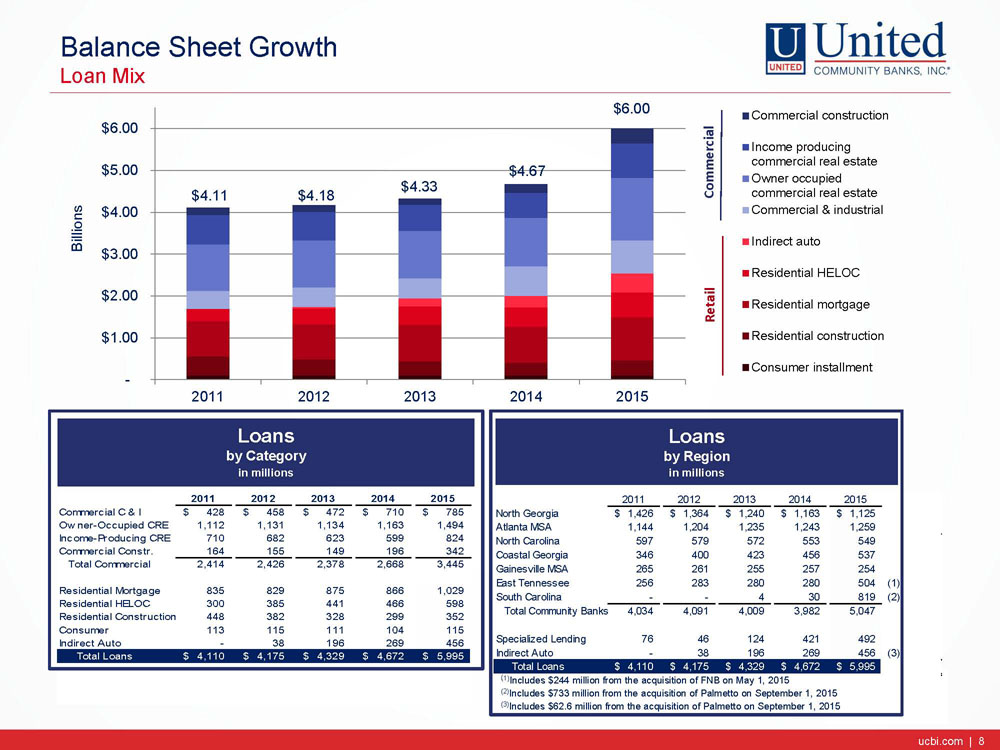
ucbi.com | 8 2011 2012 2013 2014 2015 North Georgia 1,426$ 1,364$ 1,240$ 1,163$ 1,125$ Atlanta MSA 1,144 1,204 1,235 1,243 1,259 North Carolina 597 579 572 553 549 Coastal Georgia 346 400 423 456 537 Gainesville MSA 265 261 255 257 254 East Tennessee 256 283 280 280 504 (1) South Carolina - - 4 30 819 (2) Total Community Banks 4,034 4,091 4,009 3,982 5,047 Specialized Lending 76 46 124 421 492 Indirect Auto - 38 196 269 456 (3) Total Loans 4,110$ 4,175$ 4,329$ 4,672$ 5,995$ Balance Sheet Growth Loan Mix $4.11 $4.18 $4.33 $4.67 $6.00 - $1.00 $2.00 $3.00 $4.00 $5.00 $6.00 2011 2012 2013 2014 2015 Billions Commercial construction Income producing commercial real estate Owner occupied commercial real estate Commercial & industrial Indirect auto Residential HELOC Residential mortgage Residential construction Consumer installment Commercial Retail 2011 2012 2013 2014 2015 Commercial C & I 428$ 458$ 472$ 710$ 785$ Owner-Occupied CRE 1,112 1,131 1,134 1,163 1,494 Income-Producing CRE 710 682 623 599 824 Commercial Constr. 164 155 149 196 342 Total Commercial 2,414 2,426 2,378 2,668 3,445 Residential Mortgage 835 829 875 866 1,029 Residential HELOC 300 385 441 466 598 Residential Construction 448 382 328 299 352 Consumer 113 115 111 104 115 Indirect Auto - 38 196 269 456 Total Loans 4,110$ 4,175$ 4,329$ 4,672$ 5,995$ ucbi.com | 8 ( 1) Includes $244 million from the acquisition of FNB on May 1, 2015 (2) Includes $733 million from the acquisition of Palmetto on September 1, 2015 (3) Includes $62.6 million from the acquisition of Palmetto on September 1, 2015 Loans by Category i n millions Loans by Region i n millions

ucbi.com | 9 2011 2012 2013 2014 2015 2011 2012 2013 2014 2015 Non-Interest Bearing Core Demand Deposit 185$ 232$ 123$ 161$ 618$ Demand Deposit 955$ 1,188$ 1,311$ 1,471$ 2,089$ NOW (84) (65) 4 9 441 MMDA 150 115 73 41 325 Interest Bearing Core Savings 15 29 24 41 177 Total CommercialNOW 719 654 659 668 1,109 Growth by Category 266$ 311$ 224$ 252$ 1,561$ MMDA 1,030 1,145 1,218 1,259 1,584 Savings 198 226 250 292 469 Atlanta MSA 102$ 160$ 75$ 84$ 223$ Total Interest Bearing Core 1,947 2,025 2,127 2,219 3,162 North Georgia 81 41 62 90 158 North Carolina 27 47 42 35 63 Total Core Deposits 2,902 3,213 3,438 3,690 5,251 Coastal Georgia 20 38 2 22 24 East Tennessee 21 9 4 8 234 Time (Customer) Gainesville MSA 15 16 19 10 34 (1) Less than $100,000 1,121 1,050 888 744 823 South Carolina - - 20 3 825 (2) Greater than $100,000 1,012 674 557 479 428 Growth by Region 266$ 311$ 224$ 252$ 1,561$ Total Time 2,133 1,724 1,445 1,223 1,251 Public Funds 884 770 894 989 1,032 Brokered 179 245 412 425 347 Total LoansTotal Deposits 6,098$ 5,952$ 6,189$ 6,327$ 7,881$ Balance Sheet Growth Customer Deposit Mix $5.92 $5.71 $5.78 $5.90 $7.53 - $1.00 $2.00 $3.00 $4.00 $5.00 $6.00 $7.00 $8.00 2011 2012 2013 2014 2015 Billions Public funds Time (customer) Interest bearing core transaction Non-interest bearing core transaction Time & Public Core Transaction ucbi.com | 9 Deposits by Category i n millions Core Deposit Growth by Category & Region i n millions (1) Includes $ 247 million from the acquisition of FNB on May 1, 2015 (2) Includes $790 million from the acquisition of Palmetto on September 1, 2015

ucbi.com | 10 Credit Quality 4Q15 3Q15 2Q15 1Q15 4Q14 Net Charge-offs 1.3$ 1.4$ 1.0$ 2.6$ 2.5$ as % of Average Loans 0.09 % 0.10 % 0.08 % 0.22 % 0.22 % Allowance for Loan Losses 68.4$ 69.1$ 70.1$ 70.0$ 71.6$ as % of Total Loans 1.14 % 1.15% 1.36 % 1.46 % 1.53 % as % of Total Loans, Excluding Merger 1.35 1.37 1.42 as % of NPLs 302 344 373 368 401 Past Due Loans (30 - 89 Days) 0.26 % 0.27 % 0.24 % 0.25 % 0.31 % Non-Performing Loans 22.6$ 20.0$ 18.8$ 19.0$ 17.9$ OREO 4.9 7.7 2.4 1.2 1.7 Total NPAs 27.5 27.7 21.2 20.2 19.6 Performing Classified Loans 127.5 136.0 115.7 121.7 128.4 Total Classified Assets 155.0$ 163.7$ 136.9$ 141.9$ 148.0$ as % of Tier 1 / Allowance 17 % 18 % 18 % 20 % 20 % Accruing TDRs (see page 27) 83.0$ 84.6$ 86.1$ 82.3$ 81.3$ As % of Original Principal Balance Non-Performing Loans 71.4 % 70.3 % 64.9 % 72.0 % 69.9 % OREO 34.2 45.8 46.6 56.6 54.1 Total NPAs as % of Total Assets 0.29 0.29 0.26 0.26 0.26 as % of Loans & OREO 0.46 0.46 0.41 0.42 0.42 $ in millions ucbi.com | 10

ucbi.com | 11 Operating Earnings per Share and Operating Return on Assets $.30 $.29 $.32 $.33 $.33 $.18 $.20 $.22 $.24 $.26 $.28 $.30 $.32 $.34 4Q14 1Q15 2Q15 3Q15 4Q15 Operating Earnings per Share (1) .96% .94% 1.00% 1.00% .99% .00% .20% .40% .60% .80% 1.00% 1.20% 4Q14 1Q15 2Q15 3Q15 4Q15 Operating Return on Assets (1 ) ucbi.com | 11 (1) Excludes the effect of merger - related and other non - operating charges

ucbi.com | 12 Holding Company Well - Cap 4Q15 (2) 3Q15 2Q15 1Q15 4Q14 Tier I RBC 8.0% 11.5% 11.4% 11.9% 11.5% 12.1% Total RBC 10.0 12.5 12.5 13.1 12.8 13.3 Leverage 5.0 8.3 9.1 9.1 8.7 8.7 Tier I Common RBC 6.5 11.5 11.4 11.9 11.5 11.1 Tangible Common Equity to Assets 9.3 9.8 9.8 9.8 9.7 Tangible Equity to Assets 9.4 9.9 9.9 9.8 9.7 Bank Well - Cap 4Q15 (2) 3Q15 2Q15 1Q15 4Q14 Tier I RBC 8.0% 13.0 % 12.9 % 12.0 % 11.8% 12.9% Total RBC 10.0 14.1 14.0 13.2 13.1 14.1 Leverage 5.0 9.5 10.3 9.1 8.9 9.3 Capital Ratios (1) ucbi.com | 12 (1) Effective January 1, 2015, all regulatory ratios calculated under Basel III rules (2) 4Q15 capital ratios are preliminary estimates

ucbi.com | 13 2016 ► Continue to deepen commercial and retail capabilities ● Diversify portfolio – focus on: C&I; CRE owner occupied; Specialized Lending for corporate, asset - based, SBA and builder finance ● Invest in people with strong recruiting and training plans ● Grow loans in mid - to upper - single digits ► Improve retail and small business bank ● Grow sales with better / diversified product design, merchandising and campaign execution ● Improve our technology with a focus on making it easy for our customers to bank with us ● Increase core transaction deposits in the mid - single digits ► Grow net interest revenue through solid loan growth and slight margin expansion, if rates continue to rise ► Credit quality trends continue and costs increase slightly from current levels ► Grow fee revenue by investing in mortgage, advisory services, SBA capabilities and product pricing reviews ► Maintain operating efficiency below 58 percent ► Seek acquisition opportunities that fit our culture and risk and return targets Strategic Principles ucbi.com | 13 Leverage Our Strengths ► Community bank service with large bank resources ► Strong local leadership and senior management ► Combination of growing metro markets legacy markets with high deposit market sh ► Consistent and attractive culture ► Class leading customer satisfaction
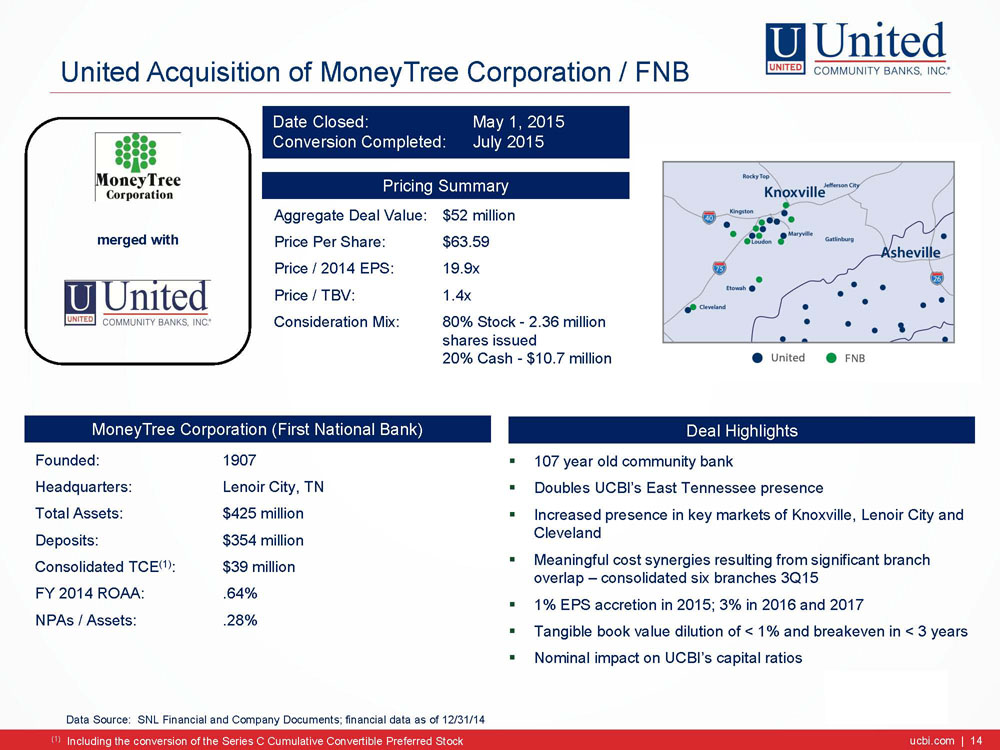
ucbi.com | 14 United Acquisition of MoneyTree Corporation / FNB ucbi.com | 14 Data Source: SNL Financial and Company Documents; financial data as of 12/31/14 Founded: 1907 Headquarters: Lenoir City, TN Total Assets: $425 million Deposits: $354 million Consolidated TCE (1) : $39 million FY 2014 ROAA: .64% NPAs / Assets: .28% merged with MoneyTree Corporation (First National Bank) ▪ 107 year old community bank ▪ Doubles UCBI’s East Tennessee presence ▪ Increased presence in key markets of Knoxville, Lenoir City and Cleveland ▪ Meaningful cost synergies resulting from significant branch overlap – consolidated six branches 3Q15 ▪ 1 % EPS accretion in 2015; 3% in 2016 and 2017 ▪ Tangible book value dilution of < 1% and breakeven in < 3 years ▪ Nominal impact on UCBI’s capital ratios Deal Highlights Aggregate Deal Value: $52 million Price Per Share: $63.59 Price / 2014 EPS: 19.9x Price / TBV: 1.4x Consideration Mix: 80% Stock - 2.36 million shares issued 20% Cash - $10.7 million Pricing Summary (1 ) Including the conversion of the Series C Cumulative Convertible Preferred Stock Date Closed: May 1, 2015 Conversion Completed: July 2015

ucbi.com | 15 ▪ Continues Southeastern metro market expansion ▪ Accelerated Greenville expansion and leverages existing, on - the - ground, senior leadership and in - market resources ▪ High - quality franchise, founded 109 years ago, with deep community roots ▪ Shared community banking philosophy driven by client focus, local expertise, and cultural fit ▪ Strong core deposit base (.04% overall cost of deposits) ▪ Significant cost synergies enhance deal economics ▪ Low execution risk and attractive returns ▪ Double - digit EPS accretion in 2017, TBV earnback < 5 years, IRR > 20% United Acquisition of Palmetto Bancshares ucbi.com | 15 Founded: 1906 Headquarters: Greenville, SC Total Assets: $1,173 million Loans: $836 million Deposits: $967 million Tangible Common Eq. $136 million ROA: 1.0% ROE: 8.3% TCE / TA 11.6% merged with Palmetto Bancshares, Inc. Deal Highlights Data Source: SNL Financial and Company Documents; financial data as of Q1 - 2015 Aggregate Deal Value: $241 million Price Per Share: $18.53 Price / 2016 EPS: 19.5x Price / TBV: 1.8x Consideration Mix: 70% Stock - 8.70 million shares issued 30% Cash - $74.0 million Pricing Summary Date Closed: September 1, 2015 Planned Conversion: February 2016

ucbi.com | 16 4Q15 3Q15 2Q15 1Q15 4Q14 Net Income Operating net income 23,800$ 21,726$ 19,989$ 17,670$ 18,247$ Merger-related and other charges (9,078) (5,744) (3,173) - - Tax benefit on merger-related and other charges 3,486 1,905 997 - - Net Income (GAAP) 18,208$ 17,887$ 17,813$ 17,670$ 18,247$ Earnings per Share Operating earnings per share 0.33$ 0.33$ 0.32$ 0.29$ 0.30$ Merger-related and other charges (0.08) (0.06) (0.04) - - Earnings per share (GAAP) 0.25$ 0.27$ 0.28$ 0.29$ 0.30$ Return on Assets Operating return on assets 0.99 % 1.00 % 1.00 % 0.94 % 0.96 % Merger-related and other charges (0.23) (0.18) (0.11) - - Return on assets (GAAP) 0.76 % 0.82 % 0.89 % 0.94 % 0.96 % Return on Tangible Common Equity Operating return on tangible common equity 10.87 % 10.29 % 10.20 % 9.46 % 9.74 % Effect of goodwill and intangibles (1.69) (0.75) (0.30) (0.12) (0.14) Return on tangible common equity 9.18 9.54 9.90 9.34 9.60 Effect of merger-related charges (2.16) (1.69) (1.07) - - Return on common equity (GAAP) 7.02 % 7.85 % 8.83 % 9.34 % 9.60 % Allowance as a % of Loans, Excluding Acquired Loans Allowance as a % of loans, excluding acquired loans 1.35 % 1.37 % 1.42 % 1.46 % 1.53 % Allowance coverage of loans acquired through merger (0.21) (0.22) (0.06) - - Allowance as a % of loans (GAAP) 1.14 % 1.15 % 1.36 % 1.46 % 1.53 % Non - GAAP Reconciliation Tables $ in thousands ucbi.com | 16

ucbi.com | 17 4Q15 3Q15 2Q15 1Q15 4Q14 Core Fee Revenue Core fee revenue 20,756$ 18,448$ 17,220$ 15,120$ 14,553$ Securities gains, net 378 325 13 1,539 208 Losses on prepayment of borrowings - (256) - (1,038) - Mark to market on deferred compensation plan assets 150 (220) 33 61 62 Non-core fee revenue 528 (151) 46 562 270 Fee revenue (GAAP) 21,284$ 18,297$ 17,266$ 15,682$ 14,823$ Core Operating Expense Core operating expense 56,477$ 48,764$ 45,135$ 42,191$ 42,081$ Foreclosed property expense (103) (22) 60 96 131 Severance 186 3 19 23 353 Reversal of litigation reserve (300) - - - (1,200) Loss share settlements - - - 690 492 Merger-related charges 3,109 5,744 3,173 - - Impairment charge on real estate held for future use 5,969 - - - - Mark to market on deferred compensation plan liability 150 (220) 33 61 62 Non-core operating expenses 9,011 5,505 3,285 870 (162) Operating expense (GAAP) 65,488$ 54,269$ 48,420$ 43,061$ 41,919$ Non - GAAP Reconciliation Tables $ in thousands ucbi.com | 17

ucbi.com | 18 UNITED COMMUNITY BANKS, INC. FOURTH QUARTER 2015 EXHIBITS January 20, 2016 ucbi.com | 18

ucbi.com | 19 Current Footprint ucbi.com | 19 Key Statistics as of 12/31/15 ► Headquartered in Blairsville, Georgia ► Four state regional community bank: GA, NC, SC and TN ► 134 Locations ► Founded in 1950 ► Largest community bank headquartered in Georgia and one of the largest in the Southeast ► 1,932 employees ► $9.6 billion in assets; $6.0 billion in loans; $7.9 billion in deposits

ucbi.com | 20 Business and Operating Model Local CEOs with deep roots in their communities Resources of a $9.6 billion bank Operate in demographically attractive markets Organic growth supported by de novos and selective acquisitions Twenty - Nine “community banks” Strategic footprint with substantial banking opportunities Disciplined growth strategy Service is Point of Differentiation ► #1 in customer satisfaction according to Customer Service Profiles, the banking industry’s leader in customer research and improvement ► #1 in Southeast in customer satisfaction by national research company ► Golden rule of banking – treating people the way we want to be treated ► One of the Top 100 “Best Banks in America” as ranked by Forbes “Community Bank Service, Large Bank Resources” ucbi.com | 20

ucbi.com | 21 Experienced Proven Leadership Jimmy C. Tallent Chairman & CEO Joined 1984 H. Lynn Harton Board, President & COO Joined 2012 Bill M. Gilbert President, Community Banking Joined 2000 Bradley J. Miller EVP, CRO & General Counsel Joined 2007 • Over 40 years in banking • Led company from $42 million in assets in 1989 to $9.6 billion today • Trustee of Young Harris College • Georgia Power Company Board Member • GA Economic Developers Association Spirit of Georgia Award recipient • Over 30 years in banking • Responsible for overall banking, credit and operations • Former Consultant and Special Assistant to the CEO and EVP of Commercial Banking for TD Bank Financial Group; and President & CEO of The South Financial Group • Over 35 years in banking • Responsible for accounting, finance and reporting activities, M&A and investor relations • Former CAO and Controller for State Street Corporation • Former ABA Accounting Committee Chairman • Over 35 years in banking • Responsible for 29 community banks with 127 branch offices • Formerly of Riegel Textile Credit Union; President of Farmers and Merchants Bank • Former Georgia Board of Natural Resources Board Chairman • Over 20 years of experience in consumer and banking law • Responsible for legal , enterprise r isk m anagement , and compliance • Chairman of the Georgia Bankers Association Bank Counsel Section • Member of the American Bankers Association Regional General Counsels Robert A. Edwards EVP & CCO Joined 2015 Richard W. Bradshaw President, Specialized Lending Joined 2014 • Over 24 years in lending • Responsible for specialized lending • Former SBA head: TD Bank and Carolina First’s SBA programs; President of UPS Capital Business Credit • Highly decorated Commander in the U.S. Naval Reserve Intelligence Program (retired) • Over 25 years in banking • Responsible for credit risk including credit underwriting, policy and special assets • Former EVP & Executive Credit Officer for TD Bank, NA and Chief Credit Officer of The South Financial Group. ucbi.com | 21 Rex S. Schuette EVP & CFO Joined 2001

ucbi.com | 22 Market Share Opportunities ucbi.com | 22 (1) (2) (3) (1) (1) North Georgia $ 6.6 $ 2.2 9 22 37% 1 Atlanta, Georgia 60.8 2.4 10 36 4 6 Gainesville, Georgia 3.0 .3 1 5 12 4 Coastal Georgia 8.0 .3 2 7 3 9 Western North Carolina 11.8 1.0 1 19 8 4 East Tennessee 16.3 .6 2 12 4 5 Upstate South Carolina 21.0 1.1 4 26 5 7 Total Markets $ 127.5 $ 7.9 29 127 Market Deposits United Deposits Deposit Share Excellent Growth Opportunities Banks Offices Rank (1) FDIC deposit market share and rank as of June 30, 2015 for markets where United takes deposits. Data Source: FDIC. (2) Based on current quarter. (3) Excludes seven loan production offices $ in billions

ucbi.com | 23 Market Share Demographics ucbi.com | 23 3.35% 4.23% 4.96% 5.70% 6.38% 6.49% 6.91% 0% 1% 2% 3% 4% 5% 6% 7% 8% Knoxville, TN Cleveland, TN Asheville, NC Greenville, SC Atlanta, GA Gainesville, GA Savannah, GA Key MSA Growth Markets Projected Change 2016 - 2021 3.69% 3.82% 4.84% 4.93% 5.40% 0% 1% 2% 3% 4% 5% 6% United States Tennessee Georgia North Carolina South Carolina State Population Growth Projected Change 2016 – 2021 Source: SNL Financial
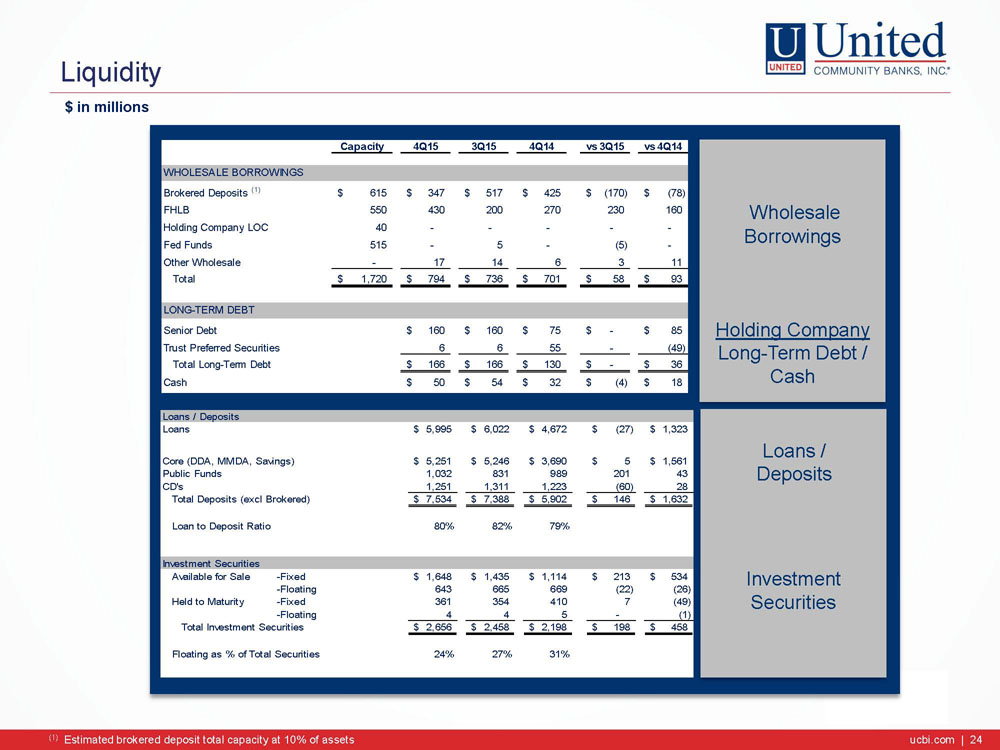
ucbi.com | 24 Liquidity ucbi.com | 24 Capacity 4Q15 3Q15 4Q14 vs 3Q15 vs 4Q14 WHOLESALE BORROWINGS Brokered Deposits (1) 615$ 347$ 517$ 425$ (170)$ (78)$ FHLB 550 430 200 270 230 160 Holding Company LOC 40 - - - - - Fed Funds 515 - 5 - (5) - Other Wholesale - 17 14 6 3 11 Total 1,720$ 794$ 736$ 701$ 58$ 93$ LONG-TERM DEBT Senior Debt 160$ 160$ 75$ -$ 85$ Trust Preferred Securities 6 6 55 - (49) Total Long-Term Debt 166$ 166$ 130$ -$ 36$ Cash 50$ 54$ 32$ (4)$ 18$ Loans / Deposits Loans 5,995$ 6,022$ 4,672$ (27)$ 1,323$ Core (DDA, MMDA, Savings) 5,251$ 5,246$ 3,690$ 5$ 1,561$ Public Funds 1,032 831 989 201 43 CD's 1,251 1,311 1,223 (60) 28 Total Deposits (excl Brokered) 7,534$ 7,388$ 5,902$ 146$ 1,632$ Loan to Deposit Ratio 80% 82% 79% Investment Securities Available for Sale -Fixed 1,608$ 1,435$ 1,114$ 173$ 494$ -Floating 683 665 669 18 14 Held to Maturity -Fixed 361 354 410 7 (49) -Floating 4 4 5 - (1) Total Investment Securities 2,656$ 2,458$ 2,198$ 198$ 458$ Floating as % of Total Securities 26% 27% 31% Wholesale Borrowings Holding Company Long - Term Debt / Cash Investment Securities (1) Estimated brokered deposit total capacity at 10% of assets $ in millions Loans / Deposits
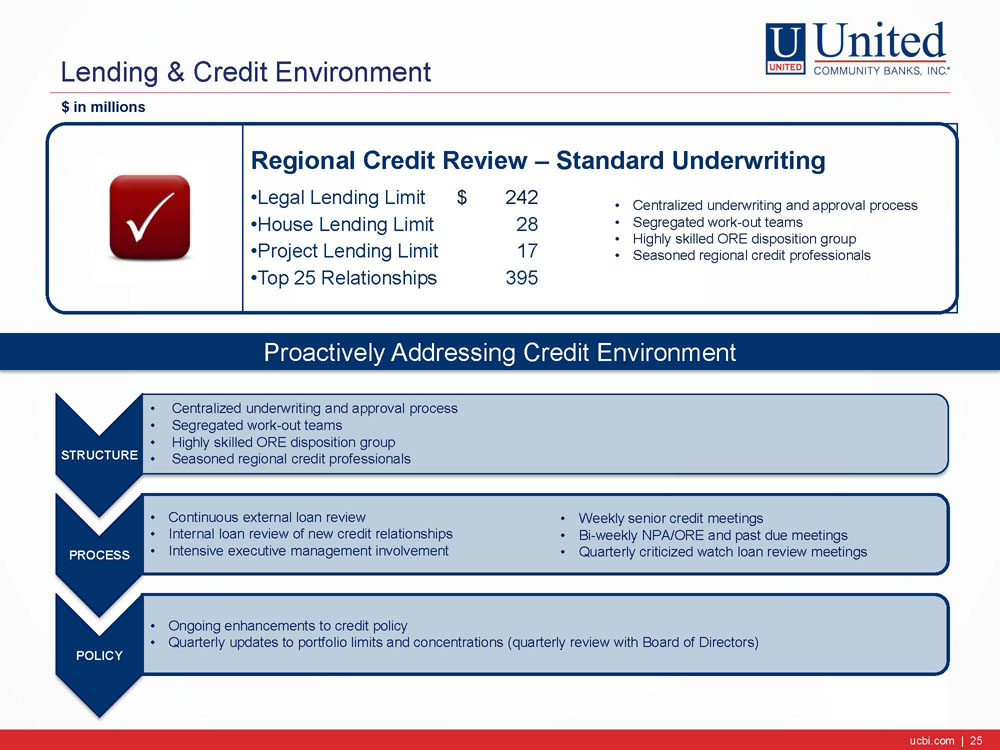
ucbi.com | 25 Lending & Credit Environment ucbi.com | 25 $ in millions Regional Credit Review – Standard Underwriting • Legal Lending Limit $ 242 • House Lending Limit 28 • Project Lending Limit 17 • Top 25 Relationships 395 STRUCTURE • Centralized underwriting and approval process • Segregated work - out teams • Highly skilled ORE disposition group • Seasoned regional credit professionals PROCESS • Continuous external loan review • Internal loan review of new credit relationships • Intensive executive management involvement POLICY • Ongoing enhancements to credit policy • Quarterly updates to portfolio limits and concentrations (quarterly review with Board of Directors) • Centralized underwriting and approval process • Segregated work - out teams • Highly skilled ORE disposition group • Seasoned regional credit professionals • Weekly senior credit meetings • Bi - weekly NPA/ORE and past due meetings • Quarterly criticized watch loan review meetings Proactively Addressing Credit Environment

ucbi.com | 26 Performing Classified Loans ucbi.com | 26 By Category $ in millions 4Q14 1Q15 2Q15 3Q15 4Q15 Commercial & Industrial 8$ 7$ 6$ 6$ 6$ Owner-Occupied CRE 46 44 40 42 40 Total Commercial & Industrial 54 51 46 48 46 Income-Producing CRE 20 20 19 30 30 Commercial Construction 4 3 3 3 1 Total Commercial 78 74 68 81 77 Residential Mortgage 32 30 30 36 31 Residential HELOC 5 6 6 7 7 Residential Construction 11 10 10 10 11 Consumer / Installment 2 2 2 2 2 Total Performing Classified 128$ 122$ 116$ 136$ 128$ Classified to Tier 1 + ALL 20% 20% 18% 18% 17% $128 $122 $116 $136 $128 $110 $130 $150 4Q14 1Q15 2Q15 3Q15 4Q15

ucbi.com | 27 $81.3 $82.3 $86.1 $84.6 $83.0 $75 $80 $85 $90 $95 $100 4Q14 1Q15 2Q15 3Q15 4Q15 TDRs ucbi.com | 27 $ in millions LOAN TYPE 4Q15(1) 3Q15 4Q14 4Q15 3Q15 4Q14 4Q15 3Q15 4Q14 Commercial & Industrial 2.8$ 3.5$ 25.3$ 0.1$ -$ 1.0$ 2.9$ 3.5$ 26.3$ Owner-Occupied CRE 30.8 31.6 17.4 1.3 1.2 0.5 32.1 32.8 17.9 Income-Producing CRE 15.4 14.1 2.7 .2 .3 .1 15.6 14.4 2.8 Commercial Construction 10.5 11.2 11.3 .1 .1 - 10.6 11.3 11.3 Total Commercial 59.5 60.4 56.7 1.7 1.6 1.6 61.2 62.0 58.3 Residential Mortgage 17.2 17.3 16.0 1.6 2.1 1.8 18.8 19.4 17.8 Residential HELOC .2 .5 .5 - - - 0.2 0.5 0.5 Residential Construction 5.2 5.7 7.9 .1 .3 .4 5.3 6.0 8.3 Consumer / Installment .9 .7 .2 .2 .1 - 1.1 0.8 0.2 Total TDRs 83.0$ 84.6$ 81.3$ 3.6$ 4.1$ 3.8$ 86.6$ 88.7$ 85.1$ Accruing Non-Accruing Total TDRs Accruing TDRs ► Accruing TDR past due 30 – 89 days = .51% ► 60% of accruing TDRs are pass credits (1) 66% of accruing TDR loans have an interest rate of 4% or greater

ucbi.com | 28 Lending & Credit Environment ucbi.com | 28 Outstanding Multi-Residential 84$ 24.6 % Land Develop - Vacant (Improved) 56 16.4 Retail Building 49 14.3 Commercial Land Development 32 9.3 Raw Land - Vacant (Unimproved) 31 9.1 Other Properties 30 8.8 Hotels / Motels 26 7.6 Warehouse 15 4.4 Restaurants / Franchise 10 2.9 Office Buildings 8 2.3 Assisted Living/Nursing Home/Rehab 1 0.3 Total Commercial Construction 342$ 100.0 % % of Category Commercial Real Estate Mix i n millions Commercial Construction Mix i n millions Owner- Occupied Income- Producing Total Office Buildings 375$ 208$ 583$ 25.2 % Retail Building 121 226 347 15.0 Other Properties 199 38 237 10.2 Warehouse 150 74 224 9.7 Churches 176 - 176 7.6 Convenience Stores 90 47 137 5.9 Hotels / Motels - 86 86 3.7 Manufacturing Facility 66 17 83 3.6 Restaurants / Franchise Fast Food 53 26 79 3.4 Multi-Residential - 67 67 2.9 Assisted Living / Nursing Home 62 5 67 2.9 Farmland 62 - 62 2.7 Golf Course / Country Club 40 - 40 1.7 Leasehold Property 16 8 24 1.0 Carwash 22 - 22 0.9 Automotive Service 13 7 20 0.9 Automotive Dealership 16 3 19 0.8 Daycare Facility 10 6 16 0.7 Funeral Home 15 - 15 0.6 Mobile Home Parks - 6 6 0.3 Marina 5 - 5 0.2 Movie Theaters / Bowling / Rec 3 - 3 0.1 Total Commercial Real Estate 1,494$ 824$ 2,318$ 100.0 % Outstanding % of Category Average Loan Size (in thousands) • Commercial Construction $577 • Commercial RE: • Composite CRE 461 • Owner - Occupied 410 • Income - Producing 594 Commercial RE Characteristics • 64% owner occupied • Small business, doctors, dentists, attorneys, CPAs • $17 million project limit