Attached files
| file | filename |
|---|---|
| 8-K - FORM 8-K - TWINLAB CONSOLIDATED HOLDINGS, INC. | v429161_8k.htm |
Exhibit 99.1

The Presentation was prepared by the Company for delivery to a limited number of sophisticated prospective investors to assist such investors in deciding whether to proceed with a further investigation and diligence of the Company, and should not be relied upon otherwise. It contained numerous assumptions and was not prepared for or intended for public disclosure. The information should not be regarded as an indication that the Company considered or consider s such information to be predictive of actual future events, and such information should not be relied upon as such. The pieces of information in the Presentation that are not descriptions of historical facts are forward - looking statements that are based on management’s current expectations and assumptions and are subject to risks and uncertainties. If such risks or uncertainties materialize or such assumptions prove incorrect, our business, operating results, financial condition and stock price could be materially negatively affected. In some cases, you can identify forward - looking statements by terminology including “anticipates,” “believes,” “can,” “continue,” “could,” “estimates,” “expects,” “intends,” “may,” “plans,” “potential,” “predicts,” “should,” “will,” “would” or the negative of these terms or other comparable terminology. Factors that could cause actual results to differ materially from those currently anticipated include those set forth in the section titled “Risk Factors” in TCH’s Annual Report on Form 10 - K for the year ended December 31, 2014 filed on March 31, 2015 (the “2014 Annual Report”) and subsequent filings with the SEC, including, without limitation, risks relating to: - our need for substantial additional funds in order to continue our operations and pursue our business plans, and the uncertainty of whether we will be able to obtain the funding we need; - - - our ability to integrate existing and potential acquisitions successfully; our ability to retain or hire key management personnel; our ability to protect our intellectual property rights that are valuable to our business, including patent, trademark and other intellectual property rights;

- - dependence on third - party manufacturers, suppliers, distributors and other potential commercial partners; the size and growth of the potential markets for our products, and the rate and degree of market acceptance of any of our products; competition in our industry; - - regulatory developments in the United States and foreign countries; consumer perception of our products due to adverse scientific research or findings, regulatory investigations, litigation, national media attention and other publicity regarding nutritional supplements; - - - - - - potential slow or negative growth in the vitamin, mineral and supplement market; increases in the cost of borrowings or unavailability of additional debt or equity capital, or both; volatile condition in the capital, credit and commodities markets and in the overall economy; dependency on retail stores for sales; the loss of significant customers; compliance with new and existing federal, state, local or foreign legislation or regulation, or adverse determination by regulators anywhere in the world (including the banning of products) and, in particular, Food and Drug Administration Good Manufacturing Practices (“GMP”), Dietary Supplement Health and Education Act of 1994 (“DSHEA”), Food Safety Modernization Act (“FSMA”), California’s Safe Drinking Water and Toxic Enforcement Act of 1986 (“Proposition 65),” in the United States, the Natural Health Products Regulations in Canada, the Food Supplements Directive and Traditional Herbal Medicinal Products Directive (the “Herbal Products Directive”) in Europe and greater enforcement by any such federal, state, local or foreign governmental entities; - - - - - - material product liability claims and product recalls; our inability to obtain or renew insurance, or to manage insurance costs; international market exposure and compliance with anti - corruption laws in the U.S. and foreign jurisdiction; difficulty entering new international markets; legal proceedings initiated by regulators in the U.S. or abroad; unavailability of, or our inability to consummate, advantageous acquisitions in the future, or our inability to integrate acquisitions into the mainstream of our business, or our ability to recognize the synergies of any acquisitions we are able to consummate; - - - - - - - difficulty entering new international markets; loss of executive officers or other key personnel; loss of certain third - party suppliers; the availability and pricing of raw materials; disruptions in manufacturing operations that produce nutritional supplements and loss of manufacturing certifications; increased competition and failure to compete effectively; our inability to respond to changing consumer preferences;

- interruption of business or negative impact on sales and earnings due to acts of God, acts of war, sabotage, terrorism, bio - terrorism, civil unrest or disruption of delivery service; - - - - work stoppages at our facilities; increased raw material, utility and fuel costs; fluctuations in foreign currencies, including, in particular, the Euro, the Canadian dollar and the Chinese Yuan; interruptions in information processing systems and management information technology, including system interruptions and security breaches; - - - - - failure to maintain and/or upgrade our information technology systems; our exposure to, and the expense of defending and resolving, product liability claims, intellectual property claims and other litigation; failure to maintain effective controls over financial reporting; other factors disclosed in the 2014 Annual Report and other SEC filings; and other factors beyond our control. We operate in a very competitive and rapidly - changing environment and new risks emerge from time to time. As a result, it is not possible for our management to predict all risks, nor can we assess the impact of all factors on our business or the extent to which any factor, or combination of factors, may cause actual results to differ materially from those contained in any forward - looking statements we may make. In light of these risks, uncertainties and assumptions, the forward - looking events and circumstances discussed in the Presentation may not occur and actual results could differ materially and adversely from those anticipated or implied in the forward - looking statements. You should not rely upon forward - looking statements as predictions of future events. We cannot guarantee that the future results, levels of activity, performance or events and circumstances reflected in the forward - looking statements will be achieved or occur. Moreover, neither we nor any other person assumes responsibility for the accuracy and completeness of the forward - looking statements. The forward - looking statements included in t he Presentation speak only as of the date they were initially prepared, and we undertake no obligation to update publicly any forward - looking statements for any reason after the date of the Presentation this report to conform these statements to actual results or to changes in our expectations, including items that are stale in the Presentation as of the date of this report.
Twinlab Consolidated Holdings, Inc. Consolidating the Nutrition Industry… Presentation November 2015
P u rpo se… 1 The following information was prepared by the Company for delivery to a limited number of sophisticated prospective investors to assist such investors in deciding whether to proceed with a further investigation and diligence of the Company, and should not be relied upon otherwise . It contained numerous assumptions and was not prepared for intended public disclosure . The information should not be regarded as an indication that the Company considered or consider such information to be predictive of actual future events, and such information should not be relied upon as such . TCC has been built through the acquisition of Twinlab Corporation and Organic Holdings, LLC (owner of Reserveage ™ Nutrition), as well as the acquisition of assets of Nutricap Labs, LLC, including primarily its book of contract manufacturing services business. A new management and ownership team at Twinlab have established TCC as an acquisition vehicle conducting a consolidation program in the nutrition and healthy living industries . With several acquisitions completed and integrations in process, the company has set the foundation for reaching its goal of achieving significant profitable revenue in five years . Twinlab Consolidated Holdings, Inc. is traded in the OTC ‘pinks’ under the symbol TLCC . 1
Legal Notices THIS CONFIDENTIAL PRESENTATION PRESENTS SELECTED INFORMATION WITH RESPECT TO TWINLAB CONSOLIDATION CORPORATION (“TCC”) AND OF TCC’S PARENT COMPANY, TWINLAB CONSOLIDATED HOLDINGS, INC. (“TCH” AND TOGETHER WITH ITS AFFILIATES, THE “COMPANY”) AND DOES NOT PURPORT TO BE ALL INCLUSIVE. THIS PRESENTATION DOES NOT CONSTITUTE AN OFFER TO SELL ANY SECURITIES TO OR SOLICITATION OF AN OFFER TO BUY ANY SECURITIES FROM ANY PERSON. THIS PRESENTATION DOES NOT DESCRIBE ALL THE VARIOUS RISKS WITH RESPECT TO AN INVESTMENT IN OUR SECURITIES AND AN INVESTMENT IN SECURITIES OF THE COMPANY IS SPECULATIVE AND WILL INVOLVE A HIGH DEGREE OF RISK. WITH RESPECT TO ANY SUCH INVESTMENT, YOU MUST BE PREPARED TO BEAR THE ECONOMIC RISK OF THE INVESTMENT FOR AN INDEFINITE PERIOD OF TIME AND BE ABLE TO WITHSTAND A TOTAL LOSS OF YOUR INVESTMENT. THIS PRESENTATION INCLUDES CERTAIN FORWARD - LOOKING STATEMENTS WITH RESPECT TO OUR ANTICIPATED FUTURE PERFORMANCE. YOU CAN IDENTIFY THESE STATEMENTS BY FORWARD - LOOKING WORDS SUCH AS “MAY,” “WILL,” “EXPECT,” “INTEND,” “POTENTIAL” “PLAN” “ANTICIPATE,” “BELIEVE,” “ESTIMATE” AND “CONTINUE” OR SIMILAR WORDS, OR THAT THE INFORMATION IS FINANCIAL INFORMATION REGARDING FUTURE TIME PERIODS. YOU SHOULD READ STATEMENTS THAT CONTAIN THESE WORDS OR THIS INFORMATION CAREFULLY BECAUSE THEY DISCUSS OUR FUTURE EXPECTATIONS, CONTAIN PROJECTIONS OF OUR FUTURE RESULTS OF OPERATIONS OR OF OUR FINANCIAL CONDITION OR STATE OTHER “FORWARD - LOOKING” INFORMATION. HOWEVER, THESE STATEMENTS, ESTIMATES AND PROJECTIONS ARE BASED ON NUMEROUS ESTIMATES AND OTHER ASSUMPTIONS ABOUT FUTURE EVENTS AND CIRCUMSTANCES, MANY OF WHICH WILL NOT BE WITHIN OUR CONTROL INCLUDING, WITHOUT LIMITATION, THOSE RISKS SET FORTH IN THE “ITEM 1A. RISK FACTORS” SECTION OF THE ANNUAL REPORT ON FORM 10 - K FILED BY TCH WITH THE SECURITIES AND EXCHANGE COMMISSION ON MARCH 31, 2015 AS UPDATED BY TCH’S OTHER SEC FILINGS. WE BELIEVE THAT SUCH ESTIMATES AND OTHER ASSUMPTIONS ARE REASONABLE UNDER THE CIRCUMSTANCES, BUT NO REPRESENTATION, WARRANTY OR OTHER ASSURANCE IS GIVEN WHATSOEVER THAT SUCH FORWARD - LOOKING STATEMENTS WILL BE ACCURATE. THERE WILL BE VARIANCES BETWEEN THESE STATEMENTS, ESTIMATES AND PROJECTIONS AND ACTUAL EVENTS AND RESULTS, AND THESE VARIATIONS WILL LIKELY BE MATERIAL AND POTENTIALLY ADVERSE. THOSE RISKS SET FORTH IN THE “ITEM 1A. RISK FACTORS” SECTION OF THE ANNUAL REPORT ON FORM 10 - K FILED BY TCH WITH THE SEC ON MARCH 31, 2015, ANY SUBSEQUENT FILINGS BY TCH WITH THE SEC, AS WELL AS ANY OTHER CAUTIONARY LANGUAGE IN THIS INFORMATION MEMORANDUM OR A PPM (COLLECTIVELY “THE RISK FACTORS”), PROVIDE OR WILL PROVIDE EXAMPLES OF RISKS, UNCERTAINTIES AND EVENTS THAT MAY CAUSE OUR ACTUAL RESULTS TO DIFFER MATERIALLY FROM THE EXPECTATIONS WE DESCRIBE IN OUR FORWARD - LOOKING STATEMENTS. BEFORE YOU INVEST IN SECURITIES OF THE COMPANY, YOU SHOULD BE AWARE THAT THE OCCURRENCE OF THE EVENTS DESCRIBED IN THE RISK FACTORS REFERENCED ABOVE COULD HAVE A MATERIAL ADVERSE EFFECT ON OUR BUSINESS, OPERATING RESULTS AND FINANCIAL CONDITION, AND ANY INVESTMENT IN THE COMPANY. THIS PRESENTATION DOES NOT PURPORT TO BE ALL - INCLUSIVE. STATISTICAL MARKET DATA AND CERTAIN INDUSTRY FORECASTS RELATING TO THE INDUSTRY AND USED IN THIS PRESENTATION WERE OBTAINED FROM OUR INTERNAL ANALYSIS, MARKET RESEARCH, PUBLICLY AVAILABLE INFORMATION AND INDUSTRY PUBLICATIONS. INDUSTRY PUBLICATIONS GENERALLY PROVIDE THAT THE INFORMATION CONTAINED THEREIN HAS BEEN OBTAINED FROM SOURCES BELIEVED TO BE RELIABLE, BUT THAT THE ACCURACY AND COMPLETENESS OF SUCH INFORMATION IS NOT GUARANTEED. SIMILARLY, INTERNAL SURVEYS, INDUSTRY FORECASTS AND MARKET RESEARCH, WHILE BELIEVED TO BE RELIABLE, HAVE NOT BEEN INDEPENDENTLY VERIFIED BY US AND WE DO NOT MAKE ANY REPRESENTATION AS TO THE ACCURACY OF THIS INFORMATION. EXCEPT AS OTHERWISE INDICATED, THIS PRESENTATION SPEAKS AS OF THE DATE INDICATED ABOVE AND WE HAVE NO DUTY TO UPDATE THE INFORMATION CONTAINED HEREIN AS A RESULT OF NEW INFORMATION, FUTURE EVENTS OR OTHERWISE. THE DELIVERY OF THIS PRESENTATION SHALL NOT, UNDER ANY CIRCUMSTANCES, CREATE AN IMPLICATION THAT THERE HAS BEEN NO CHANGE IN OUR AFFAIRS AFTER THE DATE INDICATED ABOVE. 2 2

Twinlab Consolidation Corporation has been established to consolidate the fragmented nutrition industry . It has been built through the acquisition of Twinlab Corporation, Organic Holdings, LLC and assets of Nutricap Labs, LLC, setting a strong foundation for future growth . P r e mis e … 3 3

1 History Ongoing Development and Strategy for Acquisitions 5 Co n t e n ts 2 Business Plan 3 Potential Results and Synergies 4 Illustrative Consolidated Companies Five Year 4 4

History…Foundation… Management identified Twinlab as the foundation for a branded and contract manufacturing consolidation due to its broad market base, brand strength, reputation for quality and significant manufacturing capacity. • 48 year history – one of the original creators of the industry • Strong core brands to build on: • Strong contract manufacturing and private label base • Strong customer base 5 5

Hi s t o r y…T i me l in e … Trusted leader for innovative high performance products for over 47 years. 1968 F o und ing 1969 – 2000 Expansion and Growth 2000 – 2010 Lost Years TCC Strategic Renewal 1 2 3 4 2011 – Present • Founded by the a Long Island family and named for their two sets of twin sons, in Hauppauge, NY • Focused initially on protein products for weight loss • Becomes known as the leader in sports nutrition products for athletes and bodybuilders • Entered vitamin market • Sales reached $100 million (1980) • Four major acquisitions: x Nature’s Herbs (1989) x Alvita Herbal Teas (1991) x Bronson Nutritional (1998) x Health Factors (1998) • IPO on NASDAQ (1996) • Market cap of $800+ mm (1997) • “Manufacturer of the Year” (1998) • Filed for bankruptcy protection following the loss of Ephedra business (2003) • Purchased out of bankruptcy by IdeaSphere for $63 million (2003) • Post - bankruptcy initiatives stalled while consumer interest flourished and the industry grew • Board examined strategic options for future in 2010 and determined to hire new Chief Executive Officer. • Tom Tolworthy hired as new President and CEO • Turnaround plan adopted • Three senior executives retained: HNF/Specialty, Chief Science Officer, Chief Legal Officer • Six new senior executives hired • Posted $4.4M EBITDA (2012) • Acquired Trigosamine brand (2013) • Divested Nature’s Herbs brand (2013) • Formed TCC (2013) • TCC acquires Twinlab (2014) • TCC reverse merger into TCH (2014) • Acquired assets from Nutricap Labs, LLC • Acquired Organic Holdings, LLC 6 6
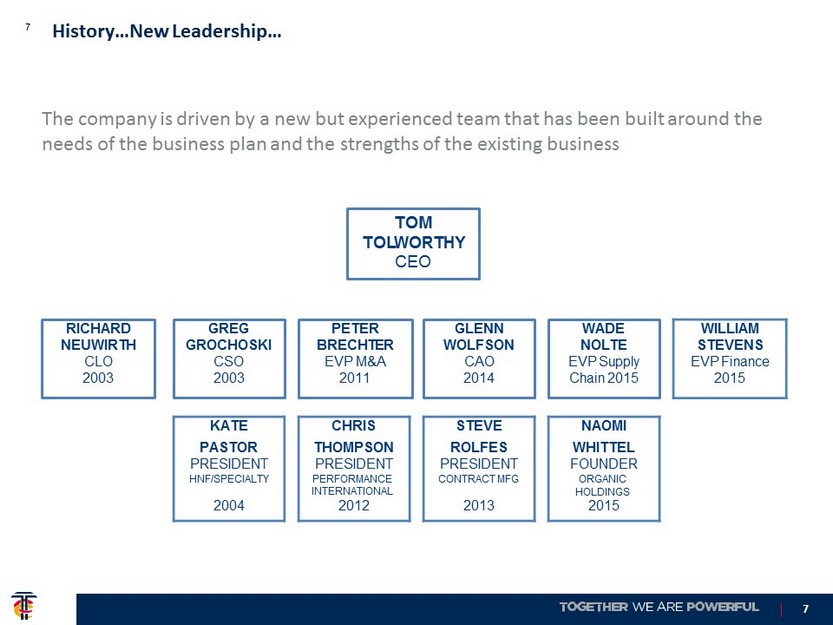
History…New Leadership… The company is driven by a new but experienced team that has been built around the needs of the business plan and the strengths of the existing business TOM T O L W O RTH Y CEO RICHARD NEU W IRTH CLO 2003 GREG GROCHOSKI CSO 2003 PETER B R EC H TER EVP M&A 2011 GLENN W OLFSON CAO 2014 WADE NO L TE EVP Supply Chain 2015 WILLIAM STEVENS EVP Finance 2015 KATE CHRIS STEVE NAOMI PASTOR THOMPSON ROLFES WHITTEL PRESIDENT PRESIDENT PRESIDENT FOUNDER HNF/SPECIALTY PERFORMANCE INTERNATIONAL CONTRACT MFG ORGANIC HOLDINGS 2004 2012 2013 2015 7 7

After almost a decade of losses, the new team turned Twinlab around in 2012 and started preparing it for a new future in 2013. Histo 9 ry…Turnaround… 8

History…Strategic Direction… 9 TCC is consolidating the nutrition industry. • $34 billion dollar industry • Growing even through economic downturns • Thousands of successful middle market companies • Only two US companies with revenue over $3 billion • NBTY, Inc. (acquired by Carlyle Group) • Perrigo • A company with revenue over $80 million is large in this industry • Being entered by both consumer product companies and pharma companies: Reckitt Benckiser, Hershey, Pfizer, Procter & Gamble and others. 9

1 Our History 2 Business Plan Potential Results and Synergies 3 Ongoing Development and Strategy for Acquisitions 5 4 Illustrative Consolidated Companies Five Year 10 10

Clear Objective Create a $1 billion highly regarded market - leading seller, marketer, distributor and manufacturer of branded nutraceutical products in the Health and Wellness industry. 11 Busin 1 e 2 ss Plan…Objective…

Leverage coherent vertical and horizontal integration strategy to generate superior returns from synergies with pre - existing capabilities: Distribution – Advertising – Manufacturing - Marketing ▪ Increase utilization of UT facility to reduce costs • Optimize manufacturing to increase through - put • Leverage distribution reach and consumer insights to accelerate cross - selling • Spread fixed costs and SG&A across a much larger business base Acquisition vehicle utilizing legacy assets, owning supply chain, entering adjacent channels of distribution, consolidating branded revenue, and leveraging organic growth opportunities ▪ Drive synergies across multiple channels ▪ Increase market presence in growth categories ▪ Optimize innovation ▪ Build out contract manufacturing capability and aggressively pursue private label growth ▪ Focus on channel consumer to maximize product selection and leverage existing formulas across multiple channels ▪ Consolidate efficiencies ▪ Develop/acquire new channels to drive economies of scale ▪ Expand international reach ▪ Refine international supply chain Create strong foundation of low cost production to maximize profitability Focus on higher margin, branded acquisitions to build top - line revenue and EBITDA Purpose Plan of Attack Execution 1 2 3 4 Business Plan…Tactics and Execution… A B 12 12

For med Acquired Reverse Merger Into TCH P e n t a JL - BBNC M id c ap Acquired 2014 2015 Business Plan…Execution to date… Initial Recapitalization Stock Begins T r a d ing Acquired 13 13
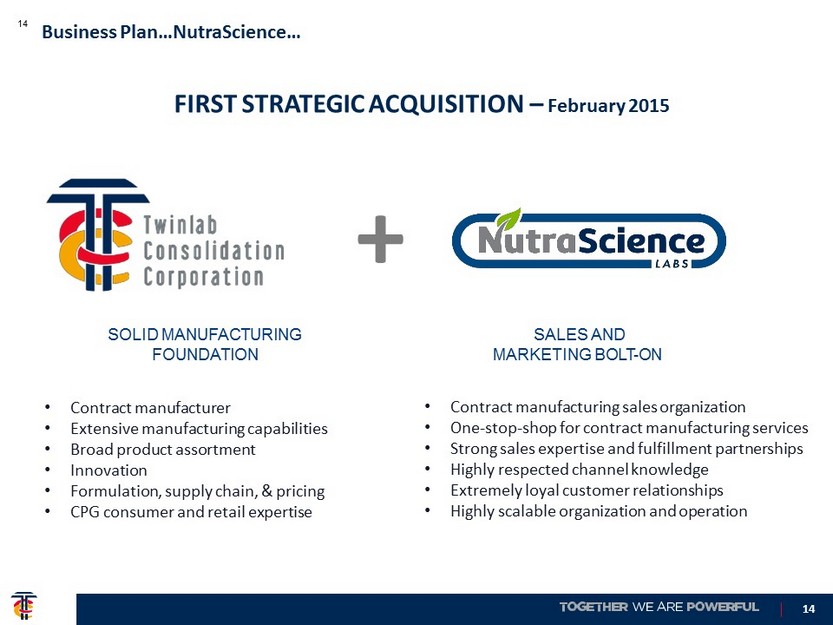
• Contract manufacturer • Extensive manufacturing capabilities • Broad product assortment • Innovation • Formulation, supply chain, & pricing • CPG consumer and retail expertise • Contract manufacturing sales organization • One - stop - shop for contract manufacturing services • Strong sales expertise and fulfillment partnerships • Highly respected channel knowledge • Extremely loyal customer relationships • Highly scalable organization and operation FIRST STRATEGIC ACQUISITION – February 2015 + 14 Business Plan…NutraScience… SOLID MANUFACTURING FOUNDATION SALES AND MARKETING BOLT - ON 14

• Branded product lines • Twinlab • T rigosamine • Metabolife • Alvita • Distribution in major retail channels • Distribution in 70 countries • Low cost manufacturing capabilities SECOND STRATEGIC ACQUISITION – October 2015 + Business Plan…Organic Holdings… SOLID BRANDED DISTRIBUTION STRONG BRANDS IN ADJACENT DISTRIBUTION CHANNELS • Category captain in growing category • Fast growing categories • High profile products • New product development/launch experts • Highly respected channel knowledge • Loyal customer relationships • New/non - overlapping channels of distribution • Manufacturing synergies available 15 15
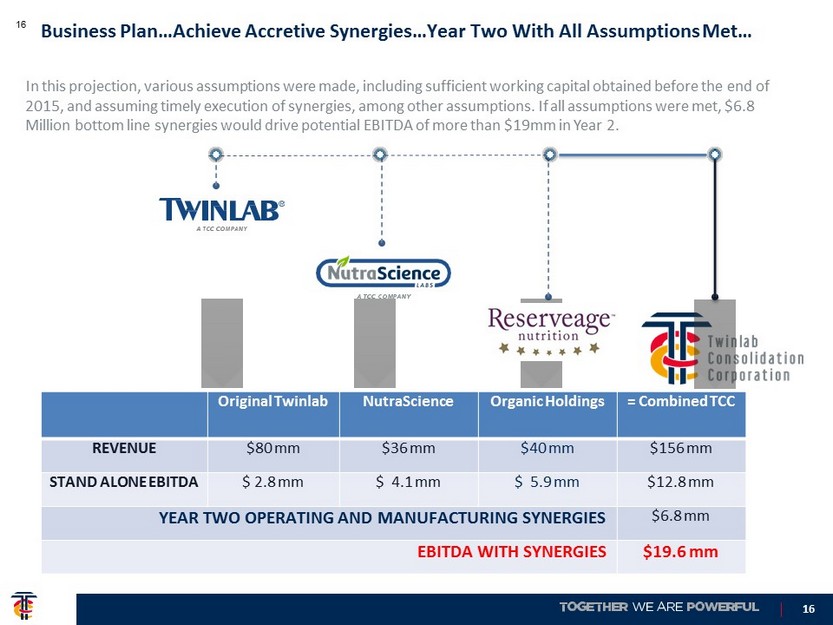
Original Twinlab NutraScience Organic Holdings = Combined TCC REVENUE $80 mm $36 mm $40 mm $156 mm STAND ALONE EBITDA $ 2.8 mm $ 4.1 mm $ 5.9 mm $12.8 mm YEAR TWO OPERATING AND MANUFACTURING SYNERGIES $6.8 mm EBITDA WITH SYNERGIES $19.6 mm Business Plan…Achieve Accretive Synergies…Year Two With All Assumptions Met… In this projection, various assumptions were made, including sufficient working capital obtained before the end of 2015, and assuming timely execution of synergies, among other assumptions. If all assumptions were met, $6.8 Million bottom line synergies would drive potential EBITDA of more than $19mm in Year 2. 16 16
1 Our History Business Plan 2 3 Potential Results and Synergies Ongoing Development and Strategy for Acquisitions 5 4 Illustrative Consolidated Companies Five Year 17 17

Results…Twinlab… Following the turnaround in 2013, management went to work transforming Twinlab into a strong foundation for continued expansion. It did this by conducting a series of transactions including the elimination of debt, a management buyout, a reverse merger into a public shell and two acquisitions. 18 • 2014 saw heavy legal, accounting and transaction expense associated with the elimination of debt, the management buyout, reverse merger into the public shell and negotiation of options to purchase Organic Holdings and assets of Nutricap Labs, among other items. • The company also chose to write off several sun - setting operations in 2014. • In 2015 Twinlab continued heavy transactional spending as it executed the acquisition of Nutricap assets in February and Organic Holdings in October. • Major impact was felt in 2015 from reduced net sales at Twinlab. While the company continued to receive orders, it was unable to deliver product due to capital constraints. This was caused by the longer than anticipated time taken by management to recapitalize the company following the reverse merger into TCH. The company is in the process of attempting to improve its capital availability through either new debt or equity investment to provide the liquidity necessary to return Twinlab to a 95% fill rate and allow sales growth. • Legal and accounting expenses associated with SEC reporting have also been a factor as the company communicates these complicated internal activities to its public shareholders. Activity in this area is expected to stabilize. 18

Results and Potential Synergies…Twinlab…P&L… Twinlab absorbed heavy transaction - related costs in 2014 and 2015. At the same time capital constraints drove declining sales in 2015, due primarily to inability to maintain fill rates. The company is in the process of seeking additional working capital through new debt or equity investment. It should be noted that the figures in this presentation were projections based on a number of assumptions, including obtaining certain funding by December 2015 in an amount sufficient to meet the company's working capital needs and the timely execution of internal initiatives. Twinlab Corporation (TWLB) 2013 thru 2017 Potential Integration - Y e a r 2013 2014 2015 2015 2015 2016 2017 2017 T y p e Act Act Act Fcst Act Unaud/ Fcst Gro w t h Fcst S ou r c e Audited Audited Unaudited Mgmt Mgmt Fcst Mgmt Mgmt Mgmt D u r a t i o n 12 Mo. 12 Mo. 9 Mo. 3 Mo. 12 Mo. 12 Mo. 12 Mo. 12 Mo. Contract Sales (Gross Revenue) $ 91,874 $ 76,696 $ 48,554 $ 12,473 $ 61,027 $ 70,696 $ 9,190 $ 79,886 Net Sales 76,230 61 , 42 6 40 , 25 8 10,446 50,704 57,541 7 , 48 0 65 , 02 1 Cost of Sales 52,647 47,654 35 , 46 2 9,201 44,663 38,216 4 , 96 8 43,184 Gross Profit 23,583 13,772 4 , 79 6 1,244 6,041 19,325 2 , 51 2 21 , 83 7 - SG&A Expenses 23,391 25 , 92 4 17 , 06 9 4,300 21,369 17,765 196 17 , 96 1 Operating Income/(Loss) 192 ( 12 , 152 ) ( 12 , 273 ) ( 3 , 056 ) ( 15 , 328 ) 1,560 2 , 31 6 3 , 87 6 Total Other Expense ( 2 , 641 ) ( 8 , 917 ) ( 19 , 392 ) ( 1 , 763 ) ( 21 , 155 ) ( 5 , 417 ) - ( 5 , 417 ) Income/(Loss) before Inc Tax ( 2 , 449 ) ( 21 , 069 ) ( 31 , 665 ) ( 4 , 819 ) ( 36 , 483 ) ( 3 , 857 ) 2 , 31 6 ( 1 , 541 ) Provision for Income Taxes ( 33 ) ( 61 ) ( 1 ) ( 1 ) ( 1 , 097 ) ( 3 , 201 ) ( 4 , 297 ) Net Income/(Loss) ( 2 , 482 ) ( 21 , 130 ) ( 31 , 666 ) ( 4 , 819 ) ( 36 , 484 ) ( 4 , 954 ) ( 885 ) ( 5 , 839 ) Depreciation & Amortization 1,301 1 , 07 4 950 317 1 , 26 7 1,215 - 1 , 21 5 Interest 5,547 6 , 38 8 5 , 28 9 1,763 7 , 05 2 5,417 - 5 , 41 7 Taxes 33 61 1 - 1 1,097 3 , 20 1 4 , 29 7 Other One - time/Non - Cash Items - 2 , 37 3 15 , 54 6 411 15,957 - - EBITDA 4,399 ( 11 , 234 ) ( 9 , 880 ) ( 2 , 328 ) ( 12 , 207 ) 2,775 2 , 31 6 5 , 09 1 19 19 *I n addition to the assumptions identified above, we note that for the purpose for which this particular analysis was created that the taxes and interest numbers in the forecasted co l umns were placeholders and not intended to depict a n t ici pated projected numbers.

Results and Potential Synergies…NutraScience Labs…P&L… Created to hold the Nutricap Labs assets acquired in February 2015, NutraScience Labs, Inc. has already achieved certain SG&A savings. In this analysis, synergies from in - house production are assumed to be achieved in 2017. NutraScience Labs (NSL) 2013 thru 2017 Potential Integration Y e a r 2013 2014 2015 2016 2016 2017 2017 2017 T y p e Act Act A c t / F c s t SG&A Mgmt Fcst Fcst In - House Prod Savings Fcst Growth Fcst S o u r c e NC Audited NC NSL Savings Mgmt Mgmt Fcst Mgmt Mgmt D u r at i o n 12 Mo.* 12 Mo.* 12 Mo. 12 Mo. 12 Mo. 12 Mo. 12 Mo. 12 Mo. Contract Sales $ 32,671 $ 30,534 $ 30,477 $ 30,477 $ 4,572 $ 35 , 04 8 Net Sales 32,671 30,534 30 , 47 7 - 30 , 47 7 4,572 35 , 04 8 Cost of Sales 24,652 22,613 23 , 68 0 ( 1 , 000 ) 22 , 68 0 ( 1 , 000 ) 3,552 25 , 23 2 Gross Profit 8,019 7 , 92 1 6 , 79 7 1 , 00 0 7,797 1 , 00 0 1,019 9,816 SG&A Expenses 6,688 6 , 61 2 4 , 72 2 ( 150 ) 4,572 91 4,664 Operating Income/(Loss) 1,331 1 , 30 9 2 , 07 4 1 , 15 0 3,224 1 , 00 0 928 5,152 Interest Expense, Net ( 3 ) ( 0 ) - - - - - Realized Gain on Mkt Sec - - - - - - - Other Income/(Exp), Net - - - - - - - Total Other Expense ( 3 ) ( 0 ) - - - - - Income/(Loss) before Inc Tax 1,328 1 , 30 9 2 , 07 4 1 , 15 0 3,224 1 , 00 0 928 5,152 Provision for Income Taxes - - - - - Net Income/(Loss) 1,328 1 , 30 9 2 , 07 4 1 , 15 0 3,224 1 , 00 0 928 5,152 Depreciation & Amortization 234 223 177 ( 177 ) - - Interest 3 3 - - - - Taxes - - - - Other One - time items - - - - EBITDA 1,565 1 , 53 5 2 , 25 1 973 3,224 1 , 00 0 928 5,152 20 20 2013 and 2014 numbers are for Nutricap Labs, LLC. NutraScience Labs acquired assets of Nutricap, including primarily its book of business, in February 2015. * I n addition to the assumptions identified above, we note that for the purpose for which this particular analysis was created that the taxes and interest numbers in the forecasted co l umns were placeholders and not intended to depict an ti cipated projected numbers.

Results and Potential Synergies…NutraScience Labs TCC worked with outside consultants in 2014 to develop a projected synergy analysis for the integration of the acquisition of the Nutricap book of business into NSL, including significant integration of manufacturing into TCC. The company already achieved most of the SG&A synergies in 2015 and seeks to capture significant manufacturing synergies in 2016. 21 21
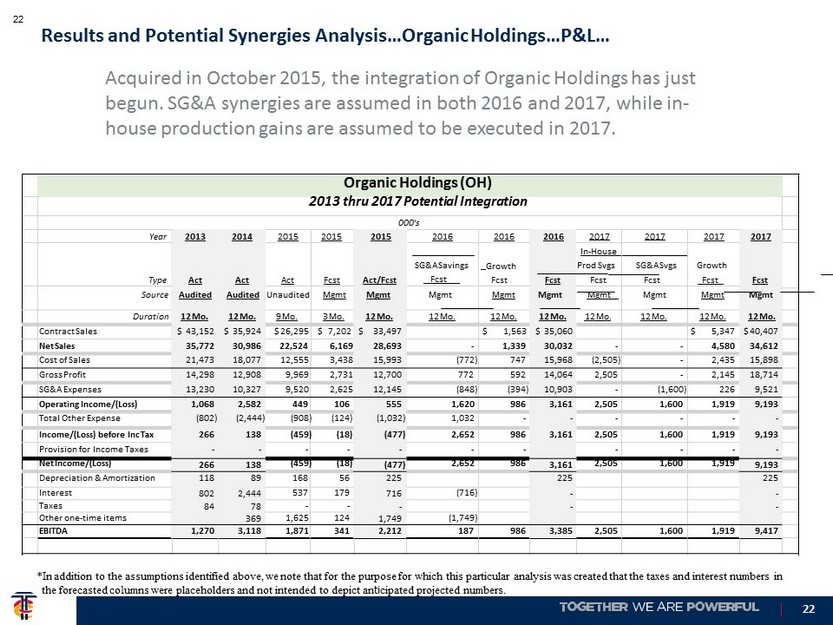
Results and Potential Synergies Analysis…Organic Holdings…P&L… Acquired in October 2015, the integration of Organic Holdings has just begun. SG&A synergies are assumed in both 2016 and 2017, while in - house production gains are assumed to be executed in 2017. Organic Holdings (OH) 2013 thru 2017 Potential Integration 000 's Y e a r 2013 2014 2015 2015 2015 2016 2016 2016 2017 2017 T y p e Ac t Ac t A c t F c s t Act/Fcst SG&A Savings Fcst Growth Fcst F c s t 2017 2017 In - House Prod Svgs SG&A Svgs Fcst Fcst Fcst F c s t S ou r c e A ud i t e d A ud i t e d Unaudite d Mgmt Mgmt Mgmt Mgmt Mgmt Mgmt Mgmt Mgmt Mgmt D u r a t i o n 12 Mo. 12 Mo. 9 Mo. 3 Mo. 12 Mo. 12 Mo. 12 Mo. 12 Mo. 12 Mo. 12 Mo. 12 Mo. 12 Mo. Contract Sales $ 43,152 $ 35,924 $ 26,295 $ 7,202 $ 33,497 $ 1,563 $ 35,060 $ 5 , 34 7 $ 40 , 40 7 Net Sales 35 , 77 2 30 , 98 6 22 , 52 4 6,169 28 , 69 3 - 1 , 33 9 30 , 03 2 - - 4 , 58 0 34 , 61 2 Cost of Sales 21 , 47 3 18 , 07 7 12 , 55 5 3,438 15 , 99 3 ( 772 ) 747 15 , 96 8 ( 2 , 505 ) - 2 , 43 5 15 , 89 8 Gross Profit 14 , 29 8 12 , 90 8 9 , 96 9 2,731 12 , 70 0 772 592 14 , 06 4 2 , 50 5 - 2 , 14 5 18 , 71 4 SG&A Expenses 13 , 23 0 10 , 32 7 9 , 52 0 2,625 12 , 14 5 ( 848 ) ( 394 ) 10 , 90 3 - ( 1 , 600 ) 226 9 , 52 1 Operating Income/(Loss) 1 , 06 8 2 , 58 2 449 106 555 1 , 62 0 986 3 , 16 1 2 , 50 5 1 , 60 0 1 , 91 9 9 , 19 3 Total Other Expense ( 802 ) ( 2 , 444 ) ( 908 ) ( 124 ) ( 1 , 032 ) 1 , 03 2 - - - - - - Income/(Loss) before Inc Tax 266 138 ( 459 ) ( 18 ) ( 477 ) 2 , 65 2 986 3 , 16 1 2 , 50 5 1 , 60 0 1 , 91 9 9 , 19 3 Provision for Income Taxes - - - - - - - - - - - Net Income/(Loss) 266 138 ( 459 ) ( 18 ) ( 477 ) 2 , 65 2 986 3 , 16 1 2 , 50 5 1 , 60 0 1 , 91 9 9 , 19 3 Depreciation & Amortization 118 89 168 56 225 225 225 Interest 802 2 , 44 4 537 179 716 ( 716 ) - - Taxes 84 78 - - - - - Other one - time items 369 1 , 62 5 124 1 , 74 9 ( 1 , 749 ) EBITDA 1 , 27 0 3 , 11 8 1 , 87 1 341 2 , 21 2 187 986 3 , 38 5 2 , 50 5 1 , 60 0 1 , 91 9 9 , 41 7 G ro w t h 22 22 * I n addition to the assumptions identified above, we note that for the purpose for which this particular analysis was created that the taxes and interest numbers in the forecasted co l umns were placeholders and not intended to depict an ti cipated projected numbers.

Synergy Due Diligence Model 1) Management analysis with outside consultants in 2014 indicated that Cost of Sales would decline $3,418k in Year 1 based on savings from in - house production move to the Utah factory (9 months of assumed savings); In Year 2 COGS savings increase to $4,549k. 2) The synergy model analysis indicated that headcount and other spend reductions would yield SG&A savings total of $8,751k when compared to 2013. In Year 1, savings vs 2013 are expected to be $7,732k. Since OH Mgmt already made $6,890k of the changes in 2014, the savings showing Year 1 SG&A Y e a r T yp e S ou r c e D u r a t i o n 2012 2013 2014 Act Act Act Target Target Target 12 Mo. 12 Mo. 12 Mo. Year 1 Year 1 Year 1 Dist/ In - House Freight & Prod SG&A Savings 1 Savings 2 Growth Syn Mod Syn Mod Mgmt 12 Mo. 12 Mo. 12 Mo. Year 1 Fcst Mgmt 12 Mo. Year 2 Year 2 Year 2 Dist/ In - House Freight & Prod SG&A Savings 1 Savings 2 Growth Syn Mod Syn Mod Mgmt 12 Mo . 12 Mo . 12 Mo . Year 2 Fcst G T / Mg m t 12 Mo. Contract Sales $ 70,219 $ 43 , 15 2 $ 35 , 92 4 $ 3,592 $39 , 51 6 $ 3 , 95 2 $ 43,468 Net Sales 59,815 38 , 80 1 30 , 98 6 - - 3 , 09 9 34 , 08 4 - - 3 , 40 8 37 , 49 3 Cost of Sales 39,646 20 , 88 9 17 , 81 7 ( 1 , 379 ) ( 2 , 039 ) 1 , 78 2 16 , 18 0 ( 1 , 131 ) - 1 , 61 8 16 , 66 7 Gross Profit 20,169 17 , 91 2 13 , 16 9 1,379 2,039 1 , 31 7 17 , 90 4 1,131 - 1 , 79 0 20 , 82 5 SG&A Expenses 24,980 16 , 77 1 9 , 88 1 - ( 842 ) 296 9 , 33 6 - ( 1 , 019 ) 280 9 , 14 2 Operating Income/(Loss) ( 4 , 811 ) 1 , 14 0 3 , 28 8 1,379 2,881 1 , 02 0 8 , 56 8 1,131 1,019 1 , 51 0 11 , 68 3 Total Other Expense - ( 38 ) ( 1 , 242 ) - - - - - - - - Income/(Loss) before Inc Tax ( 4 , 811 ) 1 , 10 2 2 , 04 6 1,379 2,881 1 , 02 0 8 , 56 8 1,131 1,019 1 , 51 0 11 , 68 3 Provision for Income Taxes - - - - - - - - - - - Net Income/(Loss) ( 4 , 811 ) 1 , 10 2 2 , 04 6 1,379 2,881 1 , 02 0 8 , 56 8 1,131 1,019 1 , 51 0 11 , 68 3 EBITDA ( 3 , 937 ) 1 , 14 0 3 , 28 8 8 , 56 8 11 , 68 3 Results and Potential Synergies Analysis…Organic Holdings… TCC worked with outside consultants in 2014 to develop a projected synergy analysis for the integration of the acquisition of Organic Holdings, including significant integration of manufacturing into TCC over time. ($ in 000's) 23 23

1 History 2 Business Plan 3 Potential Results and Synergies 5 Ongoing Development and Strategy for Acquisitions 4 Illustrative Consolidated Companies Five Year 24 24
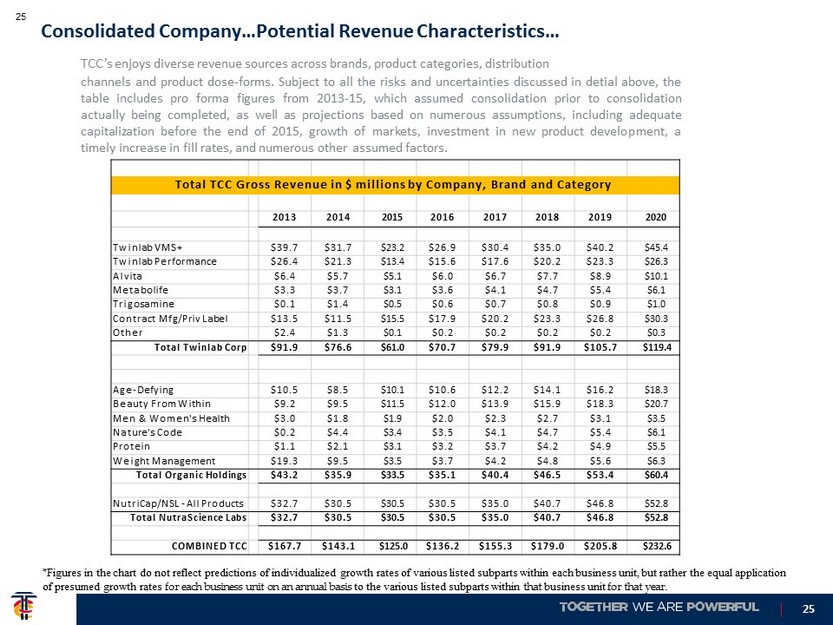
Consolidated Company…Potential Revenue Characteristics… TCC’s enjoys diverse revenue sources across brands, product categories, distribution channels and product dose - forms . Subject to all the risks and uncertainties discussed in detial above, the table includes pro forma figures from 2013 - 15 , which assumed consolidation prior to consolidation actually being completed, as well as projections based on numerous assumptions, including adequate capitalization before the end of 2015 , growth of markets, investment in new product development, a timely increase in fill rates, and numerous other assumed factors . Total TCC Gross Revenue in $ millions by Company, Brand and Category 2013 2014 2015 2016 2017 2018 2019 2020 Twinlab VMS+ $39.7 $31.7 $23 . 2 $26.9 $30.4 $35.0 $40.2 $45 . 4 Twinlab Performance $26.4 $21.3 $13 . 4 $15.6 $17.6 $20.2 $23.3 $26 . 3 Alvita $6.4 $5.7 $5 . 1 $6.0 $6.7 $7.7 $8.9 $10 . 1 Metabolife $3.3 $3.7 $3 . 1 $3.6 $4.1 $4.7 $5.4 $6 . 1 Trigosamine $0.1 $1.4 $0 . 5 $0.6 $0.7 $0.8 $0.9 $1 . 0 Contract Mfg/Priv Label $13.5 $11.5 $15 . 5 $17.9 $20.2 $23.3 $26.8 $30 . 3 Other $2.4 $1.3 $0 . 1 $0.2 $0.2 $0.2 $0.2 $0 . 3 Total Twinlab Corp $91.9 $76.6 $61 .0 $70.7 $79.9 $91.9 $105.7 $119 .4 Age - Defying $10.5 $8.5 $10 . 1 $10.6 $12.2 $14.1 $16.2 $18 . 3 Beauty From Within $9.2 $9.5 $11 . 5 $12.0 $13.9 $15.9 $18.3 $20 . 7 Men & Women's Health $3.0 $1.8 $1 . 9 $2.0 $2.3 $2.7 $3.1 $3 . 5 Nature's Code $0.2 $4.4 $3 . 4 $3.5 $4.1 $4.7 $5.4 $6 . 1 Protein $1.1 $2.1 $3 . 1 $3.2 $3.7 $4.2 $4.9 $5 . 5 Weight Management $19.3 $9.5 $3 . 5 $3.7 $4.2 $4.8 $5.6 $6 . 3 Total Organic Holdings $43.2 $35.9 $33 .5 $35.1 $40.4 $46.5 $53.4 $60 .4 NutriCap/NSL - All Products $32.7 $30.5 $30 . 5 $30.5 $35.0 $40.7 $46.8 $52 . 8 Total NutraScience Labs $32.7 $30.5 $30 .5 $30.5 $35.0 $40.7 $46.8 $52 .8 COMBINED TCC $167.7 $143.1 $125 .0 $136.2 $155.3 $179.0 $205.8 $232 .6 25 25 * Figures in the chart do not reflect predictions of individualized growth rates of various listed subparts within each business unit, but rather the equal application of presumed growth rates for each business unit on an annual basis to the various listed subparts within that business unit for that year .

Consolidated Company…Pro Forma and Projected P&L … TWINLAB CONSOLIDATED HOLDINGS, INC (TCH) Summary Annual Actuals and Five Year Forecast 2013 2014 2015 2016 2017 2018 2019 2020 Actual Actual Act/Fcst Fcst Fcst Fcst Fcst Fcst Gross Sales $167 . 7 $143 . 2 $125 . 0 $136 . 2 $155 . 3 $179 . 0 $205 . 8 $232 . 6 Discounts, Deductions and Returns $23 . 0 $20 . 2 $15 . 1 $18 . 2 $20 . 7 $23 . 8 $27 . 5 $31 . 0 Net Sales $144 . 7 $122 . 9 $109 . 9 $118 . 1 $134 . 7 $155 . 2 $178 . 4 $201 . 6 Cost of sales $98 . 8 $88 . 3 $84 . 3 $76 . 9 $84 . 3 $92 . 5 $106 . 3 $120 . 1 Gross Margin $45 . 9 $34 . 6 $25 . 5 $41 . 2 $50 . 4 $62 . 6 $72 . 0 $81 . 4 % 32% 28% 23% 35% 37% 40% 40% 40% Total Operating Expenses $43 . 3 $42 . 9 $38 . 2 $33 . 2 $32 . 1 $33 . 6 $34 . 7 $36 . 6 Operating Income $2 . 6 ( $8 . 3 ) ( $12 . 7 ) $7 . 9 $18 . 2 $29 . 1 $37 . 3 $44 . 8 Other Income/(Expense) ( $3 . 4 ) ( $11 . 4 ) ( $22 . 2 ) ( $5 . 4 ) ( $5 . 4 ) ( $5 . 4 ) ( $5 . 4 ) ( $5 . 4 ) Pretax Income/(Loss) ( $0 . 9 ) ( $19 . 6 ) ( $34 . 9 ) $2 . 5 $12 . 8 $23 . 6 $31 . 9 $39 . 4 Tax Provision $0 . 0 $0 . 1 $0 . 0 $1 . 1 $4 . 3 $7 . 9 $10 . 7 $13 . 2 Net Income ( $0 . 9 ) ( $19 . 7 ) ( $34 . 9 ) $1 . 4 $8 . 5 $15 . 7 $21 . 2 $26 . 2 Interest $6 . 4 $8 . 8 $7 . 8 $5 . 4 $5 . 4 $5 . 4 $5 . 4 $5 . 4 Taxes $0 . 1 $0 . 1 $0 . 0 $1 . 1 $4 . 3 $7 . 9 $10 . 7 $13 . 2 Depreciation & Amort $1 . 7 $1 . 4 $1 . 7 $1 . 4 $1 . 4 $1 . 4 $1 . 4 $1 . 4 Other One - time Non - Cash Exp $0 . 0 $2 . 7 $17 . 7 $0 . 0 $0 . 0 $0 . 0 $0 . 0 $0 . 0 E B ITDA $7 . 2 ( $6 . 6 ) ( $7 . 7 ) $9 . 4 $19 . 7 $30 . 5 $38 . 7 $46 . 2 26 Subject to all the risks and uncertainties discussed above, the table includes pro forma figures from 2013 - 15, which assumed consolidation prior to consolidation being complete, as well as projections based on numerous assumptions, including adequate capitalization before the end of 2015, growth of markets, investment in new product development, a timely increase in fill rates, and numerous other assumed factors. 26 * In addition to the assumptions identified above, we note that for the purpose for which this particular analysis was created the interest numbers in the forecasted columns were placeholders and not intended to depict anticipated projected numbers.

Consolidated Company…Potential Balance Sheet… 27 Subject to all the risks and uncertainties discussed above, the table includes projections based on numerous assumptions, including adequate capitalization before the end of 2015, timely execution of internal initiatives, and numerous other assumed factors. TWINLAB CONSOLIDATED HOLDINGS, INC (TCH) Balance sheet 2013 2014 2015 2016 2017 2018 2019 2020 A c t u al Actual Act/Fcst Fcst Fcst Fcst Fcst Fcst Assets Cash $2.4 $2.2 $15.0 $0.7 $2.7 $14.1 $29.7 $52.1 Restricted Cash and Investments $0.4 $0.5 $0.1 $0.1 $0.1 $0.1 $0.1 $0.1 Accounts receivable $13.5 $9.8 $7.5 $13 . 3 $13.9 $15.5 $17.3 $19.6 Inventory $19.5 $22.3 $10.7 $12 . 9 $13.1 $13.9 $17.6 $19.3 Intangible Assets $8.0 $7.6 $58.2 $58 . 2 $58.2 $58.2 $58.2 $58.2 Other assets $9.0 $9.8 $6.7 $6.7 $6.7 $6.7 $6.7 $6.7 Total assets $52.8 $52.2 $98.2 $91 .8 $94.7 $108 .6 $129.6 $156.0 LIABILITIES & EQUITY Liabilities Accounts payable & other liab $28.3 $27.8 $38.7 $37 . 6 $36.8 $36.9 $38.1 $40.0 Credit line and loans payable $105 . 2 $33.7 $43.6 $36 . 9 $31.6 $30.1 $28.7 $27.1 Total liabilities $133 .5 $61.5 $82.3 $74 .5 $68.4 $67.0 $66.8 $67.1 Equity Preferred Stock $0.0 $0.0 $0.0 $0.0 $0.0 $0.0 $0.0 $0.0 Common Stock $0.2 $0.2 $0.2 $0.2 $0.2 $0.2 $0.2 $0.2 APIC $90.2 $182.7 $240.0 $240 . 0 $240.0 $240 . 0 $240.0 $247.6 Subscription Receivable $0.0 ($0.1) ($0.1) ( $0 . 1 ) ($0.1) ($0.1) ($0.1) ($0.1) Retained Earnings ( $171 . 0 ) ($192.0) ($224.2) ( $222 . 8 ) ($214.3) ( $198 . 6 ) ($177.4) ($151.2) Other comprehensive income ($0.1) ($0.1) ($0.0) ( $0 . 0 ) ($0.0) ($0.0) ($0.0) ($0.0) Total Shareholders' Equity ( $80 . 7 ) ($9.3) $15.9 $17 .3 $25.8 $41.5 $62.7 $88.9 Total Liabilities & Equity $52.8 $52.2 $98.2 $91 .8 $94.2 $108 .5 $129.5 $156.0 27 * I n addition to the assumptions identified above, we note that for the purpose for which this particular analysis was created the credit line and loans payable numbers in the forecasted columns in this table were placeholders and not intended to depict anitcipated projected numbers.

1 History 2 Business Plan 3 Potential Results and Synergies 4 28 Illustrative Consolidated Companies Five Year 28 5 Ongoing Development and Strategy for Acquisitions

TCC Management has an extensive portfolio of acquisition targets that meet its primary criteria for accretive consolidation . Over the coming five years, management will continue building internally and growing through acquisition – with the goal of building a business with $ 1 billion in revenue and over $ 200 million in EBITDA . Ongoing Development and Strategy of Acquisitions… Internal Growth & Ac qu isition Pool 61 mm $30 mm $ 33 mm +$ 876 mm $61 mm $91 mm $124 mm $ 1 B $ 1 billion Revenue = 29 29