Attached files
| file | filename |
|---|---|
| 8-K - 8-K - SOUTHWEST BANCORP INC | oksb-20160119x8k.htm |
| EX-99.1 - EX-99.1 - SOUTHWEST BANCORP INC | oksb-20160119ex99114eac6.htm |
 2015 Fourth Quarter Earnings Presentation NASDAQ: OKSB January 20, 2016
 Forward Looking Statements We make forward-looking statements in this presentation that are subject to risks and uncertainties. We intend these statements to be covered by the safe harbor provision for forward-looking statements contained in the Private Securities Litigation Reform Act of 1995. These forward-looking statements include: • Statements of Southwest's goals, intentions, and expectations; • Estimates of risks and of future costs and benefits; • Expectations regarding our future financial performance and the financial performance of our operating segments; • Expectations regarding regulatory actions; • Expectations regarding our ability to utilize tax loss benefits; • Expectations regarding our stock repurchase program; • Expectations regarding dividends; • Expectations regarding acquisitions and divestitures; • Assessments of loan quality, probable loan losses, and the amount and timing of loan payoffs; • Estimates of the value of assets held for sale or available for sale; and • Statements of our ability to achieve financial and other goals. These forward-looking statements are subject to significant uncertainties because they are based upon: the amount and timing of future changes in interest rates, market behavior, and other economic conditions; future laws, regulations, and accounting principles; changes in regulatory standards and examination policies, and a variety of other matters. These other matters include, among other things, the direct and indirect effects of economic conditions on interest rates, credit quality, loan demand, liquidity, and monetary and supervisory policies of banking regulators. Because of these uncertainties, the actual future results may be materially different from the results indicated by these forward-looking statements. In addition, Southwest's past growth and performance do not necessarily indicate our future results. For other factors, risks, and uncertainties that could cause actual results to differ materially from estimates and projections contained in forward-looking statements, please read the “Risk Factors” contained in Southwest’s reports to the Securities and Exchange Commission. We do not intend, or undertake no obligation, to update or revise any forward-looking statements contained in this presentation, whether as a result of differences in actual results, changes in assumptions, or changes in other factors affecting said statements, except as required by law.
 2015 Highlights Achieved net income of $17.4 million or $0.90 per fully diluted share in 2015. Successfully closed the acquisition and completed the integration of First Commercial Bank. Identified and acquired talented individuals and teams. This included: new market leadership in Colorado, Austin and Tulsa and new leadership in Consumer Banking, Operations and Technology. Restructured Commercial Banking operations to improve focus on market growth, customer responsiveness and efficiency. Maintained solid credit quality performance with four consecutive months of net recoveries totaling $1.2 million for 2015. Maintained high credit standards while accelerating loan growth focused in areas of expertise, i.e. healthcare, real estate and commercial. Now have recorded eight consecutive quarters of loan growth. Core loan growth of 13% for 2015. Continued improving internal operating efficiency while providing superior customer service. This includes a new investment in a core operating system. Efficiency ratio for 2015 was 68.3% excluding acquisition deal costs compared to 72.0% for 2014 excluding the gain on branch sales. Increased our investment in mortgage underwriting and booking system while adding leadership and delivery channels in Texas and Colorado. We continue to drive a culture that produces consistent, conservative and sustainable revenue and earnings growth.
 Fourth Quarter 2015 Highlights Net income of $4.6 million, or $0.23 per diluted share. – Pre-tax, pre-provision income of $6.6 million. Loan portfolio continues to exhibit growth and stability. – Loans increased $231.3 million during the quarter, including $194.0 million of acquired loans, and $379.4 million for the year, or 27%. – Core loan growth for the quarter (excluding acquired loans) was $37.3 million, or 9.6% annualized. – Eight consecutive quarters of loan growth. – Booked $125.9 million in new loan commitments in the quarter. – Net interest margin was 3.48% for the quarter up from 3.34% in the third quarter. Legacy credit portfolio continued to improve while absorbing acquired loans. – Potential Problem Loans increased by $9.3 million to $39.2 million (inclusive of $11.4 million in acquired loans). – Total criticized assets increased by $20.2 million to $71.0 million (inclusive of $20.7 million in acquired loans). – NPLs increased by $5.2 million to $20.3 million (inclusive of $4.1 million in acquired loans). – Loss reserve is at 1.47% of total loans. Loss reserve and purchase discount on acquired loans represents 1.96% of gross loans. – Net recoveries were $0.1 million, fourth consecutive quarter of net recoveries. – Loan loss provision for the quarter was a release of $0.6 million.
 Fourth Quarter 2015 Highlights (cont.) Positive non-interest income, including mortgage loan sales, deposit fees and swap fees. Capital ratios remain strong and above minimum well-capitalized standards. Efficiency ratio for fourth quarter was 66.9% (excluding deal costs of $1.4 million) compared to 67.3% (excluding deal costs of $339,000) for the third quarter of 2015 and 68.9% for the fourth quarter of 2014. Our board declared an increase in the quarterly dividend to $0.08 per share to shareholders of record as of January 29, 2016 and payable on February 12, 2016.
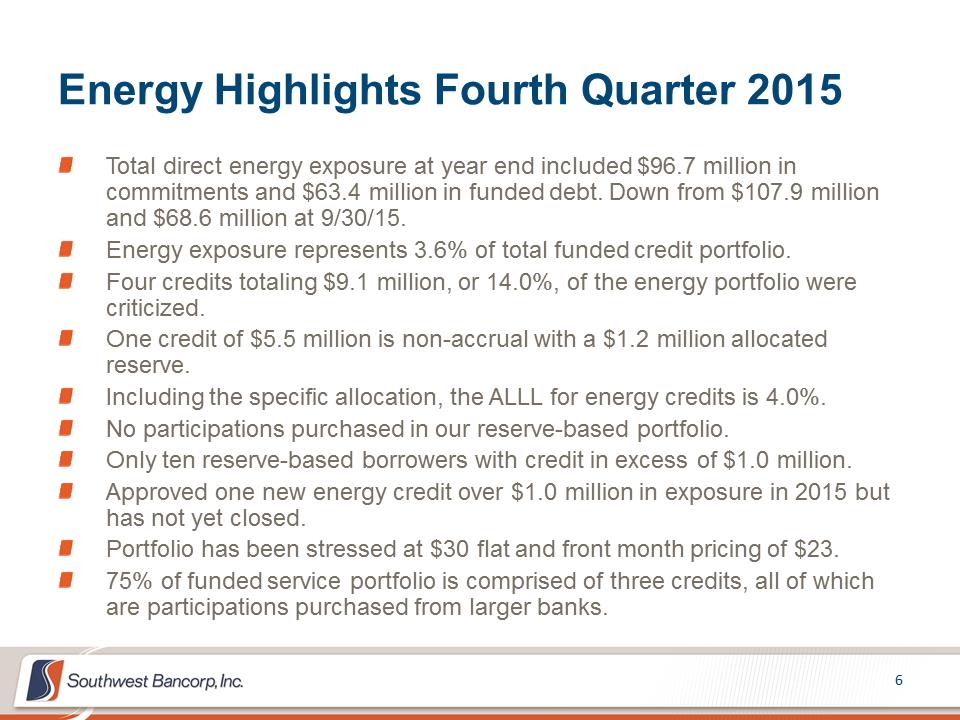 Energy Highlights Fourth Quarter 2015 Total direct energy exposure at year end included $96.7 million in commitments and $63.4 million in funded debt. Down from $107.9 million and $68.6 million at 9/30/15. Energy exposure represents 3.6% of total funded credit portfolio. Four credits totaling $9.1 million, or 14.0%, of the energy portfolio were criticized. One credit of $5.5 million is non-accrual with a $1.2 million allocated reserve. Including the specific allocation, the ALLL for energy credits is 4.0%. No participations purchased in our reserve-based portfolio. Only ten reserve-based borrowers with credit in excess of $1.0 million. Approved one new energy credit over $1.0 million in exposure in 2015 but has not yet closed. Portfolio has been stressed at $30 flat and front month pricing of $23. 75% of funded service portfolio is comprised of three credits, all of which are participations purchased from larger banks.
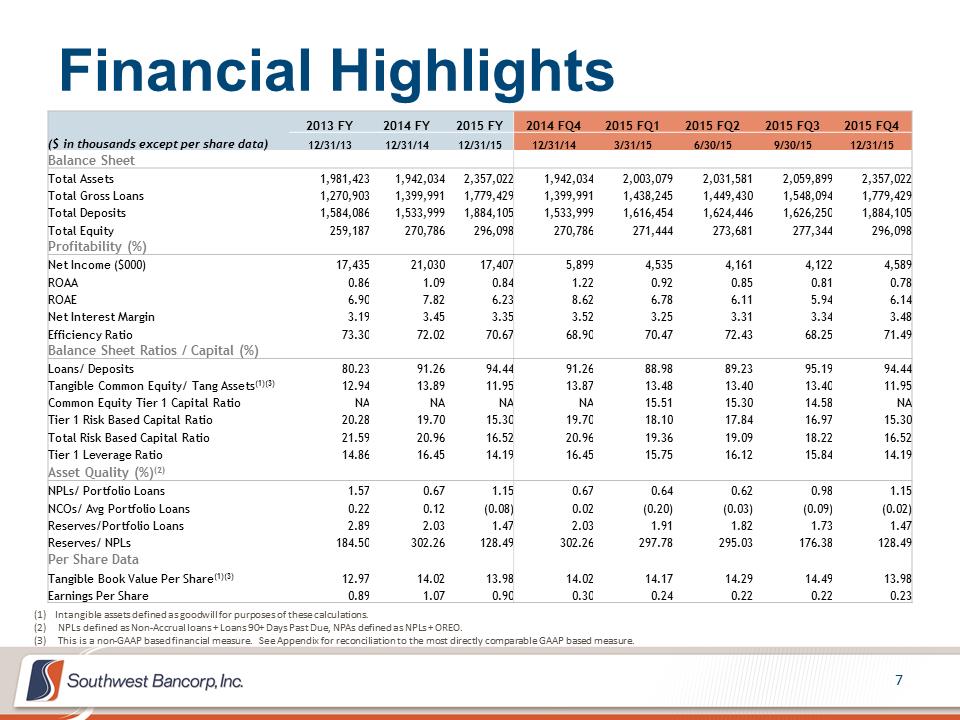 Financial Highlights ($ in thousands except per share data) Balance Sheet 2013 FY 12/31/13 2014 FY 12/31/14 2015 FY 12/31/15 2014 FQ4 12/31/14 2015 FQ1 3/31/15 2015 FQ2 6/30/15 2015 FQ3 9/30/15 2015 FQ4 12/31/15 Total Assets Total Gross Loans Total Deposits Total Equity Profitability (%) 1,981,423 1,270,903 1,584,086 259,187 1,942,034 1,399,991 1,533,999 270,786 2,357,022 1,779,429 1,884,105 296,098 1,942,034 1,399,991 1,533,999 270,786 2,003,079 1,438,245 1,616,454 271,444 2,031,581 1,449,430 1,624,446 273,681 2,059,899 1,548,094 1,626,250 277,344 2,357,022 1,779,429 1,884,105 296,098 Net Income ($000) ROAA ROAE Net Interest Margin Efficiency Ratio Balance Sheet Ratios / Capital (%) 17,435 0.86 6.90 3.19 73.30 21,030 1.09 7.82 3.45 72.02 17,407 0.84 6.23 3.35 70.67 5,899 1.22 8.62 3.52 68.90 4,535 0.92 6.78 3.25 70.47 4,161 0.85 6.11 3.31 72.43 4,122 0.81 5.94 3.34 68.25 4,589 0.78 6.14 3.48 71.49 Loans/ Deposits Tangible Common Equity/ Tang Assets(1)(3) Common Equity Tier 1 Capital Ratio Tier 1 Risk Based Capital Ratio Total Risk Based Capital Ratio Tier 1 Leverage Ratio Asset Quality (%)(2) 80.23 12.94 NA 20.28 21.59 14.86 91.26 13.89 NA 19.70 20.96 16.45 94.44 11.95 NA 15.30 16.52 14.19 91.26 13.87 NA 19.70 20.96 16.45 88.98 13.48 15.51 18.10 19.36 15.75 89.23 13.40 15.30 17.84 19.09 16.12 95.19 13.40 14.58 16.97 18.22 15.84 94.44 11.95 NA 15.30 16.52 14.19 NPLs/ Portfolio Loans NCOs/ Avg Portfolio Loans Reserves/Portfolio Loans Reserves/ NPLs Per Share Data Tangible Book Value Per Share(1)(3) Earnings Per Share 1.57 0.22 2.89 184.50 12.97 0.89 0.67 0.12 2.03 302.26 14.02 1.07 1.15 (0.08) 1.47 128.49 13.98 0.90 0.67 0.02 2.03 302.26 14.02 0.30 0.64 (0.20) 1.91 297.78 14.17 0.24 0.62 (0.03) 1.82 295.03 14.29 0.22 0.98 (0.09) 1.73 176.38 14.49 0.22 1.15 (0.02) 1.47 128.49 13.98 0.23 (1) Intangible assets defined as goodwill for purposes of these calculations. (2) NPLs defined as Non-Accrual loans + Loans 90+ Days Past Due, NPAs defined as NPLs + OREO. (3) This is a non-GAAP based financial measure. See Appendix for reconciliation to the most directly comparable GAAP based measure.
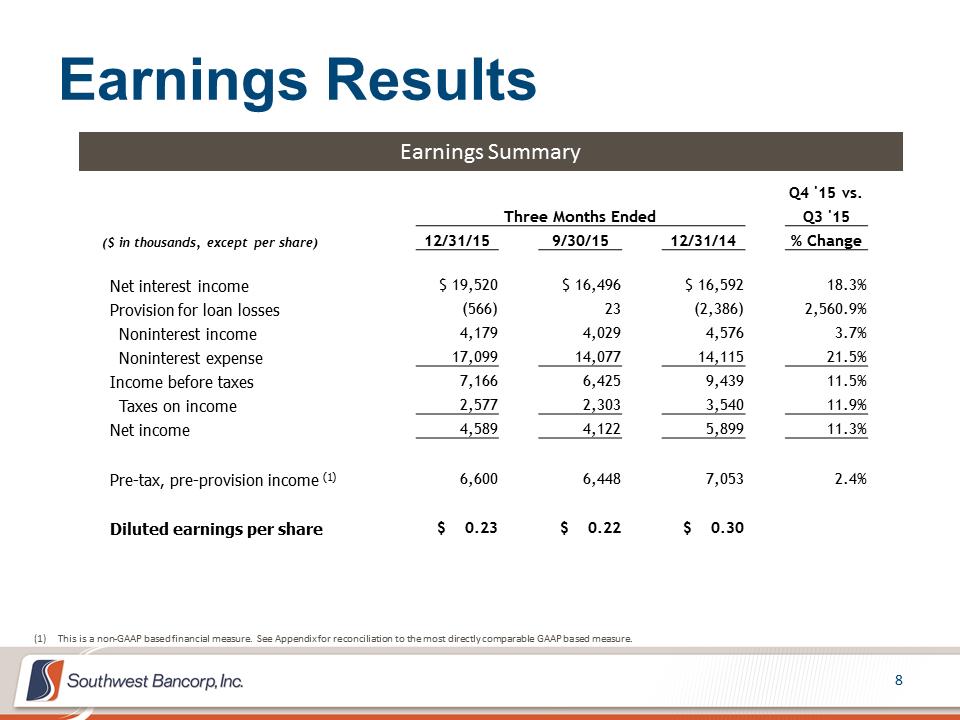 Earnings Results Earnings Summary ($ in thousands, except per share) 12/31/15 Three Months Ended 9/30/15 12/31/14 Q4 '15 vs. Q3 '15 % Change Net interest income Provision for loan losses Noninterest income Noninterest expense Income before taxes Taxes on income Net income $ 19,520 (566) 4,179 17,099 7,166 2,577 4,589 $ 16,496 23 4,029 14,077 6,425 2,303 4,122 $ 16,592 (2,386) 4,576 14,115 9,439 3,540 5,899 18.3% 2,560.9% 3.7% 21.5% 11.5% 11.9% 11.3% Pre-tax, pre-provision income (1) 6,600 6,448 7,053 2.4% Diluted earnings per share $ 0.23 $ 0.22 $ 0.30 (1) This is a non-GAAP based financial measure. See Appendix for reconciliation to the most directly comparable GAAP based measure.
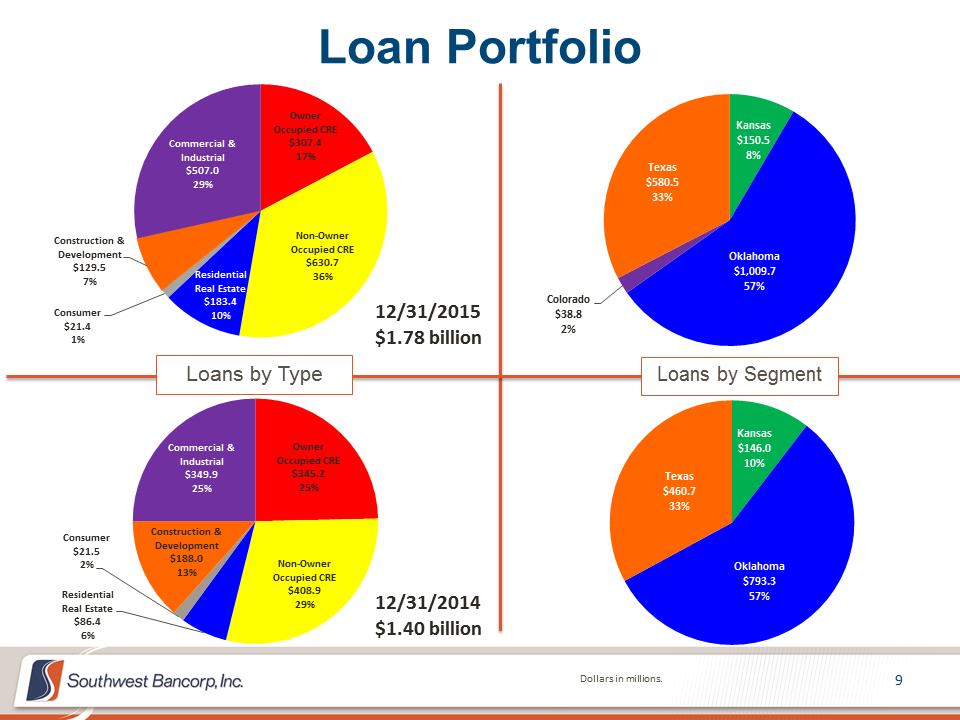 Owner Occupied CRE $307.4 17% Non-Owner Occupied CRE $630.7 36%Residential Real Estate $183.4 10%Consumer $21.4 1% Construction & Development $129.5 7% Commercial & Industrial $507.0 29% Loan Portfolio 9Dollars in millions. Loans by Type Loans by Segment Owner Occupied CRE $345.2 25% Non-Owner Occupied CRE $408.9 29% Residential Real Estate $86.4 6% Consumer $21.5 2% Construction & Development $188.0 13% Commercial & Industrial $349.9 25% 12/31/2015 $1.78 billion 12/31/2014 $1.40 billion Kansas $150.5 8% Oklahoma $1,009.7 57% Colorado $38.8 2% Texas $580.5 33% Kansas $146.0 10% Oklahoma $793.3 57% Texas $460.7 33% Owner Occupied CRE $307.4 17% Non-Owner Occupied CRE $630.7 36%Residential Real Estate $183.4 10%Consumer $21.4 1% Construction & Development $129.5 7% Commercial & Industrial $507.0 29% Loan Portfolio 9Dollars in millions. Loans by Type Loans by Segment Owner Occupied CRE $345.2 25% Non-Owner Occupied CRE $408.9 29% Residential Real Estate $86.4 6% Consumer $21.5 2% Construction & Development $188.0 13% Commercial & Industrial $349.9 25% 12/31/2015 $1.78 billion 12/31/2014 $1.40 billion Kansas $150.5 8% Oklahoma $1,009.7 57% Colorado $38.8 2% Texas $580.5 33% Kansas $146.0 10% Oklahoma $793.3 57% Texas $460.7 33%
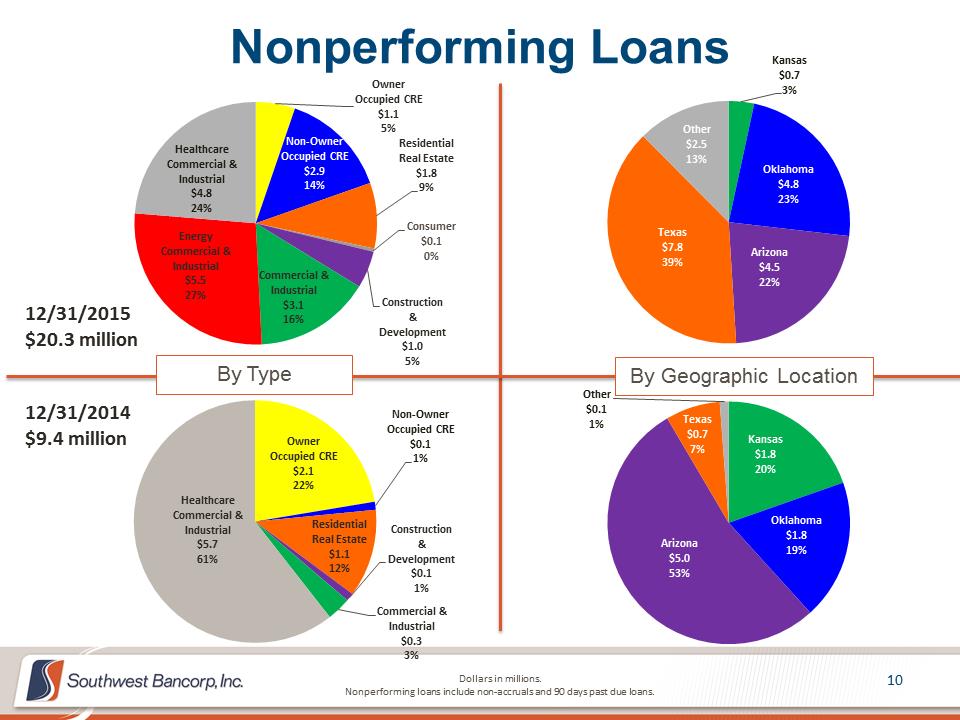 Owner Occupied CRE $1.1 5% Non Owner Occupied CRE $2.9 14% Residential Real Estate $1.8 9% Consumer $0.1 0% Construction & Development $1.0 5% Commercial & Industrial $3.1 16% Energy Commercial & Industrial $5.5 27% Healthcare Commercial & Industrial $4.8 24% Nonperforming Loans 10Dollars in millions. Nonperforming loans include non-accruals and 90 days past due loans. By Type By Geographic Location Owner Occupied CRE $2.1 22% Non-Owner Occupied CRE $0.1 1% Residential Real Estate $1.1 12% Construction & Development $0.1 1% Commercial & Industrial $0.3 3% Healthcare Commercial & Industrial $5.7 61% 12/31/2015 $20.3 million 12/31/2014 $9.4 million Kansas $0.7 3% Oklahoma $4.8 23% Arizona $4.5 22% Texas $7.8 39% Other $2.5 13% Kansas $1.8 20% Oklahoma $1.8 19%Arizona $5.0 53% Texas $0.7 7% Other $0.1 1% Owner Occupied CRE $1.1 5% Non Owner Occupied CRE $2.9 14% Residential Real Estate $1.8 9% Consumer $0.1 0% Construction & Development $1.0 5% Commercial & Industrial $3.1 16% Energy Commercial & Industrial $5.5 27% Healthcare Commercial & Industrial $4.8 24% Nonperforming Loans 10Dollars in millions. Nonperforming loans include non-accruals and 90 days past due loans. By Type By Geographic Location Owner Occupied CRE $2.1 22% Non-Owner Occupied CRE $0.1 1% Residential Real Estate $1.1 12% Construction & Development $0.1 1% Commercial & Industrial $0.3 3% Healthcare Commercial & Industrial $5.7 61% 12/31/2015 $20.3 million 12/31/2014 $9.4 million Kansas $0.7 3% Oklahoma $4.8 23% Arizona $4.5 22% Texas $7.8 39% Other $2.5 13% Kansas $1.8 20% Oklahoma $1.8 19%Arizona $5.0 53% Texas $0.7 7% Other $0.1 1%
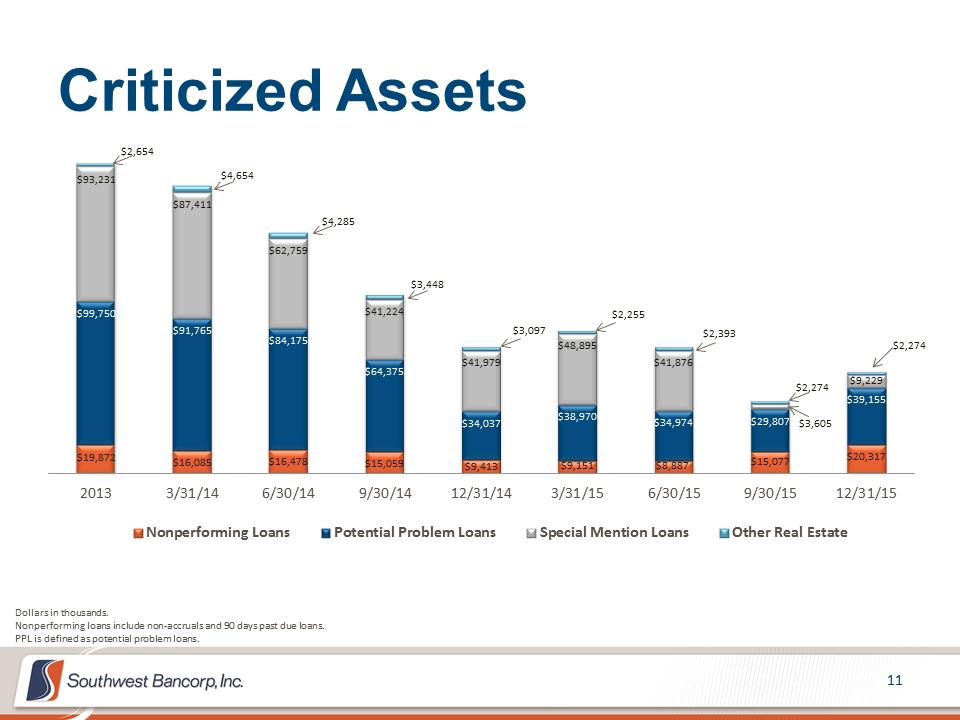 Criticized Assets 11 $19,872 $16,085 $16,478 $15,059 $9,413 $9,151 $8,887 $15,077 $20,317 $99,750 $91,765 $84,175 $64,375 $34,037 $38,970 $34,974 $29,807 $39,155 $93,231 $87,411 $62,759 $41,224 $41,979 $48,895 $41,876 $3,605 $9,229 $2,654 $4,654 $4,285 $3,448 $3,097 $2,255 $2,393 $2,274 $2,274 2013 3/31/14 6/30/14 9/30/14 12/31/14 3/31/15 6/30/15 9/30/15 12/31/15 Nonperforming Loans Potential Problem Loans Special Mention Loans Other Real Estate Dollars in thousands. Nonperforming loans include non-accruals and 90 days past due loans. PPL is defined as potential problem loans. Criticized Assets 11 $19,872 $16,085 $16,478 $15,059 $9,413 $9,151 $8,887 $15,077 $20,317 $99,750 $91,765 $84,175 $64,375 $34,037 $38,970 $34,974 $29,807 $39,155 $93,231 $87,411 $62,759 $41,224 $41,979 $48,895 $41,876 $3,605 $9,229 $2,654 $4,654 $4,285 $3,448 $3,097 $2,255 $2,393 $2,274 $2,274 2013 3/31/14 6/30/14 9/30/14 12/31/14 3/31/15 6/30/15 9/30/15 12/31/15 Nonperforming Loans Potential Problem Loans Special Mention Loans Other Real Estate Dollars in thousands. Nonperforming loans include non-accruals and 90 days past due loans. PPL is defined as potential problem loans.
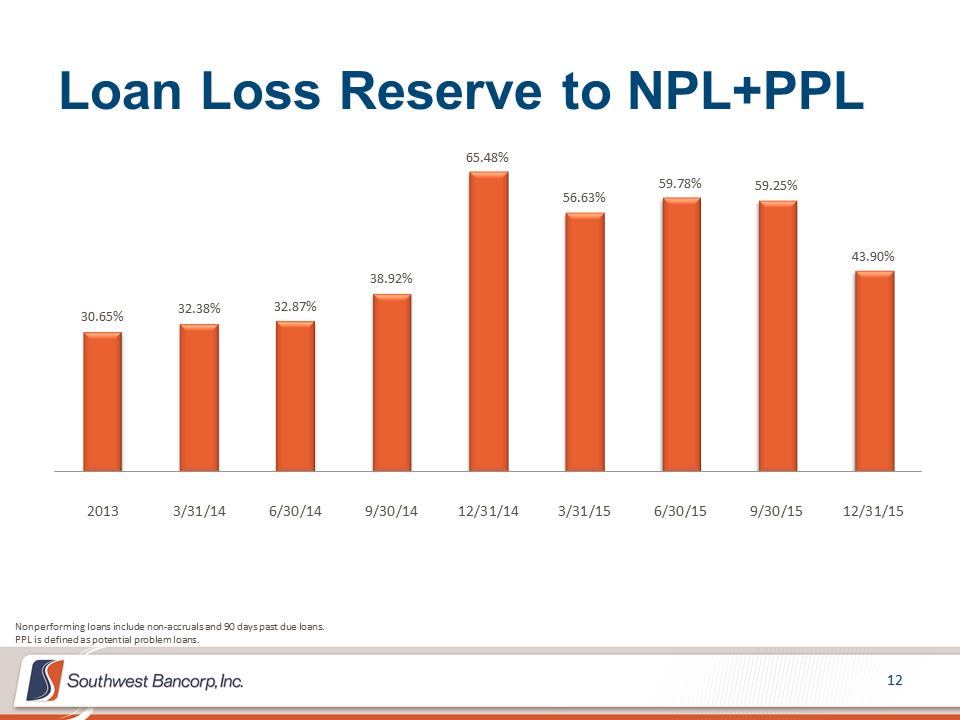 Loan Loss Reserve to NPL+PPL 12 30.65% 32.38% 32.87% 38.92% 65.48% 56.63% 59.78% 59.25% 43.90% 2013 3/31/14 6/30/14 9/30/14 12/31/14 3/31/15 6/30/15 9/30/15 12/31/15 Nonperforming loans include non-accruals and 90 days past due loans. PPL is defined as potential problem loans. Loan Loss Reserve to NPL+PPL 12 30.65% 32.38% 32.87% 38.92% 65.48% 56.63% 59.78% 59.25% 43.90% 2013 3/31/14 6/30/14 9/30/14 12/31/14 3/31/15 6/30/15 9/30/15 12/31/15 Nonperforming loans include non-accruals and 90 days past due loans. PPL is defined as potential problem loans.
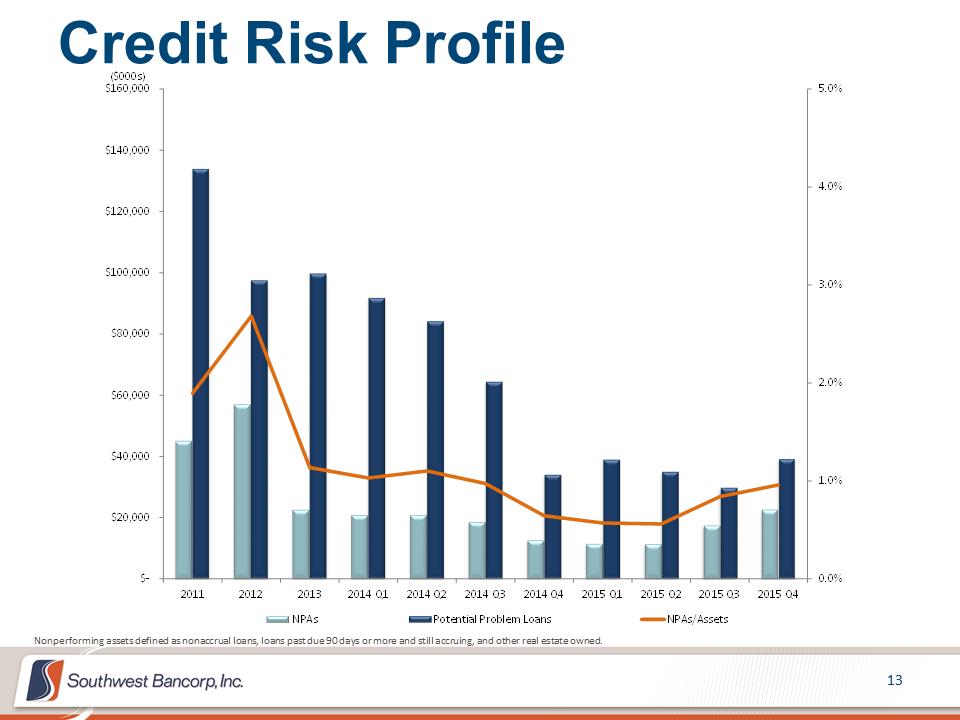 Credit Risk Profile Nonperforming assets defined as nonaccrual loans, loans past due 90 days or more and still accruing, and other real estate owned.
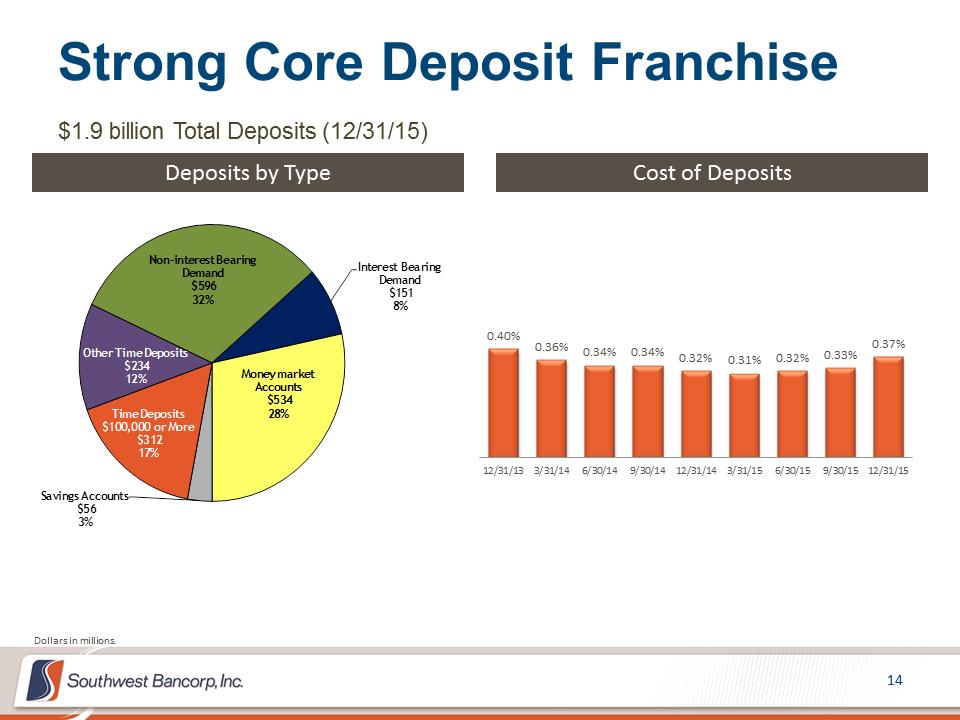 Strong Core Deposit Franchise $1.9 billion Total Deposits (12/31/15) Deposits by Type Cost of Deposits 0.40% 0.36% 0.34% 0.34% 0.32% 0.31% 0.32% 0.33% 12/31/13 3/31/14 6/30/14 9/30/14 12/31/14 3/31/15 6/30/15 9/30/15 Non-interest Bearing Demand$596 32%Interest Bearing Demand$151 8%Money market Accounts$534 28%Savings Accounts$56 3%Time Deposits $100,000 or More$312 17%Other Time Deposits$234 12%0.37% Dollars in millions.
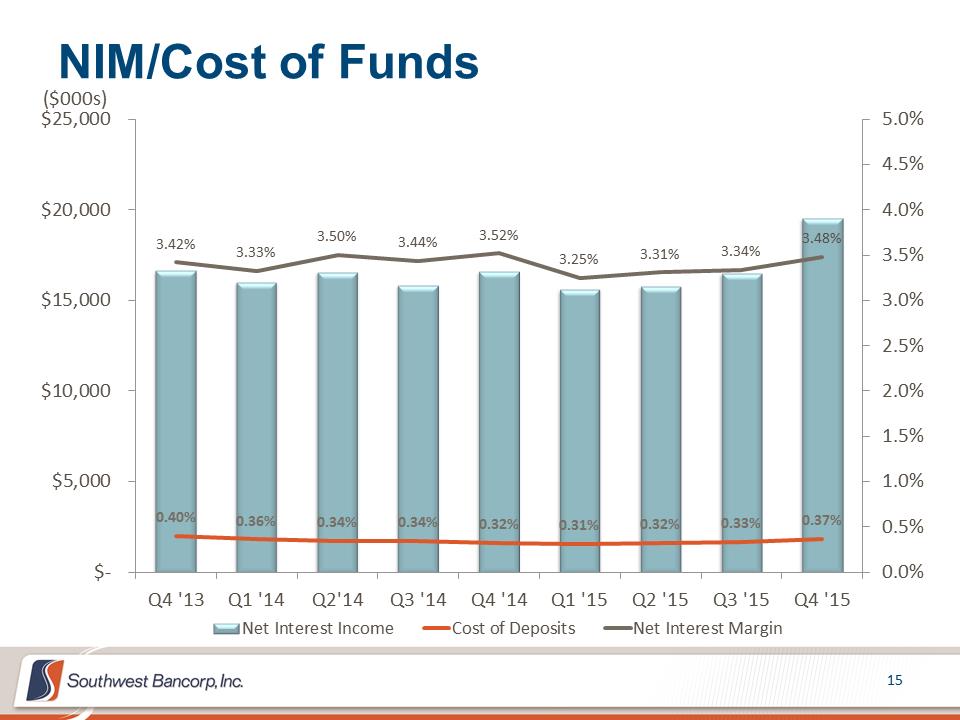 NIM/Cost of Funds ($000s) $25,000 $20,000 $15,000 $10,000 $5,000 $0.40% 0.36% 0.34% 0.34% 0.32% 0.31% 0.32% 0.33% 0.37% 3.42% 3.33% 3.50% 3.44% 3.52% 3.25% 3.31% 3.34% 3.48% 5.0%4.5% 4.0% 3.5% 3.0% 2.5% 2.0% 1.5% 1.0% 0.5% 0.0% Q4 '13 Q1 '14 Q2'14 Q3 '14 Q4 '14 Q1 '15 Q2 '15 Q3 '15 Q4 '15 Net Interest Income Cost of Deposits Net Interest Margin
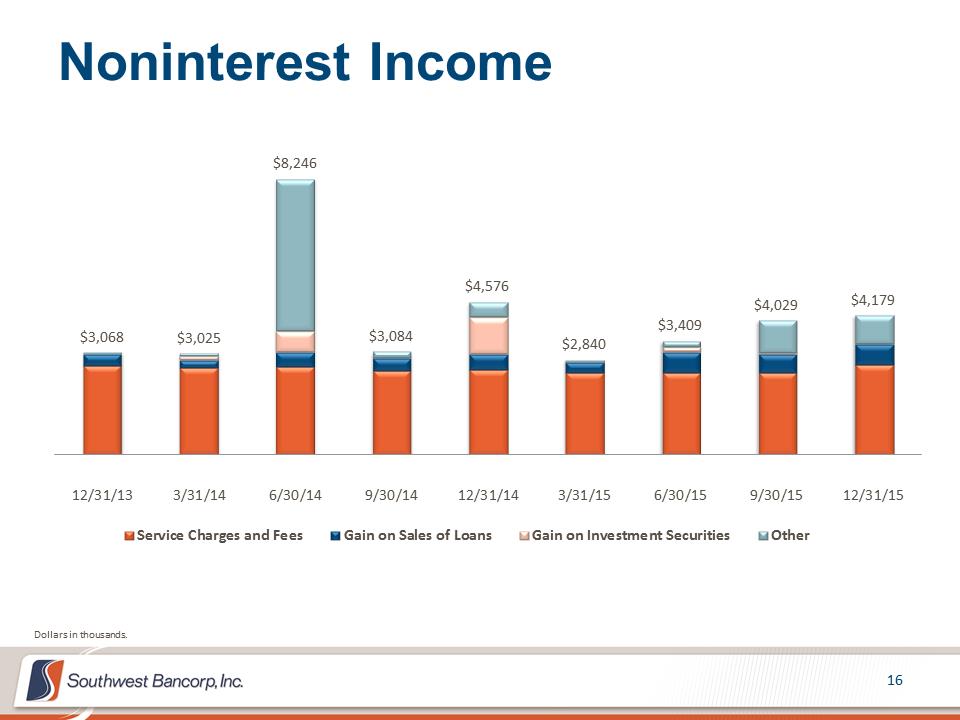 Noninterest Income 16 $3,068 $3,025 $8,246 $3,084 $4,576 $2,840 $3,409 $4,029 $4,179 12/31/13 3/31/14 6/30/14 9/30/14 12/31/14 3/31/15 6/30/15 9/30/15 12/31/15 Service Charges and Fees Gain on Sales of Loans Gain on Investment Securities Other Dollars in thousands. Noninterest Income 16 $3,068 $3,025 $8,246 $3,084 $4,576 $2,840 $3,409 $4,029 $4,179 12/31/13 3/31/14 6/30/14 9/30/14 12/31/14 3/31/15 6/30/15 9/30/15 12/31/15 Service Charges and Fees Gain on Sales of Loans Gain on Investment Securities Other Dollars in thousands.
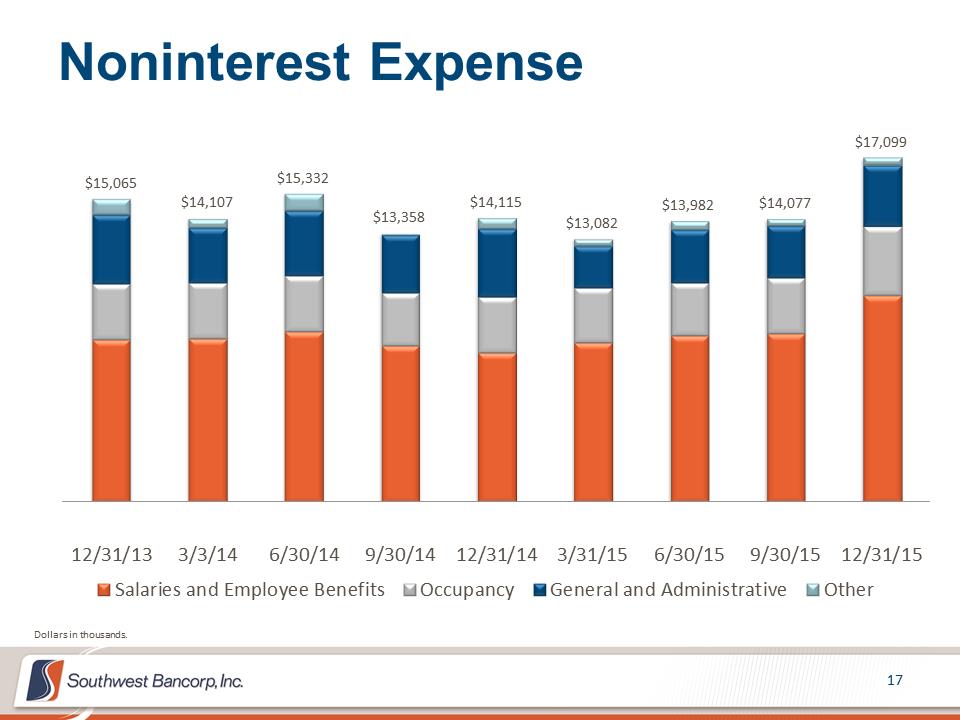 $15,065 $14,107 $15,332 $13,358 $14,115 $13,082 $13,982 $14,077 $17,099 12/31/13 3/3/14 6/30/14 9/30/14 12/31/14 3/31/15 6/30/15 9/30/15 12/31/15 Salaries and Employee Benefits Occupancy General and Administrative Other Noninterest Expense 17 Dollars in thousands. $15,065 $14,107 $15,332 $13,358 $14,115 $13,082 $13,982 $14,077 $17,099 12/31/13 3/3/14 6/30/14 9/30/14 12/31/14 3/31/15 6/30/15 9/30/15 12/31/15 Salaries and Employee Benefits Occupancy General and Administrative Other Noninterest Expense 17 Dollars in thousands.
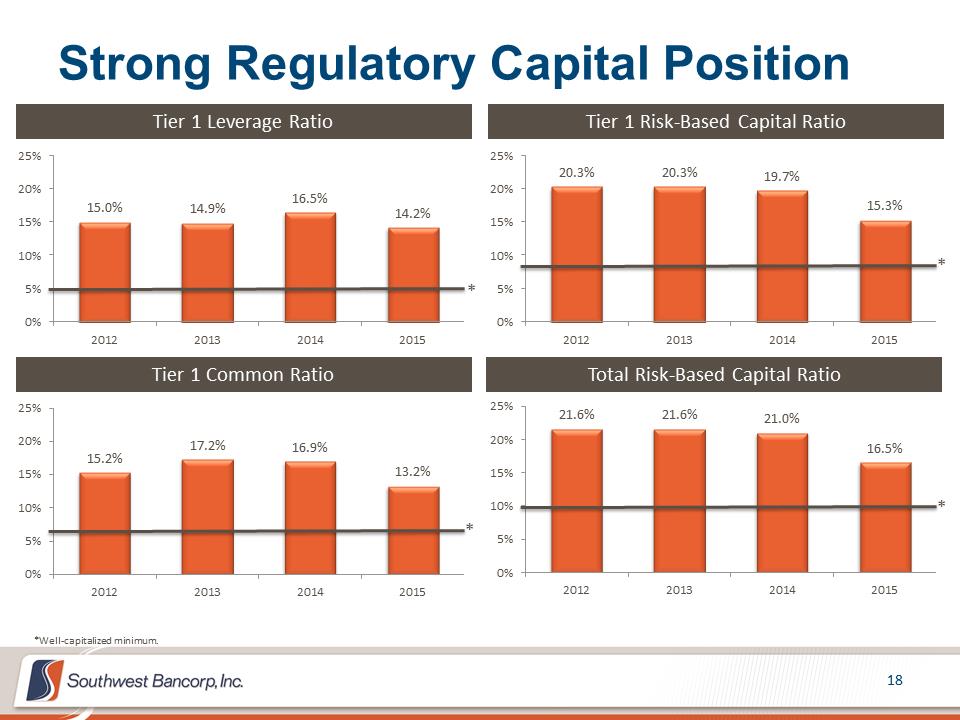 Strong Regulatory Capital Position Tier 1 Leverage Ratio Tier 1 Risk Based Capital Ratio 20.3% 20.3% 19.7% 15.3% 0% 5% 10% 15% 20% 25% 15.0% 14.9% 16.5% 14.2% 0% 5% 10% 15% 20% 25% * * 2012 2013 2014 2015 2012 2013 2014 2015 Total Risk Based Capital Ratio Tier 1 Common Ratio 2012 2013 2014 2015 2012 2013 2014 2015 15.2% 17.2% 16.9% 13.2% 0% 5% 10% 15% 20% 25% * * 21.6% 21.6% 21.0% 16.5% 0% 5% 10% 15% 20% 25% *Well-capitalized minimum.
 2016 Priorities Maintain strong credit quality along with conservative balance sheet and risk management. Continue appropriate growth in the commercial banking sector. Grow deposit base commensurate with loan growth. Focus on fee based income growth in mortgage, consumer and treasury. Assess, manage and add talent where available and appropriate throughout the organization. Drive growth in the healthcare banking segment. Deploy capital in a manner that grows the organization and enhances shareholder value. Manage expenses to drive operating efficiency improvements. Ensure that the repurchase and dividend programs are providing the best shareholder returns.
 ADDITIONAL FINANCIAL INFORMATION
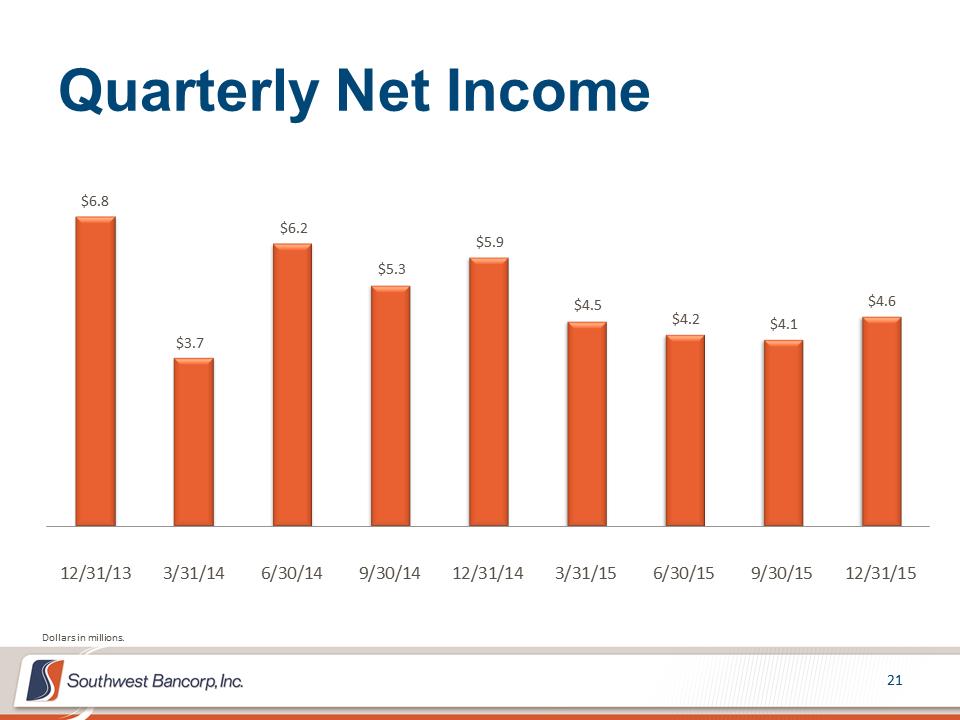 Quarterly Net Income 21 $6.8 $3.7 $6.2 $5.3 $5.9 $4.5 $4.2 $4.1 $4.6 12/31/13 3/31/14 6/30/14 9/30/14 12/31/14 3/31/15 6/30/15 9/30/15 12/31/15 Dollars in millions. Quarterly Net Income 21 $6.8 $3.7 $6.2 $5.3 $5.9 $4.5 $4.2 $4.1 $4.6 12/31/13 3/31/14 6/30/14 9/30/14 12/31/14 3/31/15 6/30/15 9/30/15 12/31/15 Dollars in millions.
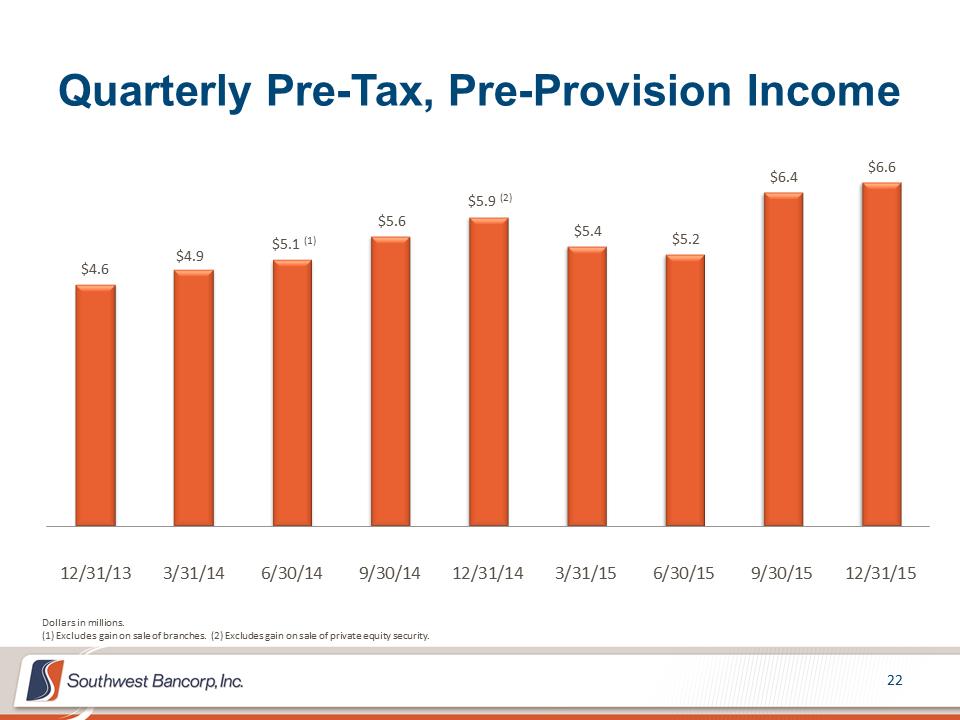 Quarterly Pre-Tax, Pre-Provision Income 22 $4.6 $4.9 $5.1 (1) $5.6 $5.9 (2) $5.4 $5.2 $6.4 $6.6 12/31/13 3/31/14 6/30/14 9/30/14 12/31/14 3/31/15 6/30/15 9/30/15 12/31/15 Dollars in millions. (1) Excludes gain on sale of branches. (2) Excludes gain on sale of private equity security. Quarterly Pre-Tax, Pre-Provision Income 22 $4.6 $4.9 $5.1 (1) $5.6 $5.9 (2) $5.4 $5.2 $6.4 $6.6 12/31/13 3/31/14 6/30/14 9/30/14 12/31/14 3/31/15 6/30/15 9/30/15 12/31/15 Dollars in millions. (1) Excludes gain on sale of branches. (2) Excludes gain on sale of private equity security.
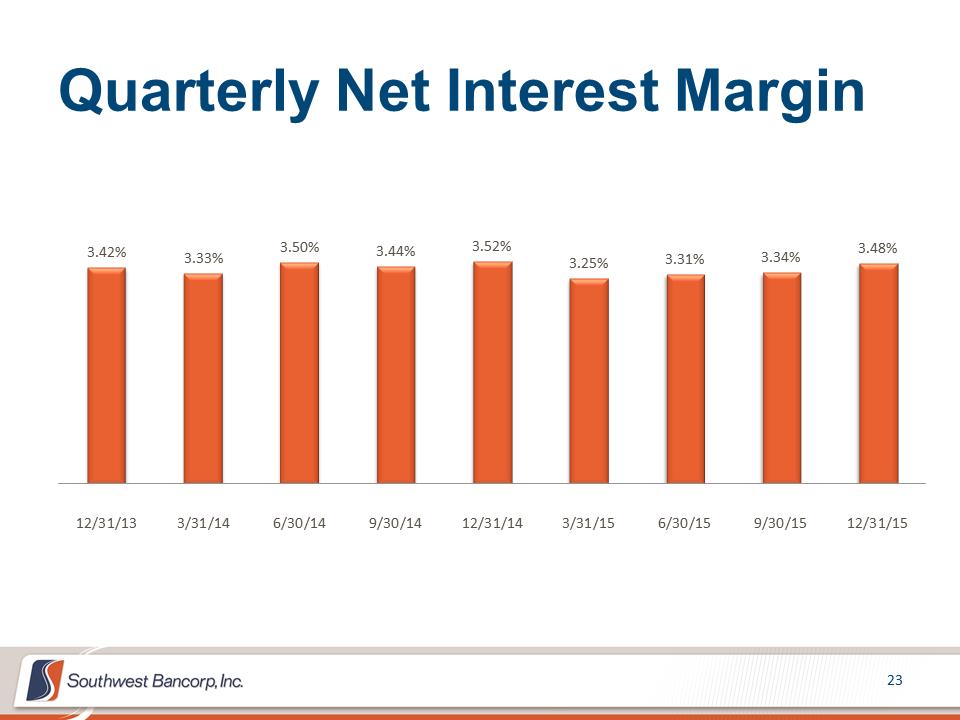 Quarterly Net Interest Margin 23 3.42% 3.33% 3.50% 3.44% 3.52% 3.25% 3.31% 3.34% 3.48% 12/31/13 3/31/14 6/30/14 9/30/14 12/31/14 3/31/15 6/30/15 9/30/15 12/31/15 Quarterly Net Interest Margin 23 3.42% 3.33% 3.50% 3.44% 3.52% 3.25% 3.31% 3.34% 3.48% 12/31/13 3/31/14 6/30/14 9/30/14 12/31/14 3/31/15 6/30/15 9/30/15 12/31/15
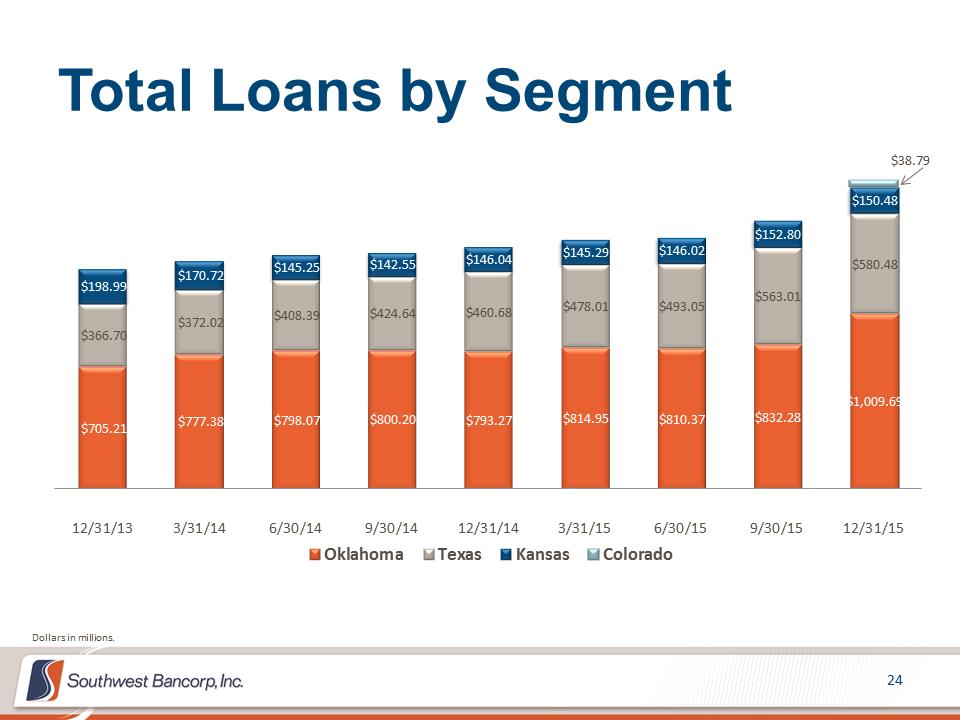 Total Loans by Segment 24 $705.21 $777.38 $798.07 $800.20 $793.27 $814.95 $810.37 $832.28 $1,009.69 $366.70 $372.02 $408.39 $424.64 $460.68 $478.01 $493.05 $563.01 $580.48 $198.99 $170.72 $145.25 $142.55 $146.04 $145.29 $146.02 $152.80 $150.48 $38.79 12/31/13 3/31/14 6/30/14 9/30/14 12/31/14 3/31/15 6/30/15 9/30/15 12/31/15 Oklahoma Texas Kansas Colorado Dollars in millions. Total Loans by Segment 24 $705.21 $777.38 $798.07 $800.20 $793.27 $814.95 $810.37 $832.28 $1,009.69 $366.70 $372.02 $408.39 $424.64 $460.68 $478.01 $493.05 $563.01 $580.48 $198.99 $170.72 $145.25 $142.55 $146.04 $145.29 $146.02 $152.80 $150.48 $38.79 12/31/13 3/31/14 6/30/14 9/30/14 12/31/14 3/31/15 6/30/15 9/30/15 12/31/15 Oklahoma Texas Kansas Colorado Dollars in millions.
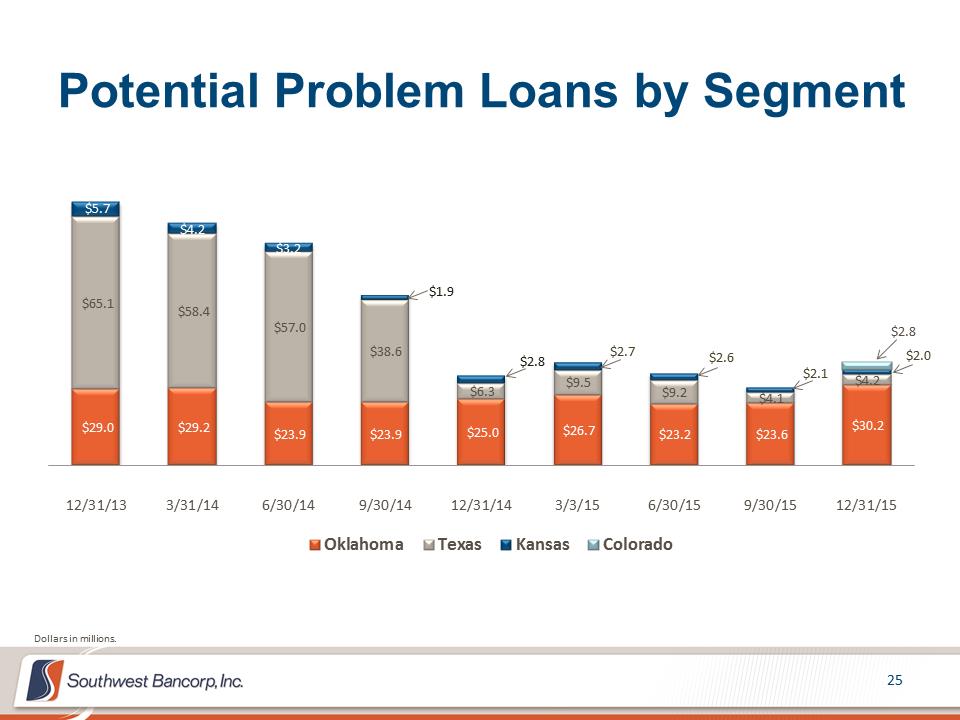 Potential Problem Loans by Segment 25 $29.0 $29.2 $23.9 $23.9 $25.0 $26.7 $23.2 $23.6 $30.2 $65.1 $58.4 $57.0 $38.6 $6.3 $9.5 $9.2 $4.1 $4.2 $5.7 $4.2 $3.2 $1.9 $2.8 $2.7 $2.6 $2.1 $2.0 $2.8 12/31/13 3/31/14 6/30/14 9/30/14 12/31/14 3/3/15 6/30/15 9/30/15 12/31/15 Oklahoma Texas Kansas Colorado Dollars in millions. Potential Problem Loans by Segment 25 $29.0 $29.2 $23.9 $23.9 $25.0 $26.7 $23.2 $23.6 $30.2 $65.1 $58.4 $57.0 $38.6 $6.3 $9.5 $9.2 $4.1 $4.2 $5.7 $4.2 $3.2 $1.9 $2.8 $2.7 $2.6 $2.1 $2.0 $2.8 12/31/13 3/31/14 6/30/14 9/30/14 12/31/14 3/3/15 6/30/15 9/30/15 12/31/15 Oklahoma Texas Kansas Colorado Dollars in millions.
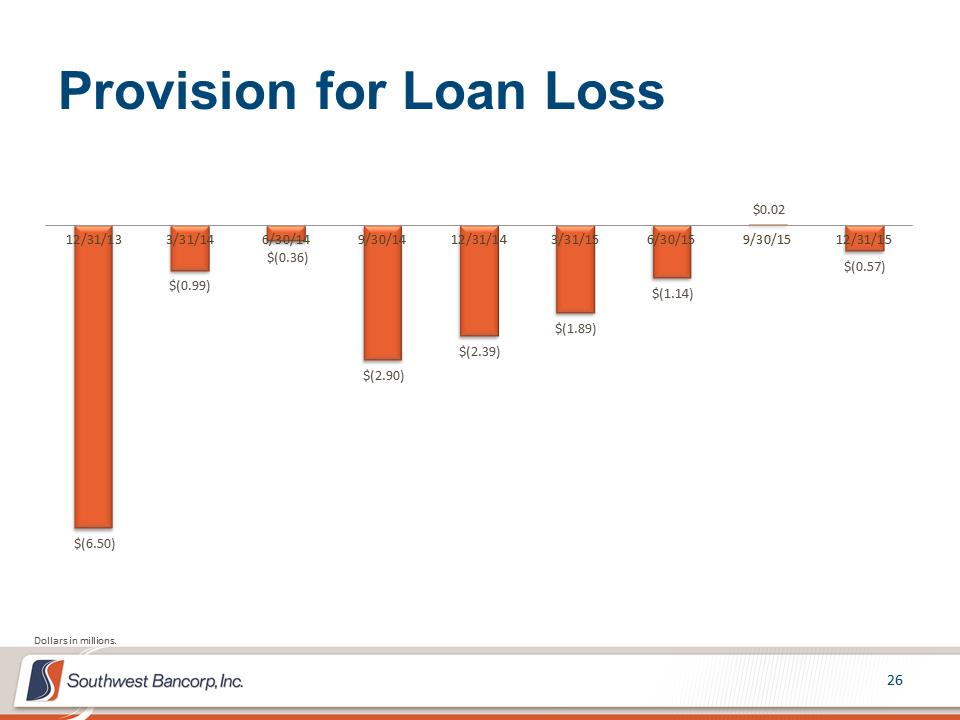 Provision for Loan Loss 26 $(6.50) $(0.99) $(0.36) $(2.90) $(2.39) $(1.89) $(1.14) $0.02 $(0.57) 12/31/13 3/31/14 6/30/14 9/30/14 12/31/14 3/31/15 6/30/15 9/30/15 12/31/15 Dollars in millions. Provision for Loan Loss 26 $(6.50) $(0.99) $(0.36) $(2.90) $(2.39) $(1.89) $(1.14) $0.02 $(0.57) 12/31/13 3/31/14 6/30/14 9/30/14 12/31/14 3/31/15 6/30/15 9/30/15 12/31/15 Dollars in millions.
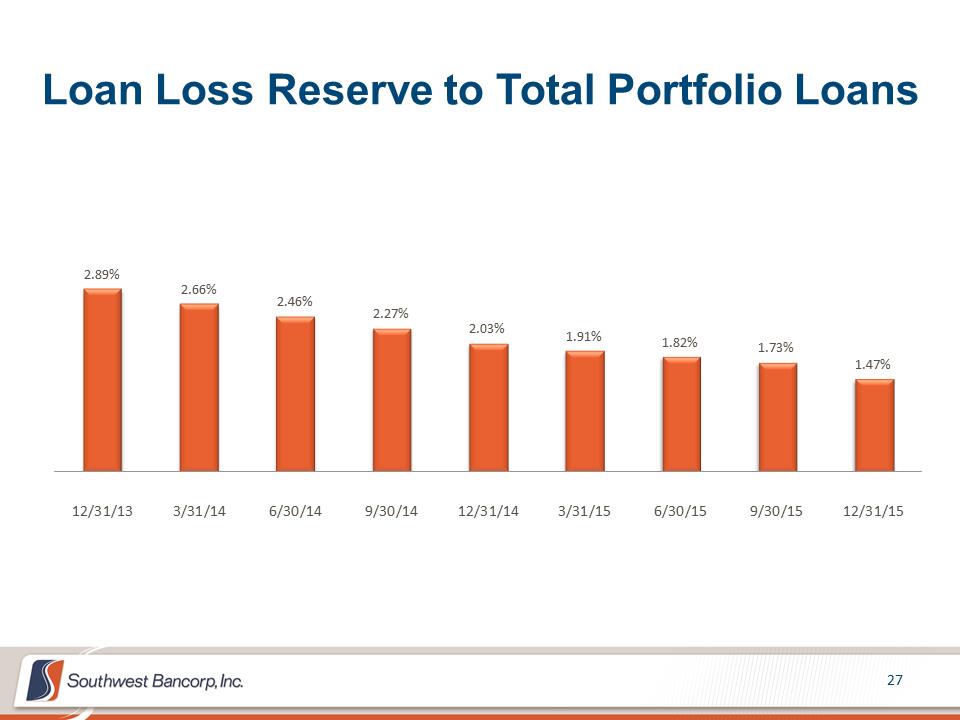 Loan Loss Reserve to Total Portfolio Loans 27 2.89% 2.66% 2.46% 2.27% 2.03% 1.91% 1.82% 1.73% 1.47% 12/31/13 3/31/14 6/30/14 9/30/14 12/31/14 3/31/15 6/30/15 9/30/15 12/31/15 Loan Loss Reserve to Total Portfolio Loans 27 2.89% 2.66% 2.46% 2.27% 2.03% 1.91% 1.82% 1.73% 1.47% 12/31/13 3/31/14 6/30/14 9/30/14 12/31/14 3/31/15 6/30/15 9/30/15 12/31/15
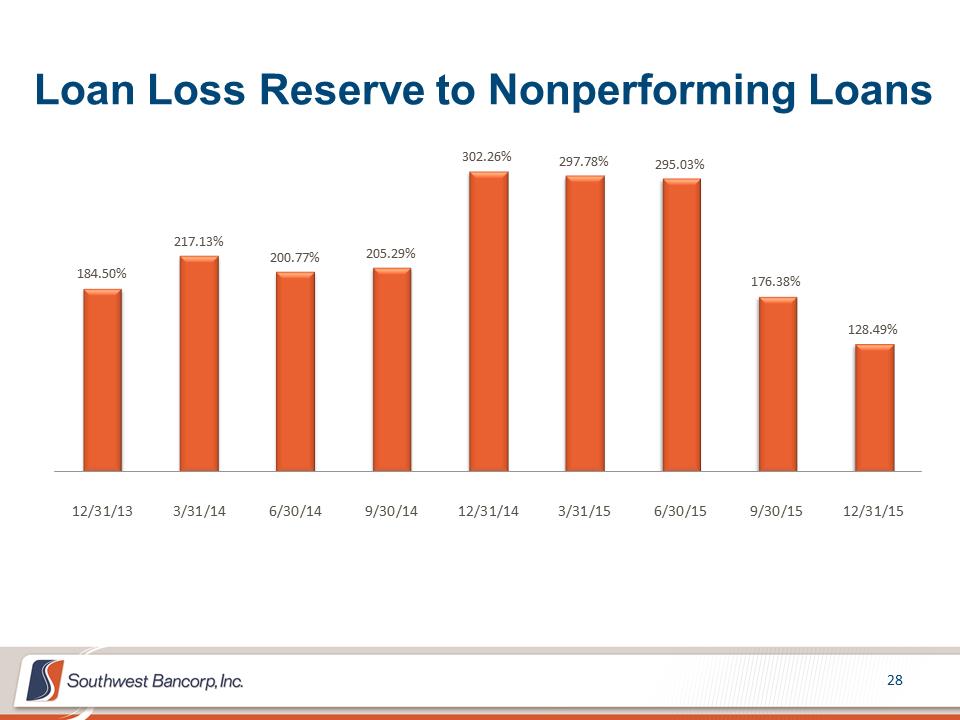 Loan Loss Reserve to Nonperforming Loans 28 184.50% 217.13% 200.77% 205.29% 302.26% 297.78% 295.03% 176.38% 128.49% 12/31/13 3/31/14 6/30/14 9/30/14 12/31/14 3/31/15 6/30/15 9/30/15 12/31/15 Loan Loss Reserve to Nonperforming Loans 28 184.50% 217.13% 200.77% 205.29% 302.26% 297.78% 295.03% 176.38% 128.49% 12/31/13 3/31/14 6/30/14 9/30/14 12/31/14 3/31/15 6/30/15 9/30/15 12/31/15
 APPENDIX
 The subsequent tables present non-GAAP reconciliations of the following calculations: – Tangible Common Equity (TCE) to Tangible Assets (TA) ratio – Tangible Book Value per Share – Pre-tax, Pre-provision Income
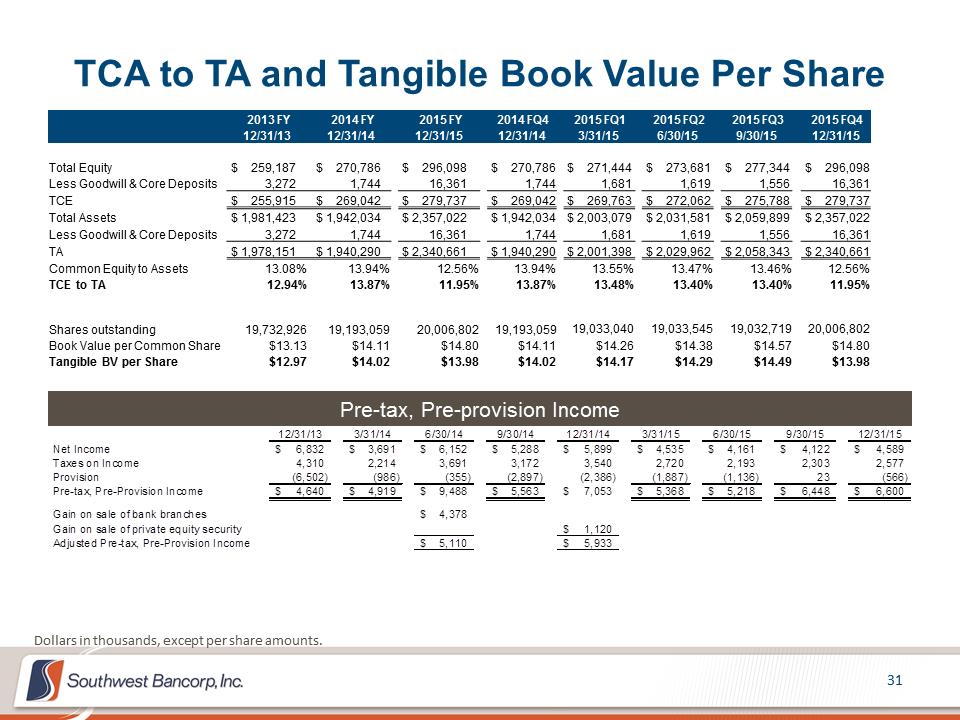 TCA to TA and Tangible Book Value Per Share 2013 FY 2014 FY 2015 FY 2014 FQ4 2015 FQ1 2015 FQ2 2015 FQ3 2015 FQ4 12/31/13 12/31/14 12/31/15 12/31/14 3/31/15 6/30/15 9/30/15 12/31/15 Total Equity $ 259,187 $ 270,786 $ 296,098 $ 270,786 $ 271,444 $ 273,681 $ 277,344 $ 296,098 Less Goodwill & Core Deposits 3,272 1,744 16,361 1,744 1,681 1,619 1,556 16,361 TCE $ 255,915 $ 269,042 $ 279,737 $ 269,042 $ 269,763 $ 272,062 $ 275,788 $ 279,737 Total Assets $ 1,981,423 $ 1,942,034 $ 2,357,022 $ 1,942,034 $ 2,003,079 $ 2,031,581 $ 2,059,899 $ 2,357,022 Less Goodwill & Core Deposits 3,272 1,744 16,361 1,744 1,681 1,619 1,556 16,361 TA $ 1,978,151 $ 1,940,290 $ 2,340,661 $ 1,940,290 $ 2,001,398 $ 2,029,962 $ 2,058,343 $ 2,340,661 Common Equity to Assets 13.08% 13.94% 12.56% 13.94% 13.55% 13.47% 13.46% 12.56% TCE to TA 12.94% 13.87% 11.95% 13.87% 13.48% 13.40% 13.40% 11.95% Shares outstanding 19,732,926 19,193,059 20,006,802 19,193,059 19,033,040 19,033,545 19,032,719 20,006,802 Book Value per Common Share $13.13 $14.11 $14.80 $14.11 $14.26 $14.38 $14.57 $14.80 Tangible BV per Share $12.97 $14.02 $13.98 $14.02 $14.17 $14.29 $14.49 $13.98 Pre-tax, Pre-provision Income 12/31/133/31/146/30/149/30/1412/31/143/31/156/30/159/30/1512/31/15Net Income6,832$ 3,691$ 6,152$ 5,288$ 5,899$ 4,535$ 4,161$ 4,122$ 4,589$ Taxes on Income4,310 2,214 3,691 3,172 3,540 2,720 2,193 2,303 2,577 Provision(6,502) (986) (355) (2,897) (2,386) (1,887) (1,136) 23 (566) Pre-tax, Pre-Provision Income4,640$ 4,919$ 9,488$ 5,563$ 7,053$ 5,368$ 5,218$ 6,448$ 6,600$ Gain on sale of bank branches4,378$ Gain on sale of private equity security1,120$ Adjusted Pre-tax, Pre-Provision Income5,110$ 5,933$ Dollars in thousands, except per share amounts.
2015 Fourth Quarter Earnings Presentation NASDAQ: OKSB January 20, 2016