Attached files
| file | filename |
|---|---|
| 8-K - 8-K - WELLS FARGO & COMPANY/MN | wfc4qer1-15x2016form8xk.htm |
| EX-99.1 - EXHIBIT 99.1 - WELLS FARGO & COMPANY/MN | wfc4qer1-15x2016exx991.htm |
4Q15 Quarterly Supplement January 15, 2016 © 2016 Wells Fargo & Company. All rights reserved. Exhibit 99.2
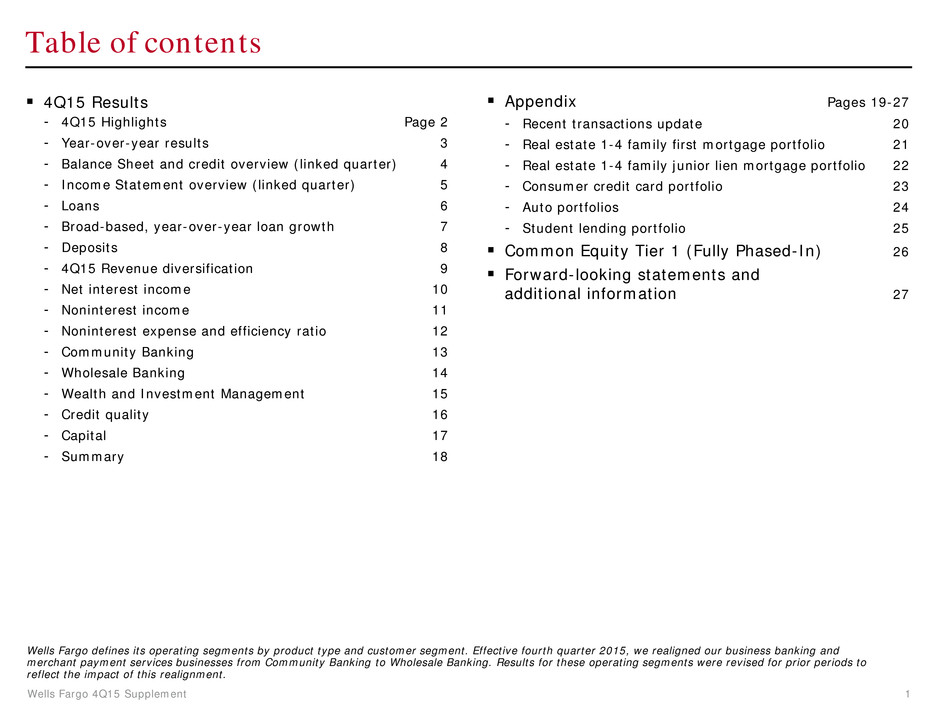
Wells Fargo 4Q15 Supplement 1 Appendix Pages 19-27 - Recent transactions update 20 - Real estate 1-4 family first mortgage portfolio 21 - Real estate 1-4 family junior lien mortgage portfolio 22 - Consumer credit card portfolio 23 - Auto portfolios 24 - Student lending portfolio 25 Common Equity Tier 1 (Fully Phased-In) 26 Forward-looking statements and additional information 27 Table of contents 4Q15 Results - 4Q15 Highlights Page 2 - Year-over-year results 3 - Balance Sheet and credit overview (linked quarter) 4 - Income Statement overview (linked quarter) 5 - Loans 6 - Broad-based, year-over-year loan growth 7 - Deposits 8 - 4Q15 Revenue diversification 9 - Net interest income 10 - Noninterest income 11 - Noninterest expense and efficiency ratio 12 - Community Banking 13 - Wholesale Banking 14 - Wealth and Investment Management 15 - Credit quality 16 - Capital 17 - Summary 18 Wells Fargo defines its operating segments by product type and customer segment. Effective fourth quarter 2015, we realigned our business banking and merchant payment services businesses from Community Banking to Wholesale Banking. Results for these operating segments were revised for prior periods to reflect the impact of this realignment.
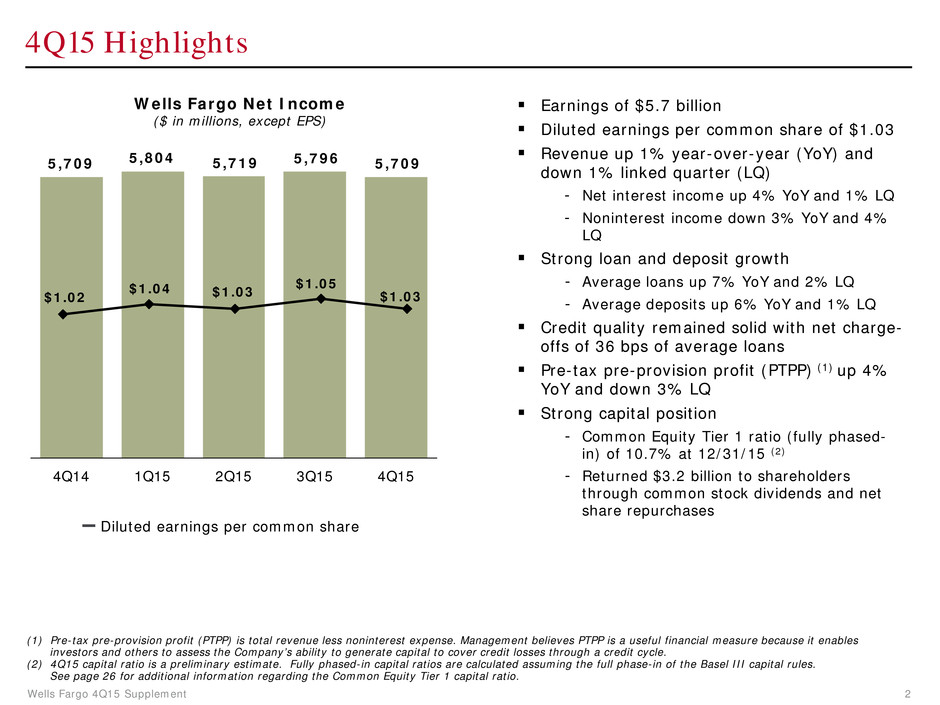
Wells Fargo 4Q15 Supplement 2 4Q15 Highlights Earnings of $5.7 billion Diluted earnings per common share of $1.03 Revenue up 1% year-over-year (YoY) and down 1% linked quarter (LQ) - Net interest income up 4% YoY and 1% LQ - Noninterest income down 3% YoY and 4% LQ Strong loan and deposit growth - Average loans up 7% YoY and 2% LQ - Average deposits up 6% YoY and 1% LQ Credit quality remained solid with net charge- offs of 36 bps of average loans Pre-tax pre-provision profit (PTPP) (1) up 4% YoY and down 3% LQ Strong capital position - Common Equity Tier 1 ratio (fully phased- in) of 10.7% at 12/31/15 (2) - Returned $3.2 billion to shareholders through common stock dividends and net share repurchases Wells Fargo Net Income ($ in millions, except EPS) (1) Pre-tax pre-provision profit (PTPP) is total revenue less noninterest expense. Management believes PTPP is a useful financial measure because it enables investors and others to assess the Company’s ability to generate capital to cover credit losses through a credit cycle. (2) 4Q15 capital ratio is a preliminary estimate. Fully phased-in capital ratios are calculated assuming the full phase-in of the Basel III capital rules. See page 26 for additional information regarding the Common Equity Tier 1 capital ratio. Diluted earnings per common share 5,709 5,804 5,719 5,796 5,709 4Q14 1Q15 2Q15 3Q15 4Q15 $1.02 $1.04 $1.03 $1.05 $1.03
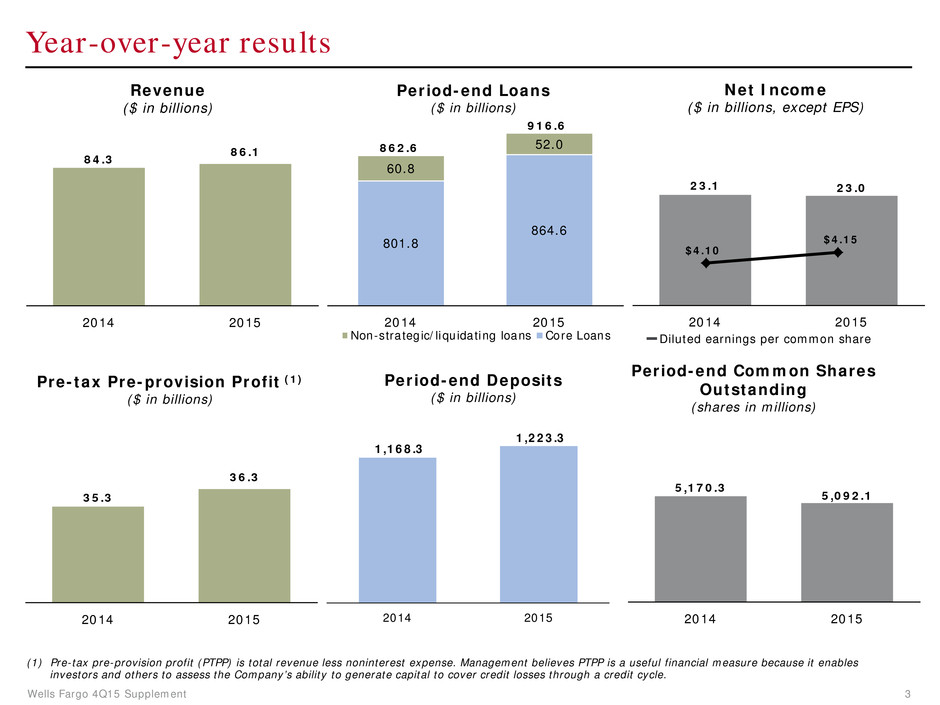
Wells Fargo 4Q15 Supplement 3 23.1 23.0 2014 2015 Year-over-year results Pre-tax Pre-provision Profit (1) ($ in billions) Net Income ($ in billions, except EPS) Diluted earnings per common share Period-end Loans ($ in billions) Period-end Deposits ($ in billions) Revenue ($ in billions) (1) Pre-tax pre-provision profit (PTPP) is total revenue less noninterest expense. Management believes PTPP is a useful financial measure because it enables investors and others to assess the Company’s ability to generate capital to cover credit losses through a credit cycle. 84.3 86.1 2014 2015 801.8 864.6 60.8 52.0862.6 916.6 2014 2015 Non-strategic/liquidating loans Core Loans 1,168.3 1,223.3 2014 2015 $4.10 $4.15 Period-end Common Shares Outstanding (shares in millions) 35.3 36.3 2014 2015 5,170.3 5,092.1 2014 2015
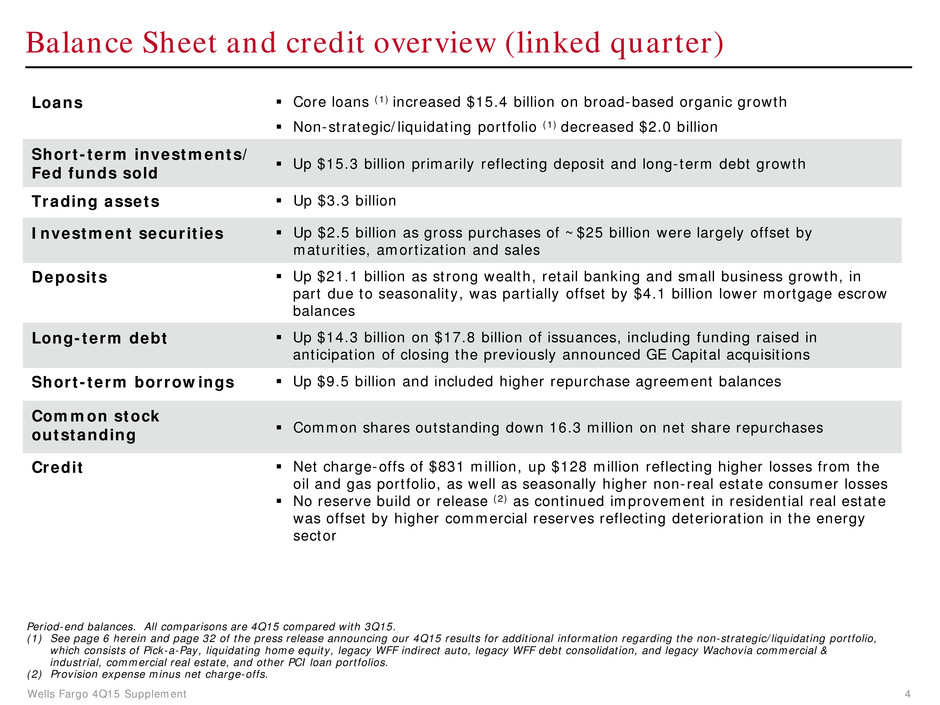
Wells Fargo 4Q15 Supplement 4 Balance Sheet and credit overview (linked quarter) Loans Core loans (1) increased $15.4 billion on broad-based organic growth Non-strategic/liquidating portfolio (1) decreased $2.0 billion Short-term investments/ Fed funds sold Up $15.3 billion primarily reflecting deposit and long-term debt growth Trading assets Up $3.3 billion Investment securities Up $2.5 billion as gross purchases of ~$25 billion were largely offset by maturities, amortization and sales Deposits Up $21.1 billion as strong wealth, retail banking and small business growth, in part due to seasonality, was partially offset by $4.1 billion lower mortgage escrow balances Long-term debt Up $14.3 billion on $17.8 billion of issuances, including funding raised in anticipation of closing the previously announced GE Capital acquisitions Short-term borrowings Up $9.5 billion and included higher repurchase agreement balances Common stock outstanding Common shares outstanding down 16.3 million on net share repurchases Credit Net charge-offs of $831 million, up $128 million reflecting higher losses from the oil and gas portfolio, as well as seasonally higher non-real estate consumer losses No reserve build or release (2) as continued improvement in residential real estate was offset by higher commercial reserves reflecting deterioration in the energy sector Period-end balances. All comparisons are 4Q15 compared with 3Q15. (1) See page 6 herein and page 32 of the press release announcing our 4Q15 results for additional information regarding the non-strategic/liquidating portfolio, which consists of Pick-a-Pay, liquidating home equity, legacy WFF indirect auto, legacy WFF debt consolidation, and legacy Wachovia commercial & industrial, commercial real estate, and other PCI loan portfolios. (2) Provision expense minus net charge-offs.
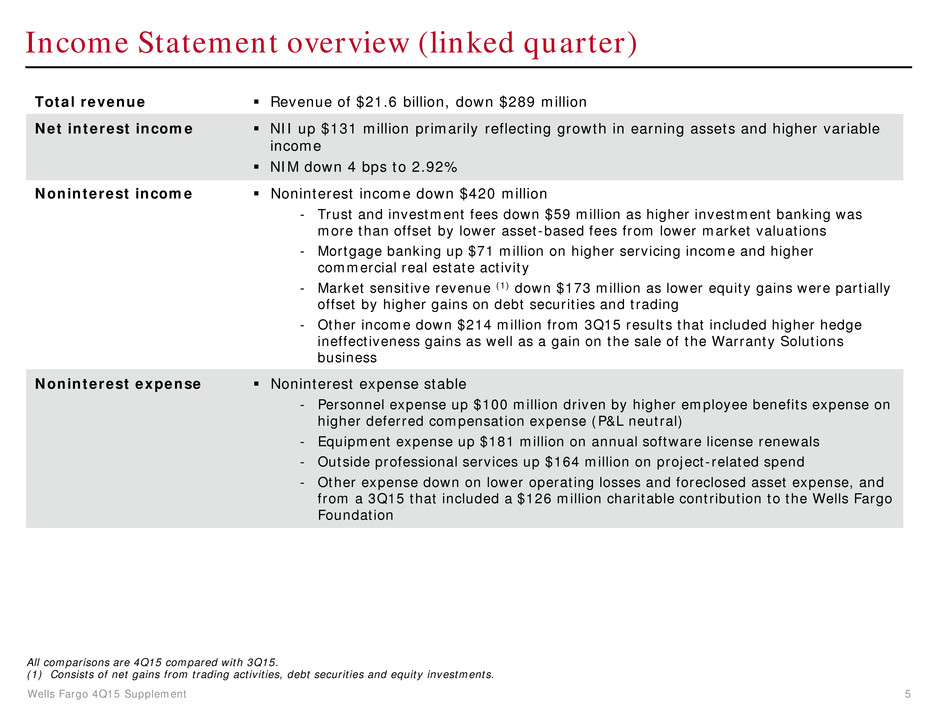
Wells Fargo 4Q15 Supplement 5 Income Statement overview (linked quarter) Total revenue Revenue of $21.6 billion, down $289 million Net interest income NII up $131 million primarily reflecting growth in earning assets and higher variable income NIM down 4 bps to 2.92% Noninterest income Noninterest income down $420 million - Trust and investment fees down $59 million as higher investment banking was more than offset by lower asset-based fees from lower market valuations - Mortgage banking up $71 million on higher servicing income and higher commercial real estate activity - Market sensitive revenue (1) down $173 million as lower equity gains were partially offset by higher gains on debt securities and trading - Other income down $214 million from 3Q15 results that included higher hedge ineffectiveness gains as well as a gain on the sale of the Warranty Solutions business Noninterest expense Noninterest expense stable - Personnel expense up $100 million driven by higher employee benefits expense on higher deferred compensation expense (P&L neutral) - Equipment expense up $181 million on annual software license renewals - Outside professional services up $164 million on project-related spend - Other expense down on lower operating losses and foreclosed asset expense, and from a 3Q15 that included a $126 million charitable contribution to the Wells Fargo Foundation All comparisons are 4Q15 compared with 3Q15. (1) Consists of net gains from trading activities, debt securities and equity investments.
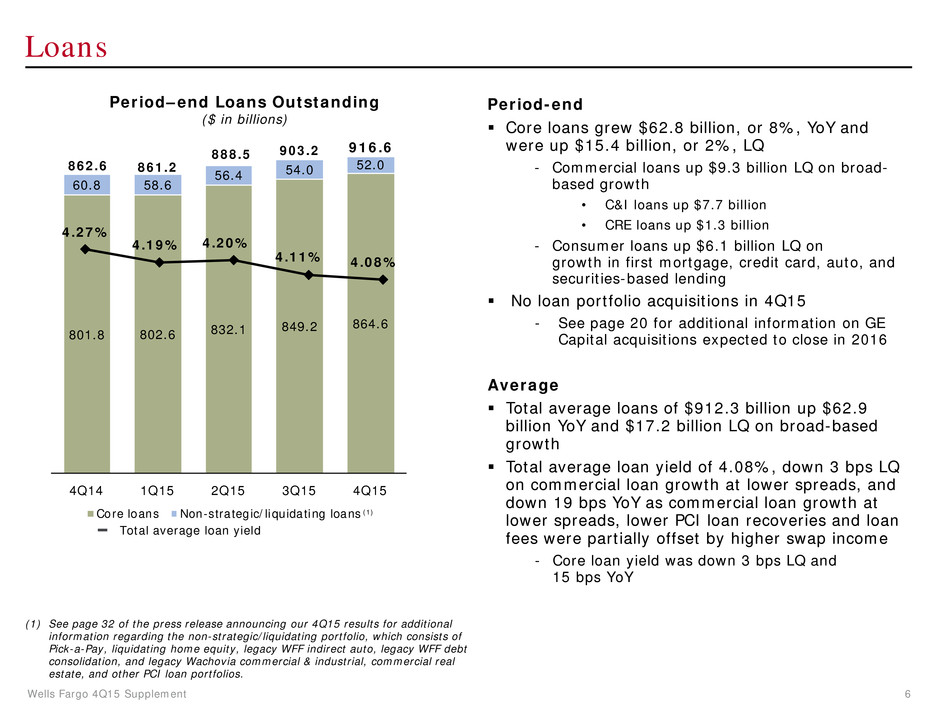
Wells Fargo 4Q15 Supplement 6 801.8 802.6 832.1 849.2 864.6 60.8 58.6 56.4 54.0 52.0862.6 861.2 888.5 903.2 4Q14 1Q15 2Q15 3Q15 4Q15 Core loans Non-strategic/liquidating loans Loans Period-end Core loans grew $62.8 billion, or 8%, YoY and were up $15.4 billion, or 2%, LQ - Commercial loans up $9.3 billion LQ on broad- based growth • C&I loans up $7.7 billion • CRE loans up $1.3 billion - Consumer loans up $6.1 billion LQ on growth in first mortgage, credit card, auto, and securities-based lending No loan portfolio acquisitions in 4Q15 - See page 20 for additional information on GE Capital acquisitions expected to close in 2016 Average Total average loans of $912.3 billion up $62.9 billion YoY and $17.2 billion LQ on broad-based growth Total average loan yield of 4.08%, down 3 bps LQ on commercial loan growth at lower spreads, and down 19 bps YoY as commercial loan growth at lower spreads, lower PCI loan recoveries and loan fees were partially offset by higher swap income - Core loan yield was down 3 bps LQ and 15 bps YoY (1) See page 32 of the press release announcing our 4Q15 results for additional information regarding the non-strategic/liquidating portfolio, which consists of Pick-a-Pay, liquidating home equity, legacy WFF indirect auto, legacy WFF debt consolidation, and legacy Wachovia commercial & industrial, commercial real estate, and other PCI loan portfolios. Period–end Loans Outstanding ($ in billions) (1) Total average loan yield 4.27% 4.19% 4.20% 4.11% 4.08% 916.6
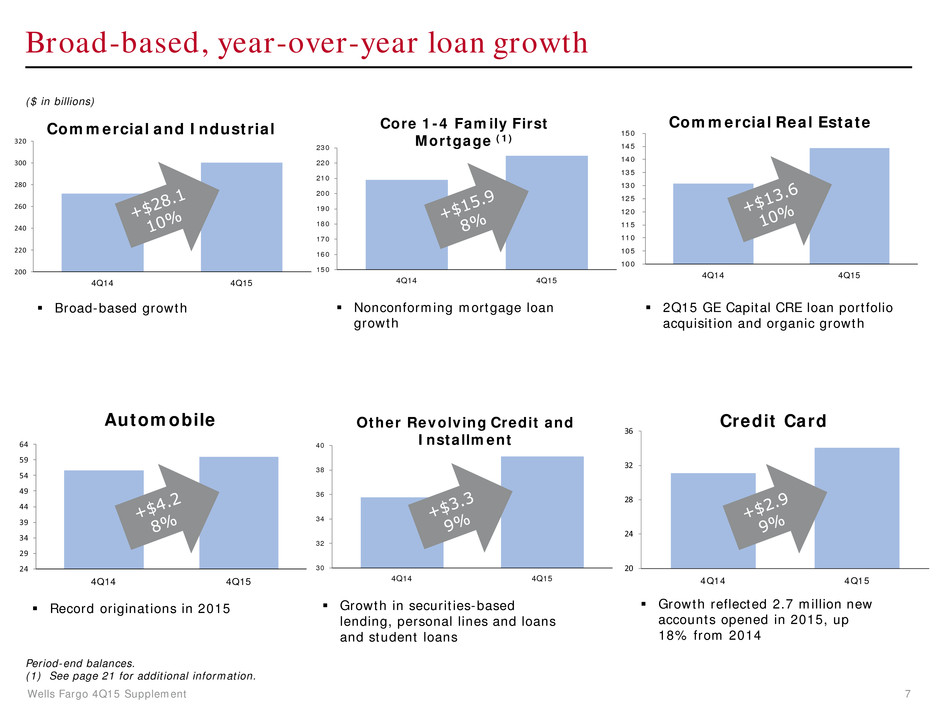
Wells Fargo 4Q15 Supplement 7 24 29 34 39 44 49 54 59 64 4Q14 4Q15 Automobile 20 24 28 32 36 4Q14 4Q15 Credit Card 150 160 170 180 190 200 210 220 230 4Q14 4Q15 Core 1-4 Family First Mortgage (1) 100 105 110 115 120 125 130 135 140 145 150 4Q14 4Q15 Commercial Real Estate 200 220 240 260 280 300 320 4Q14 4Q15 Commercial and Industrial Broad-based, year-over-year loan growth Nonconforming mortgage loan growth Record originations in 2015 Growth reflected 2.7 million new accounts opened in 2015, up 18% from 2014 ($ in billions) Broad-based growth Period-end balances. (1) See page 21 for additional information. 2Q15 GE Capital CRE loan portfolio acquisition and organic growth 30 32 34 36 38 40 4Q14 4Q15 Other Revolving Credit and Installment Growth in securities-based lending, personal lines and loans and student loans
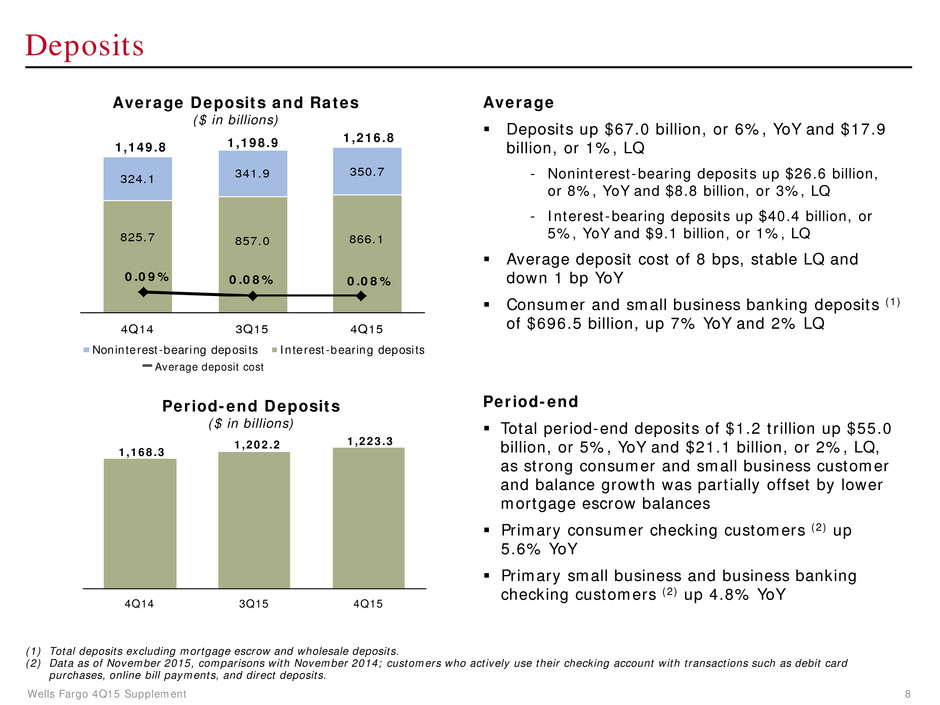
Wells Fargo 4Q15 Supplement 8 Deposits Average Deposits up $67.0 billion, or 6%, YoY and $17.9 billion, or 1%, LQ - Noninterest-bearing deposits up $26.6 billion, or 8%, YoY and $8.8 billion, or 3%, LQ - Interest-bearing deposits up $40.4 billion, or 5%, YoY and $9.1 billion, or 1%, LQ Average deposit cost of 8 bps, stable LQ and down 1 bp YoY Consumer and small business banking deposits (1) of $696.5 billion, up 7% YoY and 2% LQ Period-end Total period-end deposits of $1.2 trillion up $55.0 billion, or 5%, YoY and $21.1 billion, or 2%, LQ, as strong consumer and small business customer and balance growth was partially offset by lower mortgage escrow balances Primary consumer checking customers (2) up 5.6% YoY Primary small business and business banking checking customers (2) up 4.8% YoY Average Deposits and Rates ($ in billions) Average deposit cost Period-end Deposits ($ in billions) (1) Total deposits excluding mortgage escrow and wholesale deposits. (2) Data as of November 2015, comparisons with November 2014; customers who actively use their checking account with transactions such as debit card purchases, online bill payments, and direct deposits. 1,168.3 1,202.2 1,223.3 4Q14 3Q15 4Q15 825.7 857.0 866.1 324.1 341.9 350.7 1,149.8 1,198.9 1,216.8 4Q14 3Q15 4Q15 Noninterest-bearing deposits Interest-bearing deposits 0.09% 0.08% 0.08%
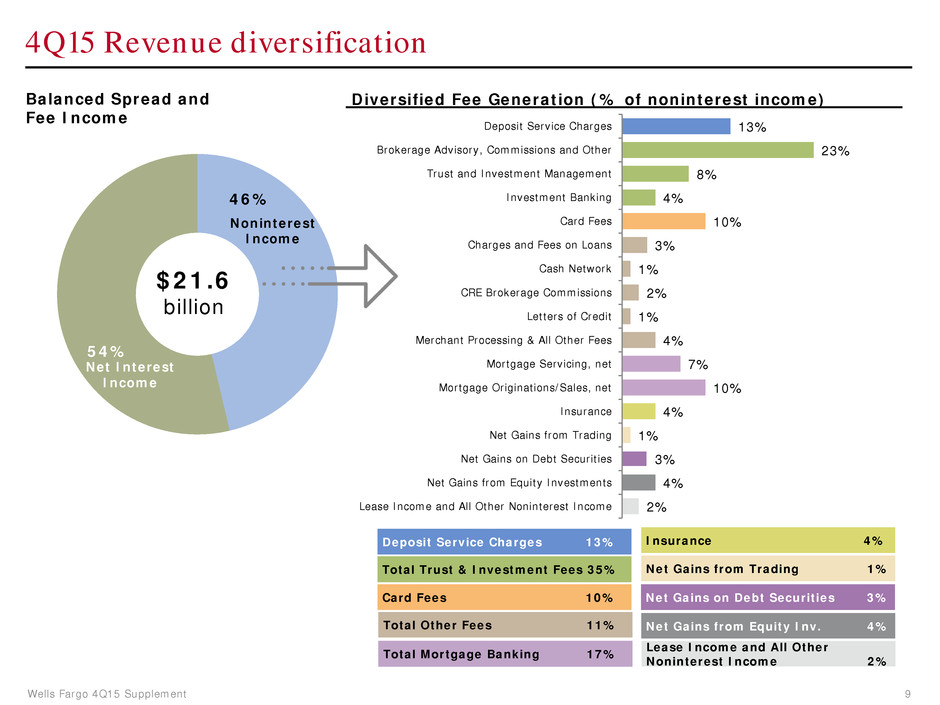
Wells Fargo 4Q15 Supplement 9 Balanced Spread and Fee Income Diversified Fee Generation (% of noninterest income) 4Q15 Revenue diversification 46% 54% Net Interest Income Noninterest Income 2% 4% 3% 1% 4% 10% 7% 4% 1% 2% 1% 3% 10% 4% 8% 23% 13% Lease Income and All Other Noninterest Income Net Gains from Equity Investments Net Gains on Debt Securities Net Gains from Trading Insurance Mortgage Originations/Sales, net Mortgage Servicing, net Merchant Processing & All Other Fees Letters of Credit CRE Brokerage Commissions Cash Network Charges and Fees on Loans Card Fees Investment Banking Trust and Investment Management Brokerage Advisory, Commissions and Other Deposit Service Charges $21.6 billion Deposit Service Charges 13% Card Fees 10% Total Mortgage Banking 17% Insurance 4% Net Gains from Trading 1% Total Trust & Investment Fees 35% Total Other Fees 11% Net Gains from Equity Inv. 4% Lease Income and All Other Noninterest Income 2% Net Gains on Debt Securities 3%
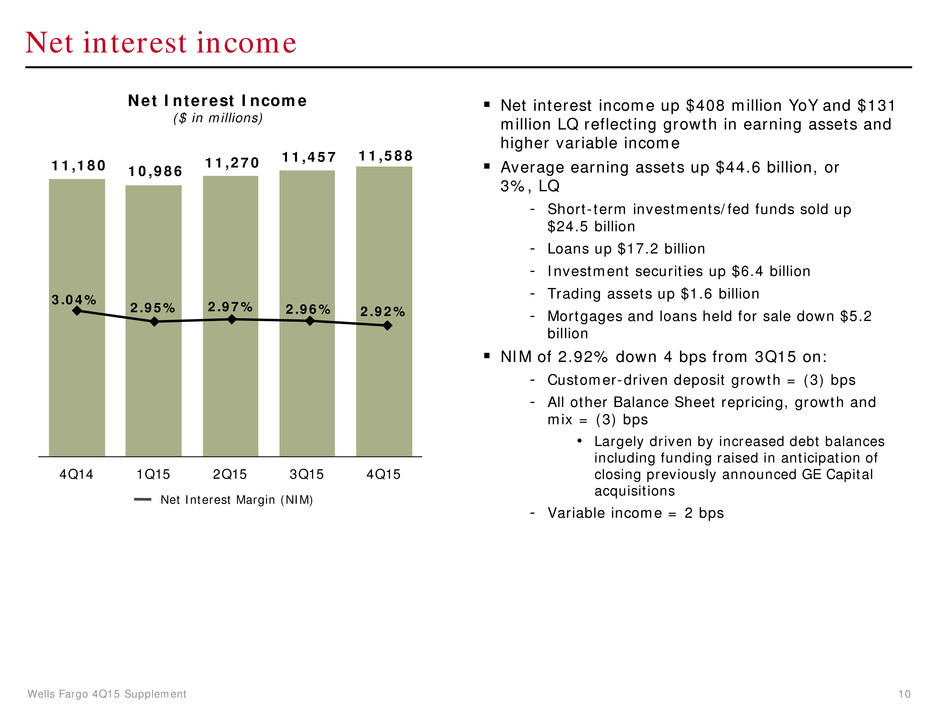
Wells Fargo 4Q15 Supplement 10 Net interest income up $408 million YoY and $131 million LQ reflecting growth in earning assets and higher variable income Average earning assets up $44.6 billion, or 3%, LQ - Short-term investments/fed funds sold up $24.5 billion - Loans up $17.2 billion - Investment securities up $6.4 billion - Trading assets up $1.6 billion - Mortgages and loans held for sale down $5.2 billion NIM of 2.92% down 4 bps from 3Q15 on: - Customer-driven deposit growth = (3) bps - All other Balance Sheet repricing, growth and mix = (3) bps • Largely driven by increased debt balances including funding raised in anticipation of closing previously announced GE Capital acquisitions - Variable income = 2 bps Net interest income Net Interest Income ($ in millions) Net Interest Margin (NIM) 11,180 10,986 11,270 11,457 11,588 4Q14 1Q15 2Q15 3Q15 4Q15 3.04% 2.95% 2.97% 2.96% 2.92%

Wells Fargo 4Q15 Supplement 11 Noninterest income Trust and investment fees down $59 million LQ as lower asset-based fees from lower market valuations were partially offset by higher investment banking Other fees down $59 million as higher commercial real estate brokerage commissions were more than offset by lower merchant processing fees (now recorded in other income) Mortgage banking up $71 million on higher servicing income and commercial mortgage activity Insurance up $51 million on crop insurance seasonality Trading gains up $125 million as higher deferred compensation gains were partially offset by lower customer accommodation trading - $83 million in deferred compensation investment income (P&L neutral) vs. ($214) million in 3Q15 Gains on sale of debt securities up $199 million net of $60 million of other-than-temporary impairment (OTTI) primarily reflecting marks on energy sector investments Gains from equity investments down $497 million from strong 3Q15 results and included $191 million of OTTI largely driven by marks on energy sector investments - Included $52 million gain from the sale of 49.9% interest in RELS, LLC Other income down $214 million from 3Q15 results that included gains on hedge ineffectiveness and a gain on the sale of the Warranty Solutions business 10,263 10,292 10,048 10,418 9,998 4Q14 1Q15 2Q15 3Q15 4Q15 vs vs ($ in millions) 4Q15 3Q15 4Q14 Noninterest income Service charges on deposit accounts $ 1,329 - % 7 Trust and investment fees Brokerage advisory, commissions and other fees 2,288 (3) (2) Trust and investment management 838 (1) (1) Investment banking 385 7 (26) Card fees 966 1 4 Other fees 1,040 (5) (7) Mortgage banking 1,660 4 10 Insurance 427 14 12 Net gains from trading activities 99 n.m. (45) Net gains on debt securities 346 n.m. 86 Net gains from equity investments 423 (54) 14 Lease income 145 (23) 14 Other 52 (80) (90) Total noninterest income $ 9,998 (4) % (3)
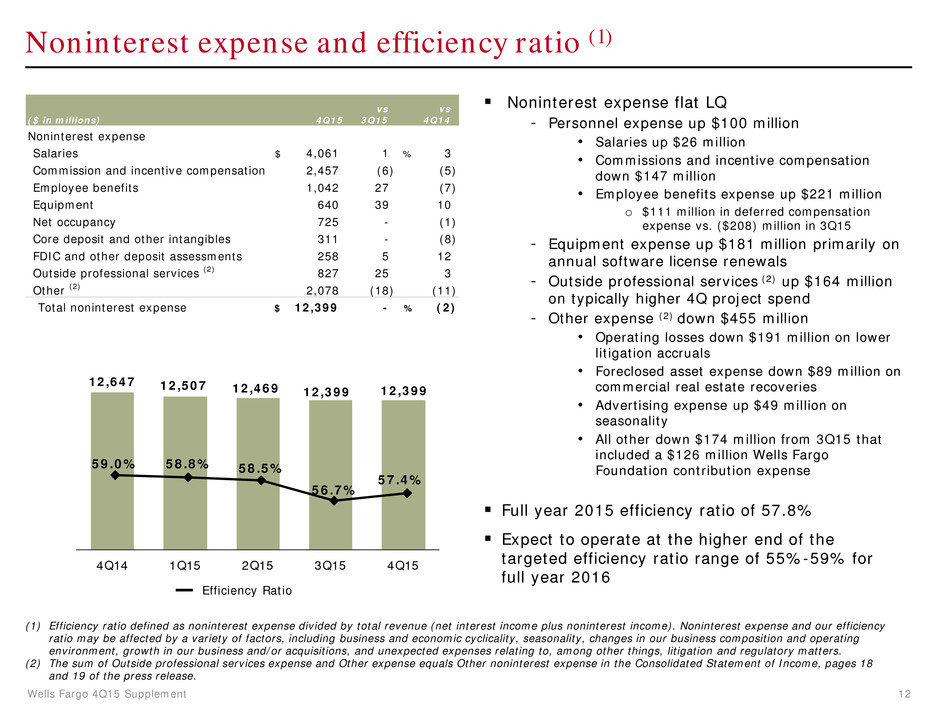
Wells Fargo 4Q15 Supplement 12 12,647 12,507 12,469 12,399 12,399 4Q14 1Q15 2Q15 3Q15 4Q15 59.0% 58.8% 58.5% 56.7% 57.4% Noninterest expense and efficiency ratio (1) Noninterest expense flat LQ - Personnel expense up $100 million • Salaries up $26 million • Commissions and incentive compensation down $147 million • Employee benefits expense up $221 million o $111 million in deferred compensation expense vs. ($208) million in 3Q15 - Equipment expense up $181 million primarily on annual software license renewals - Outside professional services (2) up $164 million on typically higher 4Q project spend - Other expense (2) down $455 million • Operating losses down $191 million on lower litigation accruals • Foreclosed asset expense down $89 million on commercial real estate recoveries • Advertising expense up $49 million on seasonality • All other down $174 million from 3Q15 that included a $126 million Wells Fargo Foundation contribution expense Full year 2015 efficiency ratio of 57.8% Expect to operate at the higher end of the targeted efficiency ratio range of 55%-59% for full year 2016 Efficiency Ratio (1) Efficiency ratio defined as noninterest expense divided by total revenue (net interest income plus noninterest income). Noninterest expense and our efficiency ratio may be affected by a variety of factors, including business and economic cyclicality, seasonality, changes in our business composition and operating environment, growth in our business and/or acquisitions, and unexpected expenses relating to, among other things, litigation and regulatory matters. (2) The sum of Outside professional services expense and Other expense equals Other noninterest expense in the Consolidated Statement of Income, pages 18 and 19 of the press release. vs vs ($ in millions) 4Q15 3Q15 4Q14 Noninterest expense Salaries $ 4,061 1 % 3 Commission and incentive compensation 2,457 (6) (5) Employee benefits 1,042 27 (7) Equipment 640 39 10 Net occupancy 725 - (1) Core deposit and other intangibles 311 - (8) FDIC and other deposit assessments 258 5 12 Outside professional services (2) 827 25 3 Other (2) 2,078 (18) (11) Total noninterest expense $ 12,399 - % (2)
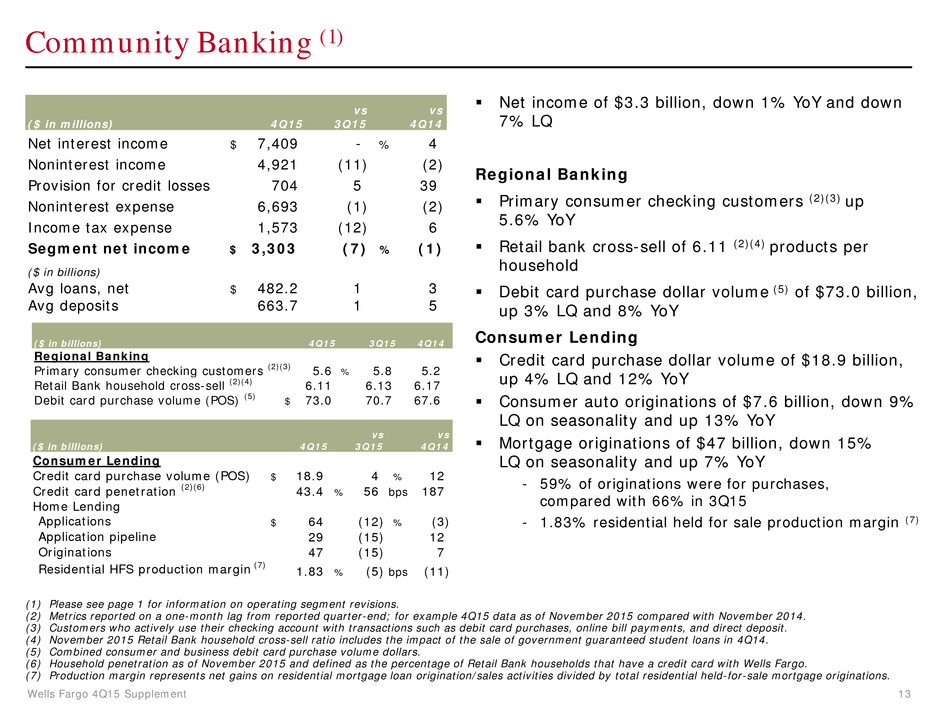
Wells Fargo 4Q15 Supplement 13 Community Banking (1) Net income of $3.3 billion, down 1% YoY and down 7% LQ Regional Banking Primary consumer checking customers (2)(3) up 5.6% YoY Retail bank cross-sell of 6.11 (2)(4) products per household Debit card purchase dollar volume (5) of $73.0 billion, up 3% LQ and 8% YoY Consumer Lending Credit card purchase dollar volume of $18.9 billion, up 4% LQ and 12% YoY Consumer auto originations of $7.6 billion, down 9% LQ on seasonality and up 13% YoY Mortgage originations of $47 billion, down 15% LQ on seasonality and up 7% YoY - 59% of originations were for purchases, compared with 66% in 3Q15 - 1.83% residential held for sale production margin (7) (1) Please see page 1 for information on operating segment revisions. (2) Metrics reported on a one-month lag from reported quarter-end; for example 4Q15 data as of November 2015 compared with November 2014. (3) Customers who actively use their checking account with transactions such as debit card purchases, online bill payments, and direct deposit. (4) November 2015 Retail Bank household cross-sell ratio includes the impact of the sale of government guaranteed student loans in 4Q14. (5) Combined consumer and business debit card purchase volume dollars. (6) Household penetration as of November 2015 and defined as the percentage of Retail Bank households that have a credit card with Wells Fargo. (7) Production margin represents net gains on residential mortgage loan origination/sales activities divided by total residential held-for-sale mortgage originations. vs vs ($ in millions) 4Q15 3Q15 4Q14 Net interest income $ 7,409 - % 4 Noninterest income 4,921 (11) (2) Provision for credit losses 704 5 39 Noninterest expense 6,693 (1) (2) Income tax expense 1,573 (12) 6 Segment net income $ 3,303 (7) % (1) ($ in billions) Avg loans, net $ 482.2 1 3 Avg deposits 663.7 1 5 ($ in billions) 4Q15 3Q15 4Q14 Regional Banking Primary consumer checking customers (2)(3) 5.6 % 5.8 5.2 Retail Bank household cross-sell (2)(4) 6.11 6.13 6.17 Debit card purchase volume (POS) (5) $ 73.0 70.7 67.6 vs vs ($ in billions) 4Q15 3Q15 4Q14 Consumer Lending Credit card purchase volume (POS) $ 18.9 4 % 12 Credit card penetration (2)(6) 43.4 % 56 bps 187 Home Lending Applications $ 64 (12) % (3) Application pipeline 29 (15) 12 Originations 47 (15) 7 Residential HFS production margin (7) 1.83 % (5) bps (11)
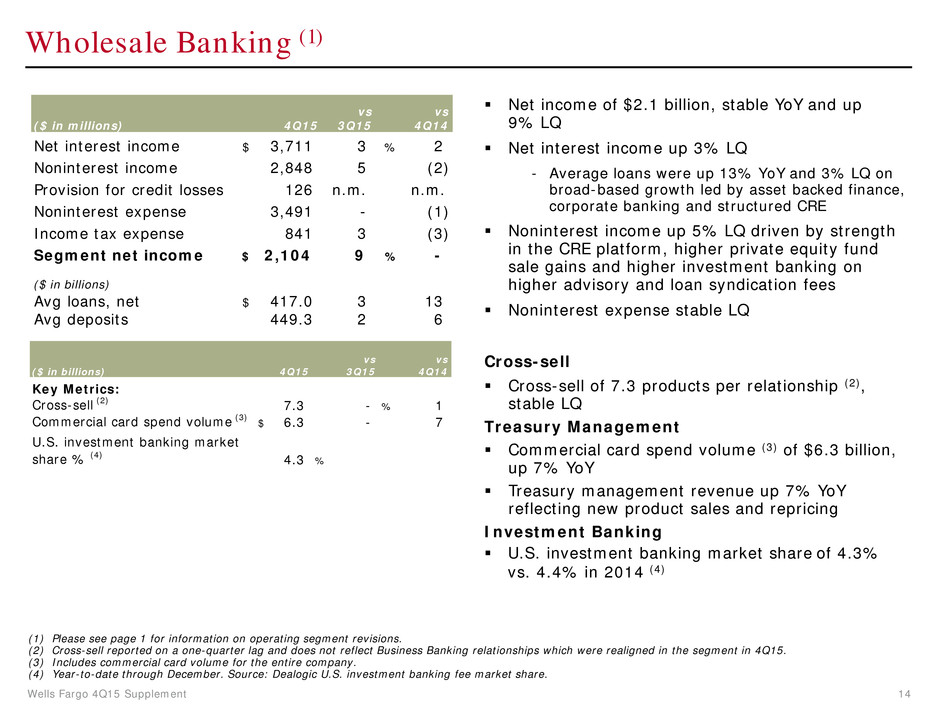
Wells Fargo 4Q15 Supplement 14 Wholesale Banking (1) Net income of $2.1 billion, stable YoY and up 9% LQ Net interest income up 3% LQ - Average loans were up 13% YoY and 3% LQ on broad-based growth led by asset backed finance, corporate banking and structured CRE Noninterest income up 5% LQ driven by strength in the CRE platform, higher private equity fund sale gains and higher investment banking on higher advisory and loan syndication fees Noninterest expense stable LQ Cross-sell Cross-sell of 7.3 products per relationship (2), stable LQ Treasury Management Commercial card spend volume (3) of $6.3 billion, up 7% YoY Treasury management revenue up 7% YoY reflecting new product sales and repricing Investment Banking U.S. investment banking market share of 4.3% vs. 4.4% in 2014 (4) (1) Please see page 1 for information on operating segment revisions. (2) Cross-sell reported on a one-quarter lag and does not reflect Business Banking relationships which were realigned in the segment in 4Q15. (3) Includes commercial card volume for the entire company. (4) Year-to-date through December. Source: Dealogic U.S. investment banking fee market share. vs vs ($ in millions) 4Q15 3Q15 4Q14 Net interest income $ 3,711 3 % 2 Noninterest income 2,848 5 (2) Provision for credit losses 126 n.m. n.m. Noninterest expense 3,491 - (1) Income tax expense 841 3 (3) Segment net income $ 2,104 9 % - ($ in billions) Avg loans, net $ 417.0 3 13 Avg deposits 449.3 2 6 vs vs ($ in billions) 4Q15 3Q15 4Q14 Key Metrics: Cross-sell (2) 7.3 - % 1 Commercial card spend volume (3) $ 6.3 - 7 U.S. investment banking market share % (4) 4.3 %
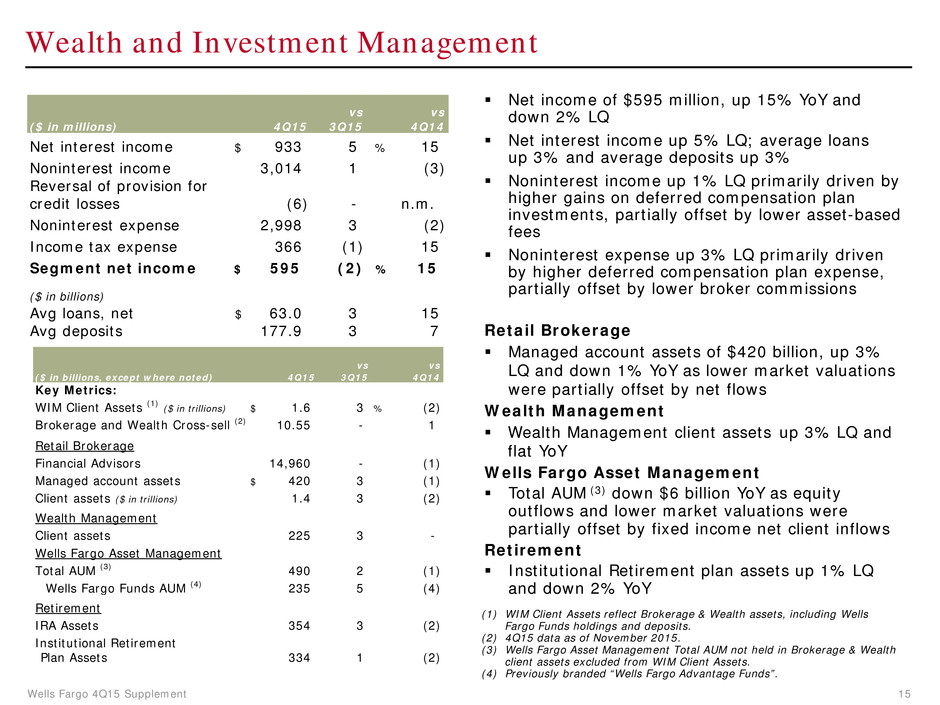
Wells Fargo 4Q15 Supplement 15 Wealth and Investment Management Net income of $595 million, up 15% YoY and down 2% LQ Net interest income up 5% LQ; average loans up 3% and average deposits up 3% Noninterest income up 1% LQ primarily driven by higher gains on deferred compensation plan investments, partially offset by lower asset-based fees Noninterest expense up 3% LQ primarily driven by higher deferred compensation plan expense, partially offset by lower broker commissions Retail Brokerage Managed account assets of $420 billion, up 3% LQ and down 1% YoY as lower market valuations were partially offset by net flows Wealth Management Wealth Management client assets up 3% LQ and flat YoY Wells Fargo Asset Management Total AUM (3) down $6 billion YoY as equity outflows and lower market valuations were partially offset by fixed income net client inflows Retirement Institutional Retirement plan assets up 1% LQ and down 2% YoY (1) WIM Client Assets reflect Brokerage & Wealth assets, including Wells Fargo Funds holdings and deposits. (2) 4Q15 data as of November 2015. (3) Wells Fargo Asset Management Total AUM not held in Brokerage & Wealth client assets excluded from WIM Client Assets. (4) Previously branded “Wells Fargo Advantage Funds”. vs vs ($ in millions) 4Q15 3Q15 4Q14 Net interest income $ 933 5 % 15 Noninterest income 3,014 1 (3) Reversal of provision for credit losses (6) - n.m. Noninterest expense 2,998 3 (2) Income tax expense 366 (1) 15 Segment net income $ 595 (2) % 15 ($ in billions) Avg loans, net $ 63.0 3 15 Avg deposits 177.9 3 7 vs vs ($ in billions, except where noted) 4Q15 3Q15 4Q14 Key Metrics: WIM Client Assets (1) ($ in trillions) $ 1.6 3 % (2) Brokerage and Wealth Cross-sell (2) 10.55 - 1 Retail Brokerage Financial Advisors 14,960 - (1) Managed account assets $ 420 3 (1) Client assets ($ in trillions) 1.4 3 (2) Wealth Management Client assets 225 3 - Wells Fargo Asset Management Total AUM (3) 490 2 (1) Wells Fargo Funds AUM (4) 235 5 (4) Retirement IRA Assets 354 3 (2) Institutional Retirement Plan Assets 334 1 (2)
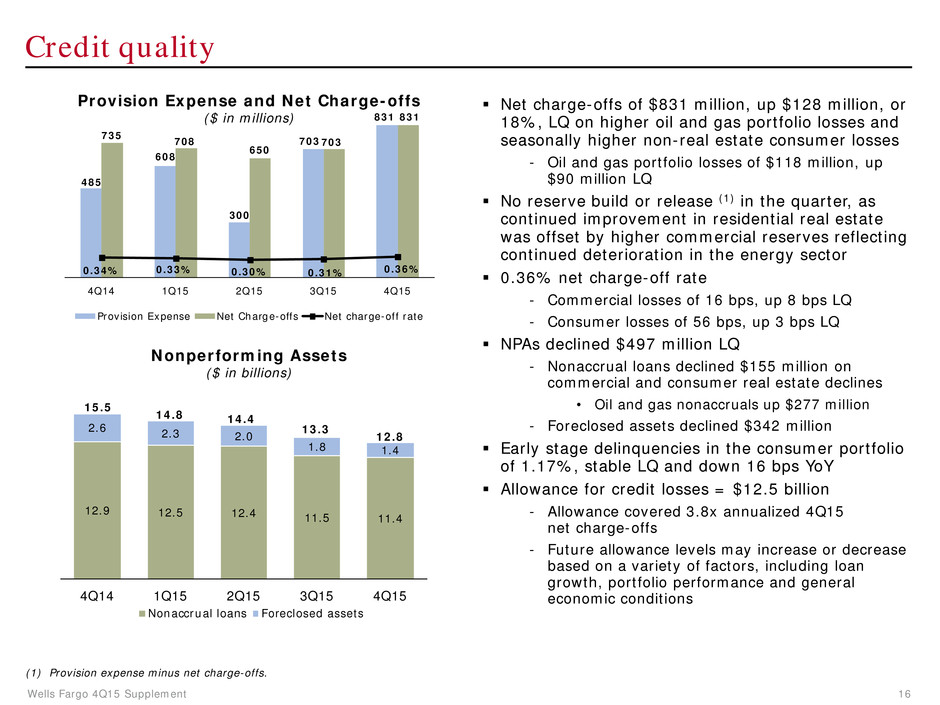
Wells Fargo 4Q15 Supplement 16 Credit quality Net charge-offs of $831 million, up $128 million, or 18%, LQ on higher oil and gas portfolio losses and seasonally higher non-real estate consumer losses - Oil and gas portfolio losses of $118 million, up $90 million LQ No reserve build or release (1) in the quarter, as continued improvement in residential real estate was offset by higher commercial reserves reflecting continued deterioration in the energy sector 0.36% net charge-off rate - Commercial losses of 16 bps, up 8 bps LQ - Consumer losses of 56 bps, up 3 bps LQ NPAs declined $497 million LQ - Nonaccrual loans declined $155 million on commercial and consumer real estate declines • Oil and gas nonaccruals up $277 million - Foreclosed assets declined $342 million Early stage delinquencies in the consumer portfolio of 1.17%, stable LQ and down 16 bps YoY Allowance for credit losses = $12.5 billion - Allowance covered 3.8x annualized 4Q15 net charge-offs - Future allowance levels may increase or decrease based on a variety of factors, including loan growth, portfolio performance and general economic conditions (1) Provision expense minus net charge-offs. Provision Expense and Net Charge-offs ($ in millions) Nonperforming Assets ($ in billions) 12.9 12.5 12.4 11.5 11.4 2.6 2.3 2.0 1.8 1.4 15.5 14.8 14.4 13.3 12.8 4Q14 1Q15 2Q15 3Q15 4Q15 Nonaccrual loans Foreclosed assets 485 608 300 703 831 735 708 650 703 831 0.34% 0.33% 0.30% 0.31% 0.36% 4Q14 1Q15 2Q15 3Q15 4Q15 Provision Expense Net Charge-offs Net charge-off rate
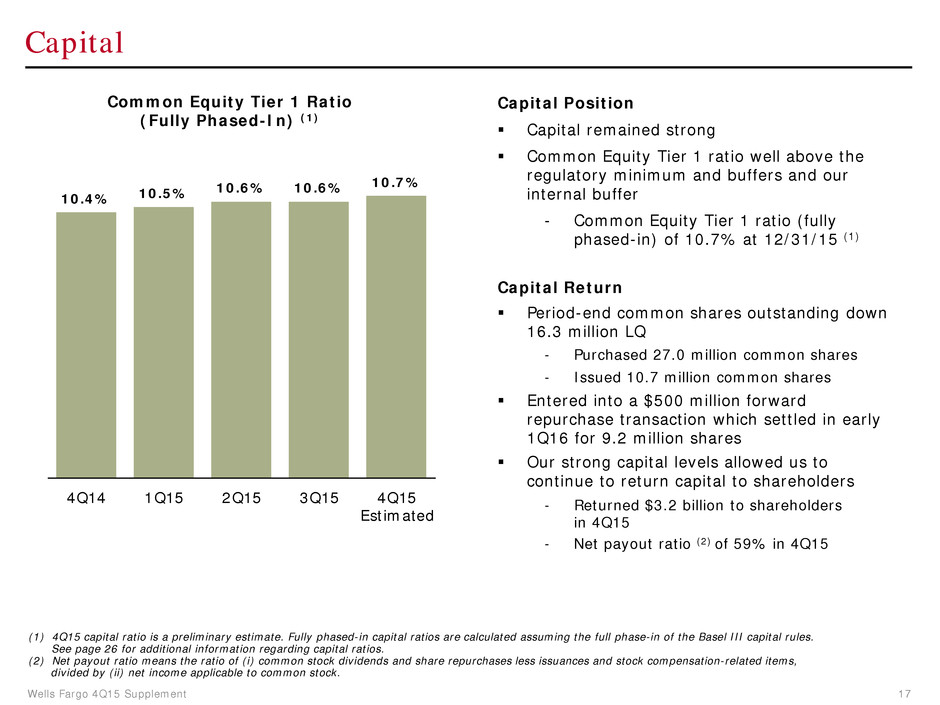
Wells Fargo 4Q15 Supplement 17 Capital Position Capital remained strong Common Equity Tier 1 ratio well above the regulatory minimum and buffers and our internal buffer - Common Equity Tier 1 ratio (fully phased-in) of 10.7% at 12/31/15 (1) Capital Return Period-end common shares outstanding down 16.3 million LQ - Purchased 27.0 million common shares - Issued 10.7 million common shares Entered into a $500 million forward repurchase transaction which settled in early 1Q16 for 9.2 million shares Our strong capital levels allowed us to continue to return capital to shareholders - Returned $3.2 billion to shareholders in 4Q15 - Net payout ratio (2) of 59% in 4Q15 Capital (1) 4Q15 capital ratio is a preliminary estimate. Fully phased-in capital ratios are calculated assuming the full phase-in of the Basel III capital rules. See page 26 for additional information regarding capital ratios. (2) Net payout ratio means the ratio of (i) common stock dividends and share repurchases less issuances and stock compensation-related items, divided by (ii) net income applicable to common stock. 10.4% 10.5% 10.6% 10.6% 10.7% 4Q14 1Q15 2Q15 3Q15 4Q15 Estimated Common Equity Tier 1 Ratio (Fully Phased-In) (1)
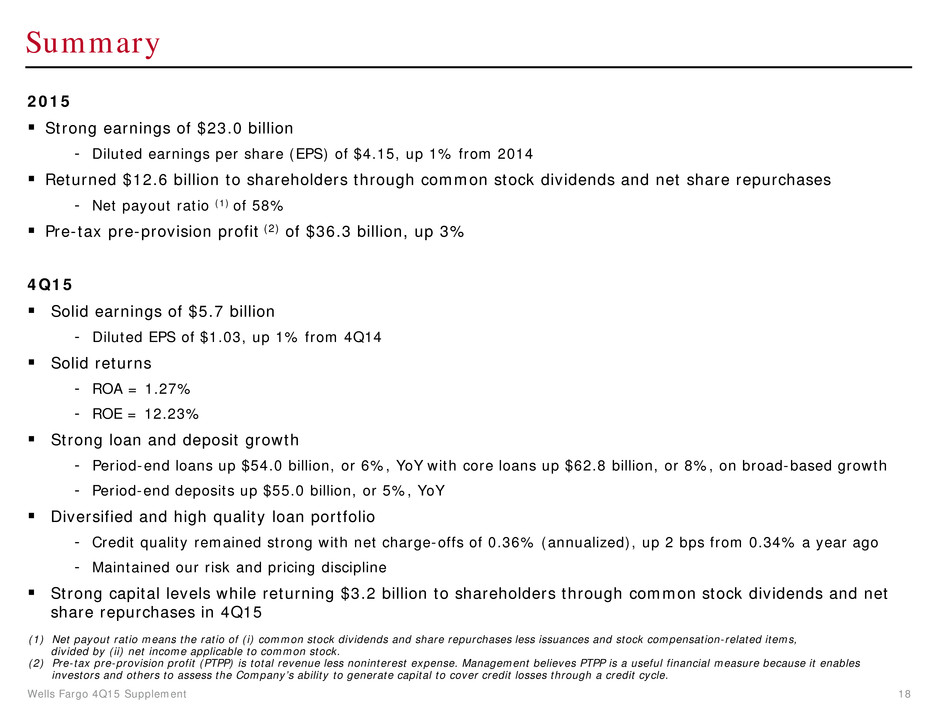
Wells Fargo 4Q15 Supplement 18 Summary 2015 Strong earnings of $23.0 billion - Diluted earnings per share (EPS) of $4.15, up 1% from 2014 Returned $12.6 billion to shareholders through common stock dividends and net share repurchases - Net payout ratio (1) of 58% Pre-tax pre-provision profit (2) of $36.3 billion, up 3% 4Q15 Solid earnings of $5.7 billion - Diluted EPS of $1.03, up 1% from 4Q14 Solid returns - ROA = 1.27% - ROE = 12.23% Strong loan and deposit growth - Period-end loans up $54.0 billion, or 6%, YoY with core loans up $62.8 billion, or 8%, on broad-based growth - Period-end deposits up $55.0 billion, or 5%, YoY Diversified and high quality loan portfolio - Credit quality remained strong with net charge-offs of 0.36% (annualized), up 2 bps from 0.34% a year ago - Maintained our risk and pricing discipline Strong capital levels while returning $3.2 billion to shareholders through common stock dividends and net share repurchases in 4Q15 (1) Net payout ratio means the ratio of (i) common stock dividends and share repurchases less issuances and stock compensation-related items, divided by (ii) net income applicable to common stock. (2) Pre-tax pre-provision profit (PTPP) is total revenue less noninterest expense. Management believes PTPP is a useful financial measure because it enables investors and others to assess the Company’s ability to generate capital to cover credit losses through a credit cycle.

Appendix
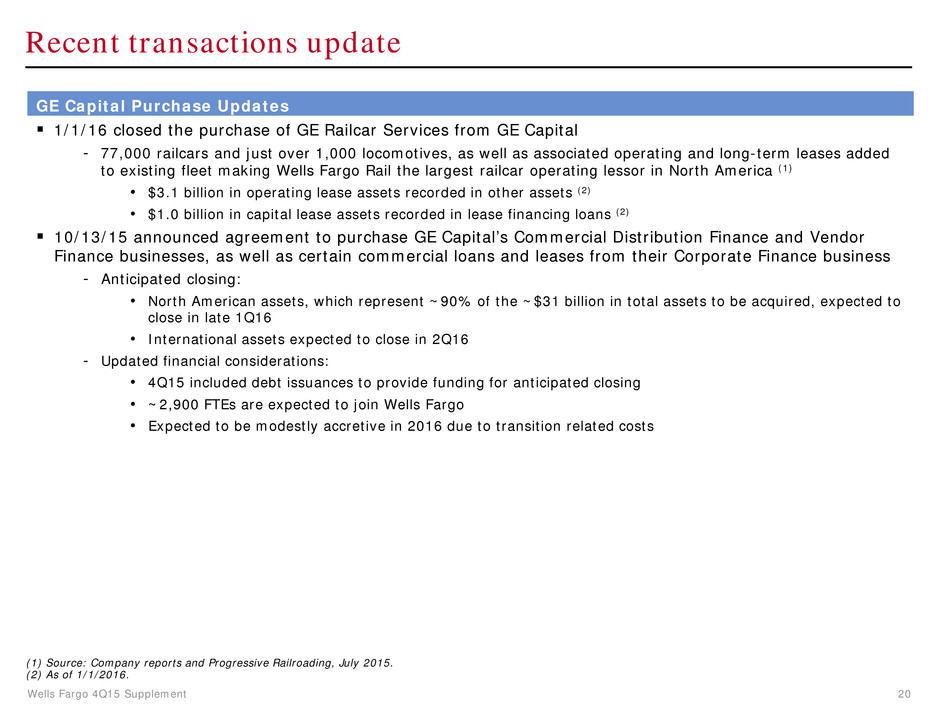
Wells Fargo 4Q15 Supplement 20 Recent transactions update GE Capital Purchase Updates 1/1/16 closed the purchase of GE Railcar Services from GE Capital - 77,000 railcars and just over 1,000 locomotives, as well as associated operating and long-term leases added to existing fleet making Wells Fargo Rail the largest railcar operating lessor in North America (1) • $3.1 billion in operating lease assets recorded in other assets (2) • $1.0 billion in capital lease assets recorded in lease financing loans (2) 10/13/15 announced agreement to purchase GE Capital’s Commercial Distribution Finance and Vendor Finance businesses, as well as certain commercial loans and leases from their Corporate Finance business - Anticipated closing: • North American assets, which represent ~90% of the ~$31 billion in total assets to be acquired, expected to close in late 1Q16 • International assets expected to close in 2Q16 - Updated financial considerations: • 4Q15 included debt issuances to provide funding for anticipated closing • ~2,900 FTEs are expected to join Wells Fargo • Expected to be modestly accretive in 2016 due to transition related costs (1) Source: Company reports and Progressive Railroading, July 2015. (2) As of 1/1/2016.
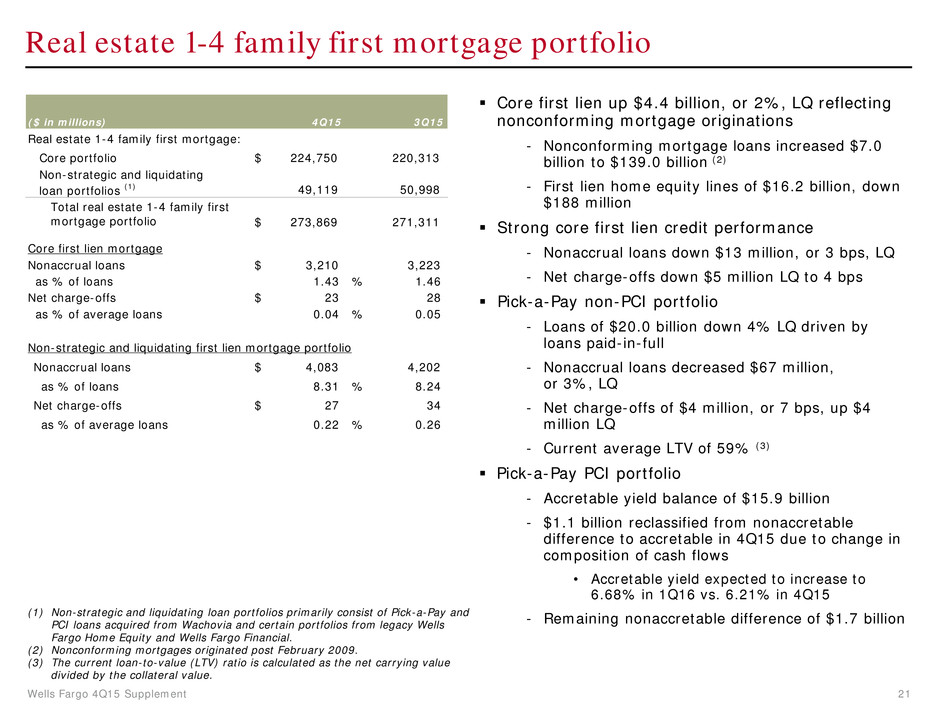
Wells Fargo 4Q15 Supplement 21 Real estate 1-4 family first mortgage portfolio Core first lien up $4.4 billion, or 2%, LQ reflecting nonconforming mortgage originations - Nonconforming mortgage loans increased $7.0 billion to $139.0 billion (2) - First lien home equity lines of $16.2 billion, down $188 million Strong core first lien credit performance - Nonaccrual loans down $13 million, or 3 bps, LQ - Net charge-offs down $5 million LQ to 4 bps Pick-a-Pay non-PCI portfolio - Loans of $20.0 billion down 4% LQ driven by loans paid-in-full - Nonaccrual loans decreased $67 million, or 3%, LQ - Net charge-offs of $4 million, or 7 bps, up $4 million LQ - Current average LTV of 59% (3) Pick-a-Pay PCI portfolio - Accretable yield balance of $15.9 billion - $1.1 billion reclassified from nonaccretable difference to accretable in 4Q15 due to change in composition of cash flows • Accretable yield expected to increase to 6.68% in 1Q16 vs. 6.21% in 4Q15 - Remaining nonaccretable difference of $1.7 billion (1) Non-strategic and liquidating loan portfolios primarily consist of Pick-a-Pay and PCI loans acquired from Wachovia and certain portfolios from legacy Wells Fargo Home Equity and Wells Fargo Financial. (2) Nonconforming mortgages originated post February 2009. (3) The current loan-to-value (LTV) ratio is calculated as the net carrying value divided by the collateral value. ($ in millions) 4Q15 3Q15 Real estate 1-4 family first mortgage: Core portfolio $ 224,750 220,313 Non-strategic and liquidating loan portfolios (1) 49,119 50,998 Total real estate 1-4 family first mortgage portfolio $ 273,869 271,311 Nonaccrual loans $ 3,210 3,223 as % of loans 1.43 % 1.46 Net charge-offs $ 23 28 as % of average loans 0.04 % 0.05 Nonaccrual loans $ 4,083 4,202 as % of loans 8.31 % 8.24 Net charge-offs $ 27 34 as % of average loans 0.22 % 0.26 Core first lien mortgage Non-strategic and liquidating first lien mortgage portfolio
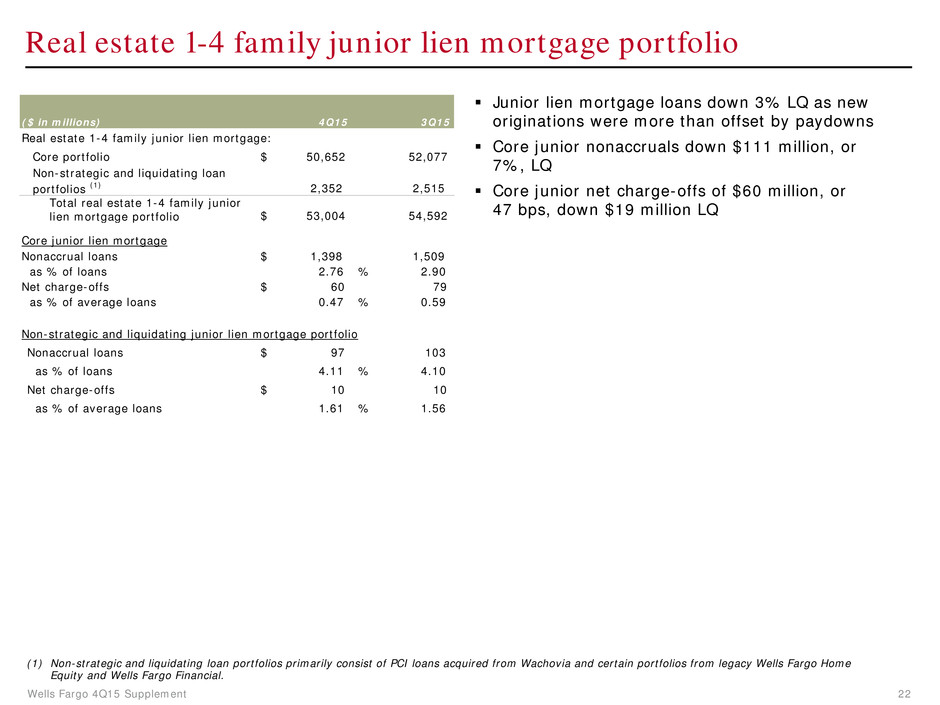
Wells Fargo 4Q15 Supplement 22 Real estate 1-4 family junior lien mortgage portfolio Junior lien mortgage loans down 3% LQ as new originations were more than offset by paydowns Core junior nonaccruals down $111 million, or 7%, LQ Core junior net charge-offs of $60 million, or 47 bps, down $19 million LQ (1) Non-strategic and liquidating loan portfolios primarily consist of PCI loans acquired from Wachovia and certain portfolios from legacy Wells Fargo Home Equity and Wells Fargo Financial. ($ in millions) 4Q15 3Q15 Core portfolio $ 50,652 52,077 Non-strategic and liquidating loan portfolios (1) 2,352 2,515 Total real estate 1-4 family junior lien mortgage portfolio $ 53,004 54,592 Nonaccrual loans $ 1,398 1,509 as % of loans 2.76 % 2.90 Net charge-offs $ 60 79 as % of average loans 0.47 % 0.59 Nonaccrual loans $ 97 103 as % of loans 4.11 % 4.10 Net charge-offs $ 10 10 as % of average loans 1.61 % 1.56 Core junior lien mortgage Non-strategic and liquidating junior lien mortgage portfolio Real estate 1-4 family junior lien mortgage:
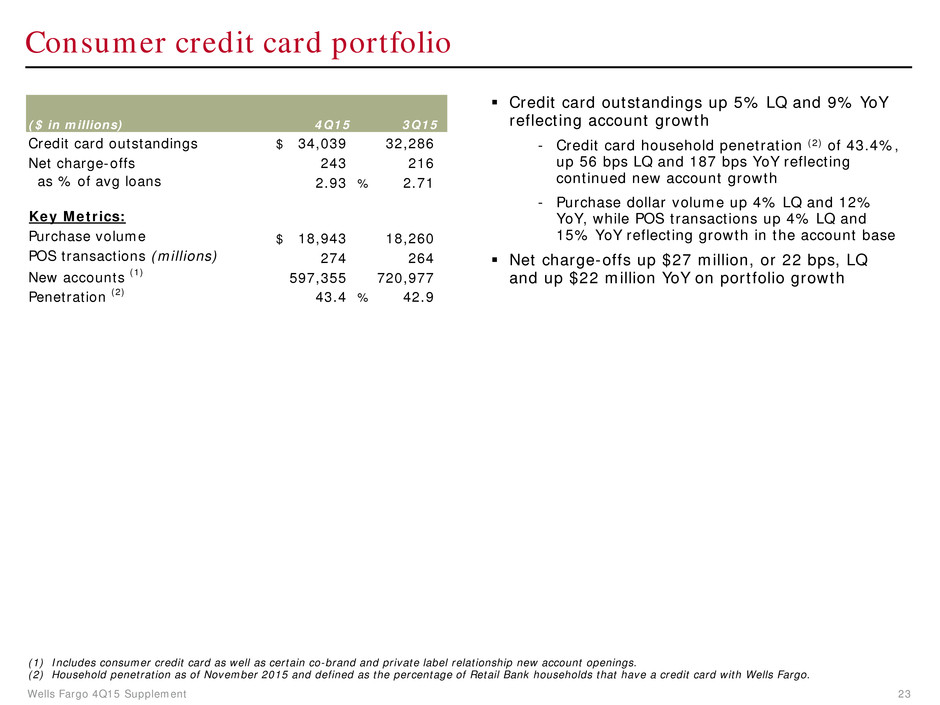
Wells Fargo 4Q15 Supplement 23 Consumer credit card portfolio Credit card outstandings up 5% LQ and 9% YoY reflecting account growth - Credit card household penetration (2) of 43.4%, up 56 bps LQ and 187 bps YoY reflecting continued new account growth - Purchase dollar volume up 4% LQ and 12% YoY, while POS transactions up 4% LQ and 15% YoY reflecting growth in the account base Net charge-offs up $27 million, or 22 bps, LQ and up $22 million YoY on portfolio growth (1) Includes consumer credit card as well as certain co-brand and private label relationship new account openings. (2) Household penetration as of November 2015 and defined as the percentage of Retail Bank households that have a credit card with Wells Fargo. ($ in millions) 4Q15 3Q15 Credit card outstandings $ 34,039 32,286 Net charge-offs 243 216 as % of avg loans 2.93 % 2.71 Key Metrics: Purchase volume $ 18,943 18,260 POS transactions (millions) 274 264 New accounts (1) 597,355 720,977 Penetration (2) 43.4 % 42.9
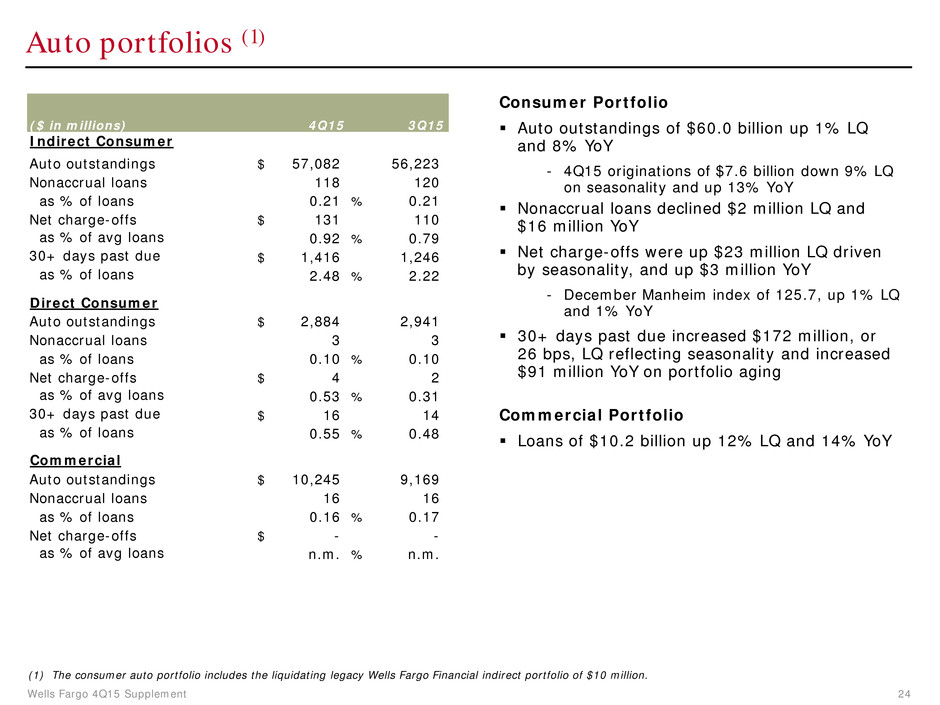
Wells Fargo 4Q15 Supplement 24 Auto portfolios (1) Consumer Portfolio Auto outstandings of $60.0 billion up 1% LQ and 8% YoY - 4Q15 originations of $7.6 billion down 9% LQ on seasonality and up 13% YoY Nonaccrual loans declined $2 million LQ and $16 million YoY Net charge-offs were up $23 million LQ driven by seasonality, and up $3 million YoY - December Manheim index of 125.7, up 1% LQ and 1% YoY 30+ days past due increased $172 million, or 26 bps, LQ reflecting seasonality and increased $91 million YoY on portfolio aging Commercial Portfolio Loans of $10.2 billion up 12% LQ and 14% YoY (1) The consumer auto portfolio includes the liquidating legacy Wells Fargo Financial indirect portfolio of $10 million. ($ in millions) 4Q15 3Q15 Auto outstandings $ 57,082 56,223 Nonaccrual loans 118 120 as % of loans 0.21 % 0.21 Net charge-offs $ 131 110 as % of avg loans 0.92 % 0.79 30+ days past due $ 1,416 1,246 as % of loans 2.48 % 2.22 Auto outstandings $ 2,884 2,941 Nonaccrual loans 3 3 as % of loans 0.10 % 0.10 Net charge-offs $ 4 2 as % of avg loans 0.53 % 0.31 30+ days past due $ 16 14 as % of loans 0.55 % 0.48 Commercial Auto outstandings $ 10,245 9,169 Nonaccrual loans 16 16 as % of loans 0.16 % 0.17 Net charge-offs $ - - as % of avg loans n.m. % n.m. Indirect Consumer Direct Consumer
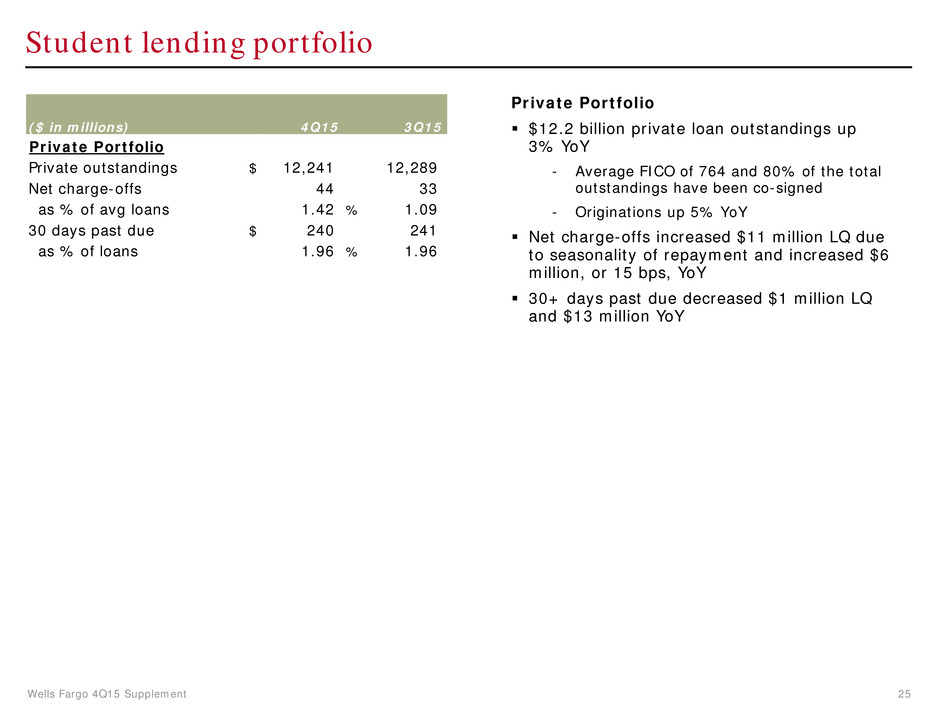
Wells Fargo 4Q15 Supplement 25 Student lending portfolio Private Portfolio $12.2 billion private loan outstandings up 3% YoY - Average FICO of 764 and 80% of the total outstandings have been co-signed - Originations up 5% YoY Net charge-offs increased $11 million LQ due to seasonality of repayment and increased $6 million, or 15 bps, YoY 30+ days past due decreased $1 million LQ and $13 million YoY ($ in millions) 4Q15 3Q15 Private Portfolio Private outstandings $ 12,241 12,289 Net charge-offs 44 33 as % of avg loans 1.42 % 1.09 30 days past due $ 240 241 as % of loans 1.96 % 1.96
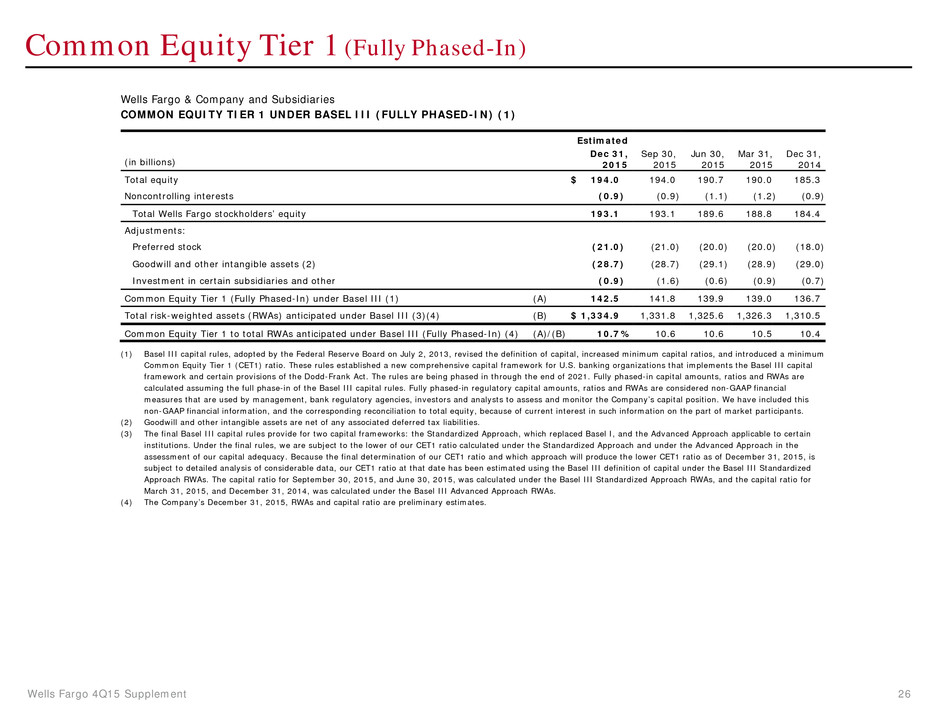
Wells Fargo 4Q15 Supplement 26 Common Equity Tier 1 (Fully Phased-In) Wells Fargo & Company and Subsidiaries COMMON EQUITY TIER 1 UNDER BASEL III (FULLY PHASED-IN) (1) Estimated (in billions) Dec 31, 2015 Sep 30, 2015 Jun 30, 2015 Mar 31, 2015 Dec 31, 2014 Total equity $ 194.0 194.0 190.7 190.0 185.3 Noncontrolling interests (0.9 ) (0.9 ) (1.1 ) (1.2 ) (0.9 ) Total Wells Fargo stockholders’ equity 193.1 193.1 189.6 188.8 184.4 Adjustments: Preferred stock (21.0 ) (21.0 ) (20.0 ) (20.0 ) (18.0 ) Goodwill and other intangible assets (2) (28.7 ) (28.7 ) (29.1 ) (28.9 ) (29.0 ) Investment in certain subsidiaries and other (0.9 ) (1.6 ) (0.6 ) (0.9 ) (0.7 ) Common Equity Tier 1 (Fully Phased-In) under Basel III (1) (A) 142.5 141.8 139.9 139.0 136.7 Total risk-weighted assets (RWAs) anticipated under Basel III (3)(4) (B) $ 1,334.9 1,331.8 1,325.6 1,326.3 1,310.5 Common Equity Tier 1 to total RWAs anticipated under Basel III (Fully Phased-In) (4) (A)/(B) 10.7 % 10.6 10.6 10.5 10.4 (1) Basel III capital rules, adopted by the Federal Reserve Board on July 2, 2013, revised the definition of capital, increased minimum capital ratios, and introduced a minimum Common Equity Tier 1 (CET1) ratio. These rules established a new comprehensive capital framework for U.S. banking organizations that implements the Basel III capital framework and certain provisions of the Dodd-Frank Act. The rules are being phased in through the end of 2021. Fully phased-in capital amounts, ratios and RWAs are calculated assuming the full phase-in of the Basel III capital rules. Fully phased-in regulatory capital amounts, ratios and RWAs are considered non-GAAP financial measures that are used by management, bank regulatory agencies, investors and analysts to assess and monitor the Company’s capital position. We have included this non-GAAP financial information, and the corresponding reconciliation to total equity, because of current interest in such information on the part of market participants. (2) Goodwill and other intangible assets are net of any associated deferred tax liabilities. (3) The final Basel III capital rules provide for two capital frameworks: the Standardized Approach, which replaced Basel I, and the Advanced Approach applicable to certain institutions. Under the final rules, we are subject to the lower of our CET1 ratio calculated under the Standardized Approach and under the Advanced Approach in the assessment of our capital adequacy. Because the final determination of our CET1 ratio and which approach will produce the lower CET1 ratio as of December 31, 2015, is subject to detailed analysis of considerable data, our CET1 ratio at that date has been estimated using the Basel III definition of capital under the Basel III Standardized Approach RWAs. The capital ratio for September 30, 2015, and June 30, 2015, was calculated under the Basel III Standardized Approach RWAs, and the capital ratio for March 31, 2015, and December 31, 2014, was calculated under the Basel III Advanced Approach RWAs. (4) The Company’s December 31, 2015, RWAs and capital ratio are preliminary estimates.
Wells Fargo 4Q15 Supplement 27 Forward-looking statements and additional information Forward-looking statements: This document contains “forward-looking statements” within the meaning of the Private Securities Litigation Reform Act of 1995. In addition, we may make forward-looking statements in our other documents filed or furnished with the SEC, and our management may make forward- looking statements orally to analysts, investors, representatives of the media and others. Forward-looking statements can be identified by words such as “anticipates,” “intends,” “plans,” “seeks,” “believes,” “estimates,” “expects,” “target,” “projects,” “outlook,” “forecast,” “will,” “may,” “could,” “should,” “can” and similar references to future periods. In particular, forward-looking statements include, but are not limited to, statements we make about: (i) the future operating or financial performance of the Company, including our outlook for future growth; (ii) our noninterest expense and efficiency ratio; (iii) future credit quality and performance, including our expectations regarding future loan losses and allowance levels; (iv) the appropriateness of the allowance for credit losses; (v) our expectations regarding net interest income and net interest margin; (vi) loan growth or the reduction or mitigation of risk in our loan portfolios; (vii) future capital levels or targets and our estimated Common Equity Tier 1 ratio under Basel III capital standards; (viii) the performance of our mortgage business and any related exposures; (ix) the expected outcome and impact of legal, regulatory and legislative developments, as well as our expectations regarding compliance therewith; (x) future common stock dividends, common share repurchases and other uses of capital; (xi) our targeted range for return on assets and return on equity; (xii) the outcome of contingencies, such as legal proceedings; and (xiii) the Company’s plans, objectives and strategies. Forward-looking statements are not based on historical facts but instead represent our current expectations and assumptions regarding our business, the economy and other future conditions. Investors are urged to not unduly rely on forward-looking statements as actual results could differ materially from expectations. Forward-looking statements speak only as of the date made, and we do not undertake to update them to reflect changes or events that occur after that date. For more information about factors that could cause actual results to differ materially from expectations, refer to the “Forward-Looking Statements” discussion in Wells Fargo’s press release announcing our fourth quarter 2015 results and in our most recent Quarterly Report on Form 10-Q, as well as to Wells Fargo’s other reports filed with the Securities and Exchange Commission, including the discussion under “Risk Factors” in our Annual Report on Form 10-K for the year ended December 31, 2014. Purchased credit-impaired loan portfolio: Loans that were acquired from Wachovia that were considered credit impaired were written down at acquisition date in purchase accounting to an amount estimated to be collectible and the related allowance for loan losses was not carried over to Wells Fargo’s allowance. In addition, such purchased credit-impaired loans are not classified as nonaccrual or nonperforming, and are not included in loans that were contractually 90+ days past due and still accruing. Any losses on such loans are charged against the nonaccretable difference established in purchase accounting and are not reported as charge-offs (until such difference is fully utilized). As a result of accounting for purchased loans with evidence of credit deterioration, certain ratios of the combined company are not comparable to a portfolio that does not include purchased credit-impaired loans. In certain cases, the purchased credit-impaired loans may affect portfolio credit ratios and trends. Management believes that the presentation of information adjusted to exclude the purchased credit-impaired loans provides useful disclosure regarding the credit quality of the non-impaired loan portfolio. Accordingly, certain of the loan balances and credit ratios in this document have been adjusted to exclude the purchased credit-impaired loans. References in this document to impaired loans mean the purchased credit-impaired loans. Please see page 31 of the press release announcing our 4Q15 results for additional information regarding the purchased credit-impaired loans.
