Attached files
| file | filename |
|---|---|
| 8-K - 8-K - AgroFresh Solutions, Inc. | a16-1825_18k.htm |
Exhibit 99.1
AgroFresh Solutions Investor Presentation January 2016
In addition to historical information, this presentation may contain “forward-looking statements” within the meaning of the “safe harbor” provisions of the United States Private Securities Litigation Reform Act of 1995. All statements, other than statements of historical facts, included in this presentation that address activities, events or developments that the Company expects or anticipates will or may occur in the future are forward-looking statements and are identified with, but not limited to, words such as “anticipate”, “believe”, “expect”, “estimate”, “plan”, “outlook”, and “project” and other similar expressions (or the negative versions of such words or expressions). Forward-looking statements include, without limitation, information concerning the Company’s possible or assumed future results of operations, including all statements regarding anticipated future growth, business strategies, competitive position, industry environment, potential growth opportunities and the effects of regulation. These statements are based on management’s current expectations and beliefs, as well as a number of assumptions concerning future events. Such forward-looking statements are subject to known and unknown risks, uncertainties, assumptions and other important factors, many of which are outside the Company’s management’s control that could cause actual results to differ materially from the results discussed in the forward-looking statements. These risks include, without limitation, the risk that the Company’s transaction with The Dow Chemical Company (“Dow”) consummated on July 31, 2015 (the “Business Combination”) disrupts current plans and operations; the Company’s ability to recognize the anticipated benefits of the Business Combination, which may be affected by, among other things, competition and the ability of the combined business to grow and manage growth profitably; costs related to the Business Combination and/or related to operating AgroFresh as a stand-alone public company; changes in applicable laws or regulations, and the possibility that the Company may be adversely affected by other economic, business, and/or competitive factors. Additional risks and uncertainties are identified and discussed in the Company’s filings with the SEC, including the Quarterly Report on Form 10-Q filed on November 16, 2015, available at the SEC’s website at www.sec.gov. As a result of the Business Combination, the Company was identified as the acquirer for accounting purposes, and the AgroFresh Business, which is the business conducted prior to the closing of the Business Combination by Dow through a combination of wholly-owned subsidiaries and operations of Dow, including through AgroFresh Inc. in the United States, is the acquiree and accounting Predecessor. The Company’s financial statement presentation reflects the AgroFresh Business as the “Predecessor” for periods through July 31, 2015 (the “Closing Date”). Where we discuss results for the period ended September 30, 2015, we are referring to the combined results of the Predecessor for the month ending July 31, 2015 and the Successor for the two months ending September 30, 2015. On the Closing Date, the Company, which was formerly named Boulevard Acquisition Corp., was re-named AgroFresh Solutions, Inc. and is the “Successor” for periods after the Closing Date, which includes consolidation of the AgroFresh Business subsequent to the Closing Date. The acquisition was accounted for as a business combination using the acquisition method of accounting, and the Successor financial statements reflect a new basis of accounting that is based on the fair value of net assets acquired. As a result of the application of the acquisition method of accounting as of the effective time of the Business Combination, the financial statements for the Predecessor period and for the Successor period are presented on different bases. The historical financial information of Boulevard Acquisition Corp. prior to the Business Combination has not been reflected in the Predecessor period financial statements as those amounts are not considered to be material. This presentation contains certain financial measures, in particular non-GAAP earnings per share Adjusted EBITDA, Constant Currency Adjusted EBITDA and Constant Currency Net Sales, which are not presented in accordance with GAAP. These non-GAAP financial measures are being presented because the Company believes these non-GAAP financial measures provide meaningful supplemental information as they are used by the Company’s management to evaluate the Company’s performance, seen as likely to enhance a reader’s understanding of the financial performance of the Company, are more indicative of operating performance of the Company, and facilitate a better comparison among fiscal periods, as the non-GAAP measures exclude items that are not considered core to the Company’s operations. In particular, Adjusted EBITDA is a key measure used by the Company to evaluate its performance, and is calculated by the Company in a manner consistent with the definition of Consolidated EBITDA in the Company’s Credit Agreement. The Company does not intend for any of the non-GAAP financial measures contained in this presentation to be a substitute for any GAAP financial information. Readers of this presentation should use these non-GAAP financial measures only in conjunction with the comparable GAAP financial measures. Reconciliations of non-GAAP financial measures to the most comparable GAAP measures are provided in the tables at the end of this presentation. Safe Harbor January 2016
AgroFresh Investment Highlights Global industry leader in preserving and enhancing the quality and freshness of food from farm to fork Growth story – increases food productivity, minimizing waste and benefits from favorable global demographic trends Unique, sustainable business model – proven solution with attractive ROI for customers Established track record of execution – well-run operations and experienced management team Strong margins and cash flows – from service, technology and expertise January 2016
AgroFresh Overview January 2016
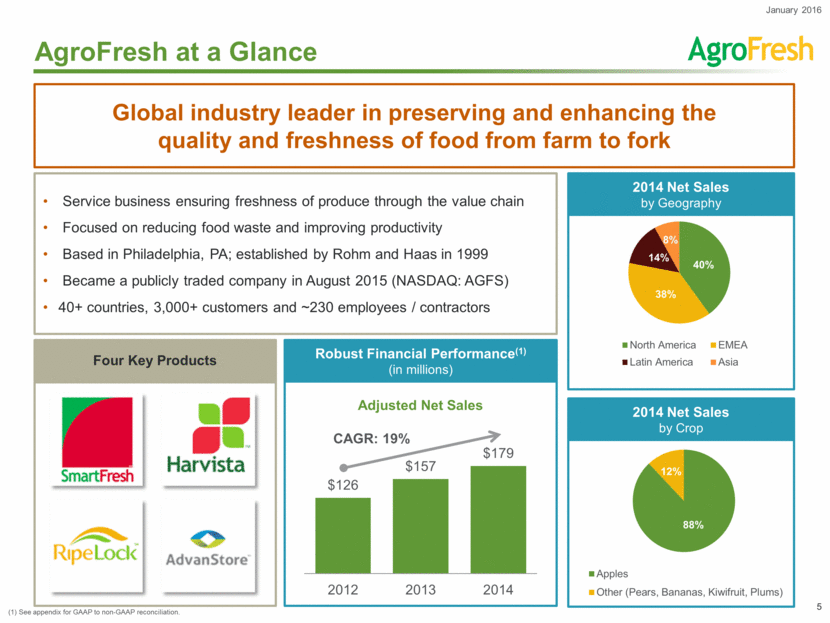
Service business ensuring freshness of produce through the value chain Focused on reducing food waste and improving productivity Based in Philadelphia, PA; established by Rohm and Haas in 1999 Became a publicly traded company in August 2015 (NASDAQ: AGFS) 40+ countries, 3,000+ customers and ~230 employees / contractors 2014 Net Sales by Geography 2014 Net Sales by Crop AgroFresh at a Glance Global industry leader in preserving and enhancing the quality and freshness of food from farm to fork Robust Financial Performance(1) (in millions) Adjusted Net Sales Four Key Products January 2016 CAGR: 19% (1) See appendix for GAAP to non-GAAP reconciliation. 40% 38% 14% 8% North America EMEA Latin America Asia 88% 12% Apples Other (Pears, Bananas, Kiwifruit, Plums) $126 $157 $179 2012 2013 2014
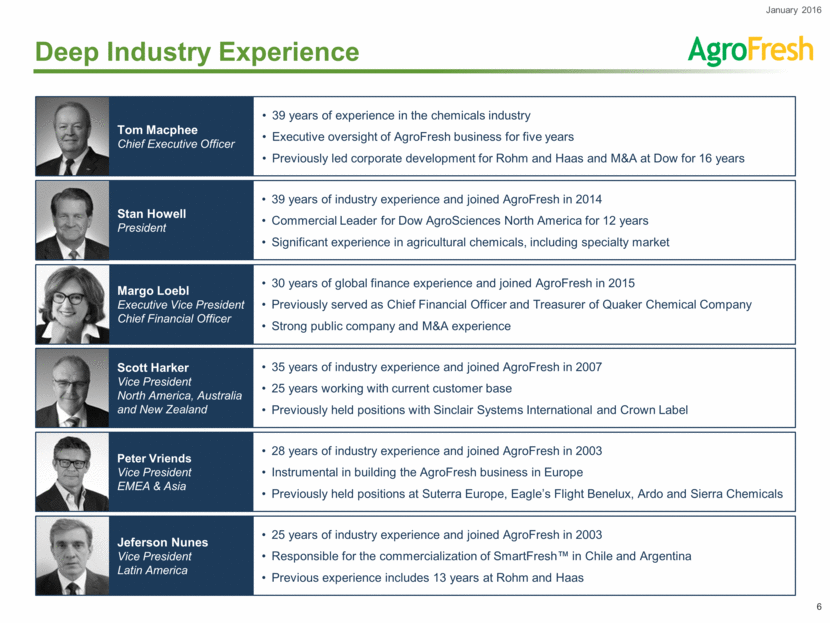
Deep Industry Experience Margo Loebl Executive Vice President Chief Financial Officer 30 years of global finance experience and joined AgroFresh in 2015 Previously served as Chief Financial Officer and Treasurer of Quaker Chemical Company Strong public company and M&A experience Peter Vriends Vice President EMEA & Asia 28 years of industry experience and joined AgroFresh in 2003 Instrumental in building the AgroFresh business in Europe Previously held positions at Suterra Europe, Eagle’s Flight Benelux, Ardo and Sierra Chemicals Jeferson Nunes Vice President Latin America 25 years of industry experience and joined AgroFresh in 2003 Responsible for the commercialization of SmartFresh™ in Chile and Argentina Previous experience includes 13 years at Rohm and Haas Tom Macphee Chief Executive Officer 39 years of experience in the chemicals industry Executive oversight of AgroFresh business for five years Previously led corporate development for Rohm and Haas and M&A at Dow for 16 years Stan Howell President 39 years of industry experience and joined AgroFresh in 2014 Commercial Leader for Dow AgroSciences North America for 12 years Significant experience in agricultural chemicals, including specialty market Scott Harker Vice President North America, Australia and New Zealand 35 years of industry experience and joined AgroFresh in 2007 25 years working with current customer base Previously held positions with Sinclair Systems International and Crown Label January 2016
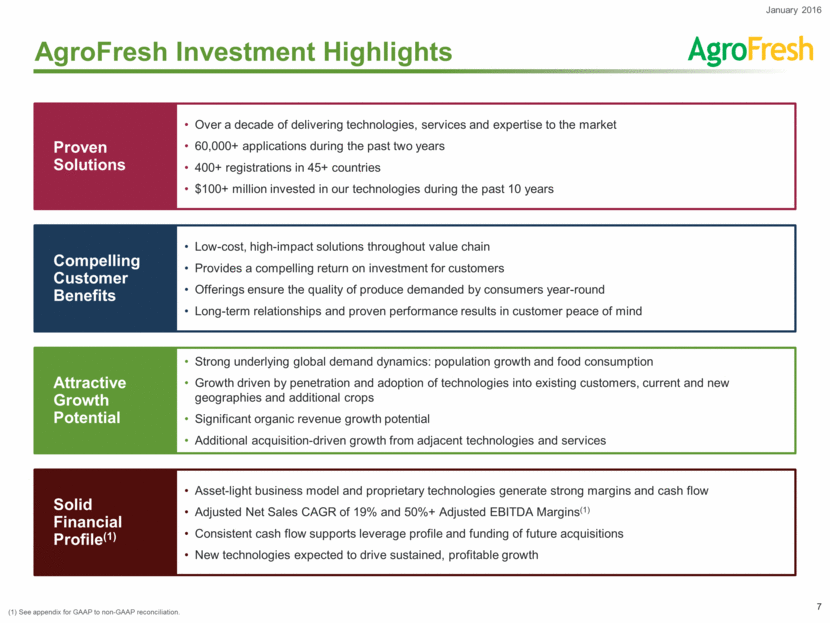
AgroFresh Investment Highlights Solid Financial Profile(1) Asset-light business model and proprietary technologies generate strong margins and cash flow Adjusted Net Sales CAGR of 19% and 50%+ Adjusted EBITDA Margins(1) Consistent cash flow supports leverage profile and funding of future acquisitions New technologies expected to drive sustained, profitable growth Strong underlying global demand dynamics: population growth and food consumption Growth driven by penetration and adoption of technologies into existing customers, current and new geographies and additional crops Significant organic revenue growth potential Additional acquisition-driven growth from adjacent technologies and services Attractive Growth Potential Over a decade of delivering technologies, services and expertise to the market 60,000+ applications during the past two years 400+ registrations in 45+ countries $100+ million invested in our technologies during the past 10 years Proven Solutions Low-cost, high-impact solutions throughout value chain Provides a compelling return on investment for customers Offerings ensure the quality of produce demanded by consumers year-round Long-term relationships and proven performance results in customer peace of mind Compelling Customer Benefits (1) See appendix for GAAP to non-GAAP reconciliation. January 2016
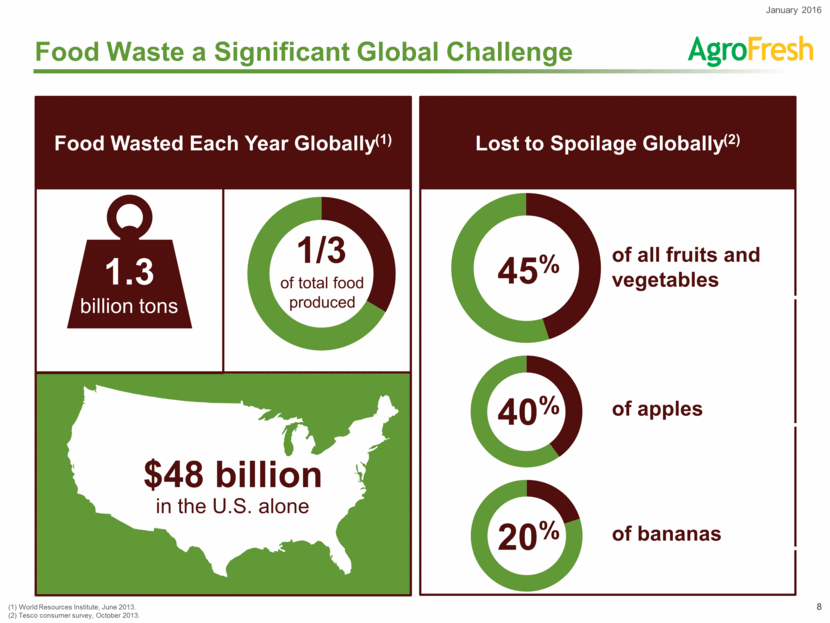
Food Wasted Each Year Globally(1) Lost to Spoilage Globally(2) Food Waste a Significant Global Challenge $48 billion in the U.S. alone 1.3 billion tons 1/3 of total food produced 45% 40% 20% of all fruits and vegetables of apples of bananas (1) World Resources Institute, June 2013. (2) Tesco consumer survey, October 2013. January 2016
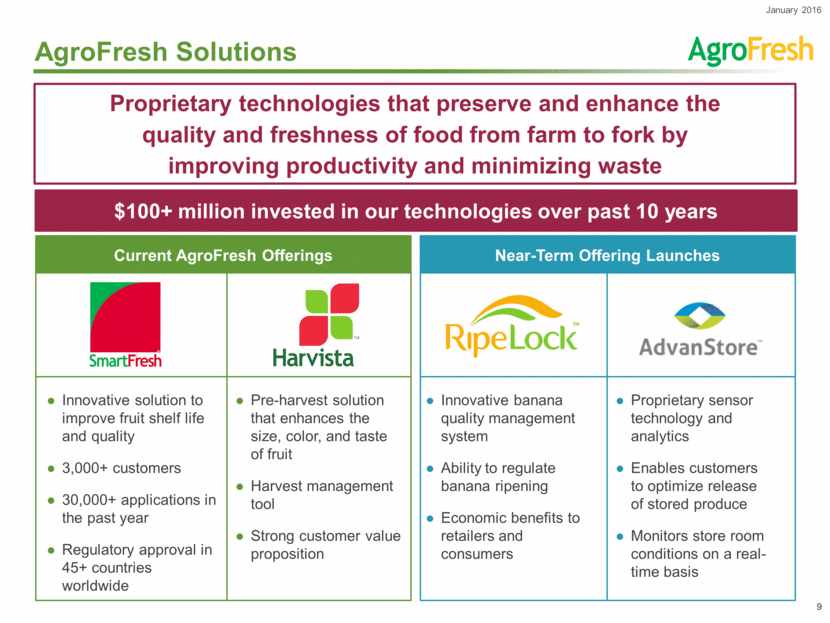
AgroFresh Solutions Current AgroFresh Offerings Innovative solution to improve fruit shelf life and quality 3,000+ customers 30,000+ applications in the past year Regulatory approval in 45+ countries worldwide Pre-harvest solution that enhances the size, color, and taste of fruit Harvest management tool Strong customer value proposition Near-Term Offering Launches Proprietary sensor technology and analytics Enables customers to optimize release of stored produce Monitors store room conditions on a real-time basis Innovative banana quality management system Ability to regulate banana ripening Economic benefits to retailers and consumers Proprietary technologies that preserve and enhance the quality and freshness of food from farm to fork by improving productivity and minimizing waste $100+ million invested in our technologies over past 10 years January 2016
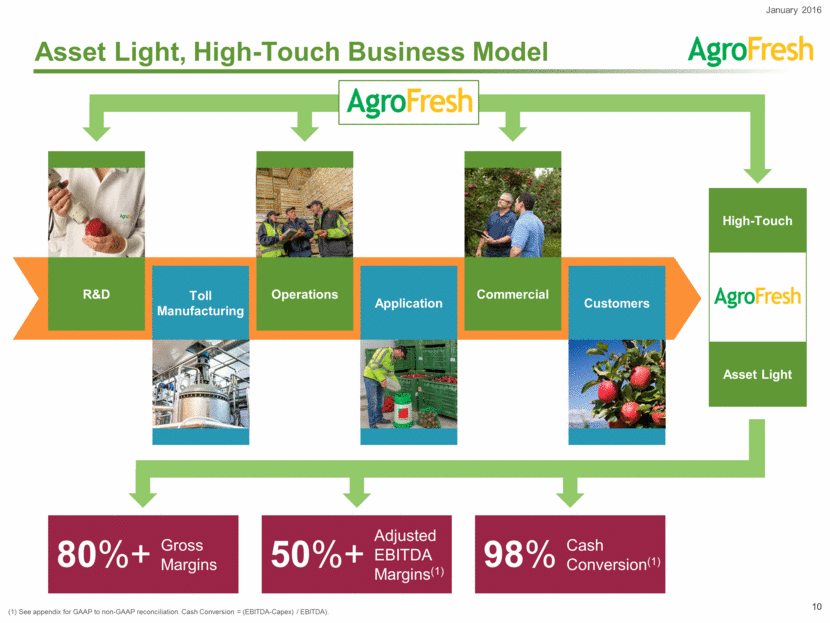
Asset Light, High-Touch Business Model Asset Light High-Touch Customers Gross Margins 80%+ Adjusted EBITDA Margins(1) 50%+ R&D Operations Commercial Application Toll Manufacturing (1) See appendix for GAAP to non-GAAP reconciliation. Cash Conversion = (EBITDA-Capex) / EBITDA). January 2016 Cash Conversion(1) 98%
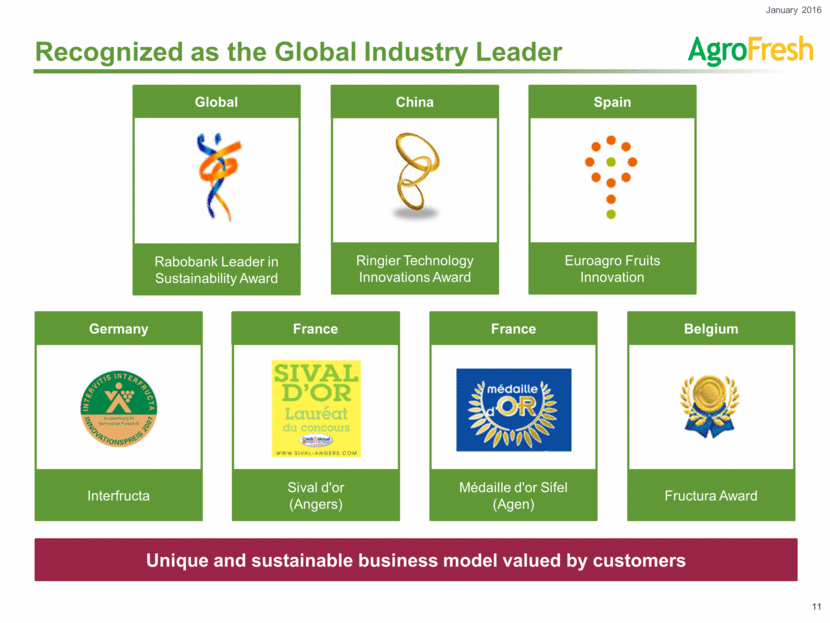
Recognized as the Global Industry Leader Rabobank Leader in Sustainability Award Global Ringier Technology Innovations Award China Euroagro Fruits Innovation Spain Fructura Award Belgium Médaille d'or Sifel (Agen) France Sival d'or (Angers) France Interfructa Germany Unique and sustainable business model valued by customers January 2016
Sustainable Competitive Advantages January 2016
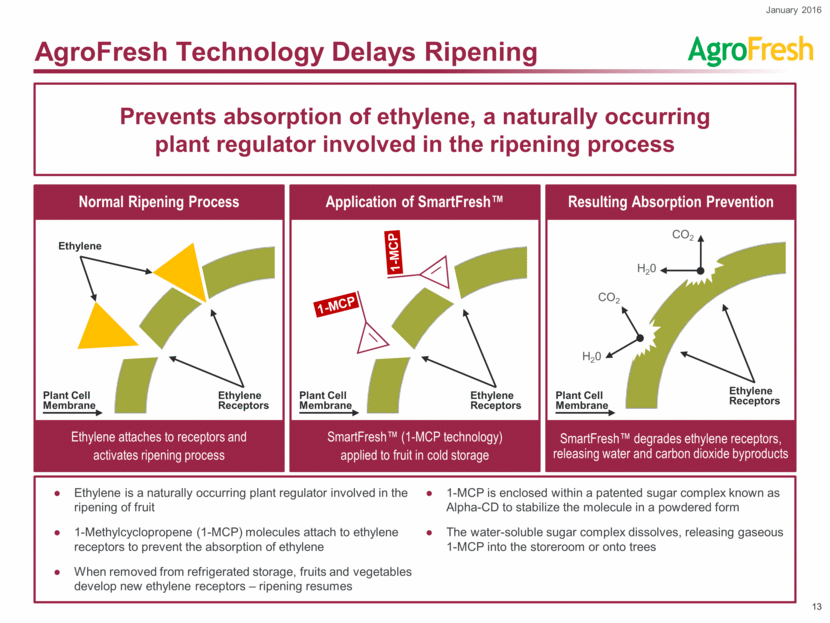
AgroFresh Technology Delays Ripening Ethylene is a naturally occurring plant regulator involved in the ripening of fruit 1-Methylcyclopropene (1-MCP) molecules attach to ethylene receptors to prevent the absorption of ethylene When removed from refrigerated storage, fruits and vegetables develop new ethylene receptors – ripening resumes 1-MCP is enclosed within a patented sugar complex known as Alpha-CD to stabilize the molecule in a powdered form The water-soluble sugar complex dissolves, releasing gaseous 1-MCP into the storeroom or onto trees Prevents absorption of ethylene, a naturally occurring plant regulator involved in the ripening process Normal Ripening Process Plant Cell Membrane Ethylene Receptors Ethylene Ethylene attaches to receptors and activates ripening process Application of SmartFresh™ Plant Cell Membrane Ethylene Receptors 1-MCP 1-MCP SmartFresh™ (1-MCP technology) applied to fruit in cold storage Plant Cell Membrane Ethylene Receptors Resulting Absorption Prevention SmartFresh™ degrades ethylene receptors, releasing water and carbon dioxide byproducts CO2 CO2 H20 H20 January 2016
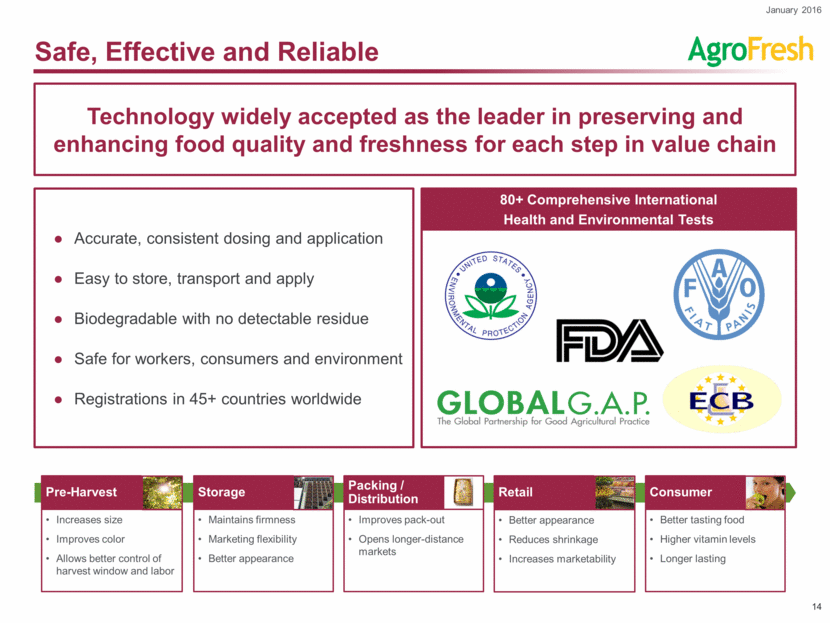
Safe, Effective and Reliable Accurate, consistent dosing and application Easy to store, transport and apply Biodegradable with no detectable residue Safe for workers, consumers and environment Registrations in 45+ countries worldwide Technology widely accepted as the leader in preserving and enhancing food quality and freshness for each step in value chain Pre-Harvest Increases size Improves color Allows better control of harvest window and labor 80+ Comprehensive International Health and Environmental Tests Storage Maintains firmness Marketing flexibility Better appearance Packing / Distribution Improves pack-out Opens longer-distance markets Consumer Better tasting food Higher vitamin levels Longer lasting Better appearance Reduces shrinkage Increases marketability Retail January 2016
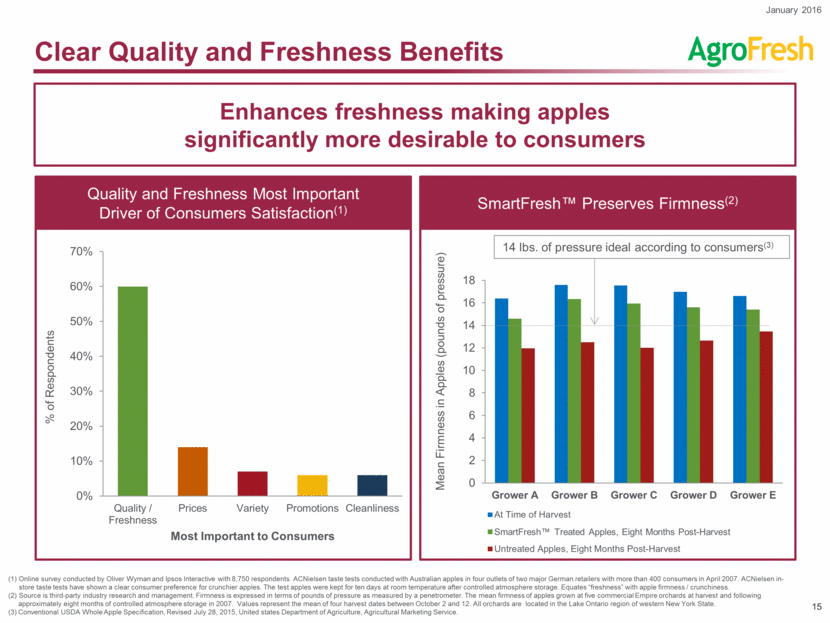
Mean Firmness in Apples (pounds of pressure) Clear Quality and Freshness Benefits Enhances freshness making apples significantly more desirable to consumers Quality and Freshness Most Important Driver of Consumers Satisfaction(1) SmartFresh™ Preserves Firmness(2) Online survey conducted by Oliver Wyman and Ipsos Interactive with 8,750 respondents. ACNielsen taste tests conducted with Australian apples in four outlets of two major German retailers with more than 400 consumers in April 2007. ACNielsen in-store taste tests have shown a clear consumer preference for crunchier apples. The test apples were kept for ten days at room temperature after controlled atmosphere storage. Equates “freshness” with apple firmness / crunchiness. (2) Source is third-party industry research and management. Firmness is expressed in terms of pounds of pressure as measured by a penetrometer. The mean firmness of apples grown at five commercial Empire orchards at harvest and following approximately eight months of controlled atmosphere storage in 2007. Values represent the mean of four harvest dates between October 2 and 12. All orchards are located in the Lake Ontario region of western New York State. (3) Conventional USDA Whole Apple Specification, Revised July 28, 2015, United states Department of Agriculture, Agricultural Marketing Service. January 2016 14 lbs. of pressure ideal according to consumers(3) Quality / Freshness Prices Variety Promotions Cleanliness 0% 10% 20% 30% 40% 50% 60% 70% Most Important to Consumers % of Respondents 0 2 4 6 8 10 12 14 16 18 Grower A Grower B Grower C Grower D Grower E At Time of Harvest SmartFresh™ Treated Apples, Eight Months Post - Harvest Untreated Apples, Eight Months Post-Harvest
Strong market position driven by differentiated technologies, customer-focused service model and deeply-ingrained customer relationships Ethylene Control Product Sales For Apple Treatment(1) ~25% of AgroFresh sales under no or limited patent protection(1) Strong Competitive Market Position All Others SmartFreshTM α-CD Encapsulated 1-MCP Preferred Method of Ethylene Control Delivery Produced on site by mixing numerous chemicals Requires two-step application process Gas 1-MCP Requires specialized handling and storage Must be transported at extremely low temperatures Liquid 1-MCP Accurate and consistent dosing and application Easy to store and transport Consistent quality and purity α-CD Encapsulated 1-MCP 80% + gross margins in countries with and without patent protection(2) January 2016 (1) Management estimate. (2) Includes countries with both molecule and encapsulation patents and just encapsulation patents. 97%
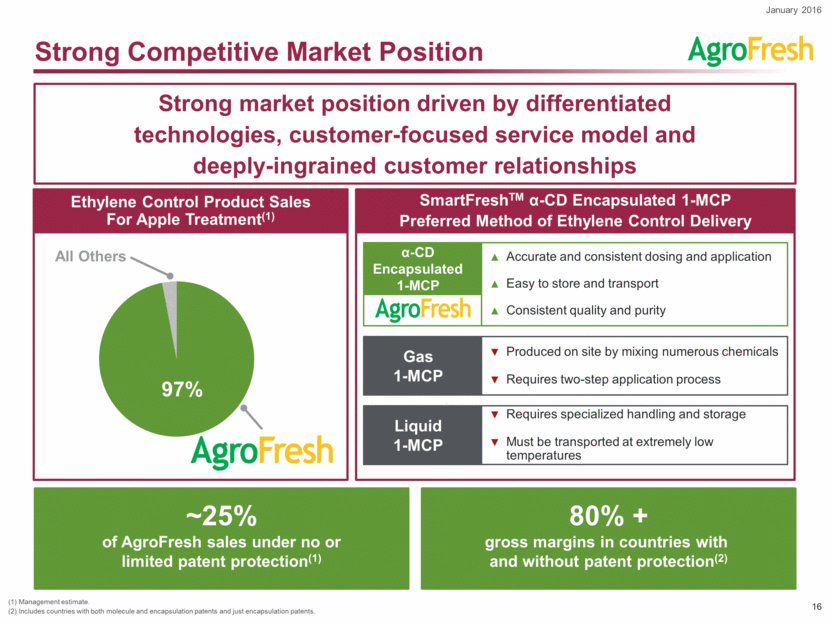
Sustainable Competitive Advantages Customer Retention Customer loyalty and rebate program Complementary suite of offerings Produce expertise < ½ penny per apple secures quality Customer pays for “peace of mind“ (quality, efficacy and service) Extends season and creates export opportunities Compelling Value Well-trained and responsive global team Significant investment ($100+ million) in technology, registration, service, distribution and operations Uniquely qualified R&D, commercial and management talent High Barriers to Entry Extensive customer-specific experience Year round customer interface High customer trust in product efficacy High Customer Touch Originated product category in produce Proprietary database and analytics – produce physiology, fruit quality and storage R&D program has generated more than 400 registrations Extensive Technical Know-How January 2016
Compelling Customer Benefits January 2016
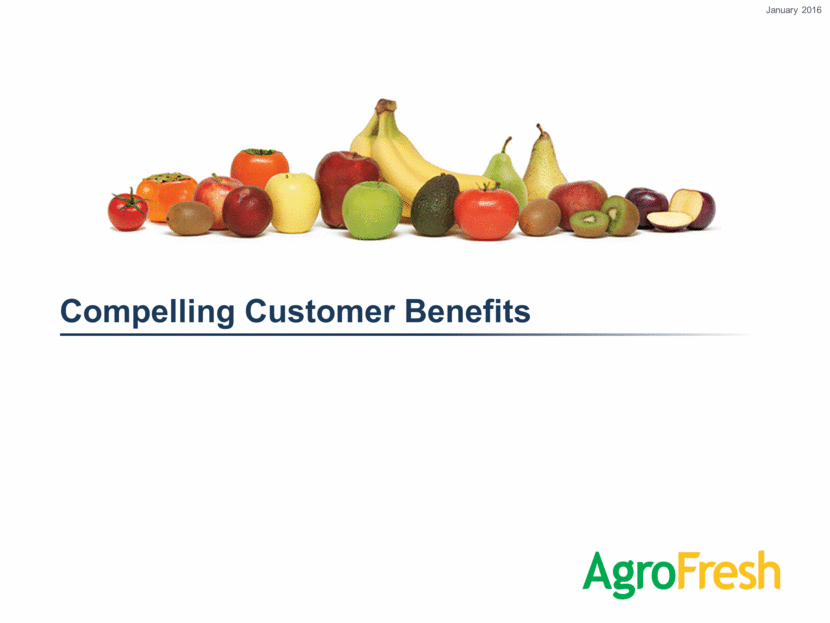
Significant Proven Customer Value Creation Early season treatment serves as an insurance policy, while later season treatment allows extension of apple season and significant value capture(1) “Insurance” 20X return on investment Average Wholesale Price Per Apple (1) Washington State Clearing House. Shows monthly wholesale prices of Gala apples in Washington State. Based on wholesale price per box, assuming 40 pound box and 6 ounce / 0.375 pound apples. Cost and Benefit on per apple basis. ½ cent invested in SmartFresh™ results in 10 cent increase in Gala apple price(1) January 2016 $0.15 $0.20 $0.25 $0.30 $0.35 Sep Oct Nov Dec Jan Feb Mar Apr May Jun Jul Aug
Better Color and Size Results in Premium Value (1) 2008 AgroFresh study on Washington Golden Delicious apples. Golden Delicious lots from three growers were harvested on approximately October 1, 2007. Portions of the lots were treated with SmartFresh™ technology and placed in the same long-term controlled atmosphere storage room with untreated bins from the same grower lots. Control Harvista™ McIntosh Apples Control Bartlett Pears Harvista™ Golden Delicious Apples Managed harvest improves productivity Minimizes fruit drop – provides up to 21 additional days for the fruit to remain on the tree(1) Premium value through better color, size and taste January 2016 Minimizes Fruit Drop Improves Color, Size and Taste
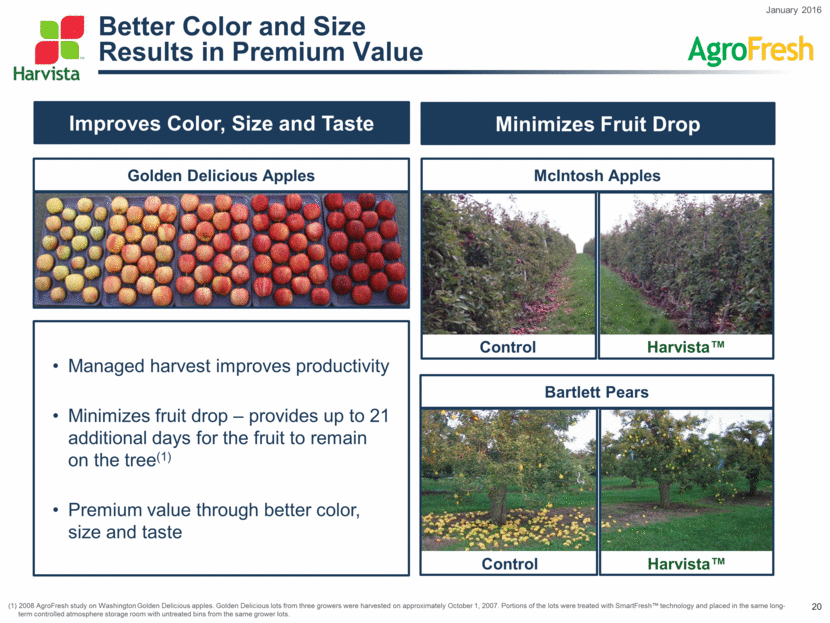
Banana Ripening Control Solution RipeLock™ Bananas Banana Purchase Decision Drivers(1) Addresses most important drivers of banana purchasing decisions, increasing yellow life – ripeness and color – by 3 to 5 days (1) Tragon consumer study, March 2005. Untreated Bananas Combination of proprietary packaging and 1-MCP treatment No disruption to current banana supply chain January 2016 44% 35% 15% Ripeness Color Price Brightness Other
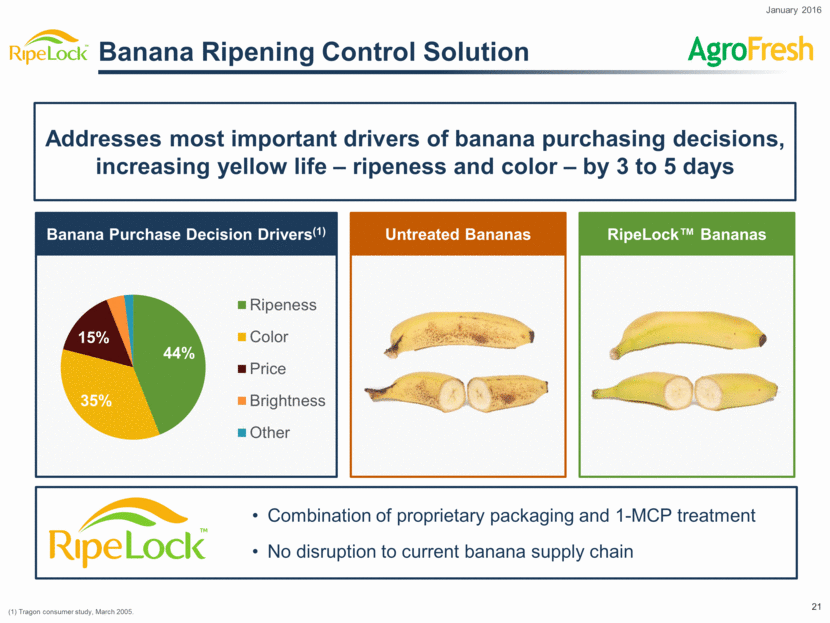
Advanced Storage Monitoring and Diagnostics Proprietary technology to better manage produce throughout the storage cycle Proprietary monitoring of store room atmospheres Real time data for operators on conditions in the room Opportunity to reduce waste due to decay or disuse January 2016 Controlled Atmosphere Facility
Attractive Growth Potential January 2016
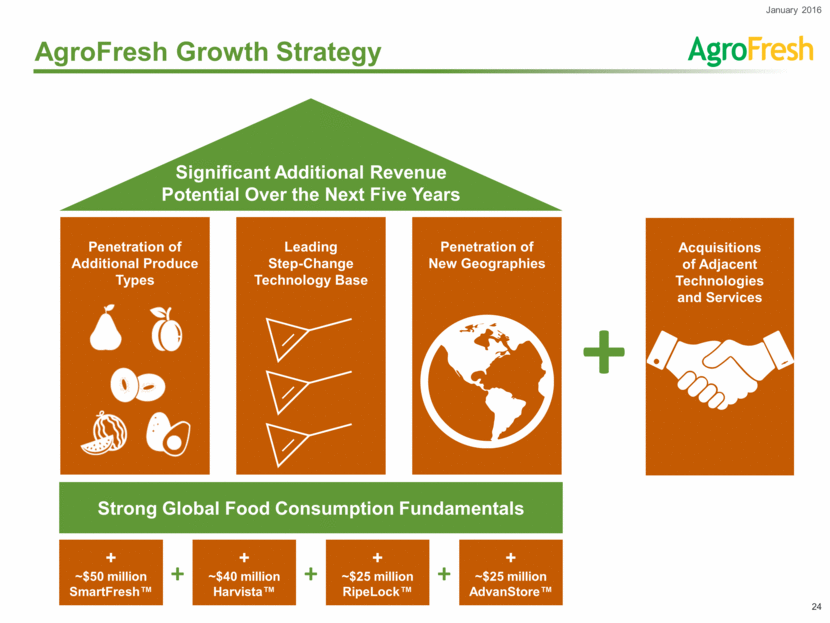
AgroFresh Growth Strategy Strong Global Food Consumption Fundamentals Significant Additional Revenue Potential Over the Next Five Years + ~$50 million SmartFresh™ + ~$40 million Harvista™ + ~$25 million RipeLock™ + ~$25 million AdvanStore™ + + + Penetration of Additional Produce Types Leading Step-Change Technology Base Penetration of New Geographies Acquisitions of Adjacent Technologies and Services + January 2016
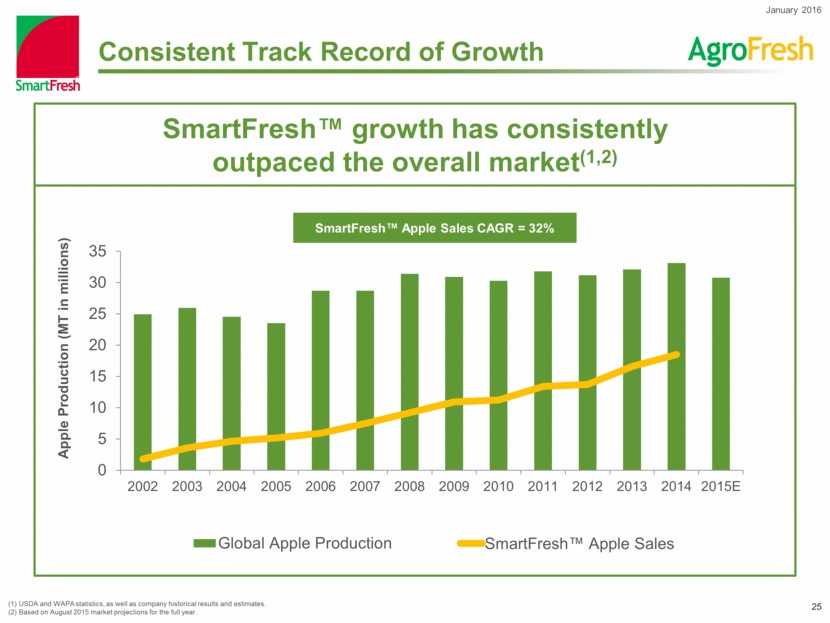
Consistent Track Record of Growth Apple Production (MT in millions) SmartFresh™ growth has consistently outpaced the overall market(1,2) SmartFresh™ Apple Sales CAGR = 32% (1) USDA and WAPA statistics, as well as company historical results and estimates. (2) Based on August 2015 market projections for the full year. January 2016 -$10 $10 $30 $50 $70 $90 $110 $130 $150 $170 $190 $210 $230 $250 $270 $290 0 5 10 15 20 25 30 35 2002 2003 2004 2005 2006 2007 2008 2009 2010 2011 2012 2013 2014 2015E Global Apple Production SmartFresh™ Apple Sales
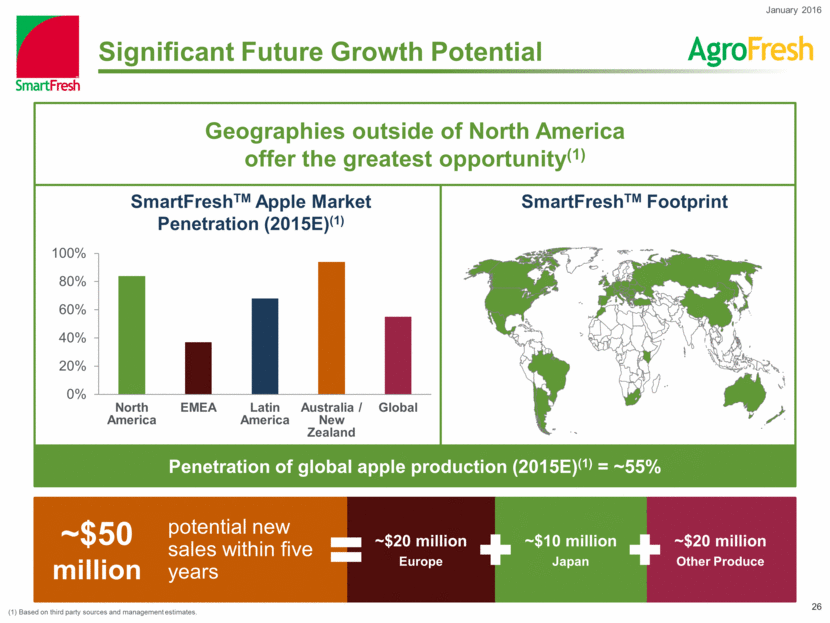
Significant Future Growth Potential Penetration of global apple production (2015E)(1) = ~55% Geographies outside of North America offer the greatest opportunity(1) SmartFreshTM Footprint ~$50 million ~$20 million Europe ~$20 million Other Produce ~$10 million Japan SmartFreshTM Apple Market Penetration (2015E)(1) potential new sales within five years (1) Based on third party sources and management estimates. January 2016 0% 20% 40% 60% 80% 100% North America EMEA Latin America Australia / New Zealand Global
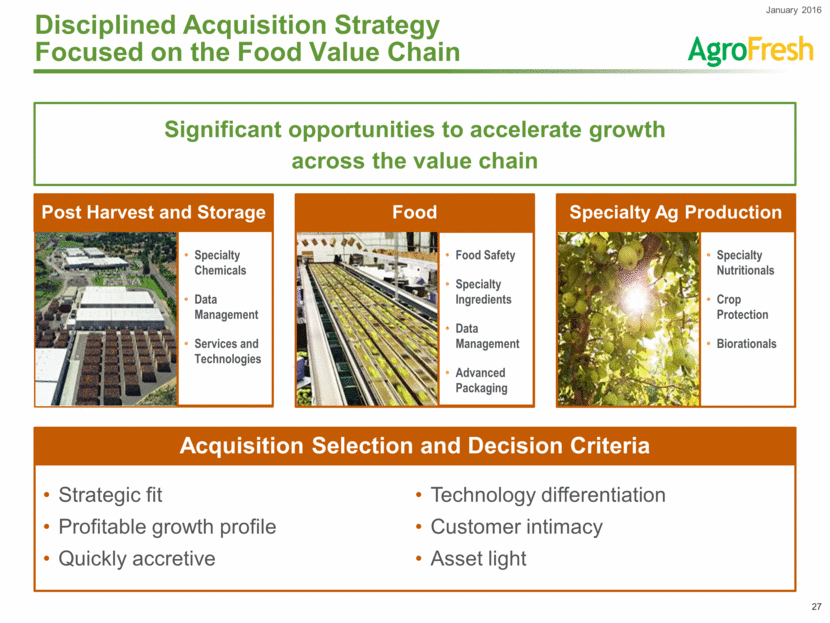
Disciplined Acquisition Strategy Focused on the Food Value Chain Significant opportunities to accelerate growth across the value chain Strategic fit Profitable growth profile Quickly accretive Technology differentiation Customer intimacy Asset light Acquisition Selection and Decision Criteria Specialty Ag Production Specialty Nutritionals Crop Protection Biorationals Post Harvest and Storage Specialty Chemicals Data Management Services and Technologies Food Food Safety Specialty Ingredients Data Management Advanced Packaging January 2016
Solid Financial Profile January 2016
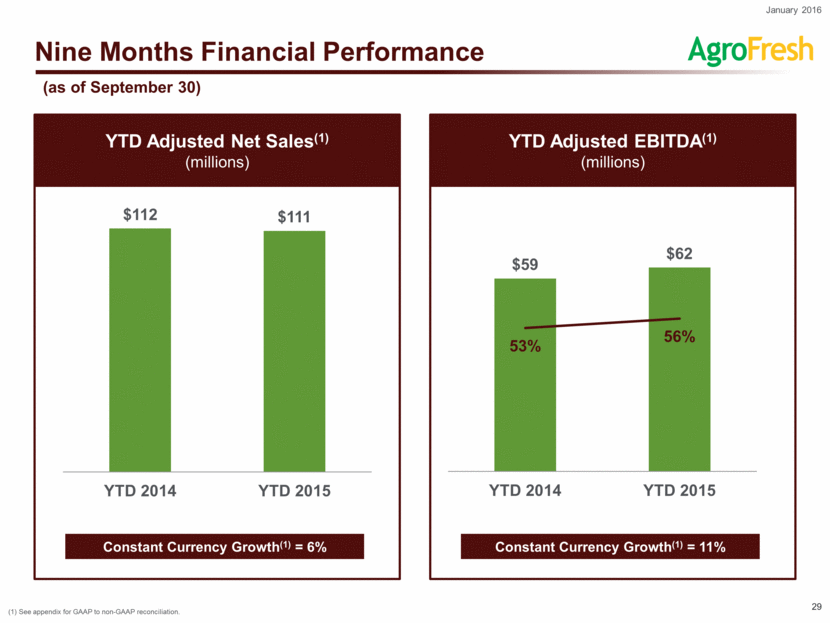
Nine Months Financial Performance YTD Adjusted EBITDA(1) (millions) YTD Adjusted Net Sales(1) (millions) Constant Currency Growth(1) = 6% Constant Currency Growth(1) = 11% (1) See appendix for GAAP to non-GAAP reconciliation. (as of September 30) January 2016 $112 $111 YTD 2014 YTD 2015 $59 $62 53% 56% YTD 2014 YTD 2015
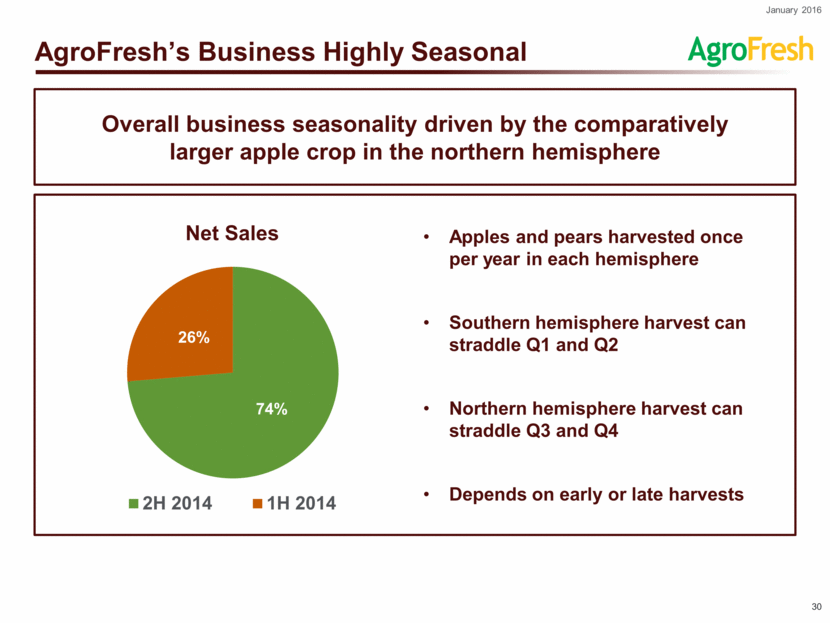
AgroFresh’s Business Highly Seasonal Overall business seasonality driven by the comparatively larger apple crop in the northern hemisphere Net Sales Apples and pears harvested once per year in each hemisphere Southern hemisphere harvest can straddle Q1 and Q2 Northern hemisphere harvest can straddle Q3 and Q4 Depends on early or late harvests January 2016 74% 26% 2H 2014 1H 2014
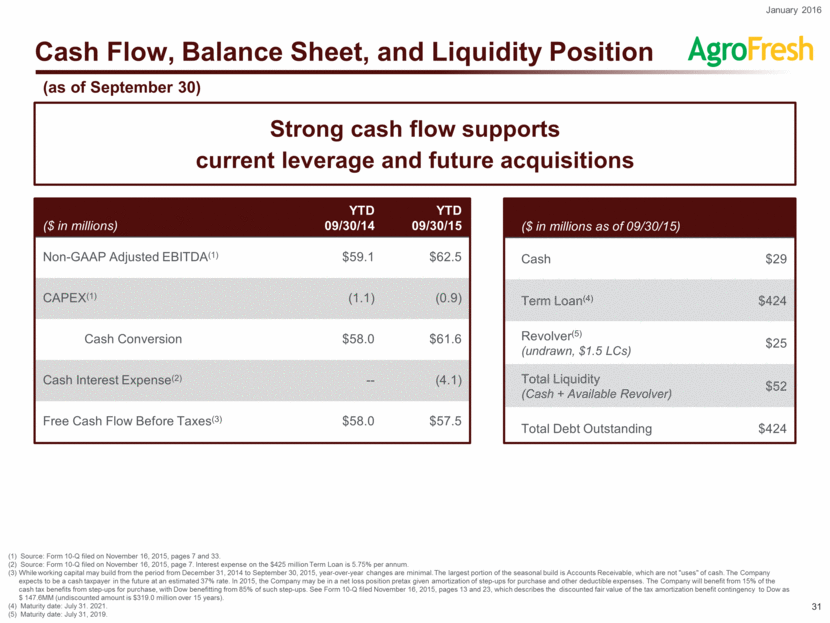
Cash Flow, Balance Sheet, and Liquidity Position Strong cash flow supports current leverage and future acquisitions ($ in millions as of 09/30/15) Cash $29 Term Loan(4) $424 Revolver(5) (undrawn, $1.5 LCs) $25 Total Liquidity (Cash + Available Revolver) $52 Total Debt Outstanding $424 ($ in millions) YTD 09/30/14 YTD 09/30/15 Non-GAAP Adjusted EBITDA(1) $59.1 $62.5 CAPEX(1) (1.1) (0.9) Cash Conversion $58.0 $61.6 Cash Interest Expense(2) -- (4.1) Free Cash Flow Before Taxes(3) $58.0 $57.5 (1) Source: Form 10-Q filed on November 16, 2015, pages 7 and 33. (2) Source: Form 10-Q filed on November 16, 2015, page 7. Interest expense on the $425 million Term Loan is 5.75% per annum. (3) While working capital may build from the period from December 31, 2014 to September 30, 2015, year-over-year changes are minimal. The largest portion of the seasonal build is Accounts Receivable, which are not "uses" of cash. The Company expects to be a cash taxpayer in the future at an estimated 37% rate. In 2015, the Company may be in a net loss position pretax given amortization of step-ups for purchase and other deductible expenses. The Company will benefit from 15% of the cash tax benefits from step-ups for purchase, with Dow benefitting from 85% of such step-ups. See Form 10-Q filed November 16, 2015, pages 13 and 23, which describes the discounted fair value of the tax amortization benefit contingency to Dow as $ 147.6MM (undiscounted amount is $319.0 million over 15 years). (4) Maturity date: July 31. 2021. (5) Maturity date: July 31, 2019. (as of September 30) January 2016
Appendix January 2016
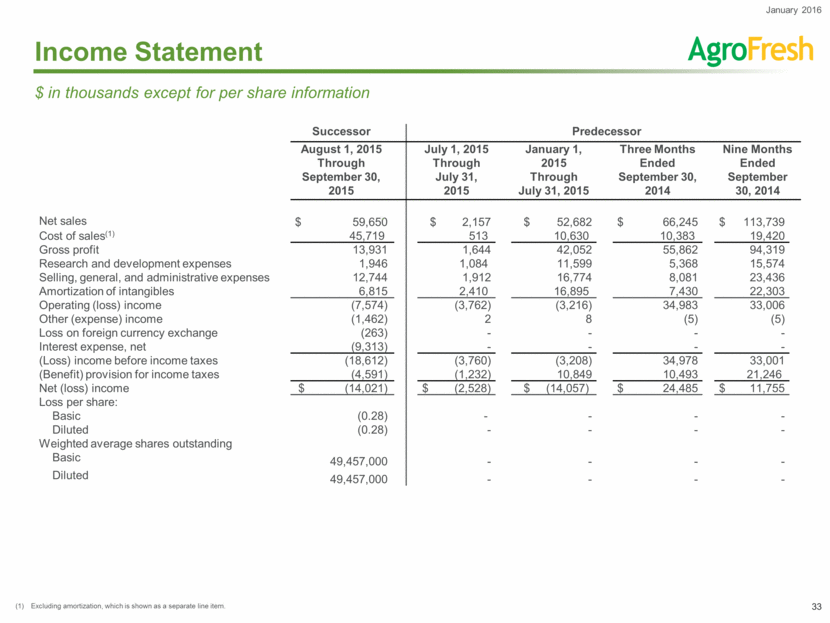
Income Statement Successor Predecessor August 1, 2015 Through September 30, 2015 July 1, 2015 Through July 31, 2015 January 1, 2015 Through July 31, 2015 Three Months Ended September 30, 2014 Nine Months Ended September 30, 2014 Net sales $ 59,650 $ 2,157 $ 52,682 $ 66,245 $ 113,739 Cost of sales(1) 45,719 513 10,630 10,383 19,420 Gross profit 13,931 1,644 42,052 55,862 94,319 Research and development expenses 1,946 1,084 11,599 5,368 15,574 Selling, general, and administrative expenses 12,744 1,912 16,774 8,081 23,436 Amortization of intangibles 6,815 2,410 16,895 7,430 22,303 Operating (loss) income (7,574) (3,762) (3,216) 34,983 33,006 Other (expense) income (1,462) 2 8 (5) (5) Loss on foreign currency exchange (263) - - - - Interest expense, net (9,313) - - - - (Loss) income before income taxes (18,612) (3,760) (3,208) 34,978 33,001 (Benefit) provision for income taxes (4,591) (1,232) 10,849 10,493 21,246 Net (loss) income $ (14,021) $ (2,528) $ (14,057) $ 24,485 $ 11,755 Loss per share: Basic (0.28) - - - - Diluted (0.28) - - - - Weighted average shares outstanding Basic 49,457,000 - - - - Diluted 49,457,000 - - - - $ in thousands except for per share information (1) Excluding amortization, which is shown as a separate line item. January 2016
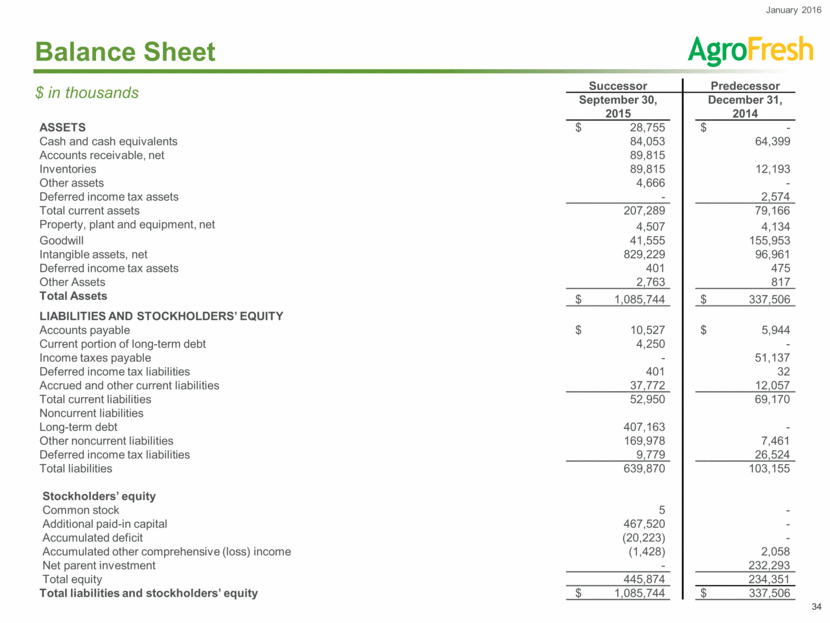
Balance Sheet Successor Predecessor September 30, 2015 December 31, 2014 ASSETS $ 28,755 $ - Cash and cash equivalents 84,053 64,399 Accounts receivable, net 89,815 Inventories 89,815 12,193 Other assets 4,666 - Deferred income tax assets - 2,574 Total current assets 207,289 79,166 Property, plant and equipment, net 4,507 4,134 Goodwill 41,555 155,953 Intangible assets, net 829,229 96,961 Deferred income tax assets 401 475 Other Assets 2,763 817 Total Assets $ 1,085,744 $ 337,506 LIABILITIES AND STOCKHOLDERS’ EQUITY Accounts payable $ 10,527 $ 5,944 Current portion of long-term debt 4,250 - Income taxes payable - 51,137 Deferred income tax liabilities 401 32 Accrued and other current liabilities 37,772 12,057 Total current liabilities 52,950 69,170 Noncurrent liabilities Long-term debt 407,163 - Other noncurrent liabilities 169,978 7,461 Deferred income tax liabilities 9,779 26,524 Total liabilities 639,870 103,155 Stockholders’ equity Common stock 5 - Additional paid-in capital 467,520 - Accumulated deficit (20,223) - Accumulated other comprehensive (loss) income (1,428) 2,058 Net parent investment - 232,293 Total equity 445,874 234,351 Total liabilities and stockholders’ equity $ 1,085,744 $ 337,506 $ in thousands January 2016
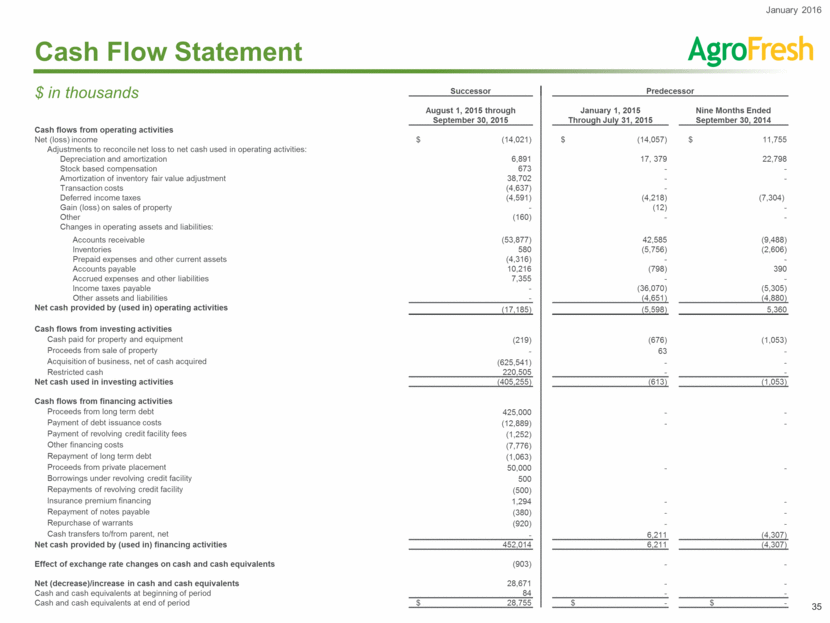
Cash Flow Statement Successor Predecessor August 1, 2015 through September 30, 2015 January 1, 2015 Through July 31, 2015 Nine Months Ended September 30, 2014 Cash flows from operating activities Net (loss) income $ (14,021) $ (14,057) $ 11,755 Adjustments to reconcile net loss to net cash used in operating activities: Depreciation and amortization 6,891 17, 379 22,798 Stock based compensation 673 - - Amortization of inventory fair value adjustment 38,702 - - Transaction costs (4,637) - Deferred income taxes (4,591) (4,218) (7,304) Gain (loss) on sales of property - (12) - Other (160) - - Changes in operating assets and liabilities: Accounts receivable (53,877) 42,585 (9,488) Inventories 580 (5,756) (2,606) Prepaid expenses and other current assets (4,316) - - Accounts payable 10,216 (798) 390 Accrued expenses and other liabilities 7,355 - - Income taxes payable - (36,070) (5,305) Other assets and liabilities - (4,651) (4,880) Net cash provided by (used in) operating activities (17,185) (5,598) 5,360 Cash flows from investing activities Cash paid for property and equipment (219) (676) (1,053) Proceeds from sale of property - 63 - Acquisition of business, net of cash acquired (625,541) - - Restricted cash 220,505 - - Net cash used in investing activities (405,255) (613) (1,053) Cash flows from financing activities Proceeds from long term debt 425,000 - - Payment of debt issuance costs (12,889) - - Payment of revolving credit facility fees (1,252) Other financing costs (7,776) Repayment of long term debt (1,063) Proceeds from private placement 50,000 - - Borrowings under revolving credit facility 500 Repayments of revolving credit facility (500) Insurance premium financing 1,294 - - Repayment of notes payable (380) - - Repurchase of warrants (920) - - Cash transfers to/from parent, net - 6,211 (4,307) Net cash provided by (used in) financing activities 452,014 6,211 (4,307) Effect of exchange rate changes on cash and cash equivalents (903) - - Net (decrease)/increase in cash and cash equivalents 28,671 - - Cash and cash equivalents at beginning of period 84 - - Cash and cash equivalents at end of period $ 28,755 $ - $ - $ in thousands January 2016
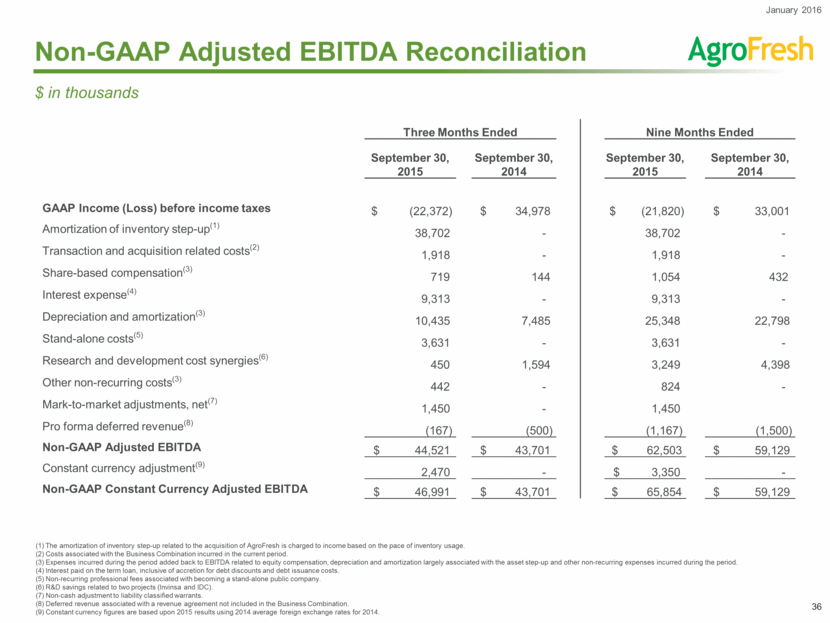
Non-GAAP Adjusted EBITDA Reconciliation (1) The amortization of inventory step-up related to the acquisition of AgroFresh is charged to income based on the pace of inventory usage. (2) Costs associated with the Business Combination incurred in the current period. (3) Expenses incurred during the period added back to EBITDA related to equity compensation, depreciation and amortization largely associated with the asset step-up and other non-recurring expenses incurred during the period. (4) Interest paid on the term loan, inclusive of accretion for debt discounts and debt issuance costs. (5) Non-recurring professional fees associated with becoming a stand-alone public company. (6) R&D savings related to two projects (Invinsa and IDC). (7) Non-cash adjustment to liability classified warrants. (8) Deferred revenue associated with a revenue agreement not included in the Business Combination. (9) Constant currency figures are based upon 2015 results using 2014 average foreign exchange rates for 2014. $ in thousands January 2016 Three Months Ended Nine Months Ended September 30, 2015 September 30, 2014 September 30, 2015 September 30, 2014 GAAP Income (Loss) before income taxes $ (22,372) $ 34,978 $ (21,820) $ 33,001 Amortization of inventory step-up(1) 38,702 - 38,702 - Transaction and acquisition related costs(2) 1,918 - 1,918 - Share-based compensation(3) 719 144 1,054 432 Interest expense(4) 9,313 - 9,313 - Depreciation and amortization(3) 10,435 7,485 25,348 22,798 Stand-alone costs(5) 3,631 - 3,631 - Research and development cost synergies(6) 450 1,594 3,249 4,398 Other non-recurring costs(3) 442 - 824 - Mark-to-market adjustments, net(7) 1,450 - 1,450 Pro forma deferred revenue(8) (167) (500) (1,167) (1,500) Non-GAAP Adjusted EBITDA $ 44,521 $ 43,701 $ 62,503 $ 59,129 Constant currency adjustment(9) 2,470 - $ 3,350 - Non-GAAP Constant Currency Adjusted EBITDA $ 46,991 $ 43,701 $ 65,854 $ 59,129
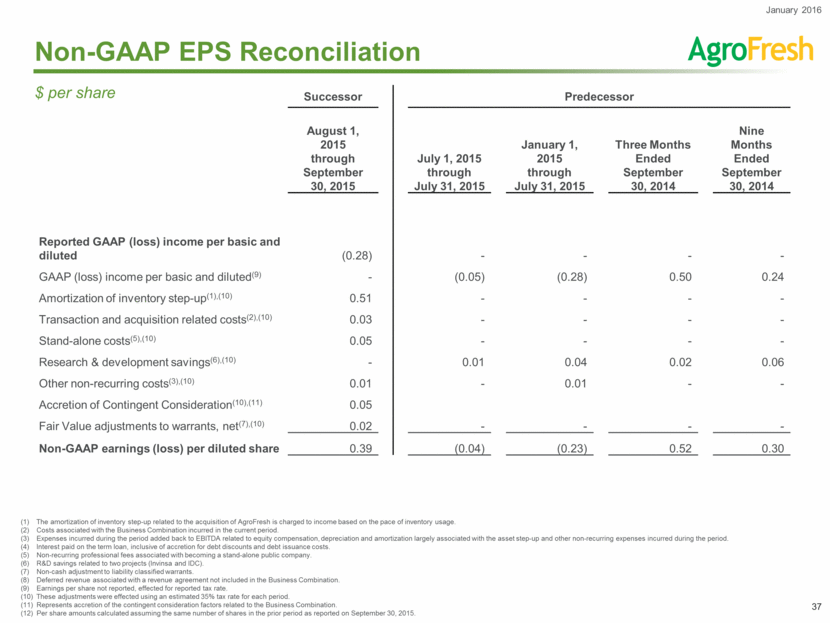
Non-GAAP EPS Reconciliation Successor Predecessor August 1, 2015 through September 30, 2015 July 1, 2015 through July 31, 2015 January 1, 2015 through July 31, 2015 Three Months Ended September 30, 2014 Nine Months Ended September 30, 2014 Reported GAAP (loss) income per basic and diluted (0.28) - - - - GAAP (loss) income per basic and diluted(9) - (0.05) (0.28) 0.50 0.24 Amortization of inventory step-up(1),(10) 0.51 - - - - Transaction and acquisition related costs(2),(10) 0.03 - - - - Stand-alone costs(5),(10) 0.05 - - - - Research & development savings(6),(10) - 0.01 0.04 0.02 0.06 Other non-recurring costs(3),(10) 0.01 - 0.01 - - Accretion of Contingent Consideration(10),(11) 0.05 Fair Value adjustments to warrants, net(7),(10) 0.02 - - - - Non-GAAP earnings (loss) per diluted share 0.39 (0.04) (0.23) 0.52 0.30 (1) The amortization of inventory step-up related to the acquisition of AgroFresh is charged to income based on the pace of inventory usage. (2) Costs associated with the Business Combination incurred in the current period. (3) Expenses incurred during the period added back to EBITDA related to equity compensation, depreciation and amortization largely associated with the asset step-up and other non-recurring expenses incurred during the period. (4) Interest paid on the term loan, inclusive of accretion for debt discounts and debt issuance costs. (5) Non-recurring professional fees associated with becoming a stand-alone public company. (6) R&D savings related to two projects (Invinsa and IDC). (7) Non-cash adjustment to liability classified warrants. (8) Deferred revenue associated with a revenue agreement not included in the Business Combination. (9) Earnings per share not reported, effected for reported tax rate. (10) These adjustments were effected using an estimated 35% tax rate for each period. (11) Represents accretion of the contingent consideration factors related to the Business Combination. (12) Per share amounts calculated assuming the same number of shares in the prior period as reported on September 30, 2015. $ per share January 2016
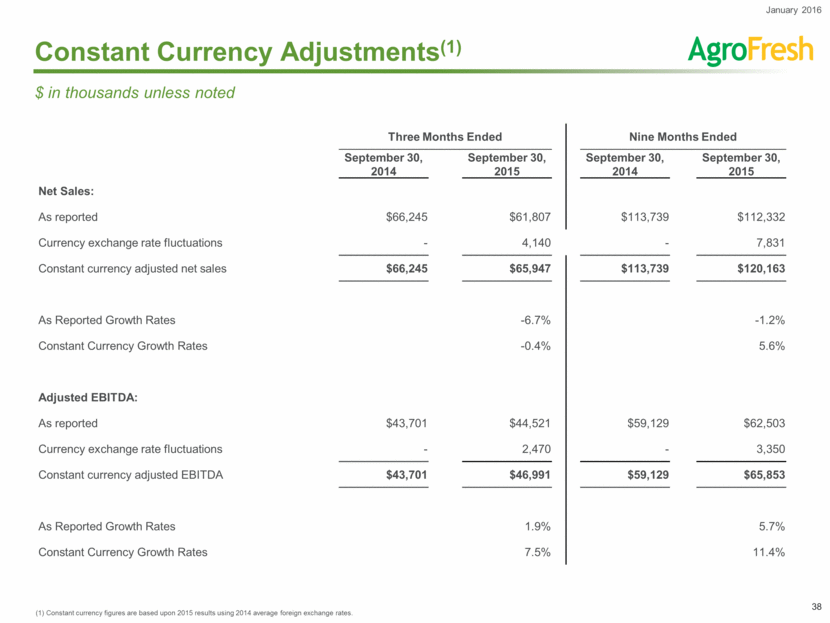
Constant Currency Adjustments(1) (1) Constant currency figures are based upon 2015 results using 2014 average foreign exchange rates. $ in thousands unless noted January 2016 Three Months Ended Nine Months Ended September 30, 2014 September 30, 2015 September 30, 2014 September 30, 2015 Net Sales: As reported $66,245 $61,807 $113,739 $112,332 Currency exchange rate fluctuations - 4,140 - 7,831 Constant currency adjusted net sales $66,245 $65,947 $113,739 $120,163 As Reported Growth Rates -6.7% -1.2% Constant Currency Growth Rates -0.4% 5.6% Adjusted EBITDA: As reported $43,701 $44,521 $59,129 $62,503 Currency exchange rate fluctuations - 2,470 - 3,350 Constant currency adjusted EBITDA $43,701 $46,991 $59,129 $65,853 As Reported Growth Rates 1.9% 5.7% Constant Currency Growth Rates 7.5% 11.4%
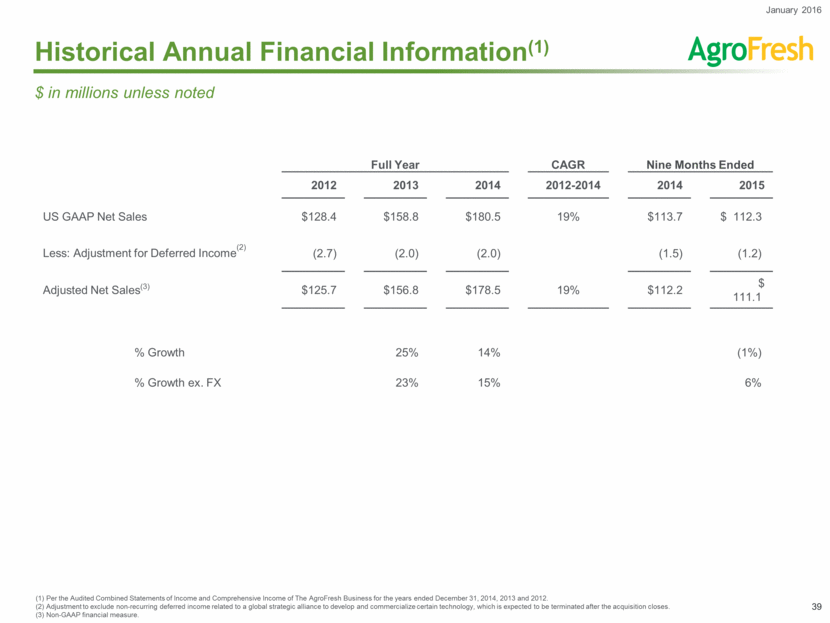
Historical Annual Financial Information(1) (1) Per the Audited Combined Statements of Income and Comprehensive Income of The AgroFresh Business for the years ended December 31, 2014, 2013 and 2012. (2) Adjustment to exclude non-recurring deferred income related to a global strategic alliance to develop and commercialize certain technology, which is expected to be terminated after the acquisition closes. (3) Non-GAAP financial measure. $ in millions unless noted January 2016 Full Year CAGR Nine Months Ended 2012 2013 2014 2012-2014 2014 2015 US GAAP Net Sales $128.4 $158.8 $180.5 19% $113.7 $ 112.3 Less: Adjustment for Deferred Income(2) (2.7) (2.0) (2.0) (1.5) (1.2) Adjusted Net Sales(3) $125.7 $156.8 $178.5 19% $112.2 $ 111.1 % Growth 25% 14% (1%) % Growth ex. FX 23% 15% 6%
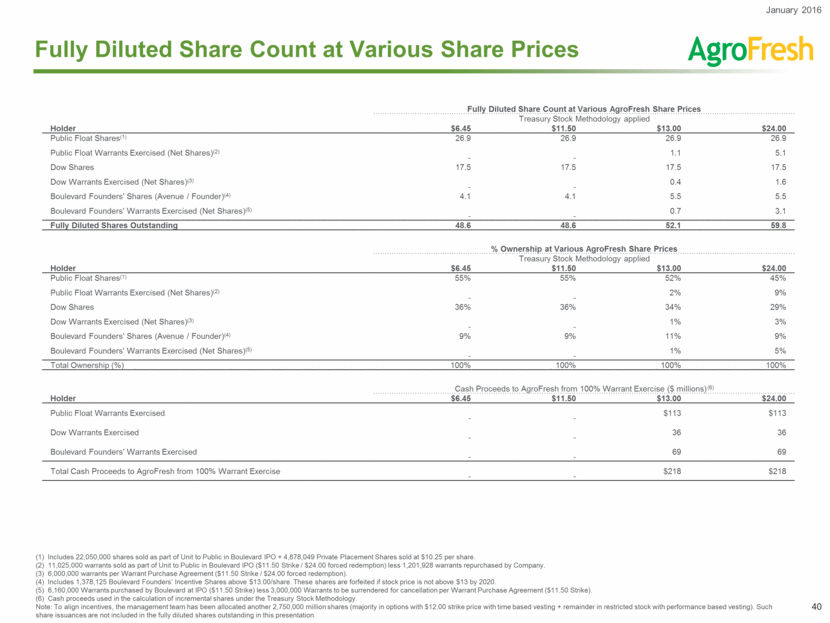
Fully Diluted Share Count at Various Share Prices January 2016 Fully Diluted Share Count at Various AgroFresh Share Prices Treasury Stock Methodology applied Holder $6.45 $11.50 $13.00 $24.00 Public Float Shares(1) 26.9 26.9 26.9 26.9 Public Float Warrants Exercised (Net Shares)(2) - - 1.1 5.1 Dow Shares 17.5 17.5 17.5 17.5 Dow Warrants Exercised (Net Shares)(3) - - 0.4 1.6 Boulevard Founders' Shares (Avenue / Founder)(4) 4.1 4.1 5.5 5.5 Boulevard Founders' Warrants Exercised (Net Shares)(5) - - 0.7 3.1 Fully Diluted Shares Outstanding 48.6 48.6 52.1 59.8 % Ownership at Various AgroFresh Share Prices Treasury Stock Methodology applied Holder $6.45 $11.50 $13.00 $24.00 Public Float Shares(1) 55% 55% 52% 45% Public Float Warrants Exercised (Net Shares)(2) - - 2% 9% Dow Shares 36% 36% 34% 29% Dow Warrants Exercised (Net Shares)(3) - - 1% 3% Boulevard Founders' Shares (Avenue / Founder)(4) 9% 9% 11% 9% Boulevard Founders' Warrants Exercised (Net Shares)(5) - - 1% 5% Total Ownership (%) 100% 100% 100% 100% Cash Proceeds to AgroFresh from 100% Warrant Exercise ($ millions) (6) Holder $6.45 $11.50 $13.00 $24.00 Public Float Warrants Exercised - - $113 $113 Dow Warrants Exercised - - 36 36 Boulevard Founders' Warrants Exercised - - 69 69 Total Cash Proceeds to AgroFresh from 100% Warrant Exercise - - $218 $218 (1) Includes 22,050,000 shares sold as part of Unit to Public in Boulevard IPO + 4,878,049 Private Placement Shares sold at $10.25 per share. (2) 11,025,000 warrants sold as part of Unit to Public in Boulevard IPO ($11.50 Strike / $24.00 forced redemption) less 1,201,928 warrants repurchased by Company. (3) 6,000,000 warrants per Warrant Purchase Agreement ($11.50 Strike / $24.00 forced redemption). (4) Includes 1,378,125 Boulevard Founders’ Incentive Shares above $13.00/share. These shares are forfeited if stock price is not above $13 by 2020. (5) 6,160,000 Warrants purchased by Boulevard at IPO ($11.50 Strike) less 3,000,000 Warrants to be surrendered for cancellation per Warrant Purchase Agreement ($11.50 Strike). (6) Cash proceeds used in the calculation of incremental shares under the Treasury Stock Methodology. Note: To align incentives, the management team has been allocated another 2,750,000 million shares (majority in options with $12.00 strike price with time based vesting + remainder in restricted stock with performance based vesting). Such share issuances are not included in the fully diluted shares outstanding in this presentation.
January 2016
