Attached files
| file | filename |
|---|---|
| 8-K - 8-K - DANAHER CORP /DE/ | d115160d8k.htm |
| EX-99.1 - EX-99.1 - DANAHER CORP /DE/ | d115160dex991.htm |
J.P. MORGAN HEALTHCARE CONFERENCE January 12, 2016 Exhibit 99.2
Forward Looking Statements Statements in this presentation that are not strictly historical, including any statements regarding events or developments that we believe or anticipate will or may occur in the future, are "forward-looking" statements within the meaning of the federal securities laws. There are a number of important factors that could cause actual results, developments and business decisions to differ materially from those suggested or indicated by such forward-looking statements and you should not place undue reliance on any such forward-looking statements. These factors include, among other things, deterioration of or instability in the economy, the markets we serve and the financial markets, the impact of our restructuring activities on our ability to grow, contractions or growth rates and cyclicality of markets we serve, competition, our ability to develop and successfully market new and enhanced products and services and expand into new markets, the potential for improper conduct by our employees, agents or business partners, our ability to successfully identify, consummate and integrate appropriate acquisitions and successfully complete divestitures and other dispositions, our ability to integrate the recently acquired Pall Corporation and achieve the anticipated benefits of that transaction, our ability to successfully consummate the separation of Danaher into two public companies and realize the anticipated benefits of that transaction, contingent liabilities relating to acquisitions and divestures, our compliance with applicable laws and regulations (including regulations relating to medical devices and the healthcare industry) and changes in applicable laws and regulations, our ability to effectively address cost reductions and other changes in the healthcare industry, risks relating to potential impairment of goodwill and other intangible assets, currency exchange rates, tax audits and changes in our tax rate and income tax liabilities, litigation and other contingent liabilities including intellectual property and environmental, health and safety matters, risks relating to product, service and software defects, product liability, and recalls, risks relating to product manufacturing, the impact of our debt obligations on our operations and liquidity, our relationships with and the performance of our channel partners, commodity costs and surcharges, our ability to adjust purchases and manufacturing capacity to reflect market conditions, reliance on sole sources of supply, labor matters, international economic, political, legal compliance and business factors, disruptions relating to man-made and natural disasters, security breaches or other disruptions of our information technology systems and pension plan costs. Additional information regarding the factors that may cause actual results to differ materially from these forward-looking statements is available in our SEC filings, including our 2014 Annual Report on Form 10-K and Quarterly Report on Form 10-Q for the third quarter of 2015. These forward-looking statements speak only as of the date of this presentation and the Company does not assume any obligation to update or revise any forward-looking statement, whether as a result of new information, future events and developments or otherwise. With respect to any non-GAAP financial measures included in the following presentation, the accompanying information required by SEC Regulation G can be found in the “Investors” section of Danaher’s web site, www.danaher.com, under the heading “Investor Events,” and event name “Danaher 2015 Investor & Analyst Meeting.” All references in this presentation to earnings, revenues and other company-specific financial metrics relate only to the continuing operations of Danaher’s business, unless otherwise noted. All references in this presentation to “growth” refer to year-over-year growth unless otherwise indicated.
Agenda Portfolio Overview Evolution of SCIEX with Danaher The Pall Opportunity
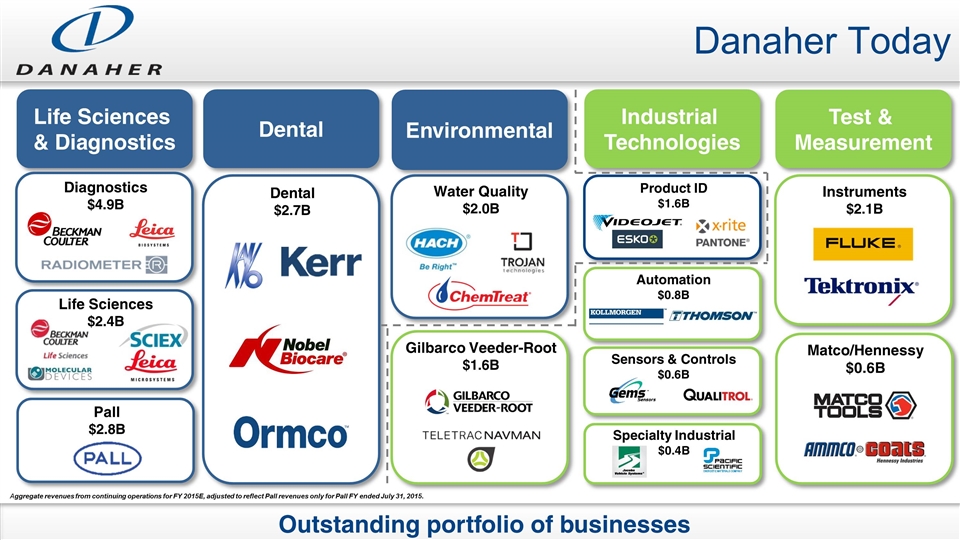
Danaher Today Outstanding portfolio of businesses Dental Life Sciences & Diagnostics Test & Measurement Industrial Technologies Environmental Water Quality $2.0B Gilbarco Veeder-Root $1.6B Instruments $2.1B Dental $2.7B Product ID $1.6B Automation $0.8B Diagnostics $4.9B Life Sciences $2.4B Matco/Hennessy $0.6B Pall $2.8B Aggregate revenues from continuing operations for FY 2015E, adjusted to reflect Pall revenues only for Pall FY ended July 31, 2015. Sensors & Controls $0.6B Specialty Industrial $0.4B
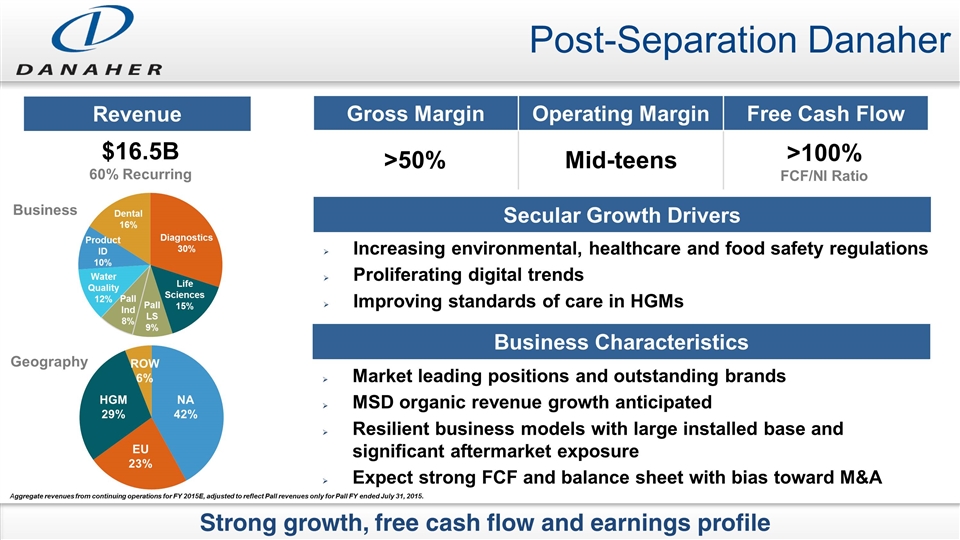
Secular Growth Drivers Revenue Gross Margin Operating Margin Free Cash Flow Post-Separation Danaher Strong growth, free cash flow and earnings profile ROW 6% NA 42% EU 23% HGM 29% Diagnostics 30% Life Sciences 15% Product ID 10% Dental 16% Water Quality 12% Pall Ind 8% Pall LS 9% Business Geography $16.5B 60% Recurring >50% Mid-teens >100% FCF/NI Ratio Business Characteristics Market leading positions and outstanding brands MSD organic revenue growth anticipated Resilient business models with large installed base and significant aftermarket exposure Expect strong FCF and balance sheet with bias toward M&A Increasing environmental, healthcare and food safety regulations Proliferating digital trends Improving standards of care in HGMs Aggregate revenues from continuing operations for FY 2015E, adjusted to reflect Pall revenues only for Pall FY ended July 31, 2015.
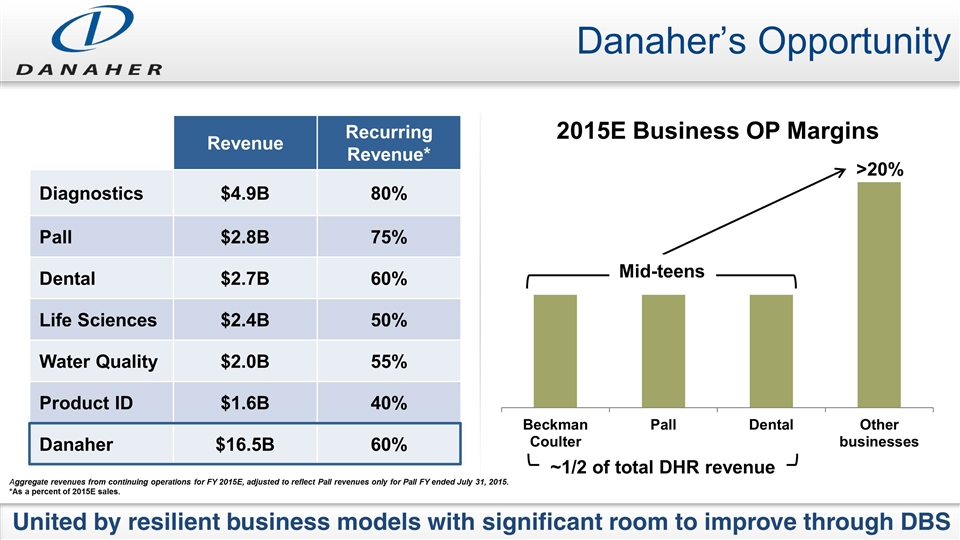
Danaher’s Opportunity United by resilient business models with significant room to improve through DBS Revenue Recurring Revenue* Diagnostics $4.9B 80% Pall $2.8B 75% Dental $2.7B 60% Life Sciences $2.4B 50% Water Quality $2.0B 55% Product ID $1.6B 40% Danaher $16.5B 60% >20% Mid-teens ~1/2 of total DHR revenue Aggregate revenues from continuing operations for FY 2015E, adjusted to reflect Pall revenues only for Pall FY ended July 31, 2015. *As a percent of 2015E sales.
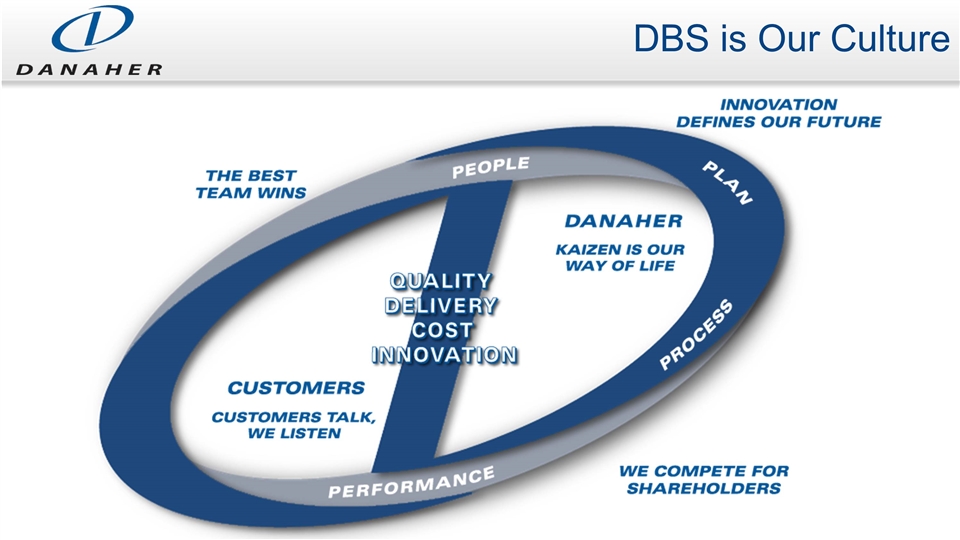
DBS is Our Culture
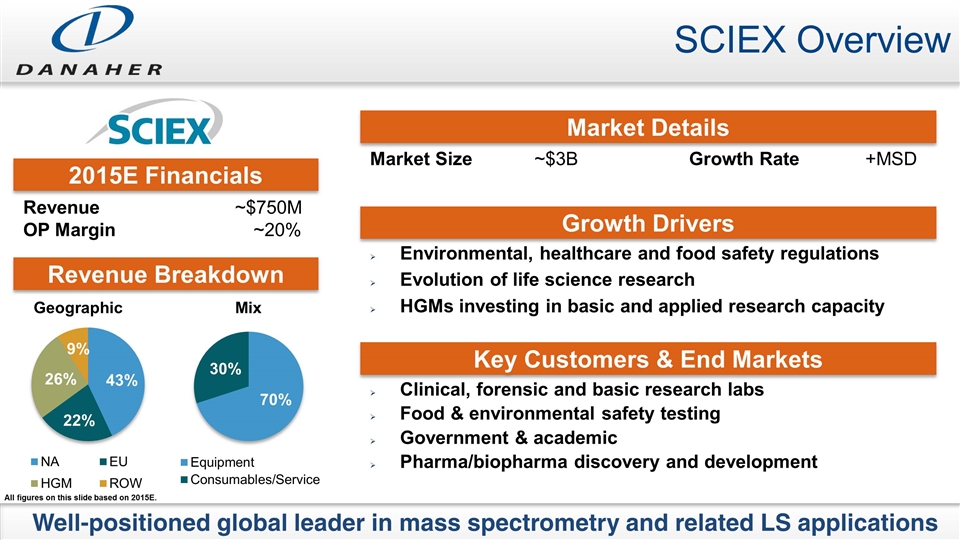
SCIEX Overview Well-positioned global leader in mass spectrometry and related LS applications All figures on this slide based on 2015E. Environmental, healthcare and food safety regulations Evolution of life science research HGMs investing in basic and applied research capacity Revenue Breakdown Geographic Mix 43% 22% 26% 70% 30% 2015E Financials Revenue ~$750M OP Margin ~20% Growth Drivers Key Customers & End Markets Clinical, forensic and basic research labs Food & environmental safety testing Government & academic Pharma/biopharma discovery and development Market Details Market Size ~$3B Growth Rate +MSD 9%
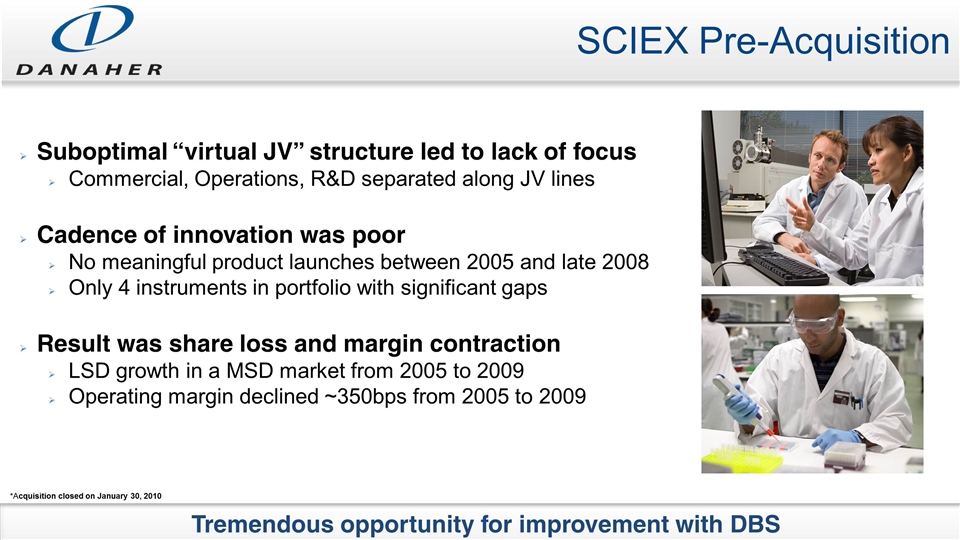
SCIEX Pre-Acquisition Tremendous opportunity for improvement with DBS *Acquisition closed on January 30, 2010 Suboptimal “virtual JV” structure led to lack of focus Commercial, Operations, R&D separated along JV lines Cadence of innovation was poor No meaningful product launches between 2005 and late 2008 Only 4 instruments in portfolio with significant gaps Result was share loss and margin contraction LSD growth in a MSD market from 2005 to 2009 Operating margin declined ~350bps from 2005 to 2009
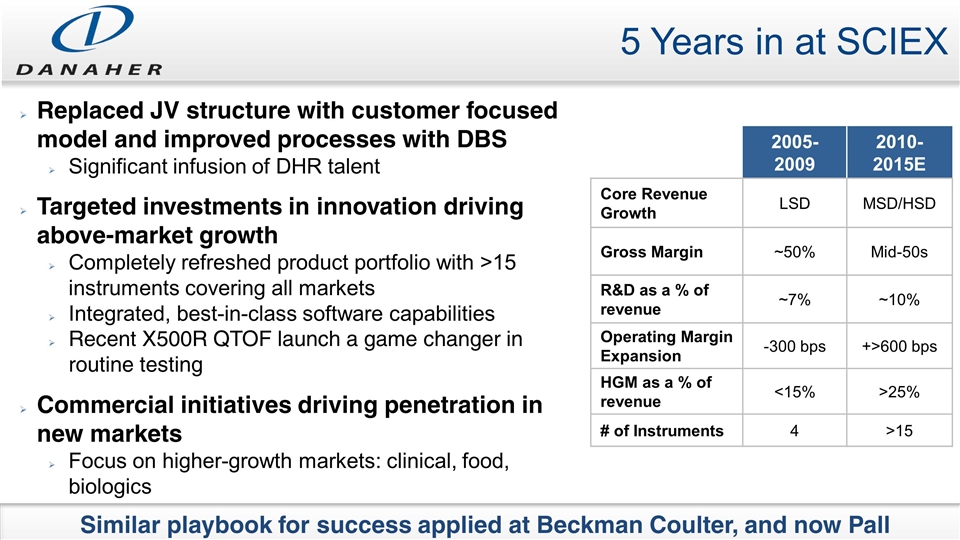
5 Years in at SCIEX Similar playbook for success applied at Beckman Coulter, and now Pall Replaced JV structure with customer focused model and improved processes with DBS Significant infusion of DHR talent Targeted investments in innovation driving above-market growth Completely refreshed product portfolio with >15 instruments covering all markets Integrated, best-in-class software capabilities Recent X500R QTOF launch a game changer in routine testing Commercial initiatives driving penetration in new markets Focus on higher-growth markets: clinical, food, biologics 2005-2009 2010-2015E Core Revenue Growth LSD MSD/HSD Gross Margin ~50% Mid-50s R&D as a % of revenue ~7% ~10% Operating Margin Expansion -300 bps +>600 bps HGM as a % of revenue <15% >25% # of Instruments 4 >15
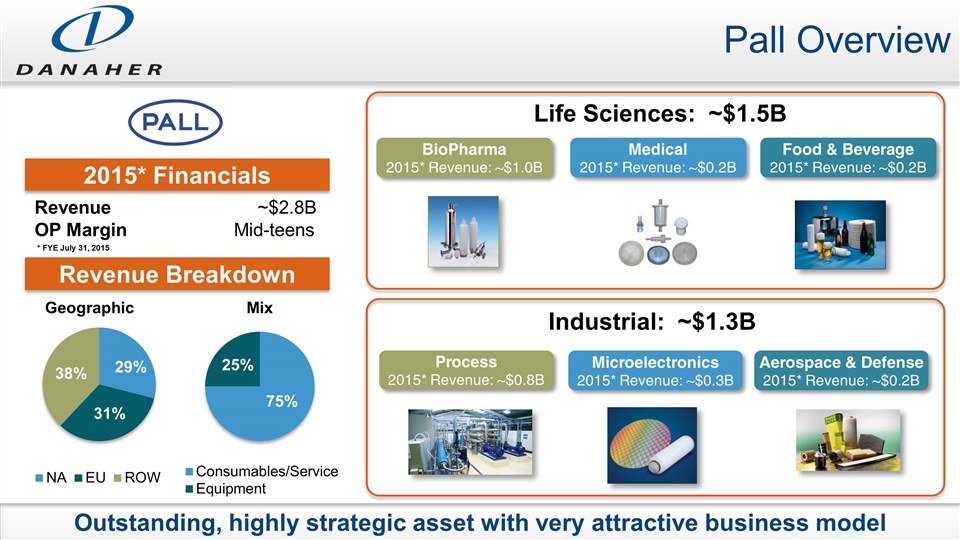
Pall Overview 2015* Financials Revenue ~$2.8B OP Margin Mid-teens Revenue Breakdown Outstanding, highly strategic asset with very attractive business model * FYE July 31, 2015 Geographic Mix 29% 31% 38% 75% 25% BioPharma 2015* Revenue: ~$1.0B Medical 2015* Revenue: ~$0.2B Food & Beverage 2015* Revenue: ~$0.2B Process 2015* Revenue: ~$0.8B Microelectronics 2015* Revenue: ~$0.3B Aerospace & Defense 2015* Revenue: ~$0.2B Life Sciences: ~$1.5B Industrial: ~$1.3B
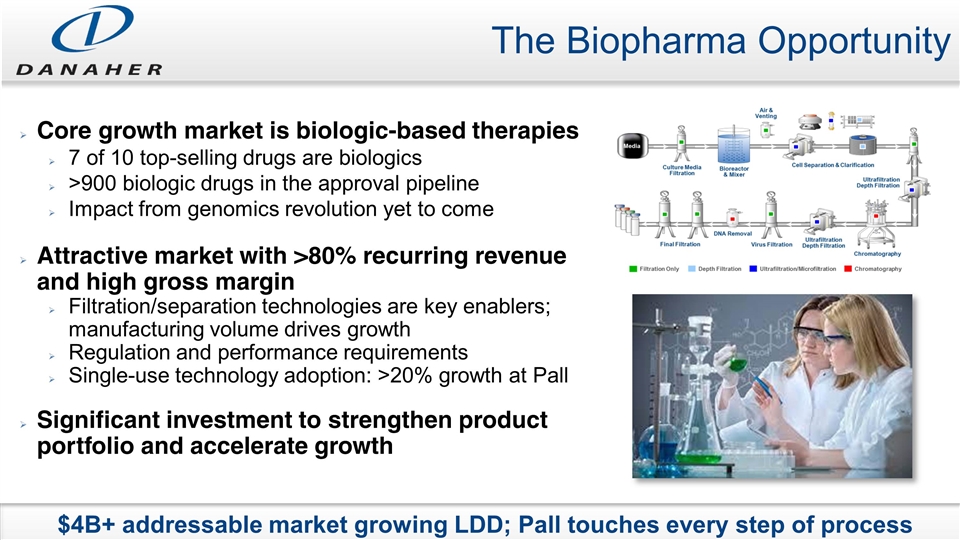
The Biopharma Opportunity $4B+ addressable market growing LDD; Pall touches every step of process Core growth market is biologic-based therapies 7 of 10 top-selling drugs are biologics >900 biologic drugs in the approval pipeline Impact from genomics revolution yet to come Attractive market with >80% recurring revenue and high gross margin Filtration/separation technologies are key enablers; manufacturing volume drives growth Regulation and performance requirements Single-use technology adoption: >20% growth at Pall Significant investment to strengthen product portfolio and accelerate growth
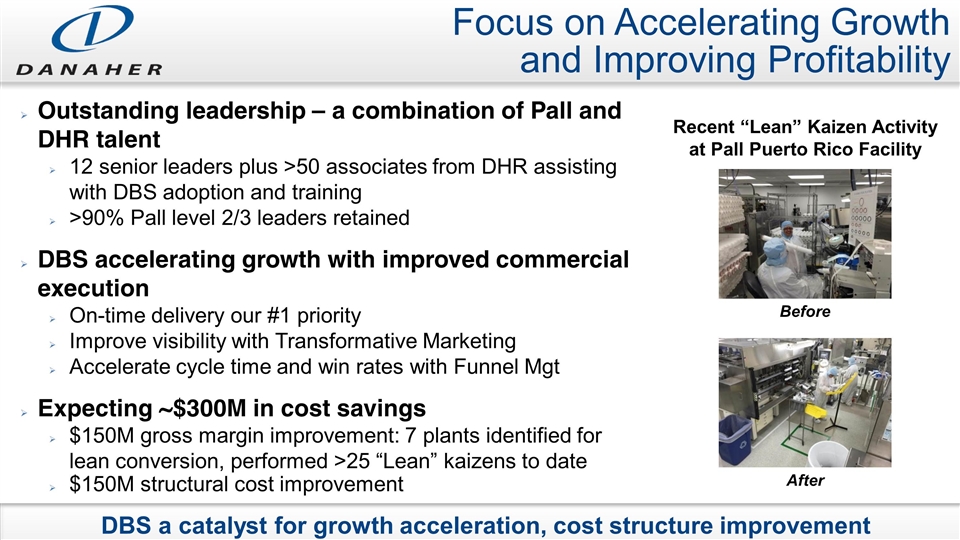
Focus on Accelerating Growth and Improving Profitability DBS a catalyst for growth acceleration, cost structure improvement Outstanding leadership – a combination of Pall and DHR talent 12 senior leaders plus >50 associates from DHR assisting with DBS adoption and training >90% Pall level 2/3 leaders retained DBS accelerating growth with improved commercial execution On-time delivery our #1 priority Improve visibility with Transformative Marketing Accelerate cycle time and win rates with Funnel Mgt Expecting ~$300M in cost savings $150M gross margin improvement: 7 plants identified for lean conversion, performed >25 “Lean” kaizens to date $150M structural cost improvement Before After Recent “Lean” Kaizen Activity at Pall Puerto Rico Facility
Summary Post-separation Danaher well-positioned to drive future earnings outperformance Significant improvement at SCIEX 5 years post acquisition, driven by DBS DBS will help lead the way at Pall, sharpening focus on profitability and accelerating growth
