Attached files
| file | filename |
|---|---|
| EX-23.1 - EX-23.1 - AMERIQUEST, INC. | a2226550zex-23_1.htm |
| EX-10.20 - EX-10.20 - AMERIQUEST, INC. | a2226550zex-10_20.htm |
| EX-10.21 - EX-10.21 - AMERIQUEST, INC. | a2226550zex-10_21.htm |
Use these links to rapidly review the document
TABLE OF CONTENTS
Index to Consolidated Financial Statements
As filed with the Securities and Exchange Commission January 12, 2016
Registration No. 333-207897
UNITED STATES
SECURITIES AND EXCHANGE COMMISSION
Washington, D.C. 20549
AMENDMENT NO. 1
to
FORM S-1
REGISTRATION STATEMENT
Under
The Securities Act of 1933
AMERIQUEST, INC.
(Exact name of Registrant as specified in its charter)
| Delaware (State or other jurisdiction of incorporation or organization) |
7374 (Primary Standard Industrial Classification Code Number) |
47-3684547 (I.R.S. Employer Identification Number) |
AmeriQuest, Inc.
457 Haddonfield Road
Suite 220
Cherry Hill, NJ 08002
(800) 608-0809
(Address, including zip code, and telephone number, including area code, of Registrant's principal executive offices)
Douglas W. Clark
President and Chief Executive Officer
9045 Strada Stell Court
Suite 301
Naples, FL 34109
(800) 608-0809
(Name, address, including zip code, and telephone number, including area code, of agent for service)
| Copies to: | ||||
Jeffrey D. Saper, Esq. Michael C. Labriola, Esq. Kenisha D. Nicholson, Esq. Wilson Sonsini Goodrich & Rosati, P.C. 1700 K Street NW, Fifth Floor Washington, DC 20006 (202) 973-8800 |
Mark Joyce Executive Vice President and Chief Financial Officer AmeriQuest, Inc. 2651 Warrenville Road Suite 560 Downers Grove, IL 60515 (800) 608-0809 |
Keith Townsend, Esq. Laura Bushnell, Esq. Carrie Ratliff, Esq. King & Spalding LLP 1180 Peachtree Street, N.E. Atlanta, GA 30309 (404) 572-4600 |
||
Approximate date of commencement of proposed sale to the public:
As soon as practicable after the effective date of this Registration Statement.
If any of the securities being registered on this Form are to be offered on a delayed or continuous basis pursuant to Rule 415 under the Securities Act of 1933, check the following box. o
If this Form is filed to register additional securities for an offering pursuant to Rule 462(b) under the Securities Act, please check the following box and list the Securities Act registration statement number of the earlier effective registration statement for the same offering. o
If this Form is a post-effective amendment filed pursuant to Rule 462(c) under the Securities Act, check the following box and list the Securities Act registration statement number of the earlier effective registration statement for the same offering. o
If this Form is a post-effective amendment filed pursuant to Rule 462(d) under the Securities Act, check the following box and list the Securities Act registration statement number of the earlier effective registration statement for the same offering. o
Indicate by check mark whether the registrant is a large accelerated filer, an accelerated filer, a non-accelerated filer, or a smaller reporting company. See the definitions of "large accelerated filer," "accelerated filer" and "smaller reporting company" in Rule 12b-2 of the Exchange Act.
| Large accelerated filer o | Accelerated filer o | Non-accelerated filer ý (Do not check if a smaller reporting company) |
Smaller reporting company o |
CALCULATION OF REGISTRATION FEE
|
||||||||
| Title of Each Class of Securities to be Registered |
Amount to be Registered(1) |
Proposed Maximum Aggregate Price Per Share |
Proposed Maximum Aggregate Offering Price(1)(2) |
Amount of Registration Fee(3) |
||||
|---|---|---|---|---|---|---|---|---|
Common Stock, par value $0.001 per share |
7,076,922 | $13.00 | $91,999,986 | $9,265 | ||||
|
||||||||
- (1)
- Includes
shares the underwriters have the option to purchase to cover over-allotments, if any.
- (2)
- Estimated
solely for the purpose of computing the amount of the registration fee pursuant to Rule 457(a) under the Securities Act of 1933, as
amended.
- (3)
- The Registrant previously paid $7,553 in connection with prior filing of this Registration Statement.
The Registrant hereby amends this Registration Statement on such date or dates as may be necessary to delay its effective date until the Registrant shall file a further amendment which specifically states that this Registration Statement shall thereafter become effective in accordance with Section 8(a) of the Securities Act of 1933 or until the Registration Statement shall become effective on such date as the Commission, acting pursuant to said Section 8(a) may determine.
The information in this prospectus is not complete and may be changed. We and the selling stockholders may not sell these securities until the registration statement filed with the Securities and Exchange Commission is effective. This prospectus is not an offer to sell these securities and it is not soliciting an offer to buy these securities in any jurisdiction where the offer or sale is not permitted.
PROSPECTUS (Subject to completion)
Issued January 12, 2016
6,153,846 Shares

This is the initial public offering of common stock of AmeriQuest, Inc. Prior to this offering, no public market has existed for our common stock. We are offering 6,153,846 shares. We currently estimate that the initial public offering price will be between $11.00 and $13.00 per share. We have applied to list our common stock on the NASDAQ Global Market under the symbol "AMQ."
Investing in our common stock involves a high degree of risk. See "Risk Factors" beginning on page 12.
| |
Per Share | Total | |||||
|---|---|---|---|---|---|---|---|
Initial public offering price |
$ | $ | |||||
Underwriting discounts and commissions(1) |
$ | $ | |||||
Proceeds to us, before expenses |
$ | $ | |||||
- (1)
- Please see the section of this prospectus entitled "Underwriting" for additional information regarding underwriter compensation.
The selling stockholders identified in this prospectus have granted the underwriters the right to purchase up to an additional 923,076 shares of common stock at the price to public less underwriting discounts and commissions. The underwriters can exercise this option within 30 days from the date of this prospectus. We will not receive any of the proceeds from any sale of shares by the selling stockholders.
We are an "emerging growth company" as defined under U.S. federal securities laws and, as such, may elect to comply with certain reduced public company reporting requirements after this offering.
Neither the Securities and Exchange Commission nor any state securities commission has approved or disapproved these securities or determined if this prospectus is truthful or complete. Any representation to the contrary is a criminal offense.
The underwriters expect to deliver the shares of our common stock to purchasers on or about , 2016.
| RAYMOND JAMES | STEPHENS INC. |
| BAIRD | WILLIAM BLAIR |
The date of this prospectus is , 2016

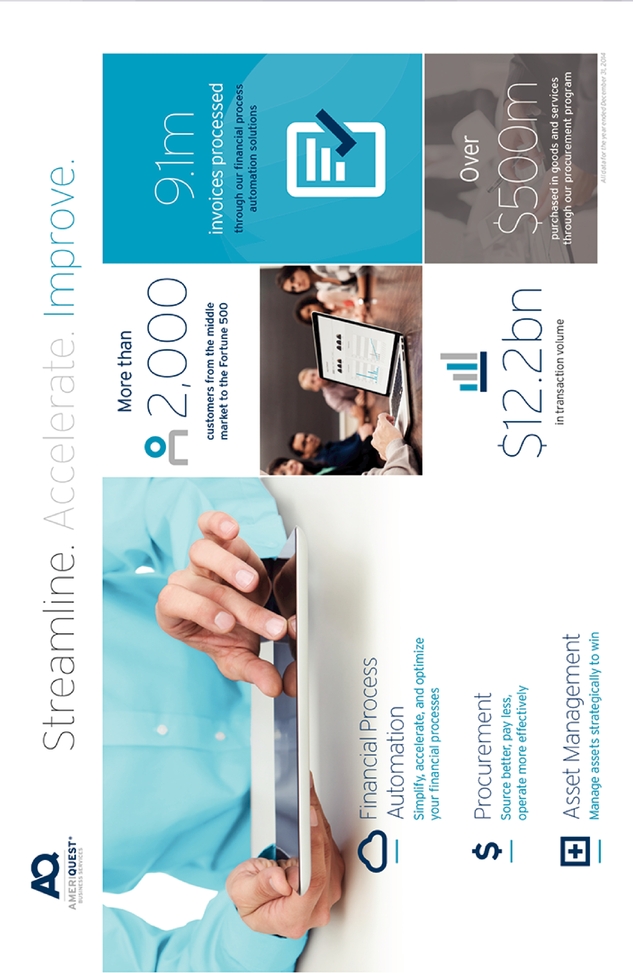
TABLE OF CONTENTS
Neither we, the selling stockholders nor the underwriters have authorized anyone to provide you with information that is different from that contained in this prospectus or in any free writing prospectus we may authorize to be delivered or made available to you. We take no responsibility for, and can provide no assurance as to the reliability of, any other information that others may give you. We, the selling stockholders and the underwriters are offering to sell shares of common stock and seeking offers to buy shares of common stock only in jurisdictions where offers and sales are permitted. The information contained in this prospectus is accurate only as of the date on the front of this prospectus, regardless of the time of delivery of this prospectus or any sale of shares of our common stock. Our business, financial condition, results of operations and prospects may have changed since that date.
Until , 2016 (25 days after the date of this prospectus), all dealers that buy, sell or trade shares of our common stock, whether or not participating in this offering, may be required to deliver a prospectus. This delivery requirement is in addition to the obligation of dealers to deliver a prospectus when acting as underwriters and with respect to their unsold allotments or subscriptions.
For investors outside the United States: neither we, the selling stockholders nor any of the underwriters have done anything that would permit this offering, or possession or distribution of this prospectus, in any jurisdiction where action for that purpose is required, other than in the United States. Persons outside the United States who come into possession of this prospectus must inform themselves about, and observe any restrictions relating to, the offering of the shares of common stock and the distribution of this prospectus outside of the United States.
This summary highlights information contained elsewhere in this prospectus and does not contain all of the information that you should consider in making your investment decision. Before investing in our common stock, you should carefully read this entire prospectus, including our consolidated financial statements and the related notes thereto and the information set forth under the sections "Risk Factors" and "Management's Discussion and Analysis of Financial Condition and Results of Operations," in each case included in this prospectus. Some of the statements in this prospectus constitute forward-looking statements. See "Cautionary Note Regarding Forward-Looking Statements."
Unless the context requires otherwise, the words "we," "us," "our," "our company" and "our business" refer to AmeriQuest, Inc., a Delaware corporation, and prior to the reorganization described elsewhere in this prospectus summary, AmeriQuest Business Services, Inc., a New Jersey corporation, and in each case, their consolidated subsidiaries.
Overview
We are a growing provider of technology-enabled business-to-business solutions that address the financial process, procurement and asset management needs of businesses. Our solutions are designed to eliminate the inefficiency, expense and lost opportunities caused by traditional paper-based processes, allowing our customers to be competitive. We leverage our deep industry expertise, proprietary technology and customer and supplier relationships to help enterprises and organizations of varying sizes manage complex and dynamic operational and administrative processes that are frequently managed manually and require substantial internal resources. While we originated as a provider of procurement and fleet management solutions for the transportation industry, we have used our technology and the expertise we developed to offer robust financial process automation solutions and more advanced procurement solutions to companies in multiple industries in recent years.
Our financial process automation solutions consist primarily of our cloud-based technology offerings that automate accounts receivable and accounts payable processes for our customers, including e-invoicing, credit and collections management, working capital management and reporting analytics. These solutions are delivered through two products: our accounts receivable automation platform; and our accounts payable automation platform. Our procurement solutions leverage our financial process automation technology to conduct group purchasing, predominantly for goods supporting the transportation industry, enabling companies to optimize their procurement processes from sourcing through payment. Our asset management solutions provide data-driven strategic planning, asset acquisition and disposition, and asset financing and usage alternatives to help businesses, predominantly in the transportation industry, to lower the total cost of capital asset ownership. Our cloud-based solutions are highly scalable and offered in an à la carte format, so that our customers can selectively purchase those solutions that they need. These complementary business solutions enable us to capitalize on our customer and supplier network, cross-selling opportunities and operational scale.
PayStream Advisors, a third-party research and consulting firm, estimates that business-to-business trade in the United States was conducted through 16.5 billion invoices distributed among approximately 10 million businesses during 2013. Entities of various sizes incur substantial costs to process and facilitate these business-to-business transactions. Traditionally, these transactions have been paper-based, labor-intensive and error-prone. Moreover, many businesses lack scale, real-time data and specialized personnel for these transactions, all of which can cause operational inefficiencies and excess cost.
We have provided technology-enabled solutions to the transportation sector for nearly twenty years. However, we expanded our focus in recent years, and our financial process automation solutions and our procurement solutions now offer a comprehensive suite of technology-enabled services to
1
purchasers and suppliers in other sectors, including the manufacturing, retail, energy, higher education and media industries. During the year ended December 31, 2014, we serviced over 2,250 customers varying by size and industry, including Daimler Trucks North America, LLC, or Daimler, the University of Florida, Dot Transportation, Inc. and Cardinal Logistics Management Corporation. We processed $12.2 billion in transaction volume and 9.2 million transactions through our financial process automation and procurement solutions for our customers and their transaction partners during the year ended December 31, 2014.
We have experienced substantial growth as we have expanded into new sectors. Our total revenue was $57.6 million, $67.4 million and $84.8 million during the years ended December 31, 2012, 2013 and 2014, respectively, a compound annual growth rate, or CAGR, of 21.4% over those periods. Our net income was $0.6 million, $4.6 million and $6.8 million during the years ended December 31, 2012, 2013 and 2014, respectively. Our adjusted EBITDA(1) was $12.6 million, $21.6 million and $25.9 million during the years ended December 31, 2012, 2013 and 2014, respectively, representing a CAGR of 43.3% over those periods. Our total revenue was $63.9 million and $65.2 million, our net income was $4.6 million and $4.2 million and our adjusted EBITDA was $18.3 million and $21.0 million during the nine months ended September 30, 2014 and 2015, respectively.
Industry background and trends
We believe a significant market opportunity exists for technology-enabled business-to-business solutions that assist enterprises with their financial process, procurement and asset management needs. These traditional processes are often poorly managed or controlled within a business, resulting in several common challenges:
Traditional, manual business-to-business processes are often expensive and error-prone. Ardent Partners recently estimated that "best-in-class" corporations experience invoice exceptions at less than half the rate experienced by other businesses. These best-in-class businesses are characterized by a high level of standardized accounts payable processes, automated approval routing and straight-through invoice processing. Ardent Partners estimates that these best-in-class businesses process accounts payable invoices at over 86% lower cost and over 78% faster than other businesses.
Achieving the benefits of scale is difficult even for large organizations. Many suppliers provide improved pricing with greater purchasing volume. Businesses that lack sufficient purchasing volume for certain goods and services may receive inferior pricing as compared to competitors, notwithstanding that procurement spending may be a relatively large and material element of their business.
Traditional finance and procurement overhead is often fixed. Finance and procurement personnel costs are typically fixed and not easily scaled to respond to fast-changing business conditions. Businesses need more staff during periods of growth and fewer staff during slowdowns. In addition, manual staffing is inherently difficult to size, even at its most effective, in smaller organizations. Businesses are also reluctant to invest in qualified and experienced administrative and operations personnel due to unpredictable market conditions.
Multi-party business transactions are complex. The average U.S. business annually transacts with hundreds of counterparties, including customers, partners, and suppliers, creating complex multi-
- (1)
- Adjusted EBITDA is a financial measure that is not calculated in accordance with U.S. generally accepted accounting principles, or GAAP. A reconciliation of this non-GAAP measure to the most directly comparable GAAP measure along with a summary of the definition and its material limitations are included at "Selected Consolidated Financial Data—Other key financial metrics—Adjusted EBITDA."
2
party transactions. These participants frequently operate without a common system to communicate in an automated and paperless environment, often relying on several different types of electronic data interchange, or EDI, systems and data formats, which also increases the complexity of transactions.
Increased need for real-time visibility and effective internal controls. Businesses are operating in an increasingly fast-paced, complex and global environment. Enabling fast and accurate decision-making with real-time and reliable information is critical to the long-term success of most organizations. Beyond the business incentive, many businesses are also subject to increasing demands on their internal controls structure imposed by increased regulations.
Managing working capital efficiently can be challenging. Many companies have the opportunity to enhance stockholder value by managing working capital more efficiently but are encumbered by a number of internal challenges. Aberdeen Group estimates that comprehensive accounts payable automation solutions increase a business's early payment discount savings by up to 340 basis points as compared to businesses without a centralized, automated accounts payable system. At the same time, many suppliers lack the resources to efficiently manage the large number of customers that they service.
Legacy business-to-business systems lack modern architecture and desired user experience. Users expect immediate and secure access to their enterprises' critical business information, but many business-to-business applications do not offer an optimized user experience, availability on personal mobile devices and ease-of-deployment.
Our solutions
Our solutions are designed to leverage our industry experience and investments in technology to address common challenges for businesses of various sizes and across a variety of industries.
Financial process automation solutions
Our cloud-based financial process automation solutions address key participants in the business-to-business community, including manufacturers, suppliers, dealers, distributors, trading partners and end customers. We enable companies to streamline, automate and manage transaction processes including e-invoicing, accounts payable, accounts receivable, collections, order management, credit risk management, reporting and payments. Our financial process automation solutions provide the following key benefits:
Automation of manual, labor-intensive processes. By transforming manual, paper-based purchase order and invoice processes to automated and electronic processes, our solutions help companies eliminate unnecessary overhead and error risk related to these tasks.
Seamless integration. Our cloud-based financial process automation and procurement solutions utilize our proprietary transaction engine technology to enable fast connections among trading partners by turning every trading transaction into standardized data that is transmitted real-time into the relevant system.
Increased visibility and reporting capabilities. Customers benefit from end-to-end visibility into transaction processes, which enables them to maintain visibility of and collaboration among buyers and sellers and to automate entire accounts receivable and accounts payable departments without compromising business requirements.
Access to channel finance and credit and collections management. Our accounts receivable financial process automation solutions provide channel finance to a closed community of purchasers that
3
vary by size and industry, allowing suppliers to reduce and often minimize their credit exposure to significant segments of their customer base.
Cloud-based delivery with enhanced user experience. Our financial process automation solutions utilize a cloud-based Business-Process-as-a-Service, or BPaaS, delivery model and provide a modern and intuitive user interface.
Deep domain and best practices expertise. Our financial process automation solutions are supported by our long history in financial process management.
Procurement solutions
Our procurement solutions enable organizations to realize the benefits of volume-based, electronic procurement by identifying and establishing contracts with suppliers, aggregating the collective purchasing power of all participating customers and promoting process efficiencies of electronic transactions. Our procurement solutions provide the following key benefits:
High-volume purchasing power. We aggregate the purchasing power of our customers to provide pricing comparable to that available to high-volume purchasers, allowing our customers to more effectively compete.
Enhanced access to supplier network and purchasers. Our purchasers gain access to more than 5,000 dealers and distributors for over 135 suppliers currently using our solution. At the same time, we assume credit responsibility for customers purchasing through our system and guarantee timely payment to suppliers, allowing suppliers to reach more customers.
Strategic procurement expertise. Our supply management team has deep expertise in strategic sourcing, contract and price negotiation, supplier selection and supplier relationship management.
Seamless integration. Our cloud-based procurement solutions are delivered entirely using our proprietary transaction engine, the same interface platform that supports our cloud-based financial process automation solutions, which enables fast and standardized communication among participants.
Enhanced user experience. Our customers and suppliers input and process their transactions through our financial process automation platform, allowing purchasers the benefit of a comprehensive buyer's guide, workflow improvement tools and automated spending analysis in addition to our procurement pricing benefits. Purchaser and supplier user experiences are designed to be intuitive and accessible to novice users with minimal training.
Asset management solutions
Our asset management solutions provide data-driven strategic planning, asset acquisition and disposition strategies, and asset financing and asset utilization alternatives, all of which are designed to lower the total cost of capital asset ownership. Although these solutions are presently focused on the transportation industry, we believe they have application across a variety of industries with similar needs. Our solutions provide the following key benefits:
Data-driven asset management strategy. Utilizing our proprietary technology platform and deep transportation industry expertise, we can provide businesses with analyses of their current asset usage and suggest alternative strategies, allowing our customers to gain operational leverage by lowering the total cost of ownership of capital equipment.
4
Lower asset acquisition costs and optimum resale gains. When capital equipment is identified and specified properly by an acquirer, and is part of an overall asset lifecycle strategy, companies benefit from lower asset acquisition costs, and can also dispose of their assets at the optimal time to ensure maximum residual value.
Deep domain expertise in asset management and regulatory compliance. Our established relationships with some of the country's largest lenders allow us to provide advice and access strategic financing for our customers for the full lifecycle of capital assets. Our asset management experts also have deep knowledge of asset regulations and mandates.
Our strengths
We believe that we are well positioned to benefit from the transformations occurring in the business-to-business transaction market, including the growing trend toward enterprise-wide automation. Our key competitive strengths include:
End-to-end solution suite. Our flexible, menu-driven approach allows companies to select individual services from our solutions in order to maximize value and impact. Our financial process automation solutions address the full procure-to-pay cycle and the full order-to-cash sales cycle. Our procurement and asset management solutions assist in managing the procurement and full capital asset purchase and use cycle needs of our customers.
Highly scalable, proprietary technology. Our proprietary financial process automation and procurement solutions are delivered via a cloud-based BPaaS model. Our infrastructure has the flexibility to support significant growth in transaction volume from new and existing customers. As an example, since December 31, 2012, our financial process automation and procurement solutions transaction volume has increased from $3.4 billion to $12.2 billion, or 259%, and the number of transactions has increased from 2.7 million to 9.2 million, or 241%, without the need for substantial capital expenditures or significant changes to our technology infrastructure to support the increased demands on our solutions.
Powerful network effect. Our proprietary CorConnect solution is a closed-loop private commerce network that connects an entire purchasing cycle ecosystem—suppliers, dealers, distributors, vendors and purchasers. As our networks of purchasers and suppliers grow, they become more powerful and mutually reinforcing, increasing the value and desirability of participation in our solutions.
Strong customer retention. We focus extensively on assisting our customers to maximize their benefit from our solutions, and we frequently engage with our customers to continue to improve our offerings to meet their needs. As an illustration, 96% of our top 100 financial process automation and procurement solutions customers in 2012 made purchases from us in the nine month period ended September 30, 2015. We determined our top 100 financial process automation and procurement solutions customers based on our customers' overall gross transaction volume in dollars in 2012.
Deep domain expertise. We have deep domain experience and are an established leader in the transportation industry. In 2014, approximately a third of North America's 100 largest private trucking fleets utilized us for one or more of our financial process automation, procurement or asset management solutions.
Highly visible business model. Our transaction-based model with volume minimums for our financial process automation solutions and consistency of customer transaction levels year-over-year for our procurement solutions provide strong visibility of future revenue, enhancing our ability to effectively manage our business.
5
Our growth strategy
Our key strategic initiatives include:
Selectively expand into new markets. We intend to continue to selectively expand into new markets in which we can leverage our domain expertise, particularly in industries lagging in the adoption of paperless solutions for processes such as procurement and billing.
Further penetrate our existing markets. We will continue to invest in sales and marketing to increase our profile within the transportation industry, while also increasing our emphasis on customer acquisition opportunities in adjacent industries, such as manufacturing and industrials.
Capitalize on cross-selling opportunities. As of December 31, 2014, only 9% of our customers purchased more than one of our solutions during the fiscal year then ended, which we believe provides a substantial sales opportunity within our existing base of more than 2,250 customers. As we expand our product capabilities to include additional features, we expect our customers will perceive and derive even greater value from our platform and expand their use in the future.
Leverage our technology offerings. We intend to enhance our collaboration with our customers and continue to build functionality to address their needs and requirements. The investment in our software solutions, expansion of our procurement capabilities and development of new applications, features and functionality should allow us to expand our addressable market across other verticals.
Selectively pursue acquisitions. We may pursue acquisitions of businesses, technologies and solutions that are complementary to our existing offerings. We may also pursue acquisitions that allow us to expand into new industries or geographies where we do not currently have a significant presence.
Risks affecting us
Investing in our common stock involves risk. You should carefully consider all the information in this prospectus prior to investing in our common stock. These risks are discussed more fully in the section entitled "Risk Factors" immediately following this prospectus summary. These risks and uncertainties include, but are not limited to, the following:
- •
- our failure to adequately assess and monitor the credit risks of our customers;
- •
- our dependence on a small number of customer relationships, such as with Daimler;
- •
- a loss of or decrease in sales from key customers or supplier relationships;
- •
- long and unpredictable sales cycles that require significant employee time and financial resources;
- •
- our inability to effectively expand the reach of our existing products to new customers and new markets and sustain recent growth
rates;
- •
- our inability to compete effectively; and
- •
- declines in general economic conditions, and in particular, demand for products and services offered through our procurement solutions.
Corporate information and reorganization
We were originally organized in 1996 as a New Jersey corporation. In September 2015, we effected a corporate reorganization. Pursuant to this reorganization, AmeriQuest, Inc., a Delaware corporation formed in April 2015, acquired all of the outstanding shares of capital stock of AmeriQuest Business
6
Services, Inc., or ABI, in a share exchange. Following such reorganization, ABI became a wholly owned subsidiary of AmeriQuest, Inc., the issuer in this offering.
Our principal executive offices are located at 457 Haddonfield Road, Suite 220, Cherry Hill, NJ 08002, and our telephone number is (800) 608-0809. You can access our website at www.ameriquestcorp.com. Information contained on our website is not part of this prospectus and is not incorporated in this prospectus by reference.
We have registered the AMERIQUEST, AMERIQUEST TRANSPORTATION SERVICES, COR360 and ONECONNECT trademarks in the U.S. in certain classes of goods and services applicable to our business. We have several other trademarks, service marks and pending applications relating to our solutions, including for CORCONNECT and CORCENTRIC. Solely for convenience, trademarks, service marks and trade names referred to in this prospectus may appear without the ®, TM or SM symbols, but such references are not intended to indicate, in any way, that we will not assert, to the fullest extent under applicable law, our rights or the right of the applicable licensor to these trademarks, service marks and trade names. This prospectus may also contain trademarks, service marks, trade names and copyrights of other companies, which are the property of their respective owners.
7
Common stock offered by us |
6,153,846 shares | |
Common stock to be outstanding after this offering |
19,043,814 shares |
|
Underwriters' option |
The underwriters have been granted a 30-day option to purchase up to an additional 923,076 shares, all of which will be sold by the selling stockholders named herein. |
|
Use of proceeds |
We estimate that the net proceeds to us from the sale of our common stock in this offering will be approximately $63.6 million, based on an assumed initial public offering price of $12.00 per share, which is the midpoint of the price range listed on the cover page of this prospectus, after deducting estimated underwriting discounts and commissions and estimated offering expenses payable by us. |
|
|
The principal purposes of this offering are to create a public market for our common stock and to facilitate our future access to the public capital markets, as well as to obtain additional capital. We may use a portion of the proceeds from this offering for future acquisitions of complementary businesses, technologies or other assets, although we do not currently have any plans for any acquisitions. In addition, if we do not apply some or all of the proceeds towards acquisitions, we may use some of the remaining net proceeds from this offering to reduce the outstanding indebtedness under the long-term promissory notes issued in connection with purchase of equipment for certain of our asset management leasing operations, and we may use the remainder of the net proceeds from this offering for working capital and general corporate purposes, which may include investing in our sales and marketing and product enhancement efforts. We will not receive any proceeds from the shares sold by selling stockholders, if any. See "Use of Proceeds." |
|
Directed share program |
At our request, the underwriters have reserved up to 5.0% of the shares of common stock offered by this prospectus for sale, at the initial public offering price, to our directors, officers, employees and business associates, including certain of our customers, suppliers and other persons with which we have an existing business relationship. If these persons purchase shares, this will reduce the number of shares available for sale to the public. |
|
Risk factors |
See "Risk Factors" and other information included in this prospectus for a discussion of factors you should carefully consider before deciding to invest in shares of our common stock. |
|
Proposed NASDAQ Global Market symbol |
"AMQ" |
8
The number of shares of our common stock that will be outstanding after this offering is based on 12,889,968 shares of our common stock outstanding as of September 30, 2015. This number excludes:
- •
- 4,005,000 shares of common stock issuable upon exercise of options outstanding at a weighted-average exercise price of $2.21 per share
under our Equity and Incentive Plan as of September 30, 2015, which plan will terminate as to new awards following this offering;
- •
- an additional 403,628 shares of our common stock reserved for future issuance under our Equity and Incentive Plan as of
September 30, 2015, which plan will terminate as to new awards following this offering;
- •
- an additional 1,462,020 shares of our common stock reserved for future issuance under our 2011 Director Stock Purchase Plan and 2011
Employee Stock Purchase Plan as of September 30, 2015, which plans will terminate as to new awards following this offering;
- •
- an additional 2,933,332 shares of our common stock to be reserved for future issuance under our 2015 Equity Incentive Plan following
this offering; and
- •
- an additional 266,668 shares of our common stock to be reserved for future issuance under our 2015 Employee Stock Purchase Plan following this offering.
Except as otherwise indicated herein, all information in this prospectus, including the number of shares that will be outstanding after this offering, assumes or gives effect to:
- •
- a 4-for-1 forward stock split effective January 12, 2016; and
- •
- no exercise of options outstanding as of September 30, 2015.
9
SUMMARY CONSOLIDATED FINANCIAL DATA
In the following tables, we provide our summary consolidated financial data. We have derived the summary consolidated statements of income for the years ended December 31, 2012, 2013 and 2014 from our audited consolidated financial statements appearing elsewhere in this prospectus. We have derived the summary consolidated statement of income for the nine months ended September 30, 2014 and 2015 and balance sheet data as of September 30, 2015 from our unaudited consolidated interim financial statements appearing elsewhere in this prospectus. The unaudited consolidated financial data for the nine months ended September 30, 2014 and 2015 and as of September 30, 2015 includes all adjustments, consisting only of normal recurring accruals that are necessary in the opinion of our management for a fair presentation of our financial position and results of operations for these periods. Our historical results are not necessarily indicative of the results to be expected in the future.
When you read this summary consolidated financial data, it is important that you read it together with "Management's Discussion and Analysis of Financial Condition and Results of Operations" and in conjunction with the consolidated financial statements, related notes, and other financial information included elsewhere in this prospectus.
Consolidated statements of income
| |
Year Ended December 31, | Nine Months Ended September 30, |
||||||||||||||
|---|---|---|---|---|---|---|---|---|---|---|---|---|---|---|---|---|
| |
2012 | 2013 | 2014 | 2014 | 2015 | |||||||||||
| |
(In thousands, except share and per share amounts) |
|||||||||||||||
Revenue: |
||||||||||||||||
Financial process automation solutions |
$ | 8,440 | $ | 18,914 | $ | 24,073 | $ | 17,876 | $ | 21,073 | ||||||
Procurement solutions |
10,021 | 10,391 | 12,071 | 9,254 | 8,852 | |||||||||||
Asset management solutions |
39,093 | 38,079 | 48,652 | 36,729 | 35,230 | |||||||||||
| | | | | | | | | | | | | | | | | |
Total revenue |
57,554 | 67,384 | 84,796 | 63,859 | 65,155 | |||||||||||
Direct costs of revenue (excluding depreciation and amortization shown separately below): |
||||||||||||||||
Financial process automation solutions |
3,918 | 7,518 | 8,291 | 6,247 | 7,105 | |||||||||||
Procurement solutions |
928 | 1,124 | 1,200 | 788 | 874 | |||||||||||
Asset management solutions |
22,384 | 18,199 | 26,783 | 21,599 | 19,239 | |||||||||||
| | | | | | | | | | | | | | | | | |
Total direct costs of revenue |
27,230 | 26,841 | 36,274 | 28,634 | 27,218 | |||||||||||
Operating expenses: |
||||||||||||||||
Sales and marketing |
11,497 | 12,491 | 15,100 | 11,149 | 12,106 | |||||||||||
General and administrative |
6,345 | 6,784 | 7,902 | 6,063 | 5,638 | |||||||||||
Depreciation and amortization |
10,341 | 10,191 | 10,622 | 7,750 | 9,434 | |||||||||||
Other income |
— | — | — | — | (463 | ) | ||||||||||
| | | | | | | | | | | | | | | | | |
Total operating expenses |
28,183 | 29,466 | 33,624 | 24,962 | 26,715 | |||||||||||
| | | | | | | | | | | | | | | | | |
Operating income |
2,141 | 11,077 | 14,898 | 10,263 | 11,222 | |||||||||||
Interest expense |
(1,280 | ) | (3,239 | ) | (3,296 | ) | (2,499 | ) | (2,435 | ) | ||||||
Interest income |
68 | 80 | 110 | 86 | 106 | |||||||||||
Foreign exchange gain (loss), net |
43 | (382 | ) | (639 | ) | (384 | ) | (1,035 | ) | |||||||
| | | | | | | | | | | | | | | | | |
Income before income taxes |
972 | 7,536 | 11,073 | 7,466 | 7,858 | |||||||||||
Provision for income taxes |
344 | 2,893 | 4,245 | 2,853 | 3,622 | |||||||||||
| | | | | | | | | | | | | | | | | |
Net income |
$ | 628 | $ | 4,643 | $ | 6,828 | $ | 4,613 | $ | 4,236 | ||||||
| | | | | | | | | | | | | | | | | |
| | | | | | | | | | | | | | | | | |
| | | | | | | | | | | | | | | | | |
Net income per common share: |
||||||||||||||||
Basic |
$ | 0.05 | $ | 0.37 | $ | 0.54 | $ | 0.37 | $ | 0.34 | ||||||
Diluted |
$ | 0.05 | $ | 0.36 | $ | 0.52 | $ | 0.35 | $ | 0.32 | ||||||
Pro forma diluted |
$ | 0.49 | $ | 0.29 | ||||||||||||
Weighted average common shares outstanding: |
||||||||||||||||
Basic |
12,511,328 | 12,406,060 | 12,578,160 | 12,568,956 | 12,635,924 | |||||||||||
Diluted |
13,016,692 | 12,954,940 | 13,132,868 | 13,119,856 | 13,203,104 | |||||||||||
Pro forma diluted |
13,910,464 | 14,517,663 | ||||||||||||||
10
Consolidated balance sheet data
The following table presents summary consolidated balance sheet data as of September 30, 2015:
- •
- on an actual basis without any adjustments to reflect subsequent or anticipated events;
- •
- on a pro forma basis reflecting (i) the vesting of shares of restricted common stock upon the consummation of this offering,
(ii) the recognition of stock-based compensation expense in connection with the vesting of options to purchase up to 3,600,000 shares of common stock for which performance conditions will be
satisfied upon the effectiveness of this offering (see note 13 to our consolidated financial statements contained elsewhere in this prospectus) and (iii) the reclassification of our redeemable
common stock to stockholders' equity in connection with the termination of our shareholders' agreement effective upon the completion of this offering; and
- •
- on a pro forma as adjusted basis further reflecting the receipt by us of the net proceeds from the sale of 6,153,846 shares of common stock in this offering at an assumed initial public offering price of $12.00 per share, the midpoint of the price range set forth on the cover of this prospectus, after deducting the estimated underwriting discounts and commissions and estimated offering expenses payable by us, and the application of proceeds from the offering as described in "Use of Proceeds" as if each had occurred on September 30, 2015.
The unaudited pro forma and pro forma as adjusted consolidated financial data is presented for informational purposes only and does not purport to represent what our consolidated results of operations or financial position actually would have been had the transactions reflected occurred on the date indicated or to project our financial condition as of any future date or results of operations for any future period.
| |
As of September 30, 2015 | |||||||||
|---|---|---|---|---|---|---|---|---|---|---|
| |
Actual | Pro Forma | Pro Forma As Adjusted |
|||||||
| |
(In thousands) |
|||||||||
Cash and cash equivalents |
$ | 32,767 | $ | 32,767 | $ | 99,111 | ||||
Total current assets |
192,753 | 194,619 | 260,963 | |||||||
Total assets |
255,432 | 257,297 | 319,873 | |||||||
Total current liabilities |
126,913 | 126,913 | 125,912 | |||||||
Total non-current liabilities |
93,499 | 93,499 | 93,499 | |||||||
Total redeemable common stock |
8,344 | — | — | |||||||
Stockholders' equity |
26,676 | 36,885 | 100,462 | |||||||
Other key financial metrics
| |
Year Ended December 31, | Nine Months Ended September 30, |
||||||||||||||
|---|---|---|---|---|---|---|---|---|---|---|---|---|---|---|---|---|
| |
2012 | 2013 | 2014 | 2014 | 2015 | |||||||||||
| |
(In thousands) |
|||||||||||||||
Adjusted revenue |
$ | 42,330 | $ | 53,281 | $ | 62,359 | $ | 45,459 | $ | 49,548 | ||||||
Adjusted EBITDA |
12,612 | 21,579 | 25,880 | $ | 18,279 | $ | 20,968 | |||||||||
Adjusted revenue and adjusted EBITDA are each financial measures not calculated in accordance with accounting principles generally accepted in the United States, or GAAP. A reconciliation of these non-GAAP measures to the most directly comparable GAAP-based measures along with a summary of the definition and material limitations of each measure are included in the section titled "Selected Consolidated Financial Data—Other key financial metrics."
11
This offering involves a high degree of risk. In addition to the other information contained in this prospectus, prospective investors should carefully consider the following risks before investing in our common stock. If any of the following risks actually occur, our business, operating results and financial condition could be materially adversely affected. As a result, the trading price of our common stock could decline, and you may lose all or part of your investment in our common stock. The risks discussed below also include forward-looking statements, and our actual results may differ substantially from those discussed in these forward-looking statements. See "Cautionary Note Regarding Forward-looking Statements" in this prospectus.
Risks Related to Our Business
If we fail to adequately assess and monitor the credit risks of our customers, our business and operating results could be harmed.
In connection with our financial process automation and procurement solutions, we often take on credit and collections risk associated with the transaction. As such, if our customers do not tender payment for their orders, we are still obligated to pay the supplier. As of September 30, 2015, the largest outstanding account receivable from a customer was $19.2 million, which represents 12.9% of our total accounts receivable. Conversely, if a supplier fails to deliver on a purchase order, we are often obligated to refund the customer for the entire amount of the transaction. While we use analytics to manage our credit risk, we cannot eliminate the credit risk from our customers, many of which are small to medium-sized businesses. The methods that we employ to screen potential customers and establish appropriate credit limits cannot eliminate all potential credit risks and may not always prevent us from approving customer applications that are fraudulently completed. In addition, changes in our industry may result in periodic changes in credit policies, such as expected increases in customer credit limits, which may further increase our exposure to additional credit losses. We may also fail to detect changes to the credit risk of customers, including our financial process automation solutions customers, over time. If we fail to adequately manage our credit risks, our business and operating results may be materially adversely affected.
A limited number of relationships are responsible for a significant portion of our revenue and cash flow. A decrease in sales to these customers could materially harm our business and operating results.
To date, a substantial portion of our business has been dependent on a limited group of relationships. For example, our largest relationship, Daimler Trucks North America LLC, or Daimler, uses our CorConnect product to manage billing and support services for its over 700 parts dealers. Transactions between Daimler's parts dealer network and their customers were 47.7% and 49.6% of our financial process automation solutions revenue and 13.5% and 16.1% of our total revenue during the year ended December 31, 2014 and the nine months ended September 30, 2015, respectively. As a result, there may be significant variability in our results if our relationship with this group of suppliers were to change or be lost completely. Additionally, most of our customers may generally terminate their respective agreements with us in each case for cause upon written notice of certain uncured material breaches of contract by us, upon the bankruptcy or insolvency of the other party or under certain other circumstances.
We expect that a limited number of customers and relationships will continue to account for a substantial portion of our revenue in future periods. A decrease in sales to these customers or a loss of one or more could harm our results of operations and financial condition.
12
Our recent growth rates may not be sustainable or indicative of our future growth.
We have substantially expanded our overall business, customer base, employee headcount and operations in recent periods. We increased our total number of full-time employees from 130 employees as of December 31, 2011 to 227 employees as of September 30, 2015. Our expansion has placed, and our expected future growth will continue to place, a significant strain on our managerial, customer operations, research and development, sales and marketing, administrative, financial and other resources. We anticipate further growth in headcount will be required to address increases in our solution offerings and continued expansion. Our success will depend in part upon the ability of our management team to manage this growth effectively. To do so, we must continue to recruit, hire, train, manage and integrate a significant number of qualified managers and employees in specialized roles within our company, including in technology, sales and marketing. If our new employees perform poorly, or if we are unsuccessful in recruiting, hiring, training, managing and integrating these new employees, or retaining these or our existing employees, our business and results of operations may suffer.
In addition, to manage the expected growth of our headcount and operations, we will need to continue to improve our operational, financial, management and information technology infrastructure. Our anticipated additional headcount and capital investments will increase our costs, which will make it more difficult for us to address any future revenue shortfalls by reducing expenses in the short term. If we are unable to manage our growth successfully, our business and results of operations will be harmed. Moreover, our historical growth rates may not be indicative of future growth.
If we fail to execute our growth strategy, which largely depends on our ability to grow our financial process automation solutions, our business could suffer.
One of the key means of achieving our growth strategy will be through growth in our financial process automation solutions. During the year ended December 31, 2014, revenue generated from our financial process automation solutions was 28.4% of our revenue, up from 14.7% and 28.1% during the years ended December 31, 2012 and 2013, respectively. This increase in relative revenue was the result of 68.9% CAGR in revenue growth for these solutions alone over those years. Additionally, during the nine months ended September 30, 2015, our financial process automation solutions revenue increased $3.2 million to $21.1 million or 17.9% as compared to the nine months ended September 30, 2014. Although we expect this area to account for a significant amount of our revenue growth for the foreseeable future, we may be unable to grow this aspect of our business as rapidly as we expect or maintain the current rate of growth in this area that we have recently experienced. For example, the recent growth in our financial process automation solutions revenue was largely driven by transactions between Daimler's parts dealers and their customers. Revenues attributable to Daimler's parts dealers represented 47.7% and 49.6% of our financial process automation solutions revenue during the year ended December 31, 2014 and the nine months ended September 30, 2015, respectively, but was not a material relationship prior to 2013. We believe our growth strategy for our financial process automation solutions will depend on our ability to acquire additional customer networks.
We buy and sell commercial trucks and trailers, and there is no guarantee that our activities will be profitable.
While we typically act as a broker for sellers of capital equipment, in certain circumstances, we may purchase the asset outright from a customer, make necessary repairs or improvements and subsequently sell the asset. As such, we are exposed to price movements in the market for trucks and trailers. Moreover, we may have to spend money to repair or improve the asset, and there is no guarantee that we can recover such investments upon resale or earn a profit on our activities. While we have not generally carried more than $2.5 million of assets held for sale at a given time during prior years (with an average monthly carrying value of $0.8 million during the last three fiscal years) nor held assets in inventory for longer than 120 days, if there is a downturn in the market for capital equipment,
13
particularly commercial trucks and trailers, or if we make an unusually large purchase of assets which we are unable to sell quickly, we may be forced to hold our assets longer than anticipated or sell such assets at a loss.
Our sales cycles, particularly for our financial process automation solutions, can be lengthy and unpredictable and require significant employee time and financial resources.
Sales cycles for our solutions, particularly our financial process automation solutions, tend to be long and unpredictable. Even after we have convinced prospective customers of the need for, and value of, our products and solutions, our customers frequently have extensive budgeting, procurement and approval processes that can slow down the sales process by months or even years. Customers may choose, and many historically have chosen, to follow industry trends rather than be early adopters of new products or solutions, which can extend the lead time for or prevent acceptance of more recently introduced products or solutions such as ours. The implementation and deployment of our solutions can also be unpredictable due to contract negotiations and challenges with implementation. Furthermore, the implementation and deployment of new products and solutions may require troubleshooting, which requires additional time and resources from us and our customers. These delays may lengthen our sales cycles.
Our average sales cycle for financial process automation contracts sold in 2014 was approximately seven months. Our average sales cycle for our asset management solutions often varies because it frequently depends upon our customers' asset needs. By contrast, the average sales cycle for our procurement solutions was approximately two to three months. The extended sales process of our financial process automation solutions, in particular, requires our senior management and our sales and marketing and customer services personnel to dedicate significant time to sales, and to use significant financial resources without any assurance of success or recovery of our related expenses.
Our lengthy and often unpredictable sales cycle also makes it difficult to forecast the timing and volume of new financial process automation customer implementations and future financial process automation agreements, which, in turn, may make forecasting our future financial process automation results of operations challenging. In the event that we publicly disclose any forecasts of our future results of operations or other forward-looking metrics, and those forecasts ultimately prove to be inaccurate, the value of our common stock could significantly decline.
We are exposed to the credit risk of our asset financing customers, which could adversely affect our business and operating results.
We provide lease financing for independent contractors that fulfill carriage contracts on behalf of a sponsor organization. While the sponsor organizations remit weekly lease payments directly to us, we are subject to payment risk in our leasing activities resulting from defaults in payment or performance by the sponsor organization and the independent contractors and credit risk from the independent contractors. Moreover, we provide short-term lending arrangements that allow a customer to purchase a capital asset while awaiting final funding from a third-party lender. We are subject to payment and credit risk in our lending activities resulting from defaults in payment by the borrower, as well as the risk that the third-party lender fails to deliver final funding.
A decline in general economic conditions, and in particular, a decline in demand for products and services offered through our procurement solutions, would adversely affect our business and operating results.
Our operating results are materially affected by conditions in the economy generally and in the industries that we serve. We generate revenue based primarily on the volume of transactions we process. Our transaction volume is correlated with the amount of business activity in the United States. Downturns in the economy are generally characterized by reduced commercial activity and,
14
consequently, reduced purchasing of products and services by businesses. Further, economic conditions also may impact the ability of our customers or partners to pay for services they have purchased. As a result, if economic conditions deteriorate, our reserve for credit losses and write-offs of accounts receivable could increase.
We have identified a material weakness in our internal control over financial reporting. Although we expect to make every effort to address this material weakness, we may find that we are unable to improve our internal control over financial reporting, which could make it difficult to maintain an effective system of internal control over financial reporting, reduce the reliability of our financial reporting, harm investor confidence in our company and affect the value of our common stock.
We will be required, pursuant to Section 404 of the Sarbanes-Oxley Act to furnish a report by management on, among other things, the effectiveness of our internal control over financial reporting in the second annual report we file with the SEC. This assessment will need to include disclosure of any material weaknesses identified by our management in our internal control over financial reporting, as well as a statement that our independent registered public accounting firm has issued an opinion on our internal control over financial reporting. However, our auditors will not be required to formally attest to the effectiveness of our internal control over financial reporting pursuant to Section 404 until we are no longer an "emerging growth company" as defined in the JOBS Act if we take advantage of the exemptions available to us through the JOBS Act. At such time as our auditors are required to formally attest to our internal control over financial reporting, they may issue a report that is adverse in the event they are not satisfied with the level at which our controls are documented, designed or operating.
We are in the very early stages of the costly and challenging process of compiling the system and processing documentation necessary to perform the evaluation needed to comply with Section 404.
In connection with the preparation of our consolidated financial statements for the years ended December 31, 2013 and 2014, we and our independent registered public accounting firm identified a material weakness in the design and operation of our internal control over financial reporting. The material weakness relates to the classification of leased assets on our consolidated balance sheet, consolidated income statement and consolidated statement of cash flows. As a result, we restated our 2012 and 2013 financial statements to correct the misclassification in conjunction with the 2013 and 2014 audits. A material weakness is a deficiency, or a combination of deficiencies, in internal control over financial reporting, such that there is a reasonable possibility that a material misstatement of a company's annual or interim financial statements will not be prevented or detected on a timely basis.
We are currently in the process of remediating the material weakness and are taking numerous steps that we believe will address the underlying causes of the material weakness, primarily through the hiring of additional financial reporting personnel with technical accounting and financial reporting experience and the enhancing of our internal review procedures during the financial statement close process. If we fail to effectively remediate deficiencies in our control environment or are unable to implement and maintain effective internal control over financial reporting and disclosure controls to meet the demands that will be placed upon us as a public company, including the requirements of Section 404 of the Sarbanes-Oxley Act, we may be unable to accurately report our financial results, or report them within the timeframes required by the SEC.
Even if we are able to report our financial statements accurately and in a timely manner, if we do not make all necessary improvements to address the material weakness, continued disclosure of a material weakness will be required in future filings with the SEC, which could cause our reputation to be harmed and our stock price to decline.
We may not be able to remediate this or any future material weaknesses, or to complete our evaluation, testing and any required remediation in a timely fashion. During the evaluation and testing
15
process, if we identify one or more material weaknesses in our internal control over financial reporting, we will be unable to assert that our internal controls are effective. If we are unable to assert that our internal control over financial reporting is effective, or if our auditors are unable to express an opinion on the effectiveness of our internal controls when they are required to issue such opinion, investors could lose confidence in the accuracy and completeness of our financial reports, which could harm our stock price.
We operate in a competitive business environment, and if we are unable to compete effectively, our business and operating results would be adversely affected.
The market for our products and services is highly competitive, and competition could intensify in the future. Our competitors vary in size and in the scope and breadth of the products and services they offer. We may experience competitive disadvantages from time to time as potential customers prioritize or value competitive factors differently. As a result, a specific offering of our products and service features, networks and pricing may serve as a competitive advantage with respect to one customer and a disadvantage for another based on the customer's individual preferences.
Some of our competitors have longer operating histories, greater brand name recognition, larger customer bases, more extensive customer relationships and greater financial and technical resources. In addition, our larger competitors also have greater resources to promote and sell their products and services and to pursue acquisitions. As a result, they may be able to adapt more quickly to new or emerging technologies and changing opportunities, standards or customer requirements.
Future mergers or consolidations among competitors, or acquisitions of our competitors by large companies may present competitive challenges to our business. The resulting combined entities could be at a competitive advantage if their products and service features are effectively integrated and bundled into more diverse and attractive sales packages. Overall, increased competition in our markets could result in intensified pricing pressure, reduced profit margins, increased sales and marketing expenses and a failure to increase, or a loss of, market share. We may not be able to maintain or improve our competitive position against our current or future competitors, which could adversely affect our business and operating results.
If our efforts to attract new customers are not successful, our revenue growth will be adversely affected, and the new customers we do attract may not generate revenue comparable to our current or historical customers.
There is no guarantee that we can sustain the customer acquisition rates that we have experienced in recent periods. Our ability to attract new customers will depend in large part on the success of our sales and marketing efforts, which may not be successful. Our prospective customers may not be familiar with our solutions, or may have traditionally used other products and services. Our prospective customers may develop their own solutions or purchase competitive product offerings. Additionally, we seek to attract larger customer networks that may have entrenched solutions already. All of these efforts require substantial time and expense. It may be difficult to identify, engage and market to customers, and many of our customers typically require input from one or more internal levels of approval. This requires us to spend substantial time and effort assisting potential customers in evaluating our solution including providing demonstrations. If our prospective customers do not perceive our solution to be of sufficiently high value and quality, we may not be able to attract new customers and our business, operating results and financial condition would be adversely affected. Additionally, even if we are successful in attracting new customers, such new customers may not generate comparable revenue relative to our current or historical customers, which could materially adversely affect our operating results and our growth.
16
We may undertake future acquisitions, which may divert our management's attention and result in unexpected operating difficulties, increased costs and dilution to our stockholders. We also may never realize the anticipated benefits of the acquisitions.
We have acquired several businesses in past years, and we may continue to acquire businesses, technologies, services and products in the future. The acquisition and integration of each business involves a number of risks and may result in unforeseen operating difficulties and expenditures in assimilating or integrating the businesses, technologies, products, personnel or operations of the acquired business. Furthermore, among other risks, future acquisitions may:
- •
- increase the difficulty of satisfying our obligations under our debt facilities;
- •
- involve our entry into geographic or business markets in which we have little or no prior experience;
- •
- fail to result in the addition of new customers for us;
- •
- result in a delay or reduction of sales for both us and the business we acquire; and
- •
- disrupt our ongoing business, divert our resources and require significant management attention that would otherwise be available for ongoing development of our current business.
To complete a future acquisition, we may determine that it is necessary to use a substantial amount of our cash or engage in equity or debt financing. We can make no assurances that the anticipated benefits of any acquisition, such as operating improvements or anticipated cost savings, would be realized or that we would not be exposed to unexpected liabilities in connection with any acquisition.
Further, an acquisition may negatively affect our operating results because it may require us to incur charges and substantial debt or other liabilities, may cause adverse tax consequences, substantial depreciation and amortization or deferred compensation charges, may require the amortization, write-down or impairment of amounts related to deferred compensation, goodwill and other intangible assets, or may not generate sufficient financial return to offset acquisition costs.
Our procurement solutions strategy is in part dependent upon our ability to deliver products and services at competitive or discounted prices. This strategy may not be successful, which could have a material adverse effect on our business and results of operations.
In addition to receiving fees and rebates from our suppliers, we receive fees from purchasers that are based on a product margin that varies by procurement program. In order to maintain and develop new relationships with purchasers in our procurement solutions, we look for ways to reduce the prices that they pay for products and services. However, success in serving such purchasers by reducing the prices they pay suppliers for products and services reduces the fees that we receive for processing such transactions. Moreover, since our fees are based on a product margin, we are exposed to commodity price changes. For example, if the price of tires declines, then the amount that we earn on a fixed number of tire purchases would correspondingly decline.
In order to maintain or increase our revenues and margins while implementing these strategies, we would have to increase sales volumes of existing products and services or introduce and sell new products and services in amounts sufficient to compensate for the reduced revenue effect of price reductions. If our competitors in these lines of business similarly reduce or obtain lower prices for their procurement purchasers, we may face further challenges. A failure to successfully implement our price reduction strategy could have a material adverse effect on our business, financial condition and results of operations.
17
Our procurement solutions, which rely on suppliers to provide discounts on aggregated purchases, compete with those suppliers' efforts to sell directly to customers. As a result, suppliers may limit or terminate their participation in our procurement solutions if the prices that they receive for products purchased through our solutions become too low.
Suppliers participate in our procurement solutions by offering discounts on aggregated purchases. However, suppliers also sell directly to customers outside of our procurement solutions program, typically at higher prices. Thus, our suppliers have an incentive to limit sales through our procurement solutions program if they can make the same sales outside of our program at higher prices.
In some cases, suppliers must approve each customer before it is allowed to participate in our procurement solutions program. Similarly, some suppliers impose size limitations on which customers may participate in our procurement solutions program. If suppliers do not authorize new customers to participate in our procurement program, or increase the requirements under which new customers may join, our business and operating results may be harmed.
We rely on fees and rebates that we receive from our procurement solutions suppliers. The failure to maintain contracts with these procurement solutions suppliers could adversely affect our business, financial condition and results of operations.
We rely heavily on our relationships with our procurement solutions suppliers, which provide products and services to our procurement solutions purchasers at reduced prices. These suppliers pay us rebates calculated either as a percentage of the transaction value under specific preferred procurement programs or as a pre-determined fee per transaction or item. Our contracts with these suppliers may be terminated upon zero to sixty days' notice. Supplier commitment to our procurement solutions has been, and will continue to be, a crucial element of our business model. There can be no assurances that our relationships with our suppliers will continue on existing terms or at all. A termination of any relationship or agreement with a supplier would result in the loss of fees and rebates pursuant to our arrangement with that supplier, which could adversely affect our business, financial condition and results of operations. Moreover, since some suppliers pay us rebates calculated as a percentage of the transaction value, we are exposed to commodity price changes. For example, if the price of tires declines, then the amount that we earn on a fixed number of tire sales would correspondingly decline.
If we cannot demonstrate to our procurement solutions suppliers the ability to increase their market share or access to purchasers through our procurement solutions or other products and services, we may lose negotiating leverage with our contracted suppliers which may result in our inability to maintain our agreements with purchasers or win new business. In addition, if we lose a relationship with a supplier, we may not be able to negotiate similar arrangements for our procurement solutions purchasers with other suppliers on the same terms and conditions or at all, which could damage our reputation with our procurement purchasers and, in turn, have a material adverse effect on our business, financial condition and results of operations.
If we fail to respond to evolving technological changes, our products and solutions could become obsolete or less competitive.
The markets in which we compete are highly competitive and are often characterized by new and rapidly evolving technologies, techniques, standards, regulations, customer requirements and frequent product introductions. We must anticipate and respond to the technological advances offered by our competitors and the requirements of our customers and partners, in order to maintain and improve upon our competitive position. Accordingly, our results of operations depend upon, among other things, our ability to develop and introduce new products and solutions, as well as our ability to improve existing products. The process of developing new technologies and products is complex, and we must
18
continue to invest significant resources in research and development in order to develop new products and to enhance our existing products and services.
Our ability to develop new features and enhance our products will depend on our ability to anticipate industry evolution, practices and standards and to continue to enhance existing solutions. In addition, the success of any enhancement or new feature depends on several factors, including the timely completion, introduction and market acceptance of the enhancement or feature. Any new solutions we develop or acquire might not be introduced in a timely or cost-effective manner and might not achieve the broad market acceptance necessary to generate significant revenue. If any of our competitors implements new technologies before we are able to implement them or better anticipates the innovation and integration opportunities in related industries, those competitors may be able to provide more effective or cheaper solutions than ours. If we are unable to develop enhancements to, and new features for, our existing products or if we are unable to develop new products that keep pace with technological developments or industry standards, our business could be harmed.
If the market for our cloud-based delivery model develops more slowly than we expect, our growth may slow or stall, and our business, operating results, and financial condition could be adversely affected.
Use of cloud-based applications for financial process automation and procurement is at an early stage within our industry. We are currently focusing on transaction processing, data analytics and other technology opportunities and our success will depend to a substantial extent on the willingness of potential new customers, large and small, to increase their use of our cloud-based products. Many companies have invested substantial personnel and financial resources to integrate established enterprise software into their businesses and therefore may be reluctant or unwilling to switch to our services. Furthermore, some companies may be reluctant or unwilling to use our services, because they have concerns regarding the risks associated with the security and reliability of, among other things, the technology delivery model associated with these services. If companies do not perceive the benefits of our services, then the market for these services may not expand as much or develop as quickly as we expect, either of which would significantly adversely affect our business, financial condition and results of operations.
Failure to adequately expand our direct sales force will impede our growth.
We will need to continue to expand and optimize our sales infrastructure in order to grow our customer base and our business. We plan to continue to expand our direct sales force. Competition for such qualified sales personnel is intense. We cannot be certain of our ability to identify, hire and retain adequately qualified sales personnel. Identifying and recruiting qualified personnel and training them requires significant time, expense and attention. It can take several months before our sales representatives are fully trained and productive. Our business may be adversely affected if our efforts to expand and train our direct sales force do not generate a corresponding increase in revenue. In particular, if we are unable to hire, develop and retain talented sales personnel, or if new direct sales personnel are unable to achieve desired productivity levels in a reasonable period of time, we may not be able to realize the expected benefits to revenue from this investment.
Our future success also depends in part on our ability to sell additional features or enhanced elements of our applications to our current customers. This may require increasingly costly sales efforts that are targeted at senior management. If these efforts are not successful, our business may suffer.
Our debt obligations, or our incurrence of additional debt obligations, could limit our flexibility in managing our business and could materially and adversely affect our financial performance.
As of September 30, 2015, we had approximately $87.3 million of long-term indebtedness (including current portion) outstanding. In addition, we are permitted under our credit agreement to
19
incur additional indebtedness, subject to specified limitations. Our indebtedness could have important consequences, including the following:
- •
- under certain of our existing credit facilities we must maintain certain financial covenants, which limit our cumulative capital
expenditures and our accounts receivable write-offs; require us to maintain a minimum cumulative adjusted EBITDA and a fixed charge coverage ratio; and our failure to comply with these financial
covenants could result in an acceleration of our outstanding indebtedness under our credit facilities and limit our ability to borrow additional amounts under such credit facilities for future
requirements;
- •
- we may have difficulty satisfying our obligations under our debt facilities and, if we fail to satisfy these obligations, an event of
default could result;
- •
- covenants relating to our debt may limit our ability to enter into certain contracts or to obtain additional financing for
acquisitions, investments, working capital, capital expenditures and other general corporate activities;
- •
- covenants relating to our debt may limit our flexibility in planning for, or reacting to, changes in our business and the industry in
which we operate, including by restricting our ability to make strategic acquisitions, dispose of certain assets or consolidate, merge or transfer all or substantially all of our assets;
- •
- covenants relating to our debt may limit our ability to incur additional indebtedness or create or permit liens;
- •
- we may be more vulnerable than our competitors to the impact of economic downturns and adverse developments in the industry in which
we operate;
- •
- we are exposed to the risk of increased interest rates because certain of our borrowings are subject to variable rates of interest;
- •
- although we have no current intention to pay any dividends, we may be unable to pay dividends or make other distributions with respect
to your investment either due to cash constraints or limitations imposed by our debt facilities; and
- •
- we may be placed at a competitive disadvantage against any less leveraged competitors.
The occurrence of one or more of these potential consequences could have a material adverse effect on our business, financial condition, operating results, and ability to satisfy our obligations under our indebtedness. In addition, we may be able to incur substantial additional indebtedness in the future. Although our credit agreement contains restrictions on the incurrence of additional indebtedness, these restrictions are subject to a number of significant qualifications and exceptions and, under certain circumstances, the amount of additional indebtedness that could be incurred in compliance with these restrictions could be substantial. If new debt is added to our existing debt levels, the related risks that we will face would increase.
In addition, our obligations under our senior credit facility are secured by substantially all of our property, and our notes payable are also secured by equipment held as revenue earning equipment for our asset management solutions. In the event of a default, our lenders may unilaterally exercise their rights under such security interests to the detriment of our business and our stockholders.
20
We may need to obtain additional financing which may not be available or, if it is available, may result in a reduction in the percentage ownership of our then-existing stockholders.
We may need to raise additional funds in order to:
- •
- finance unanticipated working capital requirements,
- •
- develop or enhance our technological infrastructure and our existing products and services,
- •
- fund strategic relationships,
- •
- respond to competitive pressures, and
- •
- acquire complementary businesses, technologies, products or services.
Additionally, we are dependent on our current credit facility and our long-term notes payable for the operation of our business. Often, we make payments through our financial process automation and procurement solutions to our customers' suppliers prior to receiving payment from our customers. In these instances, we are reliant on our credit facility to cover our payments during the interim period between our payment to our customers' suppliers and our customers' payment to us. As payments through our financial process automation and procurement solutions continue to increase as a percentage of our business, we will become increasingly reliant on our credit facility and may need to increase our credit facility to cover this period between when we make payments to our customers' suppliers and when we receive payments from our customers. Similarly, as our asset management solutions continue to grow, we will become increasingly reliant on our long-term notes payable and may need to seek additional sources of financing to fund our capital equipment purchases. If we pursue additional debt financing, we may be required to accept terms that further restrict our ability to incur additional indebtedness and force us to maintain specified liquidity or other ratios and limit the operating flexibility of our business.
Our ability to obtain additional financing will depend on, among other things, our development efforts, business plans, operating performance and condition of the capital markets at the time we seek financing. Additional financing may not be available on terms favorable to us, or at all. If adequate funds are not available or are not available on acceptable terms or involve restrictive covenants, our ability to fund our expansion strategy, take advantage of unanticipated opportunities, increase our business, develop or enhance technology or services or otherwise respond to competitive pressures would be significantly limited. Also, if we raise additional funds by issuing equity or convertible debt securities, the percentage ownership of our then-existing stockholders may be reduced, and holders of these securities may have rights, preferences or privileges senior to those of our then-existing stockholders.
Our balance sheet includes goodwill and intangible assets. The impairment of a significant portion of these assets would negatively affect our business and operating results.
Our balance sheet includes goodwill and intangible assets of $10.8 million at September 30, 2015. These assets consist primarily of goodwill and identified intangible assets associated with our acquisitions. If we engage in additional acquisitions, we may recognize additional goodwill and intangible assets. On at least an annual basis, we assess whether there have been impairments in the carrying value of goodwill and intangible assets. If the carrying value of the asset is determined to be impaired, then it is written down to fair value by a charge to operating earnings. An impairment of a significant portion of goodwill or intangible assets could materially negatively affect our business and operating results.
21
If we do not or cannot maintain the compatibility of our solutions with third-party applications that our customers use in their businesses, demand for our solutions could decline.
The functionality of our cloud-based platform depends, in part, on our ability to integrate it with third-party applications and data management systems that our customers use and from which they obtain data. Third-party providers of these applications and data management systems may terminate their relationships with us, change the features of their applications and platforms, restrict our access to their applications and platforms or alter the terms governing use of their applications and data management systems and access to those applications and platforms. Such changes could functionally limit or terminate our ability to use these third-party applications and platforms with our cloud-based platform, which could negatively impact our offerings and harm our business. Further, if we fail to integrate our platform with new third-party applications and platforms that our customers use, or to adapt to the data transfer requirements of such third-party applications and platforms, we may not be able to offer the functionality that our customers need, which would negatively impact the attractiveness our offerings and, as a result, could negatively affect our business and operating results.
We may not be able to adequately protect the data we collect from or about our customers and partners, which could subject us to liability, damage our reputation or have other adverse effects on our business, operating results and financial condition.
Our operations rely on the processing, storage and transmission of confidential and other information from and about our customers, partners, suppliers and others, including financial account information, as well as other confidential and proprietary information. We also employ third-party service providers that store, process and transmit proprietary confidential information on our behalf. We rely on encryption and authentication technology licensed from third parties in an effort to securely transmit confidential and sensitive information. Advances in computer capabilities, new technological discoveries or other developments may result in the whole or partial failure of this technology to protect transaction data or other confidential and sensitive information from being breached or compromised. Our security measures, and those of our third-party service providers, may not detect or prevent all attempts to hack our systems, denial-of-service attacks, viruses, malicious software, break-ins, phishing attacks, social engineering, security breaches or other attacks and similar disruptions that may jeopardize the security of information stored in or transmitted by our sites, networks and systems or that we or our third-party service providers otherwise maintain, including payment systems which may subject us to fines or higher transaction fees or limit or terminate our access to certain payment methods. We and our service providers may not anticipate or combat all types of attacks until after they have already been launched, and techniques used to obtain unauthorized access to or sabotage systems change frequently and may not be known until launched against us or our third-party service providers. In addition, security breaches can also occur as a result of non-technical issues, including intentional or inadvertent breaches by our employees or by persons with whom we have commercial relationships.
Breaches of our security measures or those of our third-party service providers or cyber security incidents could result in unauthorized access to our sites, networks and systems; unauthorized access to and misappropriation of business information, or other confidential or proprietary information of ourselves or third parties; viruses, worms, spyware or other malware being served from our sites, networks or systems; deletion or modification of content or the display of unauthorized content on our sites; interruption, disruption or malfunction of operations; costs relating to breach remediation, deployment of additional personnel and protection technologies, response to governmental investigations and media inquiries and coverage; engagement of third party experts and consultants; litigation, regulatory action and other potential liabilities. If any of these breaches of security occur, our reputation and brand could be damaged, our business may suffer, we could be required to expend significant capital and other resources to alleviate problems caused by such breaches and we could be
22
exposed to a risk of loss, litigation or regulatory action and possible liability. Actual or anticipated attacks may cause us to incur increasing costs, including costs to deploy additional personnel and protection technologies, train employees and engage third-party experts and consultants. In addition, any party who is able to illicitly obtain a customer's password could access the customer's transaction data.
Although we maintain privacy, data breach and network security liability insurance, we cannot be certain that our coverage will be adequate for liabilities actually incurred or that insurance will continue to be available to us on economically reasonable terms, or at all. We may also need to devote significant resources to protect against security breaches or to address problems caused by breaches, diverting resources from the management of our business. Any compromise or breach of our security measures, or those of our third-party service providers, could violate applicable privacy, data security and other laws, and cause significant legal and financial exposure, adverse publicity and a loss of confidence in our security measures, any of which could have a material adverse effect on our business, financial condition and operating results.
Privacy-and data protection-related laws and regulations may affect our solutions, result in lawsuits or other liability, and require us to expend significant resources, which could harm our business and financial condition.
Our services and solutions may be subject to privacy- and data protection-related laws and regulations that impose obligations in connection with the collection, processing and use of financial data or other similar data. Our platform and solutions rely on the collection, retention, use and transfer of financial data and similar data and may be affected by these laws and regulations and their interpretation and enforcement. We also may find it necessary or desirable to join self-regulatory bodies or other privacy- or data protection-related organizations that require compliance with their rules pertaining to privacy and data protection. We also may be bound by contractual obligations relating to our collection, use, and disclosure of financial and other data. Alleged violations of laws, regulations, self-regulatory obligations or contractual obligations relating to privacy and data protection, and any relevant claims, may expose us to potential liability, require us to expend significant resources in responding to and defending such allegations and claims, and result in negative publicity and a loss of confidence in us by our customers, all of which could have an adverse effect on our business, operating results and financial condition.
Further, it is unclear how the laws and regulations relating to the collection, use and disclosure of financial data or similar data that we collect, retain, use and transfer will further develop in the United States and internationally, and to what extent this may affect our services and solutions. Existing privacy- and data protection-related laws and regulations are evolving and subject to potentially differing interpretations, and various federal and state legislative and regulatory bodies may expand current or enact new laws and regulations, regarding privacy and data protection-related matters. New laws, amendments to or re-interpretations of existing laws and regulations, rules of self-regulatory bodies, industry standards and contractual obligations may impact our business and practices, and we may be required to expend significant resources to adapt to these changes. These developments could harm our business, financial condition and results of operations.
We rely on Internet infrastructure, bandwidth providers, data center providers, other third parties, and our own systems for providing services to our users, and any failure or interruption in the services provided by these third parties or our own systems could expose us to litigation and negatively impact our relationships with users, adversely affecting our brand and our business.
Our ability to deliver our financial process automation, procurement and asset management solutions is dependent on the development and maintenance of the infrastructure of the Internet and other telecommunications services by third parties. This includes maintenance of a reliable network
23
infrastructure with the necessary speed, data capacity, and security for providing reliable Internet access and services and reliable telephone systems. Our services are designed to operate without interruption in accordance with our service level commitments. However, we have experienced and expect that we will experience interruptions and delays in services and availability from time to time. We rely on internal systems as well as third-party suppliers, including bandwidth and telecommunications equipment providers, to provide our services. We are also currently in the process of migrating some of our data center operations to third-party data-hosting facilities. We do not maintain redundant systems or facilities for some of these services. In the event of a catastrophic event with respect to one or more of these systems or facilities, we may experience an extended period of system unavailability, which could negatively impact our relationship with users. To operate without interruption, both we and our service providers must guard against:
- •
- damage from fire, power loss, and other natural disasters,
- •
- communications failures,
- •
- software and hardware errors, failures, and crashes,
- •
- security breaches, computer viruses, and similar disruptive problems, and
- •
- other potential interruptions.
Any disruption in the network access, telecommunications, or co-location services provided by these third-party providers or any failure of or by these third-party providers or our own systems to handle current or higher volume of use could significantly harm our business. We exercise limited control over these third-party suppliers, which increases our vulnerability to problems with services they provide. Any errors, failures, interruptions, or delays experienced in connection with these third-party technologies and information services or our own systems could negatively impact our relationships with users and adversely affect our business and could expose us to third-party liabilities. We also utilize third-party providers to assist us with disaster recovery operations. As a result, we are subject to the risk of a provider's unresponsiveness or other failure to perform in the event of a significant breakdown in our computer equipment or networks. Although we maintain insurance for our business, the coverage under our policies may not be adequate to compensate us for all losses that may occur. In addition, we cannot provide assurance that we will be able to continually obtain adequate insurance coverage at an economically reasonable cost.
The reliability and performance of the Internet may be harmed by increased usage or by denial-of-service attacks. Other companies have experienced a variety of outages and other delays in their cloud-based networks as a result of damage to portions of their Internet infrastructure, and we could face outages or delays in the future. These outages and delays could reduce the level of Internet usage of our solutions by our customers.
We may experience software defects, system errors, computer viruses and development delays, which could damage customer relations, decrease our profitability and expose us to liability.
Our products and services are based on proprietary and third-party network technology and processing systems that may encounter development delays and could be susceptible to undetected errors, viruses and defects. Development delays, system errors, viruses or defects that result in service interruption or data loss could have a material adverse effect on our business, damage our reputation and subject us to third-party liability. In addition, errors, viruses and defects in our network technology and processing systems could result in additional development costs and the diversion of our technical and other resources from other development efforts or operations. Further, our contractual attempts to limit our potential liability to third parties may not be successful.
24
If we are unable to protect our intellectual property rights and/or confidential information, our competitive position could be harmed and/or we could be required to incur significant expenses in order to enforce our rights.
To protect our proprietary technology, we rely on a combination of copyrights, trade secrets, trademarks, domain names and other intellectual property rights. We enter into confidentiality and invention assignment agreements with our employees and contractors that develop our intellectual property and confidentiality agreements with parties with whom we conduct business in order to confirm our ownership of intellectual property and to limit access to, and disclosure and use of, our proprietary information. However, these contractual arrangements and the other steps we have taken to protect our intellectual property may not prevent the misappropriation of our proprietary information or deter independent development of similar technologies by others. Despite our precautions, third parties may obtain and use without consent our confidential information or infringe on our intellectual property rights, and our ability to detect or police that misappropriation or infringement is uncertain, particularly in countries outside of the United States. In addition, our confidentiality agreements with employees, former employees, vendors, customers, consultants, contractors, or other third parties may not effectively prevent disclosure or use of our proprietary technology or confidential information, effectively assign intellectual property rights to us, and may not provide an adequate remedy in the event of such unauthorized disclosure or use.
In the future, litigation may be necessary to enforce our intellectual property rights, protect our trade secrets, to determine the validity and scope of proprietary rights claimed by others or to defend against claims of infringement or invalidity. Any litigation of this nature, regardless of outcome or merit, could result in substantial costs, adverse publicity or diversion of management and technical resources, any of which could adversely affect our business, operating results and financial condition. If we fail to maintain, protect and enhance our intellectual property rights, our business and operating results may be harmed. There can be no assurance that our means of protecting our proprietary rights will be adequate or that our competitors will not copy or independently develop similar technology. Furthermore, our efforts to enforce our intellectual property rights may be met with defenses, counterclaims and countersuits attacking the validity and enforceability of our intellectual property rights. Our efforts may be inadequate to protect our intellectual property. We will not be able to protect our intellectual property if we are unable to enforce our rights or if we do not detect unauthorized use of our intellectual property. Furthermore, effective patent, trademark, service mark, copyright and trade secret protection may not be available in every country in which we may offer our products and services. Accordingly, despite our best efforts, we may not be able to prevent third parties from infringing upon or misappropriating our intellectual property or confidential information.
We may become subject to litigation, which could have a material adverse effect on our business and operating results.
We participate in businesses that are subject to litigation. We are periodically involved in litigation, which from time to time may include claims relating to commercial, employment, antitrust, intellectual property law, as well as claims in other areas. If current or future government regulations are interpreted or enforced in a manner adverse to us or our business, specifically those with respect to the financial services we provide, we may be subject to enforcement actions, penalties, and other material limitations on our business.
We may become subject to litigation in the future. Some of these claims may result in significant defense costs and potentially significant judgments against us, some of which are not, or cannot be, insured against. We generally intend to defend ourselves vigorously; however, we cannot be certain of the ultimate outcomes of any claims that may arise in the future. Resolution of matters against us may result in our having to pay significant fines, judgments or settlements, which, if uninsured, or if the fines, judgments and settlements exceed insured levels, could adversely impact our earnings and cash
25
flows, thereby having a material adverse effect on our business, financial condition, and results of operations. Certain litigation or the resolution of certain litigation may affect the availability or cost of some of our insurance coverage, which could adversely impact our results of operations and cash flows, expose us to increased risks that would be uninsured and adversely impact our ability to attract officers and directors.
Claims by others that we or our customers infringe their intellectual property rights could harm our business.
Third parties may own technology patents, copyrights, trademarks, trade secrets, website content or other intellectual property rights, which they may use to assert claims against us. In recent years, there has been significant litigation in the United States involving patents and other intellectual property rights. Companies in the Internet and technology industries are increasingly bringing and becoming subject to suits alleging infringement of proprietary rights. As we face increasing competition and as litigation becomes a more common way to resolve disputes, we face a higher risk of being the subject of intellectual property infringement claims, and there can be no assurance that we will be able to prevail against such claims. Although we have not been subject to successful claims or lawsuits against us in the past, we cannot assure you that we will not become in the future, subject to claims that we have misappropriated or misused other parties' intellectual property rights. If we are sued by a third party that claims that our technology infringes its rights, the litigation (with or without merit) could be expensive and could divert our management resources.
In addition, in some instances, we have agreed to indemnify our customers against certain claims that our products and services violate the intellectual property rights of third parties. Our business could be adversely affected by any significant disputes between us and our customers as to the applicability or scope of our indemnification obligations to them. Any of these claims might require us to defend potentially protracted and costly litigation on their behalf, regardless of the merits of these claims.
The results of any intellectual property litigation to which we might become a party may require us to do one or more of the following:
- •
- cease making, selling, offering for sale or using technologies that incorporate the challenged intellectual property;
- •
- make substantial payments for legal fees, settlement payments or other costs or damages;
- •
- obtain a license, which may not be available at all or on reasonable terms, to sell or use the relevant technology; or
- •
- redesign technology to avoid infringement.
If we are required to make substantial payments or undertake any of the other actions noted above as a result of any intellectual property infringement claims against us, such payments, actions or costs could have a material adverse effect upon our business, operating results and financial condition.
We use open source software in our products and solutions that may subject our products and solutions to general release or require us to re-engineer our products and solutions, which may harm our business.
We use open source software in connection with our products and solutions. From time to time, companies that incorporate open source software into their products have faced claims challenging the ownership of open source software and compliance with open source license terms. Therefore, we could be subject to suits by parties claiming ownership of what we believe to be open source software or noncompliance with open source licensing terms. Some open source software licenses require users who distribute open source software as part of their software to publicly disclose all or part of the source code to such software and make available any derivative works of the open source code on unfavorable
26
terms or at no cost. We do not always monitor the use of open source software in our products and solutions to ensure that none is used in a manner that would require us to disclose the source code to the related product or would otherwise breach the terms of an open source agreement. As a result, such use could inadvertently occur and we may be required to release proprietary source code, pay damages for breach of contract, re-engineer our products, discontinue the sale of products in the event re-engineering cannot be accomplished on a timely basis or take other remedial action that may divert resources away from our development efforts, any of which could harm our business, results of operations and financial condition.
Further, the terms of many open source licenses to which we are subject have not been interpreted by U.S. or foreign courts, and although we believe we comply with the terms of those licenses, there is a risk that those licenses could be construed in a manner that imposes unanticipated conditions or restrictions on our ability to commercialize our products and solutions. In that event, we could be required to (i) seek licenses from third parties, (ii) re-develop our products and solutions, (iii) discontinue sales of our products and solutions, or (iv) release our proprietary software code under the terms of an open source license, any of which could adversely affect our business.
Our success is dependent, in part, upon our executive officers and other key personnel, and the loss of key personnel could materially adversely affect our business.
Our success depends, in part, on our executive officers and other key personnel. Our senior management team has significant experience and would be difficult to replace. The market for qualified individuals is competitive, and we may not be able to attract and retain qualified personnel or candidates to replace or succeed members of our senior management team or other key personnel. The loss of key personnel could materially adversely affect our business.
Our growth depends in part on the success of our strategic relationships with third parties.
In order to grow our business, we anticipate that we will continue to depend on relationships with third parties, such as third-party sales channel partners. For example, the Food Marketing Institute, or FMI, is an association of food retailers such as grocery stores and pharmacies. We market our procurement and asset management solutions through FMI to its over 1,000 members. Identifying partners such as FMI, and negotiating and documenting relationships with them, requires significant time and resources. Our competitors may provide incentives to third parties to favor their products or services or to prevent or reduce the use of our services. To enter into new strategic relationships or renew an existing strategic relationship with a third party, we often must participate in a competitive bidding process, which may focus on a limited number of factors, such as pricing. The use of these processes may affect our ability to effectively compete for these relationships. Our competitors may be willing to bid for these contracts on pricing or other terms that we consider uneconomical in order to win this business. If we are unsuccessful in establishing or maintaining our relationships with third parties, our ability to compete in the marketplace or to grow our revenues could be impaired and our operating results may suffer. Even if we are successful, we cannot assure you that these relationships will result in increased customer usage of our solutions or increased revenues.
If we are not able to maintain and enhance our brands, it could adversely affect our business, operating results and financial condition.
We believe that maintaining and enhancing our brands is critical to our customer relationships, and our ability to obtain partners and retain employees. The successful promotion of our brands will depend upon our marketing and public relations efforts, our ability to continue to offer high-quality products and services and our ability to successfully differentiate our services from those of our competitors. In addition, future extension of our brands to add new products or services different from our current offerings may dilute our brands, particularly if we fail to maintain our quality standards in
27
these new areas. The promotion of our brands will require us to make substantial expenditures, and we anticipate that the expenditures will increase as our markets become more competitive and we expand into new markets. To the extent that these activities yield increased revenue, this revenue may not offset the expenses we incur. There can be no assurance that our brand promotion activities will be successful.
Any failure to offer high-quality technical support services may adversely affect our relationships with our customers and our financial results.
While they prepare for deployment and after implementation of our solutions, our customers depend on our support organization to resolve technical issues relating to our applications. We may be unable to respond quickly enough to accommodate short-term increases in customer demand for support services. We also may be unable to modify the format of our support services to compete with changes in support services provided by our competitors. Increased customer demand for these services, without corresponding revenues, could increase costs and adversely affect our operating results. In addition, our sales process is highly dependent on our applications and business reputation and on positive recommendations from our existing customers. Any failure to maintain high-quality technical support, or any market perception that we do not maintain high-quality support, could adversely affect our reputation, our ability to sell our applications to existing and prospective customers, and our business, operating results and financial position.
Our business and financial performance could be harmed by changes in tax laws or regulations or by current uncertainty regarding application of tax laws to software-as-a-service based companies.
New income, sales, use or other tax laws, statutes, rules, regulations or ordinances could be enacted at any time. Those enactments could harm our business operations and our business and financial performance. Further, existing tax laws, statutes, rules, regulations or ordinances could be interpreted, changed, modified or applied adversely to us. In addition, application of current tax laws to software-as-a-service based companies is uncertain, such that we may be subject to tax audits in connection with our technology-enabled solutions. Any of these events could require us or our customers to pay additional tax amounts on a prospective or retroactive basis, as well as require us or our customers to pay fines and/or penalties and interest for past amounts deemed to be due. If we raise our prices to offset the costs of these changes, existing and potential future customers may elect not to purchase our products and solutions in the future. Additionally, new, changed, modified or newly interpreted or applied tax laws could increase our customers' and our compliance, operating and other costs, as well as the costs of our products. Further, these events could decrease the capital we have available to operate our business. The occurrence of any or all of these events could harm our business and results of operations.
Our results of operations may be harmed if we are required to collect sales taxes for sales of our products and solutions in jurisdictions where we have not historically done so.
Historically, we have not collected sales tax from our customers related to fees earned by us for use of our solutions, nor have we remitted such taxes in many states where we sell our products and solutions. Although we believe we are not obligated to collect sales taxes from our customers in those jurisdictions, states or one or more countries may seek to impose sales or other tax collection obligations on us, including for past sales by us. A successful assertion that we should be collecting additional sales or other taxes on our products or solutions could discourage customers from purchasing our solutions or otherwise harm our business and results of operations.
28
We have no operating history as a publicly-traded company, and our inexperience could materially and adversely affect us and our stockholders.
We have no operating history as a publicly-traded company. Our board of directors and senior management team will have overall responsibility for our management and only a limited number of our directors or members of our senior management team have prior experience in operating a public company. As a publicly-traded company, we will be required to develop and implement substantial control systems, policies and procedures in order to satisfy our periodic Securities and Exchange Commission, or SEC, reporting and NASDAQ obligations. We cannot assure you that management's past experience will be sufficient to successfully develop and implement these systems, policies and procedures and to operate our company. Failure to do so could jeopardize our status as a public company, and the loss of such status may materially and adversely affect us and our stockholders.
Changes in laws, regulations and enforcement activities may adversely affect our products and services and the markets in which we operate.
The electronic payments industry is subject to increasing regulation in the United States and internationally. Domestic and foreign government regulations impose compliance obligations on us and restrictions on our operating activities, which can be difficult to administer because of their scope, mandates and varied requirements. We are subject to a number of government regulations, including, among others: interest rate and fee restrictions; credit access and disclosure requirements; collection and pricing regulations; compliance obligations; security and data breach requirements; identity theft avoidance programs; and anti-money laundering compliance programs. Government regulations can also include licensing or registration requirements. While a large portion of these regulations focuses on individual consumer protection, legislatures continue to consider whether to include business consumers within the scope of these regulations. As a result, new or expanded regulation focusing on businesses such as ours or changes in interpretation or enforcement of regulations may have an adverse effect on our business and operating results, due to increased compliance costs and new restrictions affecting the terms under which we offer our products and services.
We will incur significantly increased costs as a result of operating as a public company, and our management will be required to devote substantial time to compliance efforts.
As a public company, we will incur significant legal, accounting and other expenses that we did not incur as a private company. For example, we will be subject to the reporting requirements of the Securities Exchange Act of 1934, as amended, the accounting and internal controls provisions of the Foreign Corrupt Practices Act of 1977, as amended, or the FCPA, and will be required to comply with the applicable requirements of the Sarbanes-Oxley Act of 2002 and the Dodd-Frank Wall Street Reform and Consumer Protection Act of 2010, as well as rules and regulations subsequently implemented by the SEC and the NASDAQ Global Market, including the establishment and maintenance of effective disclosure and financial controls and changes in corporate governance practices. Our management and other personnel will need to devote a substantial amount of time and resources to complying with these requirements. Moreover, these rules and regulations will increase our legal and financial compliance costs and will make some activities more time-consuming and costly. In particular, we expect to incur significant expenses and devote substantial management effort toward ensuring compliance with the requirements of Section 404 of the Sarbanes-Oxley Act of 2002, which will increase when we are no longer an "emerging growth company," as defined by the Jumpstart Our Business Startups Act of 2012, or the JOBS Act. These new obligations will require substantial attention from our management team and could divert their attention away from the day-to-day management of our business. We will need to hire additional accounting and financial staff with appropriate public company experience and technical accounting knowledge and maintain an internal
29
audit function. We cannot predict or estimate the amount of additional costs we may incur as a result of becoming a public company or the timing of such costs.
These rules and regulations could also make it more difficult for us to attract and retain qualified persons to serve on our board of directors and board committees or as executive officers, and more expensive for us to obtain director and officer liability insurance.
Our business could be severely harmed by natural disasters or other catastrophes.
Significant catastrophic events such as war, acts of terrorism, natural disasters, such as earthquakes, fire or floods, loss of power, computer viruses, or global threats, including, but not limited to, the outbreak of epidemic disease, could disrupt our operations and impair deployment of our solutions by our customers, interrupt critical functions, cause our suppliers to be unable to meet our demand for parts and equipment, reduce demand for our products, prevent our customers from honoring their contractual obligations to us or otherwise harm our business. To the extent that such disruptions or uncertainties result in delays or cancellations of the deployment of our products and solutions, our reputation, business and operations and operating results could be harmed.
We may have difficulty scaling and adapting our existing infrastructure to accommodate increased traffic and storage demands, technology advances or customer requirements, which could cause delays or service interruptions.
In the future, advances in technology, increases in traffic and storage demands and new customer requirements may require us to change our infrastructure, expand our infrastructure or replace our infrastructure entirely. Scaling and adapting our infrastructure is likely to be complex and require additional technical expertise. If we are required to make any changes to our infrastructure, we may incur substantial costs and experience delays or interruptions in our service. These delays or interruptions may cause customers and partners to become dissatisfied with our service and move to competing providers of our solutions. Our failure to accommodate increased traffic and storage demands, increased costs, inefficiencies or failures to adapt to new technologies or customer requirements and the associated adjustments to our infrastructure could harm our business and operating results.
We rely on insurance to mitigate some risks facing our business, and to the extent our insurance does not mitigate the risks facing our business or our insurers are unable to meet their obligations, our operating results may be negatively impacted.
We contract for insurance to cover certain potential risks and liabilities, such as general liability, directors and officers liability and business interruption. It is possible that we may not be able to obtain enough insurance to meet our needs, may have to pay very high prices for the coverage we do obtain, have very high deductibles, may not be able to, or may choose not to, acquire any insurance for certain types of business risk. For example, if we do not increase our current coverage levels, we may be underinsured with respect to our directors and officers liability insurance upon becoming a public company. This could leave us exposed to potential claims. If we are found liable for a significant claim in the future, our business, operating results and financial condition could be negatively impacted. Also, to the extent the cost of maintaining insurance increases, our business, operating results and financial condition could be negatively affected. Additionally, we are subject to the risk that one or more of our insurers may become insolvent and would be unable to pay a claim that may be made in the future. There can be no assurance that our insurance will be adequate to protect us from pending and future claims. In addition, we are required to maintain insurance coverage under some of our agreements with our clients and our credit agreements with Bank of America, which we refer to herein as our senior credit facility, and M&T Bank, which we refer to herein as our interim finance line of credit. If we are not able to or do not maintain the required insurance coverage, we could breach those agreements.
30
Our efforts to grow internationally may not be successful and may subject our business and operations to additional regulatory risks.
We anticipate that any efforts to expand internationally will entail the marketing and advertising of our solutions and brand. We do not have substantial experience localizing our website and software into foreign languages. We also do not have substantial experience in selling our solutions in international markets or in conforming to the local cultures, standards, policies or regulations necessary to successfully compete in those markets, and we may be required to invest significant resources in order to do so. We may not succeed in any efforts or achieve our customer acquisition or other goals. In some international markets, customer preferences and buying behaviors may be different, and we may use business or pricing models that are different from our traditional model or we may be unsuccessful in implementing the appropriate business model. Our revenue from any new foreign markets may not exceed the costs of establishing, marketing, and maintaining any international offerings. In addition, the current instability in the eurozone could have many adverse consequences on our international expansion, including sovereign default, liquidity and capital pressures on eurozone financial institutions, reducing the availability of credit and increasing the risk of financial sector failures and the risk of one or more eurozone member states leaving the euro, resulting in the possibility of capital and exchange controls and uncertainty about the impact of contracts and currency exchange rates.
If we further our international reach, we will incur an additional risk of violating laws that apply to global U.S. companies. For example, failure to comply with anti-corruption and anti-bribery laws, such as the FCPA, United Kingdom Bribery Act of 2010, and similar laws associated with our activities outside the United States, could subject us to penalties and other adverse consequences. Anti-corruption and anti-bribery laws such as the FCPA and U.K. Bribery Act of 2010 generally prohibit companies and their employees and intermediaries from making corrupt payments to foreign officials for the purpose of obtaining or keeping business, securing an advantage, and directing business to another, and requires companies to maintain accurate books and records and a system of internal accounting controls. Under the FCPA, U.S. companies may be held liable for the corrupt actions taken by directors, officers, employees, agents, or other strategic or local partners or representatives. As such, if we or our intermediaries fail to comply with the requirements of the FCPA or similar legislation, governmental authorities in the U.S. and elsewhere could seek to impose civil and/or criminal fines and penalties which could have a material adverse effect on our business, operating results and financial conditions.
In addition, regulations or standards adopted by other countries may require us to redesign our existing products or develop new products for those countries. For example, foreign governments may impose regulations or standards that may require redesign or alteration of our products and/or services. Furthermore, if we are unable to expand international operations in a timely and cost-effective manner in response to increased overseas demand, we could miss sales opportunities and our revenue would decline, adversely affecting our operating results, business and prospects. If we invest substantial time and resources to expand our international operations and are unable to do so successfully and in a timely manner, our business, prospects and operating results will suffer.
In addition, conducting expanded international operations subjects us to new risks that we have not generally faced in our current markets. These risks include:
- •
- strong local competitors;
- •
- difficulties in managing and staffing international operations;
- •
- fluctuations in currency exchange rates or restrictions on foreign currency;
- •
- potentially adverse tax consequences, including the complexities of transfer pricing, value added or other tax systems, double taxation and restrictions and/or taxes on the repatriation of earnings;
31
- •
- dependence on third parties, including commercial partners with whom we do not have extensive experience;
- •
- political, social, and economic instability, terrorist attacks, and security concerns in general; and
- •
- reduced or varied protection for intellectual property rights in some countries.
Risks Related to Ownership of Our Common Stock and this Offering
Our stock price may be volatile and your investment could decline in value.
The market price of our common stock following this offering may fluctuate substantially as a result of many factors, some of which are beyond our control. These fluctuations could cause you to lose all or part of the value of your investment in our common stock. Factors that could cause fluctuations in the market price of our common stock include the following:
- •
- quarterly variations in our results of operations;
- •
- results of operations that vary from the expectations of securities analysts and investors;
- •
- results of operations that vary from those of our competitors;
- •
- changes in expectations as to our future financial performance, including financial estimates by securities analysts;
- •
- announcements by us or our competitors of significant contracts, acquisitions, or capital commitments;
- •
- announcements by third parties of significant claims or proceedings against us;
- •
- regulatory developments in the United States;
- •
- future sales of our common stock, and additions or departures of key personnel; and
- •
- general domestic and international economic, market and currency factors and conditions unrelated to our performance.
In addition, the stock market in general has experienced significant price and volume fluctuations that have often been unrelated or disproportionate to operating performance of individual companies. These broad market factors may seriously harm the market price of our common stock, regardless of our operating performance. In the past, following periods of volatility in the market price of a company's securities, securities class action litigation has often been instituted. A securities class action suit against us could result in significant liabilities and, regardless of the outcome, could result in substantial costs and the diversion of our management's attention and resources.
Our common stock has no prior market and our stock price may decline after the offering.
Before this offering, there has been no public market for shares of our common stock. Although we have applied to have our common stock listed on the NASDAQ Global Market, an active trading market for our common stock may not develop or, if it develops, may not be sustained after this offering. Our company and the representatives of the underwriters will negotiate to determine the initial public offering price. The initial public offering price may be higher than the market price of our common stock after the offering and you may not be able to sell your shares of our common stock at or above the price you paid in the offering. As a result, you could lose all or part of your investment.
Investors purchasing common stock in this offering will experience immediate and substantial dilution.
The initial public offering price of shares of our common stock is substantially higher than the pro forma as adjusted net tangible book value per outstanding share of our common stock. You will incur
32
immediate and substantial dilution of $7.29 per share in the pro forma as adjusted net tangible book value of shares of our common stock, based on an assumed initial public offering price of $12.00, the midpoint of the range set forth on the cover of this prospectus. In addition, we have outstanding options with exercise prices significantly below the initial public offering price. To the extent outstanding options are ultimately exercised, there will be further dilution of the common stock sold in this offering.
Future sales, or the perception of future sales, of a substantial amount of our common shares could depress the trading price of our common stock.
If we or our stockholders sell substantial amounts of our shares of common stock in the public market following this offering or if the market perceives that these sales could occur, the market price of shares of our common stock could decline. These sales may make it more difficult for us to sell equity or equity-related securities in the future at a time and price that we deem appropriate, or to use equity as consideration for future acquisitions.
Upon completion of this offering, based on the number of shares outstanding as of September 30, 2015, we will have 500,000,000 shares of common stock authorized and 19,043,814 (or 18,918,890 as of December 31, 2015) shares of common stock outstanding. Of these shares, the 6,153,846 (or 7,076,922 if the underwriters' option is exercised in full) shares to be sold in this offering will be freely tradable. We, our executive officers and directors, and a substantial majority of our stockholders have entered into agreements with the underwriters not to sell or otherwise dispose of shares of our common stock for a period of at least 180 days following completion of this offering, with certain exceptions. Immediately upon the expiration of this lock-up period, 6,344,468 shares will be freely tradable pursuant to Rule 144 under the Securities Act of 1933 by non-affiliates and another 4,059,356 shares will be eligible for resale pursuant to Rule 144 under the Securities Act of 1933, subject to the volume, manner of sale, holding period and other limitations of Rule 144.
In addition, promptly following the completion of this offering, we intend to file one or more registration statements on Form S-8 registering the issuance of approximately 7,205,000 shares of common stock subject to options or other equity awards issued or reserved for future issuance under our equity incentive plans. Shares registered under these registration statements on Form S-8 will be available for sale in the public market subject to vesting arrangements and exercise of options, the lock-up agreements described above and the restrictions of Securities Act Rule 144 in the case of our affiliates.
If securities or industry analysts do not publish or cease publishing research or reports about us, our business or our market, or if they change their recommendations regarding our stock adversely, or if our actual results differ significantly from our guidance, our stock price and trading volume could decline.
The trading market for our common stock will be influenced by the research and reports that industry or securities analysts may publish about us, our business, our market or our competitors. If any of the analysts who may cover us change their recommendation regarding our stock adversely, or provide more favorable relative recommendations about our competitors, our stock price would likely decline. If any analyst who may cover us were to cease coverage of our company or fail to regularly publish reports on us, we could lose visibility in the financial markets, which in turn could cause our stock price or trading volume to decline.
In addition, from time to time, we may release earnings guidance or other forward-looking statements in our earnings releases, earnings conference calls or otherwise regarding our future performance that represent our management's estimates as of the date of release. Some or all of the assumptions of any future guidance that we furnish may not materialize or may vary significantly from
33
actual future results. Any failure to meet guidance or analysts' expectations could have a material adverse effect on the trading price or volume of our stock.
Anti-takeover provisions in our charter documents could discourage, delay or prevent a change in control of our company and may affect the trading price of our common stock.
Our corporate documents, to be effective upon completion of this offering, and the Delaware General Corporation Law contain provisions that may enable our board of directors to resist a change in control of our company even if a change in control were to be considered favorable by you and other stockholders. These provisions:
- •
- authorize the issuance of "blank check" preferred stock that could be issued by our board of directors to help defend against a
takeover attempt;
- •
- establish advance notice requirements for nominating directors and proposing matters to be voted on by stockholders at stockholder
meetings;
- •
- prohibit our stockholders from calling a special meeting and prohibit stockholders from acting by written consent; and
- •
- require supermajority stockholder voting to effect certain amendments to our certificate of incorporation and bylaws.
In addition, Delaware law prohibits large stockholders, in particular those owning 15% or more of our outstanding voting stock, from merging or consolidating with us except under certain circumstances. These provisions and other provisions under Delaware law could discourage, delay or prevent a transaction involving a change in control of the Company. These provisions could also discourage proxy contests and make it more difficult for you and other stockholders to elect directors of your choosing and cause us to take other corporate actions you desire.
Concentration of ownership of our common stock among our existing executive officers, directors and principal stockholders may limit new investors from influencing significant corporate decisions.
Upon completion of this offering, our executive officers, directors and current beneficial owners of 5% or more of our common stock and their respective affiliates will, in aggregate, beneficially own approximately 41.8% of our outstanding common stock assuming the underwriters do not exercise their right to purchase any additional shares. These persons, acting together, would be able to influence all matters requiring stockholder approval, including the election and removal of directors and any merger or other significant corporate transactions. The interests of this group of stockholders may not coincide with our interests or the interests of other stockholders.
We do not expect to pay any dividends on our common stock for the foreseeable future.
We currently expect to retain all future earnings, if any, for future operation, expansion and debt repayment and have no current plans to pay any cash dividends to holders of our common stock for the foreseeable future. Any decision to declare and pay dividends in the future will be made at the discretion of our board of directors and will depend on, among other things, our operating results, financial condition, cash requirements, contractual restrictions and other factors that our board of directors may deem relevant. In addition, we must comply with the covenants in our credit agreements in order to be able to pay cash dividends, and our ability to pay dividends generally may be further limited by covenants of any existing and future outstanding indebtedness we or our subsidiaries incur. As a result, you may not receive any return on an investment in our common stock unless you sell our common stock for a price greater than that which you paid for it.
34
We may invest or spend the proceeds of this offering in ways with which you may not agree or in ways that may not yield a return.
Our management will have considerable discretion in the application of the net proceeds of this offering, and you will not have the opportunity, as part of your investment decision, to assess whether the proceeds are being used appropriately. The net proceeds may be invested with a view towards long-term benefits for our stockholders and this may not increase our operating results or market value. Until the net proceeds are used, they may be placed in investments that do not produce significant income or that may lose value.
While we currently qualify as an "emerging growth company" under the JOBS Act, we cannot be certain if we take advantage of the reduced disclosure requirements applicable to emerging growth companies that we will not make our common stock less attractive to investors. Once we lose emerging growth company status, the costs and demands placed upon our management are expected to increase.
The JOBS Act permits "emerging growth companies" like us to take advantage of certain exemptions from various reporting requirements applicable to other public companies that are not emerging growth companies. As long as we qualify as an emerging growth company, we would be permitted, and we intend to, omit the auditor's attestation on internal control over financial reporting that would otherwise be required by the Sarbanes-Oxley Act, as described above. We also intend to take advantage of the exemption provided under the JOBS Act from the requirements to submit say-on-pay, say-on-frequency and say-on-golden parachute votes to our stockholders and we will avail ourselves of reduced executive compensation disclosure that is already available to smaller reporting companies.
In addition, Section 107 of the JOBS Act also provides that an emerging growth company can take advantage of the exemption from complying with new or revised accounting standards provided in Section 7(a)(2)(B) of the Securities Act as long as we are an emerging growth company. An emerging growth company can therefore delay the adoption of certain accounting standards until those standards would otherwise apply to private companies. We have elected to take advantage of these benefits until we are no longer an emerging growth company or until we affirmatively and irrevocably opt out of this exemption. Our financial statements may therefore not be comparable to those of companies that comply with such new or revised accounting standards.
Following this offering, we will continue to be an emerging growth company until the earliest to occur of (i) the last day of the fiscal year during which we had total annual gross revenues of at least $1 billion (as indexed for inflation), (ii) the last day of the fiscal year following the fifth anniversary of the date of the first sale of common stock under this registration statement, (iii) the date on which we have, during the previous three-year period, issued more than $1 billion in non-convertible debt, or (iv) the date on which we are deemed to be a "large accelerated filer," as defined under the Exchange Act. Once we lose emerging growth company status, we expect the costs and demands placed upon our management to increase, as we would have to comply with additional disclosure and accounting requirements.
35
CAUTIONARY NOTE REGARDING FORWARD-LOOKING STATEMENTS
This prospectus contains forward-looking statements that involve substantial risks and uncertainties. The forward-looking statements are contained principally in the sections entitled "Prospectus Summary," "Risk Factors," "Management's Discussion and Analysis of Financial Condition and Results of Operations" and "Business," but are also contained elsewhere in this prospectus. In some cases, you can identify forward-looking statements by the words "may," "might," "will," "could," "would," "should," "expect," "intend," "plan," "aim," "objective," "anticipate," "believe," "estimate," "predict," "project," "potential," "continue," "ongoing," "target," "seek" or the negative of these terms, or other comparable terminology intended to identify statements about the future. Forward-looking statements contained in this prospectus include, but are not limited to, statements about:
- •
- our future financial performance, including our revenue, costs of revenue, operating expenses and profitability;
- •
- the sufficiency of our cash and cash equivalents to meet our liquidity needs;
- •
- our predictions about industry and market trends;
- •
- our ability to attract and retain customers to use our products and solutions;
- •
- our ability to successfully expand in our existing markets and into new markets and industry verticals; and
- •
- our ability to effectively manage our growth and future expenses.
We caution you that the foregoing list may not contain all of the forward-looking statements made in this prospectus.
These statements involve known and unknown risks, uncertainties and other factors that may cause our actual results, levels of activity, performance or achievements to be materially different from the information expressed or implied by these forward-looking statements. Although we believe that we have a reasonable basis for each forward-looking statement contained in this prospectus, we caution you that these statements are based on a combination of facts and factors currently known by us and our expectations of the future, about which we cannot be certain.
You should refer to the "Risk Factors" section of this prospectus for a discussion of important factors that may cause our actual results to differ materially from those expressed or implied by our forward-looking statements. As a result, of these factors, we cannot assure you that the forward-looking statements in this prospectus will prove to be accurate. Furthermore, if our forward-looking statements prove to be inaccurate, the inaccuracy may be material. In light of the significant uncertainties in these forward-looking statements, you should not regard these statements as a representation or warranty by us or any other person that we will achieve our objectives and plans in any specified time frame, or at all. We undertake no obligation to publicly update any forward-looking statements, whether as a result of new information, future events or otherwise, except as required by law.
You should read this prospectus and the documents that we reference in this prospectus and have filed as exhibits to the registration statement, of which this prospectus is a part, completely and with the understanding that our actual future results may be materially different from what we expect. We qualify all of our forward-looking statements by these cautionary statements.
36
Unless otherwise indicated, information in this prospectus concerning economic conditions, our industry, our markets and our competitive position is based on a variety of sources, including information from third-party industry analysts and publications and our own estimates and research. Some of the industry and market data contained in this prospectus are based on third-party industry publications, including those generated by Aberdeen Group, Inc., Ardent Partners, Everest Global, Inc., Gallup, Inc. Gartner, Inc., and PayStream Advisors Inc. This information involves a number of assumptions, estimates and limitations. The sources of the third-party industry publications referred to elsewhere in this prospectus are:
- •
- Anderson, Ed et al. "Forecast: Public Cloud Services, Worldwide, 2012-2018, 4Q14 Update." Gartner, Inc. December 30,
2014, or a Gartner Report;
- •
- Ball, Bryan. "B2B Collaboration: The Impact and Advantages of Managed File Transfer." Aberdeen Group. June 2012;
- •
- Bartolini, Andrew. "ePayables 2014: The Quest." Ardent Partners. May 2014;
- •
- Nink, Marco. "B2Bs Win by Building Relationships, Not Selling on Price." Copyright 2013 Gallup, Inc., or the Gallup Content;
- •
- Gaur, Dhananjai, Saurabh Gupta, Abhishek Menon, and Avinish Mittal. "Procurement Outsourcing—Annual Report 2014: Expanding
New Horizons." Everest Global, Inc. June 13, 2014;
- •
- PayStream Advisors. "Data Capture for Accounts Payable." October 24, 2013;
- •
- PayStream Advisors. "2014 Global eInvoicing Report." January 30, 2015;
- •
- Tyagi, Ankita. "From the Shadows to the Forefront: AP Automation and the Strategic Vision." Aberdeen Group. October 1, 2013;
and
- •
- Wilson, Deborah R. "Build a Compelling Procurement Business Case for Indirect Procure-to-Pay Technology." Gartner, Inc. June 2, 2014, or a Gartner Report.
The industry publications, surveys and forecasts and other public information generally indicate or suggest that their information has been obtained from sources believed to be reliable. None of the third-party industry publications used in this prospectus were prepared on our behalf. The industry in which we operate is subject to a high degree of uncertainty and risk due to a variety of factors, including those described in "Risk Factors." These and other factors could cause results to differ materially from those expressed in these publications.
The Gartner Reports described herein and referred to herein as the Gartner Reports represent data, research opinions or viewpoints published as part of a syndicated subscription service by Gartner, Inc., or Gartner. Each Gartner Report speaks as of its original publication date (and not as of the date of this prospectus) and the opinions expressed in the Gartner Reports are subject to change without notice.
Gartner does not endorse any vendor, product or service depicted in its research publications, and does not advise technology users to select only those vendors with the highest ratings. Gartner research publications consist of the opinions of Gartner's research organization and should not be construed as statements of fact. Gartner disclaims all warranties, expressed or implied, with respect to this research, including any warranties of merchantability or fitness for a particular purpose. The Gallup Content described and referred to herein is the property of Gallup, Inc. The Gallup Content is used with permission; however, Gallup, Inc. reserves all rights and retains all rights of republication.
37
We estimate that the net proceeds from our issuance and sale of 6,153,846 shares of our common stock in this offering will be approximately $63.6 million, based upon an assumed initial public offering price of $12.00 per share, which is the midpoint of the price range set forth on the cover page of this prospectus, after deducting estimated underwriting discounts and commissions and estimated offering expenses payable by us.
The principal purposes of this offering are to create a public market for our common stock, to increase our capitalization, to enhance our public profile and brand, and to facilitate our future access to the public capital markets, as well as to obtain additional capital. We may use a portion of the net proceeds from this offering to acquire, invest in or license complementary products, technologies or businesses, but we currently have no agreements or commitments with respect to any potential acquisition, investment or in-license. In addition, if we do not apply some or all of the proceeds towards acquisitions, we may use some of the remaining net proceeds from this offering to reduce the outstanding indebtedness under the long-term promissory notes issued to three separate lending institutions in connection with purchase of equipment for certain of our asset management leasing operations. The priority of any such potential repayments has not been determined. These notes bear interest and mature as follows:
- •
- Various notes with principal amounts totaling $0.3 million as of September 30, 2015 issued to PNC Equipment Finance,
LLC. These notes bear interest rates ranging from 3.71% to 4.04% and mature in monthly installments through November 2016.
- •
- Various notes with principal amounts totaling $31.0 million as of September 30, 2015 issued to Mercedes Financial
Services USA LLC. These notes bear interest rates ranging from 4.75% to 5.30% and mature in equal monthly installments beginning in June 2017 through September 2020.
- •
- Various notes with principal amounts totaling $3.0 million as of September 30, 2015 issued to Volvo Financial Services. These notes bear interest rates ranging from 4.45% to 4.70% and mature in equal monthly installments beginning in May 2017 through May 2018.
Finally, we may use the remainder of the net proceeds from this offering for working capital and general corporate purposes, including investing in our sales and marketing and product enhancement efforts. We may allocate funds from other sources to fund some or all of these activities.
The expected use of net proceeds from this offering represents our intention based upon our present plans and business conditions. We cannot predict with certainty all of the particular uses for the proceeds of this offering or the amounts that we will actually spend on the uses set forth above. Accordingly, our management will have significant flexibility in applying the net proceeds of this offering.
The timing and amount of our actual expenditures will be based on many factors, including cash flows from operations and the anticipated growth of our business. Pending their use, we intend to invest the net proceeds of this offering in a variety of capital-preservation investments, including short- and intermediate-term, interest-bearing, investment-grade securities.
Each $1.00 increase or decrease in the assumed initial public offering price of $12.00 per share, which is the midpoint of the price range set forth on the cover page of this prospectus, would increase or decrease the net proceeds to us from this offering by approximately $5.7 million, assuming that the number of shares offered by us, as set forth on the cover page of this prospectus, remains the same.
The selling stockholders named herein have offered to sell shares to the underwriters pursuant to the option granted to the underwriters. We will not receive any of the proceeds from the sale of shares by the selling stockholders, if any, although we will bear the costs, other than the underwriting discounts and commissions associated with those sales.
38
We have never declared or paid any cash dividends on our common stock. We anticipate that we will retain any earnings to support operations and to finance the growth and development of our business. Accordingly, we do not expect to pay cash dividends on our common stock in the foreseeable future. In addition, the terms of our loan agreements governing our long-term debt obligations prohibit us from paying dividends.
39
The following table sets forth our cash and cash equivalents and capitalization as of September 30, 2015:
- •
- on an actual basis without any adjustments to reflect subsequent or anticipated events;
- •
- on a pro forma basis reflecting (i) the vesting of shares of restricted common stock upon the consummation of this offering,
(ii) the recognition of stock-based compensation expense in connection with the vesting of options to purchase up to 3,600,000 shares of our common stock for which performance conditions will
be satisfied upon the effectiveness of this offering (see Note 13 to our consolidated financial statements contained elsewhere in this prospectus) and (iii) the reclassification of our
redeemable common stock to stockholders' equity and additional paid in capital in connection with the termination of our shareholders' agreement effective upon the completion of this offering; and
- •
- on a pro forma as adjusted basis further reflecting the receipt by us of the net proceeds from the sale of 6,153,846 shares of common stock in this offering at an assumed initial public offering price of $12.00 per share, the midpoint of the price range set forth on the cover of this prospectus, after deducting the estimated underwriting discounts and commissions and estimated offering expenses payable by us and excluding the exercise of any option held by the underwriters with respect to this offering, and the application of proceeds from the offering as described in "Use of Proceeds" as if each had occurred on September 30, 2015.
The following information is illustrative only of our cash and cash equivalents and capitalization following the completion of this offering and will change based on the actual initial public offering price and other terms of this offering determined at pricing. You should read this table together with "Management's Discussion and Analysis of Financial Condition and Results of Operations" and our financial statements and the related notes appearing elsewhere in this prospectus.
| |
As of September 30, 2015 | |||||||||
|---|---|---|---|---|---|---|---|---|---|---|
| |
Actual | Pro Forma |
Pro Forma As Adjusted |
|||||||
| |
(In thousands, except share and per share amounts) |
|||||||||
Cash and cash equivalents |
$ | 32,767 | $ | 32,767 | $ | 99,111 | ||||
| | | | | | | | | | | |
| | | | | | | | | | | |
| | | | | | | | | | | |
Long-term debt (including current portion) |
$ | 87,349 | $ | 87,349 | $ | 87,349 | ||||
Redeemable common stock: 9,474,596 shares issued and outstanding, actual; no shares outstanding, pro forma and pro forma as adjusted |
8,344 | — | — | |||||||
Preferred stock, $0.001 par value per share actual, pro forma and pro forma as adjusted; 25,000,000 shares authorized, actual, pro forma and pro forma as adjusted; no shares issued and outstanding, actual, pro forma and pro forma as adjusted |
||||||||||
Stockholders' equity (deficit): |
||||||||||
Common stock, par value $0.001 per share actual, pro forma and pro forma as adjusted: 500,000,000 shares authorized, actual, pro forma and pro forma as adjusted; 3,428,980 shares issued and 3,415,372 shares outstanding, actual; 12,903,576 shares issued and 12,889,968 outstanding, pro forma; 19,057,422 shares issued and 19,043,814 outstanding, pro forma as adjusted |
3 | 13 | 19 | |||||||
Additional paid-in capital |
4,766 | 17,765 | 81,336 | |||||||
Retained earnings |
22,012 | 19,212 | 19,212 | |||||||
Treasury stock, at cost 13,608 shares actual, pro forma and pro forma as adjusted |
(105 | ) | (105 | ) | (105 | ) | ||||
| | | | | | | | | | | |
Total stockholders' equity |
26,676 | 36,885 | 100,462 | |||||||
| | | | | | | | | | | |
Total capitalization |
$ | 122,369 | $ | 124,234 | $ | 187,811 | ||||
| | | | | | | | | | | |
| | | | | | | | | | | |
| | | | | | | | | | | |
40
The number of shares on an actual basis in the preceding table does not include:
- •
- 4,005,000 shares of common stock issuable upon exercise of options outstanding at a weighted-average exercise price of $2.21 per share
under our Equity and Incentive Plan as of September 30, 2015, which plan will terminate as to new awards following this offering;
- •
- an additional 403,628 shares of our common stock reserved for future issuance under our Equity and Incentive Plan as of
September 30, 2015, which plan will terminate as to new awards following this offering;
- •
- an additional 1,462,020 shares of our common stock reserved for issuance under our 2011 Director Stock Purchase Plan and 2011 Employee
Stock Purchase Plan as of September 30, 2015, which plans will terminate as to new awards following this offering;
- •
- an additional 2,933,332 shares of our common stock to be reserved for future issuance under our 2015 Equity Incentive Plan following
this offering; and
- •
- an additional 266,668 shares of our common stock to be reserved for future issuance under our 2015 Employee Stock Purchase Plan following this offering.
41
If you invest in our common stock in this offering, your interest will be diluted to the extent of the difference between the initial public offering price per share and the pro forma as adjusted net tangible book value per share of our common stock immediately after this offering. Net tangible book value per share is determined by dividing our total tangible assets less total liabilities and redeemable common stock by the number of outstanding shares of common stock, including common stock subject to redemption.
As of September 30, 2015, we had a net tangible book value of $15.8 million, or $4.64 per share of common stock. On a pro forma basis, after giving effect to the vesting of shares of restricted stock and stock option awards and the reclassification of our redeemable common stock to stockholders' equity and additional paid in capital in connection with the termination of our shareholders' agreement effective upon the completion of this offering, our net tangible book value would have been approximately $26.1 million, or $2.02 per share.
Investors participating in this offering will incur immediate and substantial dilution. After giving effect to the issuance and sale of 6,153,846 shares of our common stock in this offering at an assumed initial public offering price of $12.00 per share, which is the midpoint of the price range set forth on the cover page of this prospectus, and after deducting the estimated underwriting discounts and commissions and estimated offering expenses payable by us, our pro forma as adjusted net tangible book value as of September 30, 2015, would have been approximately $89.6 million, or $4.71 per share of common stock. This represents an immediate increase in the pro forma net tangible book value of $2.69 per share to existing stockholders and an immediate dilution of $7.29 per share to investors purchasing shares of our common stock in this offering. The following table illustrates this per share dilution on a per share basis:
Assumed initial public offering price per share |
$ | 12.00 | |||||
Pro forma net tangible book value per share as of September 30, 2015 |
$ | 2.02 | |||||
Increase in pro forma net tangible book value per share attributable to this offering per share to existing investors |
2.69 | ||||||
| | | | | | | | |
Pro forma as adjusted net tangible book value per share after this offering |
4.71 | ||||||
| | | | | | | | |
Dilution per share to new investors |
$ | 7.29 | |||||
| | | | | | | | |
| | | | | | | | |
| | | | | | | | |
The dilution information discussed above is illustrative only and will change based on the actual initial public offering price and other terms of this offering determined at pricing. Each $1.00 increase or decrease in the assumed initial public offering price of $12.00 per share would increase or decrease our pro forma as adjusted net tangible book value by approximately $0.30 per share, assuming that the number of shares offered by us, as set forth on the cover page of this prospectus, remains the same.
The following table illustrates the differences between the number of shares of common stock purchased from us, the total consideration paid, and the average price per share paid by existing stockholders and new investors purchasing shares of our common stock in this offering based on an assumed initial public offering price of $12.00 per share, the midpoint of the price range on the cover
42
page of this prospectus, and before deducting underwriting discounts and commissions and estimated offering expenses as of September 30, 2015 on an as adjusted basis.
| |
|
|
Total Consideration |
|
||||||||||||
|---|---|---|---|---|---|---|---|---|---|---|---|---|---|---|---|---|
| |
Shares Purchased | |
||||||||||||||
| |
Average Price Per Share |
|||||||||||||||
| |
Number | Percent | Amount | Percent | ||||||||||||
Existing stockholders |
12,889,968 | 67.7 | % | $ | 13,113,000 | 15.1 | % | $ | 1.02 | |||||||
New investors |
6,153,846 | 32.3 | 73,846,152 | 84.9 | 12.00 | |||||||||||
| | | | | | | | | | | | | | | | | |
Total |
19,043,814 | 100.0 | % | $ | 86,959,152 | 100.0 | % | $ | 4.57 | |||||||
| | | | | | | | | | | | | | | | | |
| | | | | | | | | | | | | | | | | |
| | | | | | | | | | | | | | | | | |
Each $1.00 increase or decrease in the assumed initial public offering price of $12.00 per share, which is the midpoint of the price range set forth on the cover page of this prospectus, would increase or decrease the total consideration paid by new investors by $6.2 million, assuming that the number of shares offered by us, as set forth on the cover page of this prospectus, remains the same.
The foregoing table excludes:
- •
- 4,005,000 shares of common stock issuable upon exercise of options outstanding at a weighted-average exercise price of
$2.21 per share under our Equity and Incentive Plan as of September 30, 2015;
- •
- an additional 403,628 shares of our common stock reserved for future issuance under our Equity and Incentive Plan, which plan will
terminate as to new awards following this offering;
- •
- an additional 1,462,020 shares of our common stock reserved for issuance under our 2011 Director Stock Purchase Plan and 2011
Employee Stock Purchase Plan as of September 30, 2015, which plans will terminate as to new awards following this offering;
- •
- an additional 2,933,332 shares of our common stock to be reserved for future issuance under our 2015 Equity Incentive Plan following
this offering; and
- •
- an additional 266,668 shares of our common stock to be reserved for future issuance under our 2015 Employee Stock Purchase Plan following this offering.
In addition, if the underwriters exercise their option to purchase additional shares in full, the number of shares held by new investors would increase to 7,076,922, or 37.2% of the total number of shares of our common stock outstanding after this offering.
The shares of our common stock reserved for future issuance under our equity benefit plans will be subject to automatic annual increases in accordance with the terms of the plans. To the extent that options are exercised, new options are issued under our equity incentive plan or we issue additional shares of common stock in the future, there will be further dilution to investors participating in this offering. In addition, we may choose to raise additional capital because of market conditions or strategic considerations, even if we believe that we have sufficient funds for our current or future operating plans. If we raise additional capital through the sale of equity or convertible debt securities, the issuance of these securities could result in further dilution to our stockholders.
43
SELECTED CONSOLIDATED FINANCIAL DATA
The following selected consolidated financial data for the years ended December 31, 2012, 2013 and 2014 and the selected consolidated balance sheet data as of December 31, 2013 and 2014 are derived from our audited consolidated financial statements included elsewhere in this prospectus. We have derived the summary consolidated statement of income for the nine months ended September 30, 2014 and 2015 and balance sheet data as of September 30, 2015 from our unaudited consolidated interim financial statements appearing elsewhere in this prospectus. The unaudited consolidated financial data for the nine months ended September 30, 2014 and 2015 and as of September 30, 2015 includes all adjustments, consisting only of normal recurring accruals that are necessary in the opinion of our management for a fair presentation of our financial position and results of operations for these periods. Our historical results are not necessarily indicative of the results to be expected in the future.
The selected consolidated financial data should be read together with "Management's Discussion and Analysis of Financial Condition and Results of Operations" and in conjunction with the consolidated financial statements, related notes, and other financial information included elsewhere in this prospectus.
Consolidated statements of income
| |
Year Ended December 31, | Nine Months Ended September 30, |
||||||||||||||
|---|---|---|---|---|---|---|---|---|---|---|---|---|---|---|---|---|
| |
2012 | 2013 | 2014 | 2014 | 2015 | |||||||||||
| |
(In thousands, except per share amounts) |
|||||||||||||||
Revenue: |
||||||||||||||||
Financial process automation solutions |
$ | 8,440 | $ | 18,914 | $ | 24,073 | $ | 17,876 | $ | 21,073 | ||||||
Procurement solutions |
10,021 | 10,391 | 12,071 | 9,254 | 8,852 | |||||||||||
Asset management solutions |
39,093 | 38,079 | 48,652 | 36,729 | 35,230 | |||||||||||
| | | | | | | | | | | | | | | | | |
Total revenue |
57,554 | 67,384 | 84,796 | 63,859 | 65,155 | |||||||||||
Direct costs of revenue (excluding depreciation and amortization shown separately below): |
||||||||||||||||
Financial process automation solutions |
3,918 | 7,518 | 8,291 | 6,247 | 7,105 | |||||||||||
Procurement solutions |
928 | 1,124 | 1,200 | 788 | 874 | |||||||||||
Asset management solutions |
22,384 | 18,199 | 26,783 | 21,599 | 19,239 | |||||||||||
| | | | | | | | | | | | | | | | | |
Total direct costs of revenue |
27,230 | 26,841 | 36,274 | 28,634 | 27,218 | |||||||||||
Operating expenses: |
||||||||||||||||
Sales and marketing |
11,497 | 12,491 | 15,100 | 11,149 | 12,106 | |||||||||||
General and administrative |
6,345 | 6,784 | 7,902 | 6,063 | 5,638 | |||||||||||
Depreciation and amortization |
10,341 | 10,191 | 10,622 | 7,750 | 9,434 | |||||||||||
Other income |
— | — | — | — | (463 | ) | ||||||||||
| | | | | | | | | | | | | | | | | |
Total operating expenses |
28,183 | 29,466 | 33,624 | 24,962 | 26,715 | |||||||||||
| | | | | | | | | | | | | | | | | |
Operating income |
2,141 | 11,077 | 14,898 | 10,263 | 11,222 | |||||||||||
Interest expense |
(1,280 | ) | (3,239 | ) | (3,296 | ) | (2,499 | ) | (2,435 | ) | ||||||
Interest income |
68 | 80 | 110 | 86 | 106 | |||||||||||
Foreign exchange gain (loss), net |
43 | (382 | ) | (639 | ) | (384 | ) | (1,035 | ) | |||||||
| | | | | | | | | | | | | | | | | |
Income before income taxes |
972 | 7,536 | 11,073 | 7,466 | 7,858 | |||||||||||
Provision for income taxes |
344 | 2,893 | 4,245 | 2,853 | 3,622 | |||||||||||
| | | | | | | | | | | | | | | | | |
Net income |
$ | 628 | $ | 4,643 | $ | 6,828 | $ | 4,613 | $ | 4,236 | ||||||
| | | | | | | | | | | | | | | | | |
| | | | | | | | | | | | | | | | | |
| | | | | | | | | | | | | | | | | |
Net income per common share: |
||||||||||||||||
Basic |
$ | 0.05 | $ | 0.37 | $ | 0.54 | $ | 0.37 | $ | 0.34 | ||||||
Diluted |
$ | 0.05 | $ | 0.36 | $ | 0.52 | $ | 0.35 | $ | 0.32 | ||||||
Pro forma diluted |
$ | 0.49 | $ | 0.29 | ||||||||||||
Weighted average common shares outstanding: |
||||||||||||||||
Basic |
12,511,328 | 12,406,060 | 12,578,160 | 12,568,956 | 12,635,924 | |||||||||||
Diluted |
13,016,692 | 12,954,940 | 13,132,868 | 13,119,856 | 13,203,104 | |||||||||||
Pro forma diluted |
13,910,464 | 14,517,663 | ||||||||||||||
44
Consolidated balance sheet data
| |
As of December 31, | |
||||||||
|---|---|---|---|---|---|---|---|---|---|---|
| |
As of September 30, 2015 |
|||||||||
| |
2013 | 2014 | ||||||||
| |
(In thousands) |
|||||||||
Cash and cash equivalents |
$ | 22,300 | $ | 25,673 | $ | 32,767 | ||||
Total current assets |
138,322 | 159,627 | 192,753 | |||||||
Total assets |
191,510 | 215,062 | 255,432 | |||||||
Total current liabilities |
95,783 | 113,051 | 126,913 | |||||||
Total non-current liabilities |
72,342 | 71,600 | 93,499 | |||||||
Total redeemable common stock |
8,266 | 8,344 | 8,344 | |||||||
Stockholders' equity |
15,119 | 22,067 | 26,676 | |||||||
Other key financial metrics
| |
Year Ended December 31, | Nine Months Ended September 30, |
||||||||||||||
|---|---|---|---|---|---|---|---|---|---|---|---|---|---|---|---|---|
| |
2012 | 2013 | 2014 | 2014 | 2015 | |||||||||||
| |
(In thousands) |
|||||||||||||||
Adjusted revenue |
$ | 42,330 | $ | 53,281 | $ | 62,359 | $ | 45,459 | $ | 49,548 | ||||||
Adjusted EBITDA |
$ | 12,612 | $ | 21,579 | $ | 25,880 | $ | 18,279 | $ | 20,968 | ||||||
To provide investors with additional information regarding our financial results, we have used adjusted revenue and adjusted EBITDA, both of which are non-GAAP measures, within this prospectus.
We have included these non-GAAP measures in this prospectus because they are key measures used by our management and board of directors to understand and evaluate our core operating performance and trends, to prepare and approve our annual budget and to develop short- and long-term operational plans. In addition, we believe that the exclusion of the items eliminated in calculating adjusted revenue and adjusted EBITDA can provide useful measures for period-to-period comparisons of our core business. Accordingly, we believe that these non-GAAP measures provide useful information to investors and others in understanding and evaluating our operating results in the same manner as our management and board of directors.
These non-GAAP measures are subject to limitations, including those described in this section. As such, you should consider adjusted revenue and adjusted EBITDA alongside other GAAP-based financial performance measures, including revenue and net income, and our other GAAP financial results. Management addresses the inherent limitations associated with using these measures through disclosure of such limitations, presentation of our financial statements in accordance with GAAP and reconciliation of the non-GAAP measures to the most directly comparable GAAP measure in each case. A reconciliation of each non-GAAP measure to the most directly comparable GAAP-based measure along with material limitations of such measure are included in this section.
Adjusted revenue
We define adjusted revenue as revenue calculated in accordance with GAAP less the direct cost of revenue- asset management solutions- cost of equipment sold. Adjusted revenue excludes the effects of the gross presentation in revenue of our sales of equipment. Although we sell equipment in support of certain of our asset management services, it is not our primary line of business. As such, we use adjusted revenue to include only the net profit on sales of equipment.
Although adjusted revenue measures are frequently used by investors and securities analysts in their evaluations of companies, adjusted revenue measures have limitations as analytical tools, and you
45
should not consider them in isolation or as a substitute for analysis of our results of operations as reported under GAAP. Some of these limitations are:
- •
- adjusted revenue does not reflect the full value of the equipment sold for which we took risk of loss while in inventory; and
- •
- other companies, including companies in our industry, may calculate adjusted revenue or similarly titled measures differently, which reduces its usefulness as a comparative measure.
Because of these and other limitations, you should consider adjusted revenue alongside other GAAP-based financial performance measures, including total revenue and our other GAAP financial results. Management addresses the inherent limitations associated with using adjusted revenue through disclosure of such limitations, presentation of our financial statements in accordance with GAAP and reconciliation of adjusted revenue to the most directly comparable GAAP measure, total revenue. The following table presents a reconciliation of adjusted revenue to total revenue for each of the periods identified.
| |
Year Ended December 31, | Nine Months Ended September 30, |
||||||||||||||
|---|---|---|---|---|---|---|---|---|---|---|---|---|---|---|---|---|
| |
2012 | 2013 | 2014 | 2014 | 2015 | |||||||||||
| |
(In thousands) |
|||||||||||||||
Total revenue |
$ | 57,554 | $ | 67,384 | $ | 84,796 | $ | 63,859 | $ | 65,155 | ||||||
Adjustments: |
||||||||||||||||
Less: direct cost of revenue- asset management solutions- cost of equipment sold |
(15,224 | ) | (14,103 | ) | (22,437 | ) | (18,400 | ) | (15,607 | ) | ||||||
| | | | | | | | | | | | | | | | | |
Adjusted revenue |
$ | 42,330 | $ | 53,281 | $ | 62,359 | $ | 45,459 | $ | 49,548 | ||||||
| | | | | | | | | | | | | | | | | |
| | | | | | | | | | | | | | | | | |
| | | | | | | | | | | | | | | | | |
Adjusted EBITDA
We define adjusted EBITDA as net income calculated in accordance with GAAP plus: (i) interest expense; (ii) provision for income tax; (iii) depreciation; (iv) amortization; (v) stock-based compensation expense; and (vi) foreign currency losses (gains) associated with remeasurement of our foreign transactions into our functional currency, the U.S. dollar.
Although adjusted EBITDA measures are frequently used by investors and securities analysts in their evaluations of companies, adjusted EBITDA measures each have limitations as an analytical tool, and you should not consider them in isolation or as a substitute for analysis of our results of operations as reported under GAAP. Some of these limitations are:
- •
- although depreciation and amortization are non-cash charges, the assets being depreciated and amortized may have to be replaced in the
future, and adjusted EBITDA does not reflect cash capital expenditure requirements for such replacements or for new capital expenditure requirements;
- •
- adjusted EBITDA does not reflect cash interest income or expense;
- •
- adjusted EBITDA does not reflect changes in, or cash requirements for, our working capital needs;
- •
- adjusted EBITDA does not reflect the potentially dilutive impact of stock-based compensation;
- •
- adjusted EBITDA does not reflect tax payments that may represent a reduction in cash available to us;
and
- •
- other companies, including companies in our industry, may calculate adjusted EBITDA or similarly titled measures differently, which reduces its usefulness as a comparative measure.
46
Because of these and other limitations, you should consider adjusted EBITDA alongside other GAAP-based financial performance measures, including various cash flow metrics, net income and our other GAAP financial results. Management addresses the inherent limitations associated with using adjusted EBITDA through disclosure of such limitations, presentation of our financial statements in accordance with GAAP and reconciliation of adjusted EBITDA to the most directly comparable GAAP measure, net income. Further, management also reviews GAAP measures, and evaluates individual measures that are not included in adjusted EBITDA such as our level of capital expenditures and interest expense, among other items.
The following table presents a reconciliation of adjusted EBITDA to net income, the most comparable GAAP measure, for each of the periods identified.
| |
Year Ended December 31, | Nine Months Ended September 30, |
||||||||||||||
|---|---|---|---|---|---|---|---|---|---|---|---|---|---|---|---|---|
| |
2012 | 2013 | 2014 | 2014 | 2015 | |||||||||||
| |
(In thousands) |
|||||||||||||||
Net income |
$ | 628 | $ | 4,643 | $ | 6,828 | $ | 4,613 | $ | 4,236 | ||||||
Adjustments: |
||||||||||||||||
Interest expense |
1,280 | 3,239 | 3,296 | 2,499 | 2,435 | |||||||||||
Provision for income taxes |
344 | 2,893 | 4,245 | 2,853 | 3,622 | |||||||||||
Depreciation and amortization |
10,341 | 10,191 | 10,622 | 7,750 | 9,434 | |||||||||||
| | | | | | | | | | | | | | | | | |
|
12,593 | 20,966 | 24,991 | 17,715 | 19,727 | |||||||||||
Adjustments: |
||||||||||||||||
Stock-based compensation expense |
62 | 231 | 250 | 180 | 206 | |||||||||||
Foreign currency losses (gains) associated with remeasurement |
(43 | ) | 382 | 639 | 384 | 1,035 | ||||||||||
| | | | | | | | | | | | | | | | | |
Adjusted EBITDA |
$ | 12,612 | $ | 21,579 | $ | 25,880 | $ | 18,279 | $ | 20,968 | ||||||
| | | | | | | | | | | | | | | | | |
| | | | | | | | | | | | | | | | | |
| | | | | | | | | | | | | | | | | |
47
MANAGEMENT'S DISCUSSION AND ANALYSIS
OF FINANCIAL CONDITION AND RESULTS OF OPERATIONS
The following discussion should be read in conjunction with the consolidated financial statements and accompanying notes and the information contained in other sections of this prospectus, particularly under the headings "Risk Factors," "Selected Consolidated Financial Data" and "Business." It contains forward-looking statements that involve risks and uncertainties, and is based on the beliefs of our management, as well as assumptions made by, and information currently available to, our management. Our actual results could differ materially from those anticipated by our management in these forward-looking statements as a result of various factors, including those discussed below and elsewhere in this prospectus, particularly under the heading "Risk Factors."
Overview
We are a growing provider of technology-enabled business-to-business solutions for the financial process, procurement and asset management needs of businesses. We leverage our proprietary technology, deep expertise and supplier and vendor relationships to help enterprises and organizations of varying sizes manage complex and dynamic operational and administrative processes that are frequently managed internally and have required substantial internal resources. While we originated as a provider of procurement and fleet management solutions for the transportation industry and a large portion of our customers remain in the transportation industry, we have used our technology and the expertise we developed to offer robust financial process automation solutions and advanced procurement solutions to companies in multiple industries in recent years.
Our financial process automation solutions represented 28.4% and 32.3% of our total revenue and 38.6% and 42.5% of our adjusted revenue during the year ended December 31, 2014 and the nine months ended September 30, 2015, respectively. These solutions consist primarily of our cloud-based technology offerings that automate accounts receivable and accounts payable processes for our clients, including e-invoicing, credit and collections management, working capital management, and reporting analytics. We generated this revenue from two principal products: CorConnect, our accounts receivable automation platform; and COR360, our accounts payable automation platform. We generally earn a fee based on the total dollar value of the transactions processed for our CorConnect customers, with such fee based in part on whether we take credit risk on behalf of those customers. We also earn a fee per invoice processed for COR360 customers. Our financial process automation solutions revenue was a rapidly growing area of our business with growth in the year ended December 31, 2014 of 27.3% as compared to the same period in the prior year and a CAGR of 68.9% from the year ended December 31, 2012 to the year ended December 31, 2014. Our financial process automation solutions revenue continues to be a rapidly growing area of our business with growth in the nine months ended September 30, 2015 of 17.9% as compared to the nine months ended September 30, 2014. The recent growth in our financial process automation solutions revenue was largely driven by the addition in February 2013 of a network of suppliers, all of whom are parts dealers for Daimler. These parts dealers and their customers accounted for 47.7% and 49.6% of our financial process automation solutions revenue and 13.5% and 16.1% of our total revenue during the year ended December 31, 2014 and the nine months ended September 30, 2015, respectively, but were not a material relationship prior to 2013.
Our procurement solutions represented 14.2% and 13.6% of our total revenue and 19.4% and 17.9% of our adjusted revenue during the year ended December 31, 2014 and the nine months ended September 30, 2015, respectively. These solutions, which currently predominantly support transportation-related needs, enable participants in our network of purchasers and suppliers to optimize their procurement processes from inventory sourcing to payment and collection management and include group purchasing and spend management tools. We typically earn fees from our customers that purchase through our programs and the suppliers that participate in our programs. Our procurement solutions revenue has experienced steady growth since our inception with growth in the year ended
48
December 31, 2014 of 16.2% as compared to the prior year. However, our procurement solutions revenue declined in the nine months ended September 30, 2015 by 4.3% as compared to the nine months ended September 30, 2014 due to a reduction in the selling prices of the underlying products in transactions where our fees are based on a percentage of the value of such transactions.
Our asset management solutions represented 57.4% and 54.1% of our total revenue and 42.0% and 39.6% of our adjusted revenue during the year ended December 31, 2014 and the nine months ended September 30, 2015, respectively. These solutions provide strategic planning, asset acquisition, sales of equipment and disposition, and asset financing alternatives to help businesses lower the total cost of capital asset ownership through a comprehensive menu of data-driven solutions. Our asset management solutions are currently focused almost entirely on the transportation sector. We earn fees for equipment financing provided directly by us and for our services in coordinating the resale of assets or the arrangement of third-party financing. Although much of the service we provide to our customers focuses on asset planning, we typically only earn revenue when our customers act on that planning. Our asset management solutions revenue can vary substantially from period to period since the underlying asset value directly aligns with the revenue we receive in connection with our solutions, particularly for our sales of equipment services. However, our direct costs (excluding depreciation and amortization) related to this solution are generally consistent relative to revenue period over period.
We originally founded our business in 1996 to help independent commercial truck operators to aggregate their purchasing activity to obtain leveraged pricing and effectively compete with larger companies. As we have grown and evolved since that time, we had the following key milestones in the development of our business:
- •
- In 1998, our first year providing procurement solutions, we processed transactions with a face value of $5.4 million through
our procurement solutions.
- •
- In 2002, we acquired Corcentric, our primary technology provider at the time, to establish a proprietary technology platform for our
procurement solutions. We have since successfully leveraged that technology to introduce our financial process automation solutions; our CorConnect product line is based on the technology we acquired
with Corcentric.
- •
- In 2006, we acquired NationaLease Purchasing Corporation to form the largest transportation volume-based procurement organization in
North America. Also in 2006, we processed the one millionth invoice for our customers through CorConnect.
- •
- In 2010, we acquired the COR360 accounts payable automation solution to expand our technology offerings and CURE Leasing and
Maintenance to expand our leasing offerings to the transportation industry.
- •
- In 2013, we processed over $7.5 billion in transaction volume through our financial process automation and procurement
solutions for our customers and their transaction partners, primarily due to welcoming the Daimler parts dealers network onto our supplier network beginning in February 2013.
- •
- In 2014, we processed 9.2 million transactions for our customers through our financial process automation solutions representing over $12.2 billion in transaction volume, which includes transactions processed for our procurement solutions customers.
We now provide a comprehensive suite of technology-enabled solutions primarily supporting the transportation industry, including not only end users of transportation equipment, but also suppliers, equipment manufacturers and their distributors. We also address adjacent industries with similar financial process, procurement and asset management challenges. For example, our solutions are utilized across a broad range of additional industries including manufacturing, retail, healthcare, banking, entertainment and higher education.
49
As we have expanded the availability and capabilities of our solutions, particularly the financial process automation solution, our growth has generally accelerated since 2012:
- •
- Our total revenue grew 25.8% to $84.8 million during the year ended December 31, 2014 as compared to
$67.4 million during the prior year and 2.0% to $65.2 million during the nine months ended September 30, 2015 as compared to $63.9 million during the same period in the
prior year.
- •
- Our net income was $6.8 million during the year ended December 31, 2014, an increase of $2.2 million from
$4.6 million during the prior year, and was $4.2 million during the nine months ended September 30, 2015, a decrease of $0.4 million from $4.6 million during the
same period in the prior year.
- •
- Our adjusted EBITDA grew 19.9% to $25.9 million during the year ended December 31, 2014 as compared to $21.6 million during the prior year and 14.7% to $21.0 million during the nine months ended September 30, 2015 as compared to $18.3 million during the same period in the prior year.
Key financial metrics
| |
Year Ended December 31, | Nine Months Ended September 30, |
||||||||||||||
|---|---|---|---|---|---|---|---|---|---|---|---|---|---|---|---|---|
| |
2012 | 2013 | 2014 | 2014 | 2015 | |||||||||||
| |
(In thousands) |
|
|
|||||||||||||
Total revenue |
$ | 57,554 | $ | 67,384 | $ | 84,796 | $ | 63,859 | $ | 65,155 | ||||||
Net income |
628 | 4,643 | 6,828 | 4,613 | 4,236 | |||||||||||
Adjusted revenue |
42,330 | 53,281 | 62,359 | 45,459 | 49,548 | |||||||||||
Adjusted EBITDA |
12,612 | 21,579 | 25,880 | 18,279 | 20,968 | |||||||||||
We monitor the key metrics set forth in the preceding table to help us evaluate trends, establish budgets, measure the effectiveness and efficiency of our operations and gauge our cash generation. We discuss total revenue and the components of net income in the sections titled "—Components of operating results" and "—Results of operations." The other metrics presented are described in further detail as follows:
Adjusted revenue
We define adjusted revenue as revenue calculated in accordance with GAAP less the direct cost of revenue- asset management solutions- cost of equipment sold. Although we sell equipment in support of certain of our asset management services, it is not our primary line of business. As such, we use adjusted revenue to include only the net profit on sales of equipment.
Adjusted EBITDA
We define adjusted EBITDA as net income calculated in accordance with GAAP plus: (i) interest expense; (ii) provision for income tax; (iii) depreciation; (iv) amortization; (v) stock-based compensation expense; and (vi) foreign currency losses (gains) associated with remeasurement of our foreign transactions into our functional currency, the U.S. dollar.
Adjusted revenue and adjusted EBITDA are non-GAAP measures. A reconciliation of these non-GAAP measures to the most directly comparable GAAP-based measures along with a summary of the definition and material limitations of each measure are included in the section titled "Selected Consolidated Financial Data—Other key financial metrics."
50
Factors affecting our performance
We believe that the growth of our business and our future success depend on various opportunities, challenges and other factors, including the following:
Key customer acquisition
Growth in our customer base is an important factor that contributes to our revenue growth. We believe that we have opportunities to further penetrate the transportation industry, as well as continue to expand into other industries. However, the number and size of new customers signed may vary from period to period. Our growth may also rely on our ability to obtain new customers and customer networks with substantial transaction volume that result in large opportunities for us to generate additional revenue. For example, our recent growth in financial process automation solutions revenue was largely driven by the establishment of our relationship with Daimler in February 2013 and the resulting increase in transaction volume. Transactions between Daimler's parts dealers and their customers were 47.7% and 49.6% of our financial process automation solutions revenue and 13.5% and 16.1% of our total revenue during the year ended December 31, 2014 and the nine months ended September 30, 2015, respectively, but were not a material relationship prior to 2013. Our future growth will depend on our ability to attract additional large customers.
Differentiated solutions and expertise
Our ability to differentiate our offerings from our competitors is critical to our ability to win and retain business. Many of our competitors are pure software and technology providers that do not address the credit risk and financial needs of their customers. Alternatively, many of our competitors are financial and leasing institutions that do not provide technology or expertise in financial process management, procurement or asset management. We must continue to demonstrate our expertise and invest in innovation in all fields to remain attractive to our customers.
Supplier relationship
The number and quality of the suppliers we offer are factors that are critical to our ability to attract and retain customers, which in turn is a key driver of our revenue. As of September 30, 2015, our customers have access to more than 5,000 dealers and distributors for over 135 suppliers using our solutions. As we develop our relationships with our vendors, they generally are willing to provide us with more favorable terms. Improved terms and access to more suppliers helps us to attract additional customers. Similarly, as our customer base grows, more suppliers are willing to participate in our network. Furthermore, as our customer base continues to diversify across industries, we have opportunities to reach new suppliers in additional industry verticals. We intend to continue to develop and cultivate our supplier relationships by providing suppliers with opportunities for effective brand positioning and high-volume sales to an attractive customer base. Our ability to deliver these benefits will affect the volume and pricing of goods we are able to purchase from our suppliers in the more immediate future and the number of customers that we retain and new customers that we add in the long-term.
Sales and implementation cycles
Our solutions often address archaic, neglected and entrenched processes of our customers. Although our solutions are generally easy to implement technologically, they may also require a process and cultural change for an organization, which may cause the length of our sales cycle to vary as different organizations take varying times to determine whether to implement our solutions. As such, our sales cycles may be difficult to predict on a quarterly basis, which may frequently influence our results of operations.
51
Effective credit and collections management
In many cases, for customers using CorConnect, we pay supplier invoices on their behalf prior to receiving payment from those customers. In order to manage our own risk exposure, we must efficiently and effectively screen our customers to ensure they do not create excessive credit risk for us. Our solutions enable this regular review process by collecting data regarding every transaction processed through our solutions in real-time, which allows us to track changes in customer behavior. Historically, we have not incurred substantial uncollectible debts from our customers as we have been successful at managing our credit and collections risk, which we have done by reviewing and assessing the historical level of write offs for our customers with a similar risk profile, known economic or industry trends, and customer specific information each quarter. This enables us to manage our credit risk by regularly reassessing the risk assigned to each customer and modifying, if needed, such risk and the amount of credit extended to the customer.
Macroeconomic factors
Many of our solutions rely on increased transaction volume to generate revenue and profitability. However, the transaction volume in business-to-business goods and services is historically susceptible to macroeconomic trends. For example, overall downturns in consumer spending typically leads to less demand for business-to-business operations. Many of the industries we serve are acutely reactive to macroeconomic conditions. This may lead to variability in our periodic results.
Components of operating results
Revenue sources
We primarily generate revenue from three solution types: financial process automation, procurement and asset management.
Financial process automation solutions
We generated financial process automation solutions revenue from two principal products: CorConnect, our accounts receivable automation platform; and COR360, our accounts payable automation platform.
- •
- CorConnect. For our CorConnect clients, we provide a closed-loop private commerce network that electronically connects suppliers, and their vendors or dealers, to their purchasers. In order to facilitate these transactions, in many cases we pay invoices directly on behalf of purchasers and take responsibility for collections from those purchasers so suppliers in our network do not need to do so. Our fees are derived from a percentage of the dollar volume of transactions processed through CorConnect for which we assume credit risk. However, for scenarios in which we do not assume credit risk on a purchaser's behalf, we receive a fixed fee per transaction. Although we pay the suppliers directly, we are not the primary obligor to deliver goods or services in these transactions to purchasers. As such, we only recognize revenue for the portion of the gross transaction value that we retain for our fees. We recognize revenue at the time we accept a transaction in CorConnect. Our contracts with CorConnect clients typically have a term between three and seven years. Total revenue related to CorConnect clients was $7.9 million, $17.5 million, $21.6 million, $16.1 million and $18.6 million for the years ended December 31, 2012, 2013 and 2014, and the nine months ended September 30, 2014 and 2015, respectively. We processed 1.8 million, 5.0 million, 6.2 million, 4.6 million and 5.1 million transactions for our CorConnect participants for which we assumed credit risk during the years ended December 31, 2012, 2013 and 2014, and the nine months ended September 30, 2014 and 2015, respectively. Each purchase generates two transactions within our system, which are the receipt of an invoice from the supplier for the purchase and the transmission of such invoice to the purchaser. Our average transaction size was $544, $423, $421, $423 and $423 during the years ended
52
- •
- COR360. Our customers pay a fee for their use of COR360 that is typically based on the number of invoices processed. We generally recognize revenue for the transaction at the time the invoice is processed through COR360. Our contracts with COR360 customers typically have a term between one and three years. In addition, customers pay a fixed monthly fee to use COR360. Finally, we typically receive a one-time implementation fee from new COR360 users. Total revenue related to COR360 clients was $0.5 million, $1.4 million, $2.5 million, $1.8 million and $2.5 million for the years ended December 31, 2012, 2013 and 2014 and the nine months ended September 30, 2014 and 2015, respectively. We processed 0.3 million, 0.8 million, 1.7 million, 1.3 million and 1.3 million transactions for our COR360 participants during the years ended December 31, 2012, 2013 and 2014, and the nine months ended September 30, 2014 and 2015, respectively.
December 31, 2012, 2013 and 2014, and the nine months ended September 30, 2014 and 2015, respectively. This represented a total transaction volume for which we assumed credit risk of $0.5 billion, $1.1 billion, $1.3 billion, $1.0 billion and $1.1 billion during the years ended December 31, 2012, 2013 and 2014 and the nine months ended September 30, 2014 and 2015, respectively. Total revenue related to CorConnect clients for which we assumed credit risk was $7.4 million, $16.9 million, $20.7 million, $15.6 million and $18.1 million for the years ended December 31, 2012, 2013 and 2014, and the nine months ended September 30, 2014 and 2015, respectively. In addition, we processed an additional 0.7 million, 0.9 million, 1.3 million, 0.9 million and 1.1 million transactions for our CorConnect participants in which we did not assume credit risk during the years ended December 31, 2012, 2013 and 2014, and the nine months ended September 30, 2014 and 2015, respectively. Total revenue related to CorConnect clients for which we did not assume credit risk was $0.5 million, $0.6 million, $0.9 million, $0.5 million and $0.5 million for the years ended December 31, 2012, 2013 and 2014, and the nine months ended September 30, 2014 and 2015, respectively.
Our financial process automation solutions revenue was a rapidly growing area of our business with growth in the year ended December 31, 2014 of 27.3%, representing 28.4% of our total revenue as compared to the same period in the prior year and a CAGR of 68.9% from the year ended December 31, 2012 to the year ended December 31, 2014. Our financial process automation solutions revenue continues to be a strong area of our business with growth in the nine months ended September 30, 2015 of 17.9% as compared to the nine months ended September 30, 2014. The recent growth in our financial process automation solutions revenue was largely driven by the addition in February 2013 of a network of suppliers, all of whom are parts dealers for Daimler. Transactions between Daimler's parts dealers and their customers were 47.7% and 49.6% of our total financial process automation solutions revenue during the year ended December 31, 2014, and the nine months ended September 30, 2015, respectively but were not a material relationship prior to 2013. We expect this solution to continue to be an area of growth for our business in the immediate future as we strive to capitalize on our reputation for success with a large network such as Daimler's to attract additional large networks of customers.
Procurement solutions
We receive revenue from procurement solutions from both purchasers and our suppliers as follows:
- •
- Revenue from purchasers. Buyers in our procurement
networks pay us a fee in connection with their transactions. Fees are based on a product margin that varies by procurement program and typically includes a nominal fee per invoice.
- •
- Revenue from suppliers. Suppliers that participate in our network pay us a fee calculated either as a percentage of the transaction value under specific preferred procurement programs or as a pre-determined fee per transaction or item.
53
Our procurement solutions revenue has generally experienced growth since our inception including growth of 16.2% in the year ended December 31, 2014 as compared to the prior year. Although we experienced a decrease in the nine months ended September 30, 2015 as compared to the same period in the period year, we expect this solution to continue to be an area of growth for our business in the future.
Asset management solutions
Our asset management solutions have historically represented a majority of our revenue. Our asset management solutions provide a comprehensive offering of data-driven fleet management services including vehicle remarketing, asset planning and financing, and leasing and maintenance services. Although much of the service we provide to our customers focuses on asset planning, we typically only earn revenue when our customers act on that planning with our assistance in the following ways:
- •
- Fees for sales of equipment services. We facilitate the
planning, marketing, and execution of capital asset divestitures for our customers using our extensive experience and database of qualified buyers. We typically receive a fee based on the total amount
of the resale transaction value. In certain circumstances, we may purchase the asset outright from a customer, make necessary repairs or improvements and hold the asset for resale. We have not
generally carried more than $2.5 million of assets held for sale at a given time during prior years (with an average monthly carrying value of $0.8 million during the last three fiscal years),
nor have we typically held assets in inventory for longer than 120 days. Total revenue earned from our sales of equipment services was $16.5 million, $14.9 million,
$23.6 million, $19.4 million and $16.5 million for the years ended December 31, 2012, 2013 and 2014, and the nine months ended September 30, 2014 and 2015,
respectively.
- •
- Fees for leasing services. We provide equipment financing
through operating leases for certain customers that are affiliated with sponsor organizations that agree to remit amounts due directly to us. Our revenue related to operating leases was
$11.3 million, $11.0 million, $10.2 million, $7.6 million and $7.2 million for the years ended December 31, 2012, 2013 and 2014, and the nine months ended
September 30, 2014 and 2015, respectively.
- •
- Fees for other services. We provide various other
services to our customers. Our revenue related to other services was $11.3 million, $12.2 million, $14.8 million, $9.7 million and $11.6 million for the years ended
December 31, 2012, 2013 and 2014, and the nine months ended September 30, 2014 and 2015, respectively. Our services within this category include:
- •
- Lease brokerage services—We match our customers with financial institutions who can meet their financing
needs and receive a fee from the financial institution.
- •
- Asset planning services—We help customers identify the equipment that best meets their needs and we receive a
commission from the equipment manufacturer.
- •
- Maintenance services—We provide maintenance planning and administration services to our customers. This
includes both arranging planned maintenance and "road rescue" maintenance required when a vehicle becomes disabled. Through these services we match our customer with a qualified services professional
that is able to meet their needs in the most convenient manner. We receive a flat fee for each transaction that we arrange in addition to a commission, which is assessed as a percentage of the
underlying service cost.
- •
- Membership services—We provide national sales, training and educational support to certain leasing organizations for which we receive membership dues.
Our asset management solutions revenue experienced steady growth in earlier periods of our business but is not growing as rapidly as our other solutions or is modestly declining in certain of our asset management solutions services lines in recent periods and thus is becoming an increasingly
54
smaller percentage of our overall revenues in recent periods. Our asset management solutions revenue, particularly in our sales of equipment services, can vary substantially period to period since the underlying asset value, can have a substantial impact on our total revenue, notwithstanding that our profitability related to this solution area is generally consistent with prior periods. We expect this solution to continue to be an area of growth for our business.
Costs of revenue
We record direct costs of revenue related to our three solution types as follows:
Financial process automation solutions
Direct costs of financial process automation revenue primarily consist of bad debt expense related to uncollectible accounts receivable, direct support personnel costs, related-facilities rent and technology-related expenses such as hosting and support costs related to delivery of our solutions.
Procurement solutions
Direct costs of procurement revenue primarily consists of direct support personnel costs and processing fees assessed by our financial process automation solutions segment that represent an estimate of the costs incurred by our financial process automation solutions segment as described above.
Asset management solutions
Direct costs of asset management revenue primarily consists of costs that we incur to facilitate sales of equipment and to support our leasing and service operations, including the costs we incur to acquire equipment for sales, direct support personnel costs, bad debt expense, maintenance and other operational expenses. This is historically one of our largest costs since it often includes the direct cost of asset purchases that we incur in certain financing and equipment sales offerings.
Operating expenses
Sales and marketing expense
Sales and marketing expense primarily consists of compensation paid to our sales personnel. We generally compensate our sales personnel with a base salary plus a commission related to their sales. Commissions have historically been based on the revenue or gross profit we collect from customers for which sales personnel have primary responsibility. The percentage of revenue or gross profit paid as commission will vary depending on the type of client, type of transaction and composition of the sales team.
We expect these costs to increase on a dollar basis and as a percentage of revenue following this offering as we intend to increase our overall profile in other industries for our financial process automation and procurement solutions.
General and administrative expense
Our general and administrative expenses primarily consist of compensation costs for our information systems, finance and administrative support employees. This expense also includes stock-based compensation related to this function. Historically, we have managed our business with relatively modest general and administrative expenses. However, we expect these costs to increase modestly on a dollar basis and as a percentage of revenue following this offering as we expect that we will incur increased costs as a result of being a public company. We expect to incur additional compensation costs to maintain competitive compensation levels for our senior management and to invest in additional key
55
personnel to support various public company functions such as financial reporting, enhanced internal controls and investor relations.
Depreciation and amortization
Our depreciation expense is primarily attributable to our depreciation of revenue earning equipment which is either on lease with a customer or awaiting assignment to a customer. Depreciation of revenue-earning equipment is recorded using the straight line method over the useful life of the asset, which ranges from two and a half to ten years. We periodically review and adjust, as appropriate, the residual value and useful lives of revenue earning equipment. Our review of residual values and useful life of revenue-earning equipment is established with a long-term view considering historical market price changes, current and expected future market price trends and the expected life of the equipment. We also recognize depreciation expense attributable to purchases of computer hardware and software, equipment and furniture and fixtures. Our amortization expense is primarily attributable to the amortization of our internally developed software on a straight line basis over its estimated useful life, which is typically three years and intangible assets, which consist primarily of customer relationships, with amortization based on an estimated customer attrition of 25 years.
We expect these costs to remain generally consistent on a dollar basis and to decline as a percentage of revenue as our business grows. However, it may increase in the future as our business focus shifts more towards supporting our financial process automation and procurement solutions, and we make additional capital investments to support those areas.
Reporting segments
We generate revenue and manage our business principally through three reporting segments: financial process automation solutions, procurement solutions and asset management solutions. Shared services include general expenses to support all segments that are not allocated. Our management evaluates our reportable segments on the basis of revenue and operating income. Our management does not consider separate asset disclosure as a measure of segment performance, and we therefore do not present a segmented balance sheet. See note 18 to our year-end consolidated financial statements and note 16 to our interim consolidated financial statements appearing elsewhere in this prospectus for more information about our reporting segments and details of the operating income of our reporting segments.
| |
Year Ended December 31, 2012 | |||||||||||||||
|---|---|---|---|---|---|---|---|---|---|---|---|---|---|---|---|---|
| |
Financial Process Automation |
Procurement | Asset Management |
Shared Services |
Total | |||||||||||
| |
(In thousands) |
|||||||||||||||
Revenue |
$ | 8,440 | $ | 10,021 | $ | 39,093 | $ | — | $ | 57,554 | ||||||
Direct costs of revenue (excluding depreciation and amortization shown separately below) |
3,918 | 928 | 22,384 | — | 27,230 | |||||||||||
Operating expenses: |
||||||||||||||||
Sales and marketing |
1,389 | 2,813 | 6,588 | 707 | 11,497 | |||||||||||
General and administrative |
— | — | — | 6,345 | 6,345 | |||||||||||
Depreciation and amortization |
1,071 | — | 8,936 | 334 | 10,341 | |||||||||||
| | | | | | | | | | | | | | | | | |
Total operating expenses |
2,460 | 2,813 | 15,524 | 7,386 | 28,183 | |||||||||||
| | | | | | | | | | | | | | | | | |
Operating income |
$ | 2,062 | $ | 6,280 | $ | 1,185 | $ | (7,386 | ) | $ | 2,141 | |||||
| | | | | | | | | | | | | | | | | |
| | | | | | | | | | | | | | | | | |
| | | | | | | | | | | | | | | | | |
56
| |
Year Ended December 31, 2013 | |||||||||||||||
|---|---|---|---|---|---|---|---|---|---|---|---|---|---|---|---|---|
| |
Financial Process Automation |
Procurement | Asset Management |
Shared Services |
Total | |||||||||||
| |
(In thousands) |
|||||||||||||||
Revenue |
$ | 18,914 | $ | 10,391 | $ | 38,079 | $ | — | $ | 67,384 | ||||||
Direct costs of revenue (excluding depreciation and amortization shown separately below) |
7,518 | 1,124 | 18,199 | — | 26,841 | |||||||||||
Operating expenses: |
||||||||||||||||
Sales and marketing |
1,687 | 2,804 | 7,063 | 937 | 12,491 | |||||||||||
General and administrative |
— | — | — | 6,784 | 6,784 | |||||||||||
Depreciation and amortization |
1,870 | — | 7,977 | 344 | 10,191 | |||||||||||
| | | | | | | | | | | | | | | | | |
Total operating expenses |
3,557 | 2,804 | 15,040 | 8,065 | 29,466 | |||||||||||
| | | | | | | | | | | | | | | | | |
Operating income |
$ | 7,839 | $ | 6,463 | $ | 4,840 | $ | (8,065 | ) | $ | 11,077 | |||||
| | | | | | | | | | | | | | | | | |
| | | | | | | | | | | | | | | | | |
| | | | | | | | | | | | | | | | | |
| |
Year Ended December 31, 2014 | |||||||||||||||
|---|---|---|---|---|---|---|---|---|---|---|---|---|---|---|---|---|
| |
Financial Process Automation |
Procurement | Asset Management |
Shared Services |
Total | |||||||||||
| |
(In thousands) |
|||||||||||||||
Revenue |
$ | 24,073 | $ | 12,071 | $ | 48,652 | $ | — | $ | 84,796 | ||||||
Direct costs of revenue (excluding depreciation and amortization shown separately below) |
8,291 | 1,200 | 26,783 | — | 36,274 | |||||||||||
Operating expenses: |
||||||||||||||||
Sales and marketing |
2,736 | 3,270 | 7,818 | 1,276 | 15,100 | |||||||||||
General and administrative |
— | — | — | 7,902 | 7,902 | |||||||||||
Depreciation and amortization |
3,038 | — | 7,134 | 450 | 10,622 | |||||||||||
| | | | | | | | | | | | | | | | | |
Total operating expenses |
5,774 | 3,270 | 14,952 | 9,628 | 33,624 | |||||||||||
| | | | | | | | | | | | | | | | | |
Operating income |
$ | 10,008 | $ | 7,601 | $ | 6,917 | $ | (9,628 | ) | $ | 14,898 | |||||
| | | | | | | | | | | | | | | | | |
| | | | | | | | | | | | | | | | | |
| | | | | | | | | | | | | | | | | |
| |
Nine Months Ended September 30, 2014 | |||||||||||||||
|---|---|---|---|---|---|---|---|---|---|---|---|---|---|---|---|---|
| |
Financial Process Automation |
Procurement | Asset Management |
Shared Services |
Total | |||||||||||
| |
(In thousands) |
|||||||||||||||
Revenue |
$ | 17,876 | $ | 9,254 | $ | 36,729 | $ | — | $ | 63,859 | ||||||
Direct costs of revenue (excluding depreciation and amortization shown separately below) |
6,247 | 788 | 21,599 | — | 28,634 | |||||||||||
Operating expenses: |
||||||||||||||||
Sales and marketing |
2,047 | 2,583 | 5,729 | 790 | 11,149 | |||||||||||
General and administrative |
— | — | — | 6,063 | 6,063 | |||||||||||
Depreciation and amortization |
2,045 | — | 5,425 | 280 | 7,750 | |||||||||||
| | | | | | | | | | | | | | | | | |
Total operating expenses |
4,092 | 2,583 | 11,154 | 7,133 | 24,962 | |||||||||||
| | | | | | | | | | | | | | | | | |
Operating income |
$ | 7,537 | $ | 5,883 | $ | 3,976 | $ | (7,133 | ) | $ | 10,263 | |||||
| | | | | | | | | | | | | | | | | |
| | | | | | | | | | | | | | | | | |
| | | | | | | | | | | | | | | | | |
57
| |
Nine Months Ended September 30, 2015 | |||||||||||||||
|---|---|---|---|---|---|---|---|---|---|---|---|---|---|---|---|---|
| |
Financial Process Automation |
Procurement | Asset Management |
Shared Services |
Total | |||||||||||
| |
(In thousands) |
|||||||||||||||
Revenue |
$ | 21,073 | $ | 8,852 | $ | 35,230 | $ | — | $ | 65,155 | ||||||
Direct costs of revenue (excluding depreciation and amortization shown separately below) |
7,105 | 874 | 19,239 | — | 27,218 | |||||||||||
Operating expenses: |
||||||||||||||||
Sales and marketing |
2,229 | 2,584 | 6,070 | 1,223 | 12,106 | |||||||||||
General and administrative |
— | — | — | 5,638 | 5,638 | |||||||||||
Depreciation and amortization |
3,181 | — | 5,838 | 415 | 9,434 | |||||||||||
Other income |
— | — | (463 | ) | — | (463 | ) | |||||||||
| | | | | | | | | | | | | | | | | |
Total operating expenses |
5,410 | 2,584 | 11,445 | 7,276 | 26,715 | |||||||||||
| | | | | | | | | | | | | | | | | |
Operating income |
$ | 8,558 | $ | 5,394 | $ | 4,546 | $ | (7,276 | ) | $ | 11,222 | |||||
| | | | | | | | | | | | | | | | | |
| | | | | | | | | | | | | | | | | |
| | | | | | | | | | | | | | | | | |
Results of operations
The following table sets forth selected consolidated statements of income for each of the periods indicated.
| |
Year Ended December 31, | Nine Months Ended September 30, |
||||||||||||||
|---|---|---|---|---|---|---|---|---|---|---|---|---|---|---|---|---|
| |
2012 | 2013 | 2014 | 2014 | 2015 | |||||||||||
| |
(In thousands) |
|||||||||||||||
Revenue: |
||||||||||||||||
Financial process automation solutions |
$ | 8,440 | $ | 18,914 | $ | 24,073 | $ | 17,876 | $ | 21,073 | ||||||
Procurement solutions |
10,021 | 10,391 | 12,071 | 9,254 | 8,852 | |||||||||||
Asset management solutions: |
||||||||||||||||
Sales of equipment |
16,452 | 14,885 | 23,620 | 19,411 | 16,457 | |||||||||||
Service revenue |
11,319 | 12,220 | 14,814 | 9,749 | 11,621 | |||||||||||
Operating lease revenue |
11,322 | 10,974 | 10,218 | 7,569 | 7,152 | |||||||||||
| | | | | | | | | | | | | | | | | |
Total revenue |
57,554 | 67,384 | 84,796 | 63,859 | 65,155 | |||||||||||
| | | | | | | | | | | | | | | | | |
Direct costs of revenue (excluding depreciation and amortization shown separately below): |
||||||||||||||||
Financial process automation solutions |
3,918 | 7,518 | 8,291 | 6,247 | 7,105 | |||||||||||
Procurement solutions |
928 | 1,124 | 1,200 | 788 | 874 | |||||||||||
Asset management solutions: |
||||||||||||||||
Cost of equipment sold |
15,224 | 14,103 | 22,437 | 18,400 | 15,607 | |||||||||||
Direct cost of service and leasing revenue |
7,160 | 4,096 | 4,346 | 3,199 | 3,632 | |||||||||||
| | | | | | | | | | | | | | | | | |
Total direct costs of revenue |
27,230 | 26,841 | 36,274 | 28,634 | 27,218 | |||||||||||
Operating expenses: |
||||||||||||||||
Sales and marketing |
11,497 | 12,491 | 15,100 | 11,149 | 12,106 | |||||||||||
General and administrative |
6,345 | 6,784 | 7,902 | 6,063 | 5,638 | |||||||||||
Depreciation and amortization |
10,341 | 10,191 | 10,622 | 7,750 | 9,434 | |||||||||||
Other income |
— | — | — | — | (463 | ) | ||||||||||
| | | | | | | | | | | | | | | | | |
Total operating expenses |
28,183 | 29,466 | 33,624 | 24,962 | 26,715 | |||||||||||
| | | | | | | | | | | | | | | | | |
Operating income |
2,141 | 11,077 | 14,898 | 10,263 | 11,222 | |||||||||||
Interest expense |
(1,280 | ) | (3,239 | ) | (3,296 | ) | (2,499 | ) | (2,435 | ) | ||||||
Interest income |
68 | 80 | 110 | 86 | 106 | |||||||||||
Foreign exchange gain (loss), net |
43 | (382 | ) | (639 | ) | (384 | ) | (1,035 | ) | |||||||
| | | | | | | | | | | | | | | | | |
Income before income taxes |
972 | 7,536 | 11,073 | 7,466 | 7,858 | |||||||||||
Provision for income taxes |
344 | 2,893 | 4,245 | 2,853 | 3,622 | |||||||||||
| | | | | | | | | | | | | | | | | |
Net income |
$ | 628 | $ | 4,643 | $ | 6,828 | $ | 4,613 | $ | 4,236 | ||||||
| | | | | | | | | | | | | | | | | |
| | | | | | | | | | | | | | | | | |
| | | | | | | | | | | | | | | | | |
58
The following table sets forth our consolidated statements of income as a percentage of total revenue for each of the periods indicated.
| |
Year Ended December 31, | Nine Months Ended September 30, |
||||||||||||||
|---|---|---|---|---|---|---|---|---|---|---|---|---|---|---|---|---|
| |
2012 | 2013 | 2014 | 2014 | 2015 | |||||||||||
Revenue: |
||||||||||||||||
Financial process automation solutions |
14.7 | % | 28.1 | % | 28.4 | % | 28.0 | % | 32.3 | % | ||||||
Procurement solutions |
17.4 | 15.4 | 14.2 | 14.5 | 13.6 | |||||||||||
Asset management solutions: |
||||||||||||||||
Sales of equipment |
28.5 | 22.1 | 27.9 | 30.4 | 25.3 | |||||||||||
Service revenue |
19.7 | 18.1 | 17.4 | 15.2 | 17.8 | |||||||||||
Operating lease revenue |
19.7 | 16.3 | 12.1 | 11.9 | 11.0 | |||||||||||
| | | | | | | | | | | | | | | | | |
Total revenue |
100.0 | 100.0 | 100.0 | 100.0 | 100.0 | |||||||||||
Direct costs of revenue (excluding depreciation and amortization shown separately below): |
||||||||||||||||
Financial process automation solutions |
6.8 | 11.1 | 9.8 | 9.8 | 10.9 | |||||||||||
Procurement solutions |
1.6 | 1.7 | 1.5 | 1.2 | 1.3 | |||||||||||
Asset management solutions: |
||||||||||||||||
Cost of equipment sold |
26.5 | 20.9 | 26.4 | 28.8 | 24.0 | |||||||||||
Direct cost of service and leasing revenue |
12.4 | 6.1 | 5.1 | 5.0 | 5.6 | |||||||||||
| | | | | | | | | | | | | | | | | |
Total direct costs of revenue |
47.3 | 39.8 | 42.8 | 44.8 | 41.8 | |||||||||||
Operating expenses: |
||||||||||||||||
Sales and marketing |
20.0 | 18.6 | 17.8 | 17.5 | 18.6 | |||||||||||
General and administrative |
11.0 | 10.1 | 9.3 | 9.5 | 8.7 | |||||||||||
Depreciation and amortization |
18.0 | 15.1 | 12.5 | 12.1 | 14.5 | |||||||||||
Other income |
— | — | — | — | (0.7 | ) | ||||||||||
| | | | | | | | | | | | | | | | | |
Total operating expenses |
49.0 | 43.8 | 39.6 | 39.1 | 41.1 | |||||||||||
| | | | | | | | | | | | | | | | | |
Operating income |
3.7 | 16.4 | 17.6 | 16.1 | 17.1 | |||||||||||
Interest expense |
(2.2 | ) | (4.8 | ) | (3.9 | ) | (3.9 | ) | (3.7 | ) | ||||||
Interest income |
0.1 | 0.1 | 0.1 | 0.1 | 0.2 | |||||||||||
Foreign exchange gain (loss), net |
0.1 | (0.6 | ) | (0.8 | ) | (0.6 | ) | (1.6 | ) | |||||||
| | | | | | | | | | | | | | | | | |
Income before income taxes |
1.7 | 11.1 | 13.0 | 11.7 | 12.0 | |||||||||||
Provision for income taxes |
0.6 | 4.3 | 5.1 | 4.6 | 5.6 | |||||||||||
| | | | | | | | | | | | | | | | | |
Net income |
1.1 | % | 6.8 | % | 7.9 | % | 7.1 | % | 6.4 | % | ||||||
| | | | | | | | | | | | | | | | | |
| | | | | | | | | | | | | | | | | |
| | | | | | | | | | | | | | | | | |
Comparison of nine months ended September 30, 2014 and 2015
Revenue and direct costs of revenue (excluding depreciation and amortization)
| |
Nine Months Ended September 30, |
Change from Prior Period |
|||||||||||
|---|---|---|---|---|---|---|---|---|---|---|---|---|---|
| |
2014 | 2015 | $ | % | |||||||||
| |
(Dollars in thousands) |
||||||||||||
Total revenue |
$ | 63,859 | $ | 65,155 | $ | 1,296 | 2.0 | % | |||||
Total direct costs of revenue (excluding depreciation and amortization) |
$ | 28,634 | $ | 27,218 | $ | (1,416 | ) | (4.9 | )% | ||||
| | | | | | | | | | | | | | |
Our total revenue increased by $1.3 million, or 2.0%, to $65.2 million in the nine months ended September 30, 2015 from $63.9 million in the nine months ended September 30, 2014. The increase was predominantly driven by significant growth in our financial process automation solutions segment,
59
where revenues increased by $3.2 million, and our lease brokerage business within our asset management solutions segment, where service revenues increased by $1.9 million. These increases were offset by lower revenue in other areas, primarily our asset management solutions revenue, where revenue from sales of used equipment decreased by $3.0 million.
Our overall costs of revenue (excluding depreciation and amortization) decreased by $1.4 million, or 4.9%, to $27.2 million in the nine months ended September 30, 2015 from $28.6 million in the nine months ended September 30, 2014. This was largely driven by lower cost of equipment sold within our asset management solutions segment.
Financial process automation solutions
| |
Nine Months Ended September 30, |
Change from Prior Period |
Percentage of Total Revenue |
||||||||||||||||
|---|---|---|---|---|---|---|---|---|---|---|---|---|---|---|---|---|---|---|---|
| |
2014 | 2015 | $ | % | 2014 | 2015 | |||||||||||||
| |
(Dollars in thousands) |
||||||||||||||||||
Financial process automation solutions revenue |
$ | 17,876 | $ | 21,073 | $ | 3,197 | 17.9 | % | 28.0 | % | 32.3 | % | |||||||
Direct costs of financial process automation solutions revenue (excluding depreciation and amortization |
6,247 | 7,105 | 858 | 13.7 | % | 9.8 | % | 10.9 | % | ||||||||||
The increase in our financial process automation solutions revenue was predominantly driven by a 12.8% increase in the dollar volume of transactions processed during the nine months ended September 30, 2015 as compared to nine months ended September 30, 2014. Transactions between Daimler's parts dealers and their customers accounted for approximately 48.7% and 50.1% of the gross financial process automation dollar volume processed on our CorConnect platform during the nine months ended September 30, 2014 and 2015, respectively.
The increase in our direct costs of financial process automation solutions revenue was largely driven by higher personnel costs, which increased by $0.9 million and higher data management expenses, which increased by $0.1 million. These increases were partially offset by lower bad debt expenses, which decreased by $0.3 million.
Procurement solutions
| |
Nine Months Ended September 30, |
Change from Prior Period |
Percentage of Total Revenue |
||||||||||||||||
|---|---|---|---|---|---|---|---|---|---|---|---|---|---|---|---|---|---|---|---|
| |
2014 | 2015 | $ | % | 2014 | 2015 | |||||||||||||
| |
(Dollars in thousands) |
||||||||||||||||||
Procurement solutions revenue |
$ | 9,254 | $ | 8,852 | $ | (402 | ) | (4.3 | )% | 14.5 | % | 13.6 | % | ||||||
Direct costs of procurement solutions revenue (excluding depreciation and amortization) |
788 | 874 | 86 | 10.9 | % | 1.2 | % | 1.3 | % | ||||||||||
The decrease in our procurement solutions revenue was predominately driven by a reduction in the underlying prices of certain products sold through our purchasing programs, where we earn our revenue based upon a percentage of the gross transaction value. This decline was offset somewhat by increased purchasing volumes.
Our direct cost of procurement solutions revenue (excluding depreciation and amortization) increased modestly as we did not need to significantly expand our procurement infrastructure in order to meet increased volume demands. However, revenue decreased modestly more so as compared to the costs for our procurement programs.
60
Asset management solutions
| |
Nine Months Ended September 30, |
Change from Prior Period |
Percentage of Total Revenue |
||||||||||||||||
|---|---|---|---|---|---|---|---|---|---|---|---|---|---|---|---|---|---|---|---|
| |
2014 | 2015 | $ | % | 2014 | 2015 | |||||||||||||
| |
(Dollars in thousands) |
||||||||||||||||||
Asset management solutions revenue: |
|||||||||||||||||||
Sales of equipment |
$ | 19,411 | $ | 16,457 | $ | (2,954 | ) | (15.2 | )% | 30.4 | % | 25.3 | % | ||||||
Service revenue |
9,749 | 11,621 | 1,872 | 19.2 | 15.2 | 17.8 | |||||||||||||
Operating lease revenue |
7,569 | 7,152 | (417 | ) | (5.5 | ) | 11.9 | 11.0 | |||||||||||
| | | | | | | | | | | | | | | | | | | | |
Total |
$ | 36,729 | $ | 35,230 | $ | (1,499 | ) | (4.1 | )% | 57.5 | % | 54.1 | % | ||||||
Cost of asset management solutions revenue (excluding depreciation and amortization): |
|||||||||||||||||||
Cost of equipment sold |
$ | 18,400 | $ | 15,607 | $ | (2,793 | ) | (15.2 | )% | 28.8 | % | 24.0 | % | ||||||
Direct cost of service and leasing revenue |
3,199 | 3,632 | 433 | 13.5 | 5.0 | 5.6 | |||||||||||||
| | | | | | | | | | | | | | | | | | | | |
Total |
$ | 21,599 | $ | 19,239 | $ | (2,360 | ) | (10.9 | )% | 33.8 | % | 29.6 | % | ||||||
The decrease in asset management solutions revenue was largely driven by decreased equipment sales. The decrease in our equipment sales was primarily due to lower prices for units sold in 2015 compared to 2014 as our average selling prices decreased by 22.4% during the period. Total units sold increased by 37 units during the nine months ended September 30, 2015, a 9.2% increase from the nine months ended September 30, 2014. Costs of equipment sold also decreased proportionately to the decrease in revenue.
Our service revenue increased primarily due to a higher dollar volume of financing transactions within our lease brokerage business during the nine months ended September 30, 2015 as compared to the nine months ended September 30, 2014.
Our leasing revenue declined slightly during the nine months ended September 30, 2015 as compared to the nine months ended September 30, 2014. The decline is primarily attributable to our reduced fleet size. During 2013, we began phasing out certain aged trucks from our fleet to focus our business on newer, more reliable equipment. The phase out continued during 2014, which resulted in a smaller fleet size during the nine months ended September 30, 2015 as compared to the nine months ended September 30, 2014. The focus on newer equipment has allowed us to improve our asset utilization and increase our revenue per unit during the nine months ended September 30, 2015 as compared to the nine months ended September 30, 2014.
Our direct costs of service and leasing revenue (excluding depreciation and amortization) increased modestly during the nine months ended September 30, 2015 as compared to the nine months ended September 30, 2014. The most significant drivers of the increase were higher bad debt expenses and higher refurbishment costs incurred to prepare our assets for lease, which each increased by $0.1 million as compared to the same period in the prior year.
Operating expenses
Sales and marketing
| |
Nine Months Ended September 30, |
Change from Prior Period |
Percentage of Total Revenue |
||||||||||||||||
|---|---|---|---|---|---|---|---|---|---|---|---|---|---|---|---|---|---|---|---|
| |
2014 | 2015 | $ | % | 2014 | 2015 | |||||||||||||
| |
(Dollars in thousands) |
||||||||||||||||||
Sales and marketing |
$ | 11,149 | $ | 12,106 | $ | 957 | 8.6 | % | 17.5 | % | 18.6 | % | |||||||
Sales and marketing expense increased by $1.0 million, or 8.6%, to $12.1 million in the nine months ended September 30, 2015. This increase was largely due to additional costs related to
61
increased efforts to develop our brand awareness, particularly for our financial process automation and procurement solutions. Additional increases were driven in part by increased headcount and increased attendance at our annual customer conference resulting in additional event costs.
General and administrative
| |
Nine Months Ended September 30, |
Change from Prior Period |
Percentage of Total Revenue |
||||||||||||||||
|---|---|---|---|---|---|---|---|---|---|---|---|---|---|---|---|---|---|---|---|
| |
2014 | 2015 | $ | % | 2014 | 2015 | |||||||||||||
| |
(Dollars in thousands) |
||||||||||||||||||
General and administrative |
$ | 6,063 | $ | 5,638 | $ | (425 | ) | (7.0 | )% | 9.5 | % | 8.7 | % | ||||||
General and administrative expense decreased by $0.4 million, or 7.0%, to $5.6 million in the nine months ended September 30, 2015. The decrease was largely driven by lower personnel expenses, which decreased $0.3 million.
Depreciation and amortization
| |
Nine Months Ended September 30, |
Change from Prior Period |
Percentage of Total Revenue |
||||||||||||||||
|---|---|---|---|---|---|---|---|---|---|---|---|---|---|---|---|---|---|---|---|
| |
2014 | 2015 | $ | % | 2014 | 2015 | |||||||||||||
| |
(Dollars in thousands) |
||||||||||||||||||
Depreciation and amortization |
$ | 7,750 | $ | 9,434 | $ | 1,684 | 21.7 | % | 12.1 | % | 14.5 | % | |||||||
Depreciation and amortization increased by $1.7 million, or 21.7%, to $9.4 million in the nine months ended September 30, 2015. This increase was due to amortization of our internally developed software within our financial process automation solutions segment, which was driven by increased investment in software development personnel.
Other income
| |
Nine Months Ended September 30, |
Change from Prior Period |
Percentage of Total Revenue |
||||||||||||||||
|---|---|---|---|---|---|---|---|---|---|---|---|---|---|---|---|---|---|---|---|
| |
2014 | 2015 | $ | % | 2014 | 2015 | |||||||||||||
| |
(Dollars in thousands) |
||||||||||||||||||
Other income |
$ | — | $ | (463 | ) | $ | (463 | ) | — | % | — | (0.7 | )% | ||||||
Other income increased primarily due to gains on sales of revenue earning equipment during the nine months ended September 30, 2015.
Non-operating income and expenses
| |
Nine Months Ended September 30, |
Change from Prior Period |
Percentage of Total Revenue |
||||||||||||||||
|---|---|---|---|---|---|---|---|---|---|---|---|---|---|---|---|---|---|---|---|
| |
2014 | 2015 | $ | % | 2014 | 2015 | |||||||||||||
| |
(Dollars in thousands) |
||||||||||||||||||
Interest expense |
$ | (2,499 | ) | $ | (2,435 | ) | $ | 64 | (2.6 | )% | (3.9 | )% | (3.7 | )% | |||||
Interest income |
86 | 106 | 20 | 23.3 | 0.1 | 0.2 | |||||||||||||
Foreign exchange loss |
(384 | ) | (1,035 | ) | (651 | ) | (169.5 | ) | (0.6 | ) | (1.6 | ) | |||||||
Provision for income taxes |
2,853 | 3,622 | 769 | 27.0 | % | 4.6 | % | 5.6 | % | ||||||||||
Interest expense decreased slightly during the period and was primarily driven by lower interest rates on our revolving line of credit. The lower interest rates were partially offset by higher average balances on our line of credit to support the working capital needs resulting from an increase in our accounts receivable balance.
62
The foreign exchange loss increased during the nine months ended September 30, 2015 as compared to the same period during 2014 due to the U.S. dollar strengthening relative to the Canadian dollar.
Income tax expense increased by $0.8 million, or 27.0%, to $3.6 million in the nine months ended September 30, 2015. This change was due primarily to an increase in our income before income taxes for the nine months ended September 30, 2015 compared to the prior period as well as an increase in our effective tax rate during the same period. The increase in the effective tax rate was driven by higher state taxes as a result of changes in state tax apportionments and $0.4 of additional tax expense related to the correction of prior period state income tax apportionments in connection with the filing of our 2014 income tax returns.
Comparison of years ended December 31, 2013 and 2014
Revenue and direct costs of revenue (excluding depreciation and amortization)
| |
Year Ended December 31, |
Change from Prior Period |
|||||||||||
|---|---|---|---|---|---|---|---|---|---|---|---|---|---|
| |
2013 | 2014 | $ | % | |||||||||
| |
(Dollars in thousands) |
||||||||||||
Total revenue |
$ | 67,384 | $ | 84,796 | $ | 17,412 | 25.8 | % | |||||
Total direct costs of revenue (excluding depreciation and amortization) |
26,841 | 36,274 | 9,433 | 35.1 | % | ||||||||
Our total revenue increased by $17.4 million, or 25.8%, to $84.8 million in the year ended December 31, 2014 from $67.4 million in the year ended December 31, 2013. This increase was driven by all of our reporting segments, with financial process automation solutions and procurement solutions revenue increasing by 27.3% and 16.2%, respectively, on higher transaction processing volumes and asset management solutions revenue increasing 27.8% due to strong equipment sales.
Our overall direct costs of revenue (excluding depreciation and amortization) also increased by $9.4 million, or 35.1%, to $36.3 million in the year ended December 31, 2014 from $26.8 million in the year ended December 31, 2013. This was largely driven by increased costs related to equipment sales, which accounted for $8.3 million of the total increase. The remaining increase was driven by higher payroll costs as we increased headcount in our financial process automation solutions segment in order to support increased transaction processing volumes. Notwithstanding, our revenue growth generally outpaced the growth in our direct costs of revenue (excluding depreciation and amortization) period over period.
Financial process automation solutions
| |
Year Ended December 31, |
Change from Prior Period |
Percentage of Total Revenue |
||||||||||||||||
|---|---|---|---|---|---|---|---|---|---|---|---|---|---|---|---|---|---|---|---|
| |
2013 | 2014 | $ | % | 2013 | 2014 | |||||||||||||
| |
(Dollars in thousands) |
||||||||||||||||||
Financial process automation solutions revenue |
$ | 18,914 | $ | 24,073 | $ | 5,159 | 27.3 | % | 28.1 | % | 28.4 | % | |||||||
Direct costs of financial process automation solutions revenue (excluding depreciation and amortization) |
7,518 | 8,291 | 773 | 10.3 | % | 11.1 | % | 9.8 | % | ||||||||||
The overall increase in our total revenue was driven in part by growth in our financial process automation solutions revenue, which grew to 28.4% of total revenue as compared to the prior year. The majority of that increase relates to the addition of the Daimler parts dealer network beginning in February 2013 that was fully reflected in the year ended December 31, 2014. Transactions between Daimler's parts dealers and their customers accounted for $8.5 million and $11.5 million of the financial process automation revenue, or 45.0% and 47.7%, during the years ended December 31, 2013
63
and 2014, respectively. Our growth in revenue was almost entirely driven by additional transaction volume from existing customers. We processed 6.2 million financial process automation transactions in 2014, up 24.0% from volume in 2013. Our overall pricing and fee collected per invoice or per dollar processed was largely unchanged.
Our overall growth in financial process automation solutions revenue drove increased direct costs (excluding depreciation and amortization). Payroll and flexible staffing costs (net of amounts capitalized) increased by $0.7 million as we increased our headcount by five employees in order to support the growth in our transaction volume. Data capturing costs, insurance and web hosting expenses increased by $0.3 million, $0.1 million and $0.1 million, respectively. We expect that our costs will continue to increase if our transaction processing volume and the related revenue continues to increase. However, we believe that our revenue will increase at a greater rate than our direct costs (excluding depreciation and amortization). These cost increases were partially offset by a $0.7 million reduction in bad debt expense, which resulted from improved credit management procedures that shortened our collection cycle, improved our accounts receivable aging and reduced our collection risk.
Procurement solutions
| |
Year Ended December 31, |
Change from Prior Period |
Percentage of Total Revenue |
||||||||||||||||
|---|---|---|---|---|---|---|---|---|---|---|---|---|---|---|---|---|---|---|---|
| |
2013 | 2014 | $ | % | 2013 | 2014 | |||||||||||||
| |
(Dollars in thousands) |
||||||||||||||||||
Procurement solutions revenue |
$ | 10,391 | $ | 12,071 | $ | 1,680 | 16.2 | % | 15.4 | % | 14.2 | % | |||||||
Direct cost of procurement solutions revenue (excluding depreciation and amortization) |
1,124 | 1,200 | 76 | 6.8 | % | 1.7 | % | 1.5 | % | ||||||||||
The increase in our procurement solutions revenue was predominately driven by a higher dollar volumes of purchasing by our existing customer base. However to a much lesser degree we also experienced an expansion of our customer base and favorable product mix and pricing levels, which also contributed to the increase. Increased purchases through our procurement programs allowed us to capture higher rebates and transaction fees.
Our direct cost of procurement solutions revenue (excluding depreciation and amortization) increased only modestly as we did not need to significantly expand our procurement infrastructure in order to meet increased volume demands. This is because our proprietary software platforms within our financial process automation solutions allow us to process large increases in the volume of transactions with minimal incremental cost. The increase in costs was primarily driven by increased payroll and related costs of $0.1 million.
Asset management solutions
| |
Year Ended December 31, |
Change from Prior Period |
Percentage of Total Revenue |
||||||||||||||||
|---|---|---|---|---|---|---|---|---|---|---|---|---|---|---|---|---|---|---|---|
| |
2013 | 2014 | $ | % | 2013 | 2014 | |||||||||||||
| |
(Dollars in thousands) |
||||||||||||||||||
Asset management solutions revenue: |
|||||||||||||||||||
Sales of equipment |
$ | 14,885 | $ | 23,620 | $ | 8,735 | 58.7 | % | 22.1 | % | 27.9 | % | |||||||
Service revenue |
12,220 | 14,814 | 2,594 | 21.2 | 18.1 | 17.4 | |||||||||||||
Operating lease revenue |
10,974 | 10,218 | (756 | ) | (6.9 | ) | 16.3 | 12.1 | |||||||||||
| | | | | | | | | | | | | | | | | | | | |
Total |
$ | 38,079 | $ | 48,652 | $ | 10,573 | 27.8 | % | 56.5 | % | 57.4 | % | |||||||
Direct costs of asset management solutions revenue (excluding depreciation and amortization): |
|||||||||||||||||||
Cost of equipment sold |
$ | 14,103 | $ | 22,437 | $ | 8,334 | 59.1 | % | 20.9 | % | 26.4 | % | |||||||
Direct costs of service and leasing revenue |
4,096 | 4,346 | 250 | 6.1 | 6.1 | 5.1 | |||||||||||||
| | | | | | | | | | | | | | | | | | | | |
Total |
$ | 18,199 | $ | 26,783 | $ | 8,584 | 47.2 | % | 27.0 | % | 31.5 | % | |||||||
64
Asset management solutions revenue increased by $10.6 million, or 27.8% during the year ended December 31, 2014 as compared to the prior period. The increase in asset management solutions revenue was largely driven by increased equipment sales. The increase in our equipment sales was due to both increased pricing and to a lesser extent, increased volumes. The increased pricing is primarily attributable to the age of the equipment sold, which was substantially newer than the equipment sold in 2013. Our average sales price increased 38.8% during 2014 over 2013. We also benefited from increased product volumes as we sold 60 more units in 2014, a 14.2% increase from 2013.
The increase in our service revenue was primarily attributable to our lease brokerage business, which increased by $2.4 million driven primarily by a greater dollar volume of financing transactions.
Our leasing revenue declined slightly during the period. The decline is primarily attributable to a reduced fleet size. During 2013, we began phasing out certain aged trucks from our fleet and to focus our business on newer more reliable equipment. The phase out continued during 2014, which resulted in a continued reduction in fleet size. The focus on newer equipment has allowed us to significantly improve our asset utilization, which has resulted in a 26% increase in revenue per unit during 2014 as compared to 2013.
Our direct costs of service and leasing revenue (excluding depreciation and amortization) increased modestly from 2013. The most significant driver of the increase was bad debt expense, which increased by $0.3 million. Our remaining direct costs were largely flat. Our revenue growth outpaced our cost growth in this area.
Operating expenses
Sales and marketing
| |
Year Ended December 31, |
Change from Prior Period |
Percentage of Total Revenue |
||||||||||||||||
|---|---|---|---|---|---|---|---|---|---|---|---|---|---|---|---|---|---|---|---|
| |
2013 | 2014 | $ | % | 2013 | 2014 | |||||||||||||
| |
(Dollars in thousands) |
||||||||||||||||||
Sales and marketing |
$ | 12,491 | $ | 15,100 | $ | 2,609 | 20.9 | % | 18.6 | % | 17.8 | % | |||||||
Sales and marketing expense increased by $2.6 million, or 20.9%, to $15.1 million in the year ended December 31, 2014. The increase in our sales and marketing expense was primarily driven by greater personnel costs. Payroll and flexible staffing costs increased by $1.4 million as we increased our headcount by seven employees to support our sales and marketing efforts. Bonuses and commissions also increased by $0.3 million as a result of the strong operating results of the business. We also made significant investments in developing brand awareness during 2014, including increasing spending on advertising and trade events by approximately $0.7 million.
General and administrative
| |
Year Ended December 31, |
Change from Prior Period |
Percentage of Total Revenue |
||||||||||||||||
|---|---|---|---|---|---|---|---|---|---|---|---|---|---|---|---|---|---|---|---|
| |
2013 | 2014 | $ | % | 2013 | 2014 | |||||||||||||
| |
(Dollars in thousands) |
||||||||||||||||||
General and administrative |
$ | 6,784 | $ | 7,902 | $ | 1,118 | 16.5 | % | 10.1 | % | 9.3 | % | |||||||
General and administrative expense increased by $1.1 million, or 16.5%, to $7.9 million in the year ended December 31, 2014. The increase was largely driven by increased administrative costs, including compensation costs, for additional personnel and support services, including audit, insurance and professional fees, as we prepare to become a public company.
65
Depreciation and amortization
| |
Year Ended December 31, |
Change from Prior Period |
Percentage of Total Revenue |
||||||||||||||||
|---|---|---|---|---|---|---|---|---|---|---|---|---|---|---|---|---|---|---|---|
| |
2013 | 2014 | $ | % | 2013 | 2014 | |||||||||||||
| |
(Dollars in thousands) |
||||||||||||||||||
Depreciation and amortization |
$ | 10,191 | $ | 10,622 | $ | 431 | 4.2 | % | 15.1 | % | 12.5 | % | |||||||
Depreciation and amortization increased by $0.4 million, or 4.2%, to $10.6 million in the year ended December 31, 2014. This increase was driven by increased amortization of previously capitalized salaries related to the development of our financial process automation software.
Non-operating income and expenses
| |
Year Ended December 31, |
Change from Prior Period |
Percentage of Total Revenue |
||||||||||||||||
|---|---|---|---|---|---|---|---|---|---|---|---|---|---|---|---|---|---|---|---|
| |
2013 | 2014 | $ | % | 2013 | 2014 | |||||||||||||
| |
(Dollars in thousands) |
||||||||||||||||||
Interest expense |
$ | (3,239 | ) | $ | (3,296 | ) | $ | (57 | ) | 1.8 | % | (4.8 | )% | (3.9 | )% | ||||
Interest income |
80 | 110 | 30 | 37.5 | 0.1 | 0.1 | |||||||||||||
Foreign exchange loss |
(382 | ) | (639 | ) | (257 | ) | 67.3 | (0.6 | ) | (0.8 | ) | ||||||||
Provision for income taxes |
2,893 | 4,245 | 1,352 | 46.7 | % | 4.3 | % | 5.1 | % | ||||||||||
Interest expense and interest income were largely unchanged during the year ended December 31, 2014 as compared to the prior period.
Foreign exchange loss increased significantly in absolute dollars during the year ended December 31, 2014. This was largely driven by the effect of remeasurement of the assets and liabilities of foreign currency denominated transactions into United States dollars. The United States dollar strengthened relative to the Canadian dollar throughout the year ended December 31, 2014 resulting in the additional currency translation losses.
Income tax expense increased by $1.4 million from the prior year to $4.2 million during the year ended December 31, 2014. This change was due primarily to a significant increase in our 2014 income before income taxes as our effective tax rate was relatively unchanged at 38.3% during the year ended December 31, 2014 from 38.4% during the prior year. Our tax rate differed due to the effects of state income taxes and certain permanent items.
Comparison of years ended December 31, 2012 and 2013
Revenue and direct costs of revenue (excluding depreciation and amortization)
| |
Year Ended December 31, |
Change from Prior Period |
|||||||||||
|---|---|---|---|---|---|---|---|---|---|---|---|---|---|
| |
2012 | 2013 | $ | % | |||||||||
| |
(Dollars in thousands) |
||||||||||||
Total revenue |
$ | 57,554 | $ | 67,384 | $ | 9,830 | 17.1 | % | |||||
Total direct costs of revenue (excluding depreciation and amortization) |
27,230 | 26,841 | (389 | ) | (1.4 | )% | |||||||
Our total revenue increased by $9.8 million, or 17.1%, to $67.4 million in the year ended December 31, 2013 from $57.6 million in the year ended December 31, 2012. The increase was largely driven by the addition of a large network of new customers to our financial process automation solutions. In February 2013, we added a network of suppliers, all of whom are parts dealers for Daimler. The customer activity related to those dealers accounted for $8.5 million of the increase in our financial process automation solutions revenue in 2013.
66
Our overall direct costs of revenue (excluding depreciation and amortization) decreased by $0.4 million, or 1.4%, to $26.8 million in the year ended December 31, 2013 from $27.2 million in the year ended December 31, 2012. This was largely driven by a $3.1 million decrease in our leasing and service costs, which was driven by reduced fleet size in our leasing business.
Financial process automation solutions
| |
Year Ended December 31, |
Change from Prior Period |
Percentage of Total Revenue |
||||||||||||||||
|---|---|---|---|---|---|---|---|---|---|---|---|---|---|---|---|---|---|---|---|
| |
2012 | 2013 | $ | % | 2012 | 2013 | |||||||||||||
| |
(Dollars in thousands) |
||||||||||||||||||
Financial process automation solutions revenue |
$ | 8,440 | $ | 18,914 | $ | 10,474 | 124.1 | % | 14.7 | % | 28.1 | % | |||||||
Direct costs of financial process automation solutions revenue (excluding depreciation and amortization) |
3,918 | 7,518 | 3,600 | 91.9 | % | 6.8 | % | 11.1 | % | ||||||||||
The overall increase in our total revenue was nearly entirely driven by growth in our financial process automation solutions revenue, which grew 124.1% as compared to the prior year. We attribute the increase to the addition of the Daimler parts dealer network beginning in February 2013. The customer activity related to those dealers prompted $8.5 million of the increase in our financial process automation revenue in 2013. Our overall pricing and fee collected per invoice or per dollar processed decreased resulting in a decline in revenue per transaction of 18.5%.
Our overall growth in financial process automation solutions revenue, however, drove increased direct costs (excluding depreciation and amortization), as we incurred additional interest costs relating to the increased financial process transaction volume processed through our system and also additional hosting and technology costs to process the increased volume. A substantial portion of this increase related to a $1.0 million increase in bad debt expense that we recorded during the year ended December 31, 2013. This increase was largely prompted by our increase in allowance for doubtful accounts as we generally carried a much larger accounts receivable balance throughout the year, due in large part to the substantial growth in our financial process automation solutions. As our financial process automation transaction volume increased, we took on more credit risk and carried more receivables due from our customers. We also incurred increased data costs of $0.5 million and other increased costs related to bank charges, postage, courier and supplies expense to support the increased volume. Notwithstanding, our financial process automation solutions revenue growth greatly outpaced the growth in our direct costs of those revenues (excluding depreciation and amortization) period over period.
Procurement solutions
| |
Year Ended December 31, |
Change from Prior Period |
Percentage of Total Revenue |
||||||||||||||||
|---|---|---|---|---|---|---|---|---|---|---|---|---|---|---|---|---|---|---|---|
| |
2012 | 2013 | $ | % | 2012 | 2013 | |||||||||||||
| |
(Dollars in thousands) |
||||||||||||||||||
Procurement solutions revenue |
$ | 10,021 | $ | 10,391 | $ | 370 | 3.7 | % | 17.4 | % | 15.4 | % | |||||||
Direct costs of procurement solutions revenue (excluding depreciation and amortization) |
928 | 1,124 | 196 | 21.1 | % | 1.6 | % | 1.7 | % | ||||||||||
The increase in our procurement solutions revenue was primarily driven by an increased dollar value of transaction volumes from our existing customer base. However, to a lesser degree, we also experienced an expansion of our customer base, which helped contribute to the increase. The strengthening economy led to higher purchases through our procurement programs, which allowed us to capture higher rebates and transaction fees. Offsetting our gains, was unfavorable product mix as customer spending on programs with lower rebate levels increased.
67
Our direct costs of procurement solutions revenue (excluding depreciation and amortization) increased primarily driven by increased personnel costs, of $0.1 million. Our remaining costs remained flat as we did not need to significantly expand our procurement infrastructure in order to meet increased volume demands. This is because our proprietary software platforms within our financial process automation solutions allow us to process large increases in the volume of transactions with minimal incremental cost.
Asset management solutions
| |
Year Ended December 31, |
Change from Prior Period |
Percentage of Total Revenue |
||||||||||||||||
|---|---|---|---|---|---|---|---|---|---|---|---|---|---|---|---|---|---|---|---|
| |
2012 | 2013 | $ | % | 2012 | 2013 | |||||||||||||
| |
(Dollars in thousands) |
||||||||||||||||||
Asset management solutions revenue: |
|||||||||||||||||||
Sales of equipment |
$ | 16,452 | $ | 14,885 | $ | (1,567 | ) | (9.5 | )% | 28.5 | % | 22.1 | % | ||||||
Service revenue |
11,319 | 12,220 | 901 | 8.0 | 19.7 | 18.1 | |||||||||||||
Operating lease revenue |
11,322 | 10,974 | (348 | ) | (3.1 | ) | 19.7 | 16.3 | |||||||||||
| | | | | | | | | | | | | | | | | | | | |
Total |
$ | 39,093 | $ | 38,079 | $ | (1,014 | ) | (2.6 | )% | 67.9 | % | 56.5 | % | ||||||
Direct costs of asset management solutions revenue (excluding depreciation and amortization): |
|||||||||||||||||||
Cost of equipment sold |
$ | 15,224 | $ | 14,103 | $ | (1,121 | ) | (7.4 | )% | 26.5 | % | 20.9 | % | ||||||
Direct costs of service and leasing revenue |
7,160 | 4,096 | (3,064 | ) | (42.8 | ) | 12.4 | 6.1 | |||||||||||
| | | | | | | | | | | | | | | | | | | | |
Total |
$ | 22,384 | $ | 18,199 | $ | (4,185 | ) | (18.7 | )% | 38.9 | % | 27.0 | % | ||||||
Asset management solutions revenue decreased by $1.0 million, or 2.6% during the year ended December 31, 2013 as compared to the prior period. The decrease in asset management solutions revenue was largely driven by lower equipment sales. The decrease in equipment sales was primarily attributable to lower unit volumes, offset by higher pricing. We made the strategic decision during 2013 to focus on lower mileage, higher quality equipment. This decision contributed to our increased pricing of 13.2% per unit sold, but also negatively impacted our total units sold by 20.1%.
The increase in our service revenue was primarily attributable to our lease brokerage business, which increased by $0.7 million driven primarily by a greater dollar volume of financing transactions.
Our leasing revenue declined slightly during the period. The decline is primarily attributable to a reduced fleet size. We made the strategic decision during 2013 to begin phasing out certain aged trucks from our fleet and to focus our business on newer more reliable equipment. The focus on newer equipment allowed us to significantly improve our asset utilization, which has resulted in a 23.0% improvement in revenue per unit in 2013 as compared to 2012.
Despite greater equipment pricing, our direct cost of sales of equipment (excluding depreciation and amortization) increased at a greater rate from 2012, as we accepted some less profitable deals in order to secure increases in product volume.
Our direct costs of service and leasing revenue decreased significantly from 2012. This is primarily driven by lower maintenance expenses, which decreased $3.1 million as we phased out our older equipment. Our remaining costs were primarily flat across the periods. Our cost savings generally outpaced the reductions in our revenue in this area.
68
Costs and operating expenses
Sales and marketing
| |
Year Ended December 31, |
Change from Prior Period |
Percentage of Total Revenue |
||||||||||||||||
|---|---|---|---|---|---|---|---|---|---|---|---|---|---|---|---|---|---|---|---|
| |
2012 | 2013 | $ | % | 2012 | 2013 | |||||||||||||
| |
(Dollars in thousands) |
||||||||||||||||||
Sales and marketing |
$ | 11,497 | $ | 12,491 | $ | 994 | 8.6 | % | 20.0 | % | 18.6 | % | |||||||
Sales and marketing expense increased by $1.0 million, or 8.6%, from the prior period to $12.5 million during the year ended December 31, 2013. This increase was largely due to an increase in headcount of our sales and marketing team of approximately nine full time personnel to a total of 67 sales and marketing employees on December 31, 2013, which increased payroll related expenses by $0.6 million. We also incurred additional costs related to incentive compensation, which increased by $0.3 million. To a lesser degree, we also incurred additional costs related to increased efforts to develop our brand awareness, particularly for our financial process automation and procurement solutions. Finally, we saw increased attendance at our annual customer conference, resulting in additional costs of that event.
General and administrative
| |
Year Ended December 31, |
Change from Prior Period |
Percentage of Total Revenue |
||||||||||||||||
|---|---|---|---|---|---|---|---|---|---|---|---|---|---|---|---|---|---|---|---|
| |
2012 | 2013 | $ | % | 2012 | 2013 | |||||||||||||
| |
(Dollars in thousands) |
||||||||||||||||||
General and administrative |
$ | 6,345 | $ | 6,784 | $ | 439 | 6.9 | % | 11.0 | % | 10.1 | % | |||||||
General and administrative expense increased by $0.4 million, or 6.9%, from the prior period to $6.8 million during the year ended December 31, 2013. Our administrative operations between these two periods were largely unchanged year over year.
Depreciation and amortization
| |
Year Ended December 31, |
Change from Prior Period |
Percentage of Total Revenue |
||||||||||||||||
|---|---|---|---|---|---|---|---|---|---|---|---|---|---|---|---|---|---|---|---|
| |
2012 | 2013 | $ | % | 2012 | 2013 | |||||||||||||
| |
(Dollars in thousands) |
||||||||||||||||||
Depreciation and amortization |
$ | 10,341 | $ | 10,191 | $ | (150 | ) | (1.5 | )% | 18.0 | % | 15.1 | % | ||||||
Depreciation and amortization decreased by $0.2 million, or 1.5%, from the prior period to $10.2 million during the year ended December 31, 2013. This decrease was primarily driven by the reduction of our fleet size, partially offset by increased depreciation on internally developed software.
Non-operating income and expenses
| |
Year Ended December 31, |
Change from Prior Period |
Percentage of Total Revenue |
||||||||||||||||
|---|---|---|---|---|---|---|---|---|---|---|---|---|---|---|---|---|---|---|---|
| |
2012 | 2013 | $ | % | 2012 | 2013 | |||||||||||||
| |
(Dollars in thousands) |
||||||||||||||||||
Interest expense |
$ | (1,280 | ) | $ | (3,239 | ) | $ | (1,959 | ) | 153.0 | % | (2.2 | )% | (4.8 | )% | ||||
Interest income |
68 | 80 | 12 | 17.6 | 0.1 | 0.1 | |||||||||||||
Foreign exchange gain (loss), net |
43 | (382 | ) | (425 | ) | NM | 0.1 | (0.6 | ) | ||||||||||
Provision for income taxes |
344 | 2,893 | 2,549 | NM | 0.6 | % | 4.3 | % | |||||||||||
69
Interest expense increased $2.0 million from the prior period to $3.2 million during the year ended December 31, 2013. This increase was largely driven by our increased average accounts receivable lifecycle generally extending longer than our average accounts payable lifecycle. This shift was the result of our increased payments to suppliers, vendors and dealers on behalf of our customers in advance of collecting from our customers that was largely driven by the growth in our financial process automation solutions. To support the cash needs of this growth, we drew more on our asset-based lending facility during the year ended December 31, 2013 than in the prior period.
Foreign exchange gain changed to a loss during the year ended December 31, 2013. This loss was largely driven by the effect of remeasurement of the assets and liabilities of our foreign currency denominated transactions into United States dollars at month-end exchange rates and income and expense amounts at average exchange rates during the year. The United States dollar strengthened relative to the Canadian dollar for the year ended December 31, 2013 resulting in additional loss.
Income tax expense increased by $2.5 million from the prior period to $2.9 million during the year ended December 31, 2013. This change was due primarily to a significant increase in our 2013 income before income taxes and to a lesser extent, an increase in our effective tax rate to 38.4% during the year ended December 31, 2013 from 35.4% during the year ended December 31, 2012. Our tax rate differed due to the effects of state income taxes and certain permanent items.
Quarterly results of operations
The following table sets forth selected unaudited quarterly consolidated statement of operations data for each of the quarters indicated. The unaudited consolidated financial statements for each of these quarters have been derived from and prepared on the same basis as the audited consolidated financial statements included in this prospectus and, in the opinion of management, include all adjustments necessary for the fair presentation of the consolidated results of operations for these periods. You should read this information together with our audited consolidated financial statements, interim unaudited consolidated financial statements and related notes included elsewhere in this
70
prospectus. These quarterly operating results are not necessarily indicative of the results for any future period.
| |
Three Months Ended | |||||||||||||||||||||
|---|---|---|---|---|---|---|---|---|---|---|---|---|---|---|---|---|---|---|---|---|---|---|
| |
Mar. 31, 2014 |
Jun. 30, 2014 |
Sep. 30, 2014 |
Dec. 31, 2014 |
Mar. 31, 2015 |
Jun. 30, 2015 |
Sept. 30, 2015 |
|||||||||||||||
| |
(In thousands) |
|||||||||||||||||||||
Revenue: |
||||||||||||||||||||||
Financial process automation solutions |
$ | 5,594 | $ | 6,054 | $ | 6,228 | $ | 6,197 | $ | 6,345 | $ | 7,062 | $ | 7,666 | ||||||||
Procurement solutions |
2,856 | 2,941 | 3,457 | 2,817 | 2,583 | 2,974 | 3,295 | |||||||||||||||
Asset management solutions: |
||||||||||||||||||||||
Sale of equipment |
3,527 | 3,686 | 12,198 | 4,209 | 8,225 | 3,491 | 4,741 | |||||||||||||||
Service revenue |
2,496 | 3,398 | 3,855 | 5,065 | 2,782 | 4,100 | 4,739 | |||||||||||||||
Operating lease revenue |
2,579 | 2,495 | 2,495 | 2,649 | 2,480 | 2,265 | 2,407 | |||||||||||||||
| | | | | | | | | | | | | | | | | | | | | | | |
Total revenue |
17,052 | 18,574 | 28,233 | 20,937 | 22,415 | 19,892 | 22,848 | |||||||||||||||
Direct costs of revenue (excluding depreciation and amortization shown separately below): |
||||||||||||||||||||||
Financial process automation solutions |
2,222 | 2,235 | 1,790 | 2,044 | 2,056 | 2,545 | 2,504 | |||||||||||||||
Procurement solutions |
248 | 249 | 291 | 412 | 294 | 282 | 298 | |||||||||||||||
Asset management solutions: |
||||||||||||||||||||||
Cost of equipment sold |
3,363 | 3,454 | 11,583 | 4,037 | 7,950 | 3,256 | 4,401 | |||||||||||||||
Direct cost of operating lease and service revenues |
1,068 | 960 | 1,171 | 1,147 | 1,209 | 1,391 | 1,032 | |||||||||||||||
| | | | | | | | | | | | | | | | | | | | | | | |
Total direct costs of revenue |
6,901 | 6,898 | 14,835 | 7,640 | 11,509 | 7,474 | 8,235 | |||||||||||||||
| | | | | | | | | | | | | | | | | | | | | | | |
Operating expenses: |
||||||||||||||||||||||
Sales and marketing |
3,857 | 3,440 | 3,852 | 3,951 | 4,281 | 3,795 | 4,030 | |||||||||||||||
General and administrative |
1,702 | 2,075 | 2,286 | 1,839 | 1,886 | 1,769 | 1,983 | |||||||||||||||
Depreciation and amortization |
2,476 | 2,527 | 2,747 | 2,872 | 3,081 | 3,134 | 3,219 | |||||||||||||||
Other income |
— | — | — | — | (88 | ) | (242 | ) | (133 | ) | ||||||||||||
| | | | | | | | | | | | | | | | | | | | | | | |
Total operating expenses |
8,035 | 8,042 | 8,885 | 8,662 | 9,160 | 8,456 | 9,099 | |||||||||||||||
| | | | | | | | | | | | | | | | | | | | | | | |
Operating income |
2,116 | 3,634 | 4,513 | 4,635 | 1,746 | 3,962 | 5,514 | |||||||||||||||
Interest expense |
(831 | ) | (832 | ) | (836 | ) | (797 | ) | (751 | ) | (798 | ) | (886 | ) | ||||||||
Interest income |
18 | 47 | 21 | 24 | 49 | 28 | 29 | |||||||||||||||
Foreign exchange gain (loss), net |
(268 | ) | 177 | (293 | ) | (257 | ) | (652 | ) | 134 | (517 | ) | ||||||||||
| | | | | | | | | | | | | | | | | | | | | | | |
Income before income taxes |
1,035 | 3,026 | 3,405 | 3,605 | 392 | 3,326 | 4,140 | |||||||||||||||
Provision for income taxes |
396 | 1,152 | 1,305 | 1,392 | 153 | 1,286 | 2,183 | |||||||||||||||
| | | | | | | | | | | | | | | | | | | | | | | |
Net income |
$ | 639 | $ | 1,874 | $ | 2,100 | $ | 2,213 | $ | 239 | $ | 2,040 | $ | 1,957 | ||||||||
| | | | | | | | | | | | | | | | | | | | | | | |
| | | | | | | | | | | | | | | | | | | | | | | |
| | | | | | | | | | | | | | | | | | | | | | | |
Quarterly trends and seasonality
We have not historically experienced substantial seasonality in our business. However, our asset management solutions revenue has varied somewhat based on the underlying value of the equipment that we lease or sell. Our direct costs related to revenue (excluding depreciation and amortization) on those transactions remain generally consistent notwithstanding increases or decreases in the total transaction value. For example, our equipment remarketing revenues and associated costs of sales increased dramatically during the third quarter of 2014 due to an unusually large number of units sold to a single customer, yet there was only a moderate increase in income. During the subsequent quarter, equipment remarketing revenues and associated costs returned to levels more consistent with prior quarters.
Our financial process automation revenues have generally increased quarter over quarter primarily due to incremental transactions processed by our existing customer network supplemented by significant revenue growth from new customers. Our related direct costs have also increased but at a slower rate than revenues primarily due to our ability to leverage our existing infrastructure to scale with less incremental costs as customer and transaction volumes grow.
71
Our sales and marketing expenses have also increased in recent periods as we have increased our efforts to reach new industry verticals and expand our overall market presence.
Liquidity and capital resources
Sources of liquidity
We have financed our operations through private sales of common equity, internally generated positive cash flow and borrowings under our asset-based lines of credit and certain long-term notes payable.
Asset-based lines of credit
Senior credit facility. We have a revolving loan facility with Bank of America, which we refer to herein as our senior credit facility under which we are permitted to borrow up to 85% of eligible receivables up to a maximum commitment amount of $100.0 million. We primarily use this line of credit to support the working capital needs of our CorConnect financial process automation solution and our procurement solutions. Often, both of those solutions cause us to pay invoices on behalf of our customers faster than we collect those amounts from customers. As a result, during periods of increasing transaction volume, our cash used in the operations from those solutions exceeds our cash flows from those operations.
The senior credit facility expires in December 2020. Interest on borrowings under the senior credit facility accrues at either the London Interbank Offered Rate, or LIBOR, plus a margin, which ranges from 1.25% to 1.75%, or the highest of (i) the prime rate plus 0.25% to 0.75%, (ii) the federal funds rate plus 0.50%, or (iii) LIBOR for a 30-day interest period plus 1.00%. Interest on the revolving loans is payable on the first day of each month in arrears. A commitment fee which ranges from 0.25% to 0.38% on the average unused portion of the loan commitment is payable quarterly in arrears. The revolving line of credit also includes a letter of credit facility. As of September 30, 2015 the amount of available borrowings based on our eligible receivables was $99.2 million of which $46.2 million was outstanding.
The senior credit facility contains customary conditions to borrowing, events of default and covenants, including covenants that restrict our ability to dispose of assets, merge with or acquire other entities, incur indebtedness, grant liens, make distributions to holders of our equity interests or make investments. The senior credit facility also prohibits us from taking accounts receivables write-offs in excess of 1% of gross transaction volume through our CorConnect system in a trailing 12 month period, and it requires us to maintain a minimum fixed charge coverage ratio. We were in compliance with such covenants as of September 30, 2015.
Our obligations under the senior credit facility are secured by substantially all of our property.
Interim finance line of credit. We have a $7.5 million uncommitted credit agreement with M&T Bank, which we refer to as our interim finance line of credit. We use this line to finance equipment for asset management solutions customers for a period of less than 90 days during which modifications are being made to bring the assets in line with a customer's specifications. After the modifications are completed we may assist the customer in locating a permanent funding source. All borrowings under the interim finance line of credit must be approved by the lender on a transaction by transaction basis. Interest on loans made under our interim finance line of credit accrue at LIBOR plus a margin of 2.5% and is payable monthly in arrears. All borrowings under the interim finance line of credit are due within 120 days of borrowing. The interim finance line of credit terminates in February 2019. As of September 30, 2015, we had no amounts outstanding under our interim finance line of credit.
The interim finance line of credit contains customary events of default and affirmative covenants. We were in compliance with such covenants as of September 30, 2015.
Our obligations under the interim line of credit are secured by our beneficial ownership of certain personal property purchased with the borrowings under the interim finance line of credit.
72
Notes payable
As of December 31, 2014, we had long-term notes payable outstanding with three separate lending institutions, issued with a total principal value of $29.1 million. $5.8 million of such amounts are due within twelve months of December 31, 2014. These notes payable are used to purchase equipment for our leasing customers. The notes payable are secured by the purchased equipment and a lender's recourse in the event of default is not limited to the equipment purchased thereunder and is cross-collateralized with any other of our debt held by such lender. We expect to repay some or all of these notes payable using the proceeds of this offering. See "Use of Proceeds."
We are the issuer of various notes with principal amounts totaling $0.3 million as of September 30, 2015 issued to PNC Equipment Finance, LLC. These notes bear interest rates ranging from 3.71% to 4.04% and mature in equal monthly installments from October 2016 to November 2016.
We are also the issuer of various notes with principal amounts totaling $31.0 million as of September 30, 2015 issued to Mercedes Financial Services USA LLC. These notes bear interest rates ranging from 4.75% to 5.30% and mature in equal monthly installments from June 2017 to September 2020.
We are also the issuer of various notes with principal amounts totaling $3.0 million as of September 30, 2015 issued to Volvo Financial Services. These notes bear interest rates ranging from 4.45% to 4.70% and mature in equal monthly installments from May 2017 to May 2018.
Working capital and cash flows
The following table summarizes our cash and cash equivalents, accounts receivable, net working capital and cash flows for the periods indicated:
| |
As of or for the year ended December 31, |
As of and for the nine months ended September 30, |
||||||||||||||
|---|---|---|---|---|---|---|---|---|---|---|---|---|---|---|---|---|
| |
2012 | 2013 | 2014 | 2014 | 2015 | |||||||||||
| |
(In thousands) |
|||||||||||||||
Cash and cash equivalents |
$ | 16,711 | $ | 22,300 | $ | 25,673 | $ | 34,000 | $ | 32,767 | ||||||
Accounts receivable, net |
49,345 | 101,300 | 116,955 | 122,346 | 146,715 | |||||||||||
Net working capital |
8,357 | 42,539 | 46,576 | 52,977 | 65,840 | |||||||||||
Net cash provided by (used in): |
||||||||||||||||
Operating activities |
3,572 | (10,821 | ) | 19,962 | 15,984 | 1,880 | ||||||||||
Investing activities |
(1,450 | ) | 2,216 | (3,464 | ) | (1,477 | ) | (3,083 | ) | |||||||
Financing activities |
1,487 | 14,194 | (13,125 | ) | (2,807 | ) | 8,297 | |||||||||
Our cash and cash equivalents at December 31, 2014 and September 30, 2015 were held for working capital purposes. We do not enter into investments for trading or speculative purposes. Our policy is to invest any cash in excess of our immediate requirements in investments designed to preserve the principal balance and provide liquidity. Accordingly, our cash and cash equivalents are invested primarily in demand deposit accounts, certificates of deposit and money market funds that are currently providing only a minimal return.
Cash provided by (used in) operating activities
Net cash provided by (used in) operating activities consisted of net income adjusted for certain non-cash items including depreciation and amortization, bad debt expense, stock-based compensation and deferred income taxes, as well as the effect of changes in working capital and other activities.
Net cash provided by (used in) operating activities is significantly influenced by the amount of cash we require to support the recent growth of our financial process automation and procurement solutions, both of which require us to take credit risk on behalf of our customers and often make
73
payments on their behalf to suppliers and other vendors before the customer would be required to pay us. As a result, as our revenue in those areas grows, we use more cash than we collect in a given period due to the lag in payments.
Net cash provided by operating activities was $1.9 million for the nine months ended September 30, 2015, which was driven by net income, as adjusted for depreciation and amortization, bad debt expense, stock based compensation and deferred taxes, which contributed a combined $17.4 million to cash from operating activities. Also, an increase in accounts payable, largely due to overall increases in financial process automation and asset management transaction volumes, contributed an additional $17.5 million. However, these were offset by an increase in accounts receivable and other current and non-current assets and liabilities of $32.8 million during the period, which was also driven by increases in financial process automation and procurement transaction volumes.
Net cash provided by operating activities was $16.0 million for the nine months ended September 30, 2014, which was driven by net income, as adjusted for depreciation and amortization, bad debt expense, stock based compensation and deferred taxes, which contributed a combined $16.2 million to cash from operating activities. Also, an increase in accounts payable, largely due to overall increases in financial process automation and asset management transaction volumes, contributed an additional $23.3 million. Also, a net increase in operating assets and liabilities, primarily accounts receivable, largely due to overall increases in financial process automation and procurement transaction volumes contributed an additional $23.8 million use of cash.
Net cash provided by operating activities was $20.0 million for the year ended December 31, 2014, which was driven by net income, as adjusted for depreciation and amortization, bad debt expense, stock based compensation and deferred taxes, which contributed a combined $23.1 million to cash from operating activities. Also, an increase in accounts payable, largely due to overall increases in financial process automation and procurement transaction volumes, contributed an additional $13.5 million. However, these were offset by an increase in accounts receivable of $18.1 million during the period, which was also driven by increases in financial process automation and procurement transaction volumes.
Net cash used in operating activities was $10.8 million for the year ended December 31, 2013, which was driven by net income, as adjusted for depreciation and amortization, bad debt expense, stock based compensation and deferred taxes, which contributed a combined $19.7 million to cash from operating activities. Also, an increase in accounts payable, largely due to overall transaction volume increases, contributed an additional $22.5 million. However, these were offset by an increase in accounts receivable of $53.5 million during the period, which was also driven by increases in financial process automation and procurement transaction volumes.
Net cash provided by operating activities was $3.6 million for the year ended December 31, 2012, which was driven by net income, as adjusted for depreciation and amortization bad debt expense, stock based compensation and deferred income taxes, which contributed a combined $12.4 million to cash from operating activities. However, a decrease in accounts payable of $8.8 million and increases in accounts receivable of $2.6 million offset much of the cash provided.
Cash (used in) provided by investing activities
Our investing activities have consisted primarily of purchases of equipment and software developed for internal use, and short-term investments, as well as business acquisitions in prior years. We expect our capital expenditures and our investment activity to continue to increase as our business grows.
Net cash used in investing activities was $3.1 million for the nine months ended September 30, 2015. This amount was largely driven by our additional purchases of property and equipment of $5.3 million related to our investment in additional hardware and software primarily to support our
74
financial process automation and procurement solutions segments. These amounts were partially offset by sales of revenue earning equipment of $2.2 million in connection with our asset management solutions.
Net cash used in investing activities was $1.5 million for the nine months ended September 30, 2014. This was largely driven by our additional purchases of property and equipment of $4.7 million related to our investment in additional hardware and software primarily to support our financial process automation and procurement solutions segments. These amounts were partially offset by sales of revenue earning equipment of $3.2 million in connection with our asset management solutions.
Net cash used in investing activities was $3.5 million during the year ended December 31, 2014. This amount was largely driven by our additional purchases of property and equipment of $5.9 million related to our investment in additional hardware and software primarily to support our financial process automation and procurement solutions and revenue earning equipment of $1.3 million in support of our asset management solutions. These amounts were partially offset by sales of revenue earning equipment of $3.9 million in connection with our asset management solutions.
Net cash provided by investing activities was $2.2 million during the year ended December 31, 2013. This amount was largely driven by sales of revenue earning equipment of $6.5 million in connection with our asset management solutions. These amounts were partially offset by our additional purchases of property and equipment of $4.0 million related to our investment in additional hardware and software primarily to support our financial process automation and procurement solutions.
Net cash used in for investing activities was $1.5 million during the year ended December 31, 2012. This amount was largely driven by sales of revenue earning equipment of $3.5 million in connection with our asset management solutions. These amounts were offset by our additional purchases of revenue earning equipment of $2.7 million in support of our asset management solutions and property and equipment of $2.2 million related to our investment in additional hardware and software primarily to support our financial process automation and procurement solutions.
Cash (used in) provided by financing activities
Our primary financing activities for the periods presented have primarily consisted of repurchases of common stock, equipment financing and stock option exercises by employees.
Net cash provided by financing activities was $8.3 million during the nine months ended September 30, 2015. This change was largely influenced by the net proceeds and payments on our asset-based line of credit, which resulted in a net increase of $16.0 million of cash to support our financial process automation and procurement solutions transaction volume growth. This amount was offset by the repayments on our equipment financing notes of $5.9 million.
Net cash used in financing activities was $2.8 million during the nine months ended September 30, 2014. This change was largely influenced by the net proceeds and payments on our asset-based line of credit, which resulted in a net increase of $5.0 million of cash to support our financial process automation and procurement solutions transaction volume growth. This amount was offset by the repayments on our equipment financing notes of $7.7 million.
Net cash used in financing activities was $13.1 million during the year ended December 31, 2014. This change was largely influenced by the net payments on and proceeds on our asset-based line of credit, which resulted in a net cash outflow of $3.0 million of cash provided from our line of credit as we continued to leverage our line of credit to support our financial process automation and procurement solutions transaction volume growth. This amount was offset by the net payments on and proceeds from our equipment financing, which resulted in a net total payment on equipment financing of $9.2 million.
75
Net cash provided by financing activities was $14.2 million during the year ended December 31, 2013. This change was largely influenced by the net payments on and proceeds on our asset-based line of credit, which resulted in a net surplus of $23.8 million of cash provided from our line of credit as we continued to leverage our line of credit to support our financial process automation and procurement solutions transaction volume growth. This amount was partially offset by the net payments on and proceeds from our equipment financing, which resulted in a net total payment on equipment financing of $10.1 million.
Net cash provided by financing activities was $1.5 million during the year ended December 31, 2012. This change was largely influenced by the net payments on and proceeds on our asset-based line of credit, which resulted in a net surplus of $16.2 million of cash provided from our line of credit as we leveraged our line of credit to support our financial process automation and procurement solutions transaction volume growth. This amount was offset somewhat by the net payments on and proceeds from our equipment financing, which resulted in a net total payment on equipment financing of $12.3 million. The net cash provided by financing activities was further offset by debt issuance costs of $1.5 million related to our $100.0 million senior credit facility. We also used cash to repurchase common stock for $1.2 million from certain of our stockholders under the terms of our shareholders' agreement.
Net cash used in investing activities and net cash (used in) provided by financing activities do not reflect the impact of non-cash purchases of revenue-earning equipment of $14.0 million, $17.1 million and $7.6 million during each of the years ended December 31, 2012, 2013 and 2014 that were purchased through direct manufacturer financing in connection with our asset management solutions.
Contractual obligations and commitments
Our principal commitments consist of obligations under our outstanding credit agreement and non-cancelable operating leases related to our facilities and equipment. Set forth in the following table is information concerning our known contractual obligations as of December 31, 2014 that are fixed and determinable.
| |
Payment due by period | |||||||||||||||
|---|---|---|---|---|---|---|---|---|---|---|---|---|---|---|---|---|
Contractual Obligations
|
Total | Less than 1 Year |
1 - 3 years | 3 - 5 years | More than 5 years |
|||||||||||
| |
(in thousands) |
|||||||||||||||
Long-term debt obligations(1) |
$ | 72,106 | $ | 8,003 | $ | 55,331 | $ | 8,772 | $ | — | ||||||
Operating lease obligations(2) |
5,447 | 1,076 | 1,491 | 1,159 | 1,721 | |||||||||||
| | | | | | | | | | | | | | | | | |
Total |
$ | 77,553 | $ | 9,079 | $ | 56,822 | $ | 9,931 | $ | 1,721 | ||||||
| | | | | | | | | | | | | | | | | |
| | | | | | | | | | | | | | | | | |
| | | | | | | | | | | | | | | | | |
- (1)
- Pertains
to payments of principal and interest on long-term notes payable. Interest payment obligations under our variable interest rate revolving credit
facility were calculated assuming that the interest rate and the balance due under the credit facility remain constant over the period of repayment. See "Liquidity and capital
resources—Sources of liquidity—Notes payable."
- (2)
- We lease our office facilities in New Jersey, Illinois, Virginia, Florida, Tennessee and Georgia under operating leases that are scheduled to expire at various times through December 31, 2023.
Off-balance sheet arrangements
We also periodically enter into agreements in the normal course of certain third-party leasing transactions under our asset management solutions to repurchase assets from a third-party leasing company at a pre-determined residual price at the end of a third-party lease if our customer does not elect to exercise its option to purchase the asset under the lease and certain other conditions have been
76
met. For further details, see note 16 of our consolidated financial statements included in this prospectus.
We did not otherwise have any off-balance sheet arrangements, as defined in Item 303(a)(4)(ii) of SEC Regulation S-K.
Critical accounting policies and estimates
Our financial statements and the related notes included elsewhere in this prospectus are prepared in accordance with generally accepted accounting principles in the United States. The preparation of these financial statements requires us to make estimates and assumptions that affect the reported amounts of assets, liabilities, revenue, costs of revenue, operating expenses, other income and expenses, provision for income taxes and related disclosures. We base our estimates on historical experience and on various other assumptions that we believe to be reasonable under the circumstances. Changes in accounting estimates are reasonably likely to occur from period to period. Accordingly, actual results could differ significantly from our estimates. We evaluate our estimates and assumptions on an ongoing basis. To the extent that there are material differences between our estimates and our actual results, our future financial statement presentation, financial condition, results of operations and cash flows will be affected.
We believe the assumptions and estimates associated with the following accounting policies have the greatest potential impact on our consolidated financial statements.
Revenue recognition
We recognize revenue when persuasive evidence of an arrangement exists, the services have been rendered to the customer or delivery has occurred, the pricing is fixed or determinable, and collectability is reasonably assured.
Financial process automation solutions
We assess fees for transaction processing, which are based upon either a fixed amount per transaction or a percentage of the transaction value. Such fees are recognized at the time that the customer submits the transaction for processing and the transaction is validated in our system. We host and provide software to our customers to facilitate efficient transaction processing. These fees are recognized each month as the software is made available for the customer's use. These fees are generally a fixed amount for each new customer and are assessed at the beginning of a contract. As noted below they do not qualify as a separate unit of accounting and therefore are deferred and recognized over period of the expected customer relationship.
Procurement solutions
Purchasers in our procurement networks pay us a fee in connection with their transactions. Fees are based on a product margin that varies by procurement program and typically includes a nominal fee per invoice. Suppliers that participate in our procurement networks pay us a fee calculated either as a percentage of the transaction value under specific preferred procurement programs or as a pre-determined fee per transaction or item. In addition many suppliers pay us volume based rebates on a quarterly or annual basis. These fees are recognized when the underlying customer order has been fulfilled. Rebate revenue is recognized based upon the actual purchase volume achieved in the period. Rebate revenue is recognized net of any amounts that are passed through to customers.
Asset management solutions
Revenue on sales of equipment is recognized when an agreement of sale has been reached, the customer has secured a funding source and the customer has taken possession of the vehicle. All of our
77
leases are classified as operating leases under ASC 840. As a result, revenue is recognized on a straight line basis over the lease term. Revenue recognition ceases when we have not received any payments from a customer for a period of six weeks. Our service revenues consist primarily of: lease brokerage fees, which are recognized when the underlying lease transaction is consummated; equipment brokerage fees from manufacturers, which are recognized when our customers purchase a capital asset from a specific vendor; membership dues, which are recognized on a straight line basis over the period that membership services are provided; and maintenance fees, which represent a mark-up on maintenance services arranged by us, which are recognized when the related service is performed by the third party provider.
Up-front fees
Although we do not offer bundled pricing for our various service offerings, our contracts with customers within the financial process automation solutions and asset management solutions segments often require customers to pay "up-front" implementation or contract set up fees, which are deferred and recognized over the estimated period that the contract or customer relationship is expected to generate revenue.
Within the financial process automation solutions segment, these fees are charged at the beginning of the customer relationship as compensation for our efforts to configure the system to specific customer needs and provide training to the customer. These fees do not represent a separate unit of accounting as they do not have value apart from the broader transaction processing contract. As a result, they are recognized on a straight line basis over the estimated life of the customer relationship, which ranges from 3-5 years.
Within the asset management solutions segment, these fees are assessed at the inception of our operating leases in order to compensate us for our costs incurred in preparing the asset for lease. These fees do not represent a separate unit of accounting as they do not have value apart from the related lease. As a result, they are recognized on a straight line basis over the contract term.
Lease Classification
We evaluate our owner operator leases on a lease by lease basis to determine whether lease payments are reasonably predictable. Our experience indicates that the vast majority of our leases will terminate prior to the expiration of the term, with most of the terminations occurring within one year of the initial lease commencement. As we are unable to conclude that the payments under such leases are reasonably predictable over the contractual lease term, our owner-operator leases have been classified as operating leases in the financial statements as required by ASC 840.
Allowance for Doubtful Accounts
We manage our accounts receivable by regularly monitoring the financial strength of our customers and adjusting credit limits and security requirements accordingly. Customers with a strong financial position and payment history are given more favorable credit terms, while customers in a weaker financial position or with a history of late payments are subject to more stringent credit limits and may be required to post a security deposit or other collateral. When customer accounts become past due, we respond by placing collection calls and limiting additional customer purchases. If accounts are not collected after these initial efforts, we may take action against any collateral or security deposits that we may have obtained. If all of our collection efforts prove unsuccessful, we may refer our accounts receivable to collection agencies, which earn a commission on any amounts collected. If the collection agency is unable to make any collections for 90 days, the receivables are written off. Our collection policies have historically been successful in collecting the majority of at risk accounts.
A significant portion of our accounts receivables are generated by our Procurement and Financial Process Automation solutions businesses (also referred to as program receivables). We develop our
78
allowance for doubtful accounts receivable based upon our historical experience with customers and the age of its underlying receivables. Each customer account is assigned a risk rating based upon the customer's financial strength, payment history and any known actions, such as liquidation or bankruptcy. An allowance is established for each customer risk grouping after considering the historical level of write offs for customers with a similar risk profile, any known economic or industry trends, and customer specific information. This assessment is done on a customer by customer basis each quarter. As the customer risk rating and the age of the underlying receivables increases, the allowance for that account is also increased. While we do not currently foresee any significant changes in our ability to collect our receivables, deterioration in the financial strength of our customers could cause a significant increase in our historical level of write offs and the related bad debt expenses.
Bad debt expense related to our program receivables increased from $0.4 million in 2012 to $1.4 million in 2013 as our program receivables more than doubled from $49.6 million at December 31, 2012 to $102.7 million as of December 31, 2013. Due to the large increase in program receivables we increased our allowance for doubtful accounts, which resulted in higher bad debt expense during the period. The significant increase in program receivables was due to the implementation of a major new contract with Daimler, which resulted in a large amount of new customers during 2013. We performed credit underwriting procedures on all new customers and determined them to be an acceptable risk. However, due to our lack of purchase and payment history with those customers, higher risk ratings were applied to those customers, thus resulting in higher allowances and bad debt expense. During 2014, bad debt expense related to our program receivables decreased to $0.7 million, which was driven by several factors, including: (1) a smaller increase in the program receivable balance, which increased by $15.9 million during 2014 compared to a $53.1 million increase in 2013, (2) favorable adjustment of customer risk ratings for new customers obtained in 2013 to reflect specific customer performance history from 2013 and 2014, and (3) improved collection experience as those receivables aged over 90 days decreased from $7.5 million to approximately $6.0 million. Based upon our cumulative experience with the customers added under the Daimler contract, we believe that the additional customers obtained through the contract improved the average credit quality of our customer base between 2012 and 2013. The overall credit quality of our customer base and the related program receivables did not vary significantly between 2013 and 2014.
Bad debt expense related to our operating lease receivables was $1.1 million, $0.7 million and $0.9 million during the years ended December 31, 2012, 2013, and 2014, respectively. Bad debt expense related to our operating lease receivables is driven primarily by the number of customer delinquencies (from owner-operator lessees) during the period as well as the average amount owed to the Company when the customer becomes delinquent. Bad debt expense decreased during 2013, compared to 2012, primarily due to a lower number of delinquencies as we significantly reduced our fleet size and began shifting our asset portfolio toward newer equipment (i.e. trucks). During 2014, the number of delinquencies was slightly lower than 2013, due to further reduction in the fleet size, but bad debt expense increased due to customers having a higher average receivable balance at the time of default. The higher average receivable balance resulted from our focus on newer equipment, which requires a higher weekly payment. See note 5 to the consolidated financial statements for additional information regarding our accounts receivable.
Goodwill
Goodwill and intangible assets deemed to have indefinite lives are not amortized but rather are tested at least annually for impairment, or when circumstances indicate that the carrying amount of the asset may not be recoverable. Goodwill is tested for impairment at the reporting unit level. A reporting unit is an operating segment or a component of an operating segment. Goodwill is tested for impairment by either performing a qualitative evaluation or a two-step quantitative test. The qualitative evaluation is an assessment of factors to determine whether it is more likely than not that the fair value of a reporting unit is less than its carrying amount, including goodwill. We may elect not to perform the
79
qualitative assessment for some or all reporting units and perform a two-step quantitative impairment test. Fair value is determined based on discounted cash flow analysis or the use of market multiples applied the reporting units earnings. Both valuation methods include significant management assumptions such as revenue growth rates, operating margins, weighted average cost of capital, the selection of comparable companies and future economic and market conditions. If the carrying value of the reporting unit exceeds fair value, goodwill is considered impaired. The amount of the impairment is the difference between the carrying value of the goodwill and the "implied" fair value, which is calculated as if the reporting unit had just been acquired and accounted for as a business combination.
We do not have any goodwill at reporting units that are at risk of failing step one of the goodwill impairment test.
Software development costs
We capitalize certain development costs incurred to acquire or create our internal-use software. These capitalized costs are primarily related to applications we host for use by our customers. Costs incurred in the preliminary stages of development are expensed as incurred. Once the application development stage is reached, internal and external costs, if direct and incremental, are capitalized until the software is substantially complete and ready for its intended use. Capitalization ends when all substantial testing is complete. Our internal capitalized costs consist primarily of direct labor and fringe benefits. We also capitalize costs related to specific upgrades and enhancements when it is probable the expenditures will result in additional functionality. Capitalized costs are included in the internally developed software class in property, equipment and revenue-earning equipment. These costs are amortized on a straight line basis over their estimated useful life, which is typically three years. Maintenance and training costs are expensed as incurred. Our management evaluates the remaining useful lives of these assets on an annual basis and tests for impairment whenever events or changes in circumstances occur that could impact the recoverability of these assets. There were no impairments of our internally developed software for the years ended December 31, 2012, 2013 and 2014 or for the nine months ended September 30, 2015.
Stock-based compensation
We offer restricted stock and stock options to certain employees and account for stock-based compensation in accordance with the Financial Accounting Standards Board or, FASB, Accounting Standards Codification, or ASC, 718, Compensation—Stock Compensation, by recognizing the fair value of stock-based compensation in the consolidated statements of income. The fair value of our stock option awards are estimated using a Black-Scholes option valuation model. This model requires the input of highly subjective assumptions including expected stock price volatility and the estimated life of each award. In addition, the calculation of compensation costs requires that we estimate the number of awards if any that will be forfeited during the vesting period. The fair value of a stock award is recognized over the vesting period of the award net of estimated forfeitures, if any. For stock-based awards that vest based on performance conditions (for example, the achievement of certain milestones), expense is recognized over the remaining vesting period beginning on the date that it is probable the condition will be met.
We also offer restricted stock awards to our board of directors and certain key executives. These awards do not contain performance conditions and vest at the end of the related service periods, which range from one to three years. We recognize the expense for the grant date fair value of the awards on a straight line basis over the vesting period.
Common stock valuations
Our board of directors estimated the fair value of our common stock at the time of each grant of share-based awards. To determine this value, our board of directors has considered input from
80
management and an independent third-party valuation firm. The valuations of our common stock were determined in accordance with the guidelines outlined in the American Institute of Certified Public Accountants Practice Aid, Valuation of Privately-Held-Company Equity Securities Issued as Compensation and Internal Revenue Service Revenue Ruling 59-60. Since December 31, 2011, we have received annual valuation reports of our common stock from an independent third-party valuation firm that were near-contemporaneous with the grants of the stock-based compensation. Our board of directors exercised reasonable judgment and considered numerous objective and subjective factors in making its fair value determinations. These factors include:
- •
- valuations performed by an independent third-party valuation firm that were generally nearly contemporaneous with the grant dates;
- •
- our actual operating and financial performance;
- •
- current business conditions and projections;
- •
- hiring of key personnel and the experience of our management;
- •
- the history of the company and the introduction of new services;
- •
- our stage of development;
- •
- our likelihood of achieving a liquidity event, such as an initial public offering or merger or acquisition of our company given
prevailing market conditions;
- •
- illiquidity of share-based awards involving securities in a private company;
- •
- the market performance of comparable publicly traded companies; and
- •
- the U.S. and global capital market conditions.
In estimating the value of our common stock, our board of directors determined the equity value of the business by considering both market- and income-based approaches. To assist our board of directors with the determination of the fair value of the common stock, we obtained third-party valuations of our common stock as of the last day of each fiscal year. The independent valuations performed by unrelated third-party valuation specialists were just one factor used by our board of directors to assist with the valuation of the common stock, and our management and board of directors have assumed full responsibility for the estimates. Our unrelated third-party valuation specialists provided us with their estimation of fair value and the allocation of that fair value to our common stock at periodic intervals.
The following table summarizes all stock grants from January 1, 2014 through the date hereof:
Grant Date
|
Number of Shares Granted |
Grant Date Fair Value Per Share of Common Stock |
|||||
|---|---|---|---|---|---|---|---|
January 2, 2014 |
40,000 | $ | 5.00 | ||||
July 1, 2014 |
54,972 | $ | 5.00 | ||||
June 23, 2015 |
17,860 | $ | 7.75 | ||||
September 15, 2015 |
43,000 | $ | 7.75 | ||||
November 9, 2015 |
3,224 | $ | 7.75 | ||||
As of September 30, 2015, unrecognized stock-based compensation related to unvested stock options and restricted stock was $4.2 million.
Recent accounting pronouncements
During 2012, we adopted FASB Accounting Standards Update (ASU) No. 2012-02, Testing Indefinite-Lived Intangible Assets for Impairment, which amends ASC 350, Intangibles—Goodwill and Other. This ASU gives an entity the option to first assess qualitative factors to determine if indefinite-
81
lived intangible assets are impaired. The entity may first determine based on qualitative factors if it is more likely than not that the fair value of indefinite-lived intangible assets are less than their carrying amount. If that assessment indicates no impairment, the quantitative impairment test is not required. The adoption did not have a material effect on our consolidated financial statements.
During 2014, we adopted ASU No. 2013-11, Income Taxes (Topic 740): Presentation of an Unrecognized Tax Benefit When a Net Operating Loss Carryforward, a Similar Tax Loss, or a Tax Credit Carryforward Exists. ASU No. 2013-11, requires presentation of an unrecognized tax benefit in the financial statements as a reduction to a deferred tax asset for a net operating loss carryforward, a similar tax loss, or a tax credit carryforward. To the extent a net operating loss carryforward, a similar tax loss, or a tax credit carryforward is not available at the reporting date under the tax law of the applicable jurisdiction to settle any additional income taxes that would result from the disallowance of a tax position or the tax law of the applicable jurisdiction does not require the entity to use, and the entity does not intend to use, the deferred tax asset for such purpose, the unrecognized tax benefit would be presented in the financial statements as a liability and would not be combined with deferred tax assets. The adoption did not have a material effect on our consolidated financial statements.
In May 2014, the FASB issued ASU No. 2014-09, Revenue from Contracts with Customers. The standard will eliminate the transaction specific and industry specific revenue recognition guidance under current U.S. GAAP and replace it with a principle based approach for determining revenue recognition. Public entities are required to apply the revenue recognition standard for annual reporting periods beginning after December 15, 2017, including interim periods within that annual reporting period. However, because we are an "emerging growth company" under the JOBS Act, we are able to defer application of this standard until the effective date for private companies, which is for annual reporting periods beginning after December 15, 2018 and includes any interim reporting periods therein. Early application is not permitted. We are currently evaluating the methods of adoption allowed by the new standard and the effect that the updated standard will have on our consolidated financial statements and related disclosures.
In April 2015, the FASB updated the accounting guidance related to the balance sheet presentation of debt issuance costs. The updated accounting guidance requires that debt issuance costs be presented as a direct deduction from the associated debt liability. The updated accounting guidance will be effective for us on January 1, 2016, and early adoption is permitted. The updated accounting guidance will be applied retrospectively to all prior periods presented. We do not currently expect that the updated accounting guidance will have a material impact on our consolidated balance sheet.
In September 2015, the FASB issued Accounting Standards Update No. 2015-16, Business Combinations (Topic 805): Simplifying the Accounting for Measurement-Period Adjustments (ASU 2015-16), to simplify the accounting for adjustments made to provisional amounts recognized in a business combination and eliminate the requirement to retrospectively account for those adjustments. ASU 2015-16 is effective for annual reporting periods beginning after December 15, 2016, and interim periods therein, with early adoption permitted for financial statements that have not been issued. We adopted ASU 2015-16 during the third quarter of 2015, and the adoption of this standard did not have a material impact on our consolidated financial statements.
In November 2015, the FASB issued ASU 2015-07, Income Taxes—Balance Sheet Classification of Deferred Taxes ASU 2015-07, which requires all deferred tax liabilities and assets to be presented in the balance sheet as noncurrent. We do not expect the provision of ASU 2015-07 to have a material impact on our consolidated financial statements, as the application of this guidance affects classification only. We plan to early adopt this update in connection with our annual reporting period ended December 31, 2015.
82
Emerging growth company status
We are an "emerging growth company," as defined in the Jumpstart Our Business Startups Act of 2012, or the JOBS Act, and we may take advantage of certain exemptions from various reporting requirements that are applicable to other public companies that are not emerging growth companies. Section 107 of the JOBS Act provides that an emerging growth company can take advantage of the extended transition period provided in Section 7(a)(2)(B) of the Securities Act for complying with new or revised accounting standards. In other words, an emerging growth company can delay the adoption of certain accounting standards until those standards would otherwise apply to private companies. We have elected to take advantage of these exemptions until we are no longer an emerging growth company or until we affirmatively and irrevocably opt out of this exemption.
Quantitative and qualitative disclosures about market risk
Inflation risk
Inflationary factors, such as increases in our costs and operating expenses, may adversely affect our results of operations, as our customers typically purchase our services on a subscription basis over a multi-year period. Although we do not believe that inflation has had a material impact on our financial position or results of operations to date, an increase in the rate of inflation in the future may have an adverse effect on our costs and operating expenses as a percentage of revenue if we are unable to increase the prices for our subscription-based products to keep pace with these increased expenses.
Interest rate risk
We are exposed to market risk related to changes in interest rates. Our cash equivalents primarily consist of money market funds backed by United States Treasury Bills and certificates of deposit. At September 30, 2015, we had cash and cash equivalents of $32.8 million. The carrying amount of our cash equivalents reasonably approximates fair value, due to the short maturities of these instruments. The primary objectives of our investment activities are the preservation of capital, the fulfillment of liquidity needs and the fiduciary control of cash and investments. We do not enter into investments for trading or speculative purposes.
We do not believe our cash equivalents or short-term investments have significant risk of default or illiquidity. While we believe our cash equivalents or short-term investments do not contain excessive risk, we cannot provide absolute assurance that in the future our investments will not be subject to adverse changes in market value. In addition, we maintain significant amounts of cash and cash equivalents at one or more financial institutions that are in excess of federally insured limits. We cannot be assured that we will not experience losses on these deposits.
Commodity risk
We pass through increases in the prices of our products and services offered under our procurement solutions to our clients. As a result, we believe that there is no material risk exposure to fluctuations in the prices of products and services.
Foreign exchange risk
A portion of the transactions processed through our financial process automation solutions are denominated in foreign currencies (primarily the Canadian dollar). In processing these transactions we are exposed to risk associated with changes in the valuation of the U.S. dollar relative to other currencies. In general we pay the transactions that we process in advance of collecting the underlying cash from our customers. As a result we will experience gains during times that the U.S. dollar is weakening and losses during times that the U.S. dollar is strengthening. However, given the overall level of exposure that we have to foreign currency in recent periods, an increase or decrease of as much as 10% in applicable foreign exchange rates would not have a material effect on our financial position or results of operations as of and for the nine months ended September 30, 2015.
83
Overview
We are a growing provider of technology-enabled business-to-business solutions, which address the financial process, procurement and asset management needs of businesses. Our goal is to eliminate the inefficiency, expense and lost opportunities caused by traditional paper-based processes for our customers, allowing them to be competitive at any size or scale. We leverage our proprietary technology, deep expertise and supplier and vendor relationships to help enterprises of all sizes manage complex and dynamic operational and administrative processes that have traditionally required substantial internal resources. While we originated as a provider of procurement and fleet management solutions for the transportation industry, we have used our technology and the expertise we developed to offer robust financial process automation solutions and more advanced procurement solutions to companies in multiple industries in recent years.
Our financial process automation solutions consist primarily of our cloud-based technology offerings that automate accounts receivable and accounts payable processes for our clients, including e-invoicing, credit and collections management, working capital management and reporting analytics. Our procurement solutions leverage our financial process automation technology to enable companies to optimize their procurement processes from sourcing through payment management and include group purchasing and spend management tools predominantly for goods supporting the transportation industry. Our asset management solutions provide data-driven strategic planning, asset acquisition and disposition and asset financing alternatives to help businesses, predominantly in the transportation industry, to lower the total cost of capital asset ownership. Our solutions are highly scalable and offered in an à la carte format, so that our customers can selectively purchase those solutions that they need. We believe that the complementary aspects of our solutions make us well-positioned to capitalize on our large customer and supplier network and provide cross-selling opportunities.
PayStream Advisors, a third-party research and consulting firm, estimates that business-to-business trade in the United States was conducted through 16.5 billion invoices among approximately 10 million businesses during 2013. Entities of various sizes incur substantial costs to process and facilitate these business-to-business transactions. Traditionally, these functions have been paper-based, labor-intensive and error-prone. Moreover, many businesses may lack scale, real-time data and specialized personnel for these transactions, all of which cause operational inefficiencies and excess cost.
We believe that many types of businesses have similar financial process automation, procurement and asset management needs. Our solutions are designed to leverage our experience, expertise and investments to address these common challenges for businesses of various sizes and in a variety of industries. We originally founded our business in 1996 to help independent commercial truck operators address some of these challenges. Over time, we have evolved to provide a comprehensive suite of technology-enabled financial process automation solutions and procurement solutions to purchasers and suppliers within the transportation, manufacturing, retail, energy, higher education and media industries.
Our total revenue was $57.6 million, $67.4 million and $84.8 million during the years ended December 31, 2012, 2013 and 2014, respectively, a compound annual growth rate, or CAGR, of 21.4% over those periods. Our net income was $0.6 million, $4.6 million and $6.8 million during the years ended December 31, 2012, 2013 and 2014, respectively. Our adjusted EBITDA was $12.6 million, $21.6 million and $25.9 million during the years ended December 31, 2012, 2013 and 2014, respectively, representing a CAGR of 43.2% over those periods. Our total revenue was $63.9 million and $65.2 million, our net income was $4.6 million and $4.2 million and our adjusted EBITDA was $18.3 million and $21.0 million during the nine months ended September 30, 2014 and 2015, respectively.
84
Our markets
Business-to-business solutions: a large and growing global market
We believe a significant market opportunity exists for technology-enabled business-to-business solutions that help businesses with their financial process, procurement and asset management needs. We estimate that the total serviceable addressable market within the industries we currently primarily serve were as follows during 2014: finance and accounting cloud services—$958.1 million, procurement for aftermarket commercial truck tires and parts—$3.85 billion, and asset management for the transportation industry—$13.5 billion. Traditionally, these business functions have been paper-based and labor-intensive leading to inefficiency and excess cost. Businesses of all sizes spend a substantial amount of money on business-to-business transactions. Our solutions currently address the following key subsets of the business-to-business market:
Financial process automation. Gartner estimates that the 2014 North American market for finance and accounting cloud business process services was $958.1 million. In addition, Gartner estimates that between 2013 and 2018, finance and accounting solutions will grow at a compound annual growth rate, or CAGR, of 13.3%.
Procurement. According to The Everest Group, businesses outsourced $254 billion of non-core direct and indirect procurement spending in 2013, and spending managed through procurement outsourcing is estimated to grow more than 10% in 2014. Although our procurement solutions are well-suited for a number of industries, we currently principally serve our clients transportation-related procurement needs. Based on our internal estimates as validation using certain third party estimates, we estimate that U.S. businesses spent approximately $3.85 billion in 2014 procuring aftermarket commercial transportation tires and parts within our typical customers, which are trucking fleets of 100 to 1,000 power units.
Asset management. Based on our internal estimates as validation using certain third party estimates, we estimate that U.S. businesses spent approximately $13.5 billion during 2014 on asset management addressing the commercial truck finance lease market within the industry market verticals for which we currently provide asset management solutions.
Traditional, manual business-to-business processes are expensive and error-prone
Many businesses continue to manage a substantial number of their operational and administrative processes manually rather than with more efficient and cost effective automated technology. PayStream Advisors estimates that 52% of business-to-business invoices were still manually prepared in 2013. Manual processes introduce costly opportunities for human error that are far greater than automated, digital systems performing the same process. A study conducted by Ardent Partners recently found that "best-in-class" corporations experience invoice exceptions at less than half the rate experienced by their competitors. These best-in-class businesses are characterized by a high level of standardized accounts payable processes, automated approval routing, and straight-through invoice processing. Ardent Partners estimates that these best-in-class organizations process accounts payable invoices at over 86% lower cost and over 78% faster than other businesses.
Achieving the benefits of scale is difficult even for large organizations
Economies of scale are often difficult to achieve for many businesses, even for key operations of some of the largest businesses. Many suppliers provide improved pricing with greater purchasing volume. Businesses that lack sufficient purchasing volume for certain goods and services often receive inferior pricing compared to competitors with greater purchasing leverage, notwithstanding that procurement spending may be a relatively large and material element of their own business. For example, a major consumer textile goods manufacturer may be highly specialized in procuring raw
85
goods such as cotton, but it may lack the volume of purchases needed to obtain more favorable terms for various supporting goods, such as tires for its fleet of delivery trucks.
Additionally, many businesses are often too small for large suppliers to efficiently transact with them. For example, suppliers often require a minimum business size before they even begin the process of determining a customer's creditworthiness. For smaller and mid-size businesses that are more susceptible to volatility or uncertainty, suppliers may choose not to transact with those customers or they may insist on higher pricing and stricter payment terms to manage their credit risk.
Traditional finance and procurement overhead is often fixed
Finance and procurement personnel costs are typically fixed and not easily scaled to respond to fast changing business conditions. Businesses need more staff during periods of growth and fewer staff during slowdowns. In addition, manual staffing is inherently imprecise even at its most effective. For example, businesses relying on manual processes may have the need for the services of an in-house accounts payable clerk, without having enough volume to fully occupy that person. Therefore, businesses may employ more people than they need to execute their critical business processes. Alternatively, other businesses may cross-staff these departments with less experienced personnel from other departments in order to avoid incurring costs of hiring personnel specific to these departments, which can lead to understaffing in these departments. Complicating these staffing decisions is the cyclical nature of the economy. Likewise, equipment needs are often difficult to scale up or down based on macroeconomic changes and the seasonal nature of businesses. The resulting inelasticity of supply within a company often leads to ineffective processes or departments that may not provide sufficient value to justify their cost.
Businesses may not have the resources to invest in qualified and experienced administrative and operations personnel due to unpredictable market and business conditions. Given the expense associated with hiring these types of personnel, many businesses do not prioritize hiring these types of personnel because these expenses do not directly relate to achieving revenue. Even if businesses do hire in these areas, they may not allocate sufficient resources to staffing these areas, thus limiting the benefits that they could achieve by prioritizing these areas.
Multi-party business transactions are complex
Companies operating in sophisticated business-to-business communities are plagued by issues caused by the sheer number of counterparties with which they must interact. The average U.S. business annually transacts with hundreds of business-to-business counterparties, including customers, partners, and suppliers. Many market participants frequently operate without a common system to communicate in an automated and paperless environment, often relying on a broad range of electronic data interchange, or EDI, systems and data formats. The mere proliferation of these systems and varying protocols makes it increasingly difficult for many businesses to efficiently interact with their business-to-business communities. Additionally, many businesses under invest in information technology needed to address these challenges and run antiquated systems, which compounds the complexity.
Increased need for real-time visibility and effective internal controls
Businesses are operating in an increasingly fast-paced, complex and global environment. Enabling fast and accurate decision-making with real-time and reliable business information is critical to the long-term success of most organizations. Even businesses that have electronic capabilities are often not capable of accessing key line item data necessary to make those critical decisions. Without proper data and analysis tools, companies have poor visibility into invoice status, procurement contract compliance, internal procurement trends and payment status, leading to increased costs and missed opportunities.
Beyond the business incentive, many businesses are subject to increasing demands on their internal controls structure. For example, publicly-traded companies face enhanced disclosure and auditing
86
requirements of their internal controls or supply chains under recent statutory and regulatory changes at the state and federal level.
Managing working capital efficiently can be challenging
U.S. companies hold billions of dollars in working capital on their balance sheets. The ability of a business to manage its working capital in all market conditions influences its ability to forecast operational results and implement strategic initiatives. Many companies have the opportunity to increase stockholder value by managing working capital in a more efficient manner, but are encumbered by a number of internal challenges. Aberdeen Group estimates that comprehensive accounts payable automation solutions can increase a business's early payment discount savings by up to 340 basis points as compared to businesses without a centralized, automated accounts payable system. At the same time, many suppliers lack the resources to efficiently manage the large number of customers that they service. For example, according to a 2013 study by Gallup, the average business-to-business company has an optimally engaged relationship with only one in five of its customers. Optimally engaged relationships feature adequate monitoring tools to identify at-risk accounts that indicate a customer may be taking its business elsewhere. Without the efficiencies of an automated accounts receivable solution to maintain regular contact with their customers, a supplier may have difficulty establishing and maintaining optimally engaged customer relationships due to extended or difficult collections, which has a corresponding negative impact on working capital.
Legacy business-to-business systems lack a modern architecture and desired user experience
Many of the currently available on-premise business-to-business commerce systems have antiquated user interfaces and may be costly to deploy and maintain. With the widespread adoption and use of consumer-oriented Internet applications and consumer-oriented devices such as smartphones and tablets, today's generation of workers expects their organizations to embrace more accessible, intuitive and collaborative business applications. Users expect immediate and secure access to their enterprises' critical business information, but many legacy business-to-business applications do not embrace an optimized user experience, availability on personal devices, and ease-of-deployment.
Our solutions
Our solutions are designed to allow enterprises of all sizes to manage complex and dynamic administrative and operational processes that traditionally have required substantial human resources and expertise. Our financial process automation solutions consist primarily of our cloud-based Business-Process-as-a-Service technology offerings that automate accounts receivable and accounts payable processes for our clients, including e-invoicing, credit and collections management, working capital management, and reporting analytics. Our procurement solutions leverage the same technology platform underlying our financial process automation solutions to enable companies to optimize their direct (for goods directly related to production) and indirect (for goods otherwise required for day to day business) procurement processes from sourcing to payment management and include group purchasing and spend management tools. Our asset management solutions provide strategic planning, asset acquisition, asset financing and asset usage alternatives to help businesses lower the total cost of capital asset ownership.
Our solutions are highly scalable and offered in an à la carte format so that our customers can selectively purchase those solutions that they need. At the same time, these complementary business solution sets enable us to capitalize on our customer and supplier network, cross-selling opportunities and operational scale.
87
Financial process automation solutions
We believe our cloud-based financial process automation solutions address all members of a given business-to-business community, including manufacturers, suppliers, dealers, distributors, trading partners and end customers. We enable companies to streamline, automate, and manage transaction processes including e-invoicing, accounts payable and accounts receivable, collections, order management, credit risk management, reporting and payments. We use our OneConnect solution to facilitate cross-platform communication among parties using our solution. For our CorConnect customers, we also process and pay accounts payable directly to their suppliers on their behalf and take responsibility for collection. Through this solution, we help manage our customers' credit while concurrently ensuring their suppliers are promptly and properly paid. Our financial process automation solutions provide the following key benefits:
Automation of manual, labor-intensive processes. By transforming manual, paper-based purchase order and invoice processes to automated and electronic processes, our solutions help companies eliminate unnecessary overhead related to these tasks. As a result, the opportunity for human error decreases dramatically and businesses can also do more with fewer personnel. This also allows them to speed up invoice approval processes, increase control of outgoing cash flow and more accurately record transactions.
Seamless integration. Our cloud-based financial process automation solutions utilize our proprietary OneConnect transaction engine technology to enable fast connections among trading partners by turning every trading network transaction into standardized data that is instantly transmitted into the relevant system. Our platform enables importing and exporting of a variety of file formats using a number of file delivery methods with legacy information systems. For example, a customer can send us data in certain file formats and our technology instantly converts that data and sends it to the supplier in the file format that the supplier prefers.
Increased visibility and reporting capabilities. Customers benefit from end-to-end visibility into transaction processes which enables them to streamline workflows, reduce personnel and invoice processing costs, centralize the management of payables and receivables, maintain visibility of and collaboration among buyers and sellers, access robust reporting tools, and automate entire departments all without compromising business requirements or burdening information technology resources.
Access to channel finance and credit and collections management. Our CorConnect financial process automation solution provides channel finance to customers of all sizes. Our channel finance solutions allow suppliers to minimize their credit exposure to significant segments of their customer base. This allows suppliers to significantly reduce the overhead related to credit and collections management and receive reliable, timely payments on their accounts receivable. We use proprietary technology and analytics to manage credit in an efficient and scalable manner. We utilize our extensive customer purchase and payment history to manage credit in an individualized manner for each customer. Using our internally-developed software, we identify customer trends in transactions processed through our transaction engine, such as increasing or decreasing purchasing volume and slowing payments. In response to trends, we proactively adjust credit limits based upon each customer's existing and anticipated needs. This approach allows us to minimize potential business disruptions to our customers that may occur if static credit limits are reached or exceeded. As a result, our solutions are often less expensive and more flexible than a traditional credit card for solutions, which may base their credit decisions on generic credit scoring systems that often rely on less current information about the customer.
Cloud-based delivery with enhanced user experience. Customers may access our financial process automation solutions via a Web-based or mobile Web-based browser. Our cloud-based delivery allows us to provide all of our customers with the most current version of our solution.
88
Deep domain and best practices expertise. Our financial process automation solutions are supported by our long history in financial process management. Our personnel work directly with our customers to understand their needs and also to help them optimize their use of our solutions. For example, we employ solution implementation consultants that focus on helping customers align their processes internally to optimize their use of our financial process automation solutions. Our customers gain the benefit of this experience and expertise, allowing them to keep their focus on their core business.
Enhanced user experience. We design the user interface to follow business users' actions and align our applications with the way users naturally think and act. Our focus on an intuitive and simple user experience enables the adoption of our applications by any type of user, including the most novice, with minimal training. This focus enables our customers to generate higher productivity and better business results through broad access to more complete, timely and reliable information.
Procurement solutions
Our procurement solutions enable organizations to realize the benefits of volume-based, electronic procurement by identifying and establishing contracts with suppliers, aggregating the collective purchasing power of all participating customers and promoting process efficiencies of electronic transactions. Additionally, we assume responsibility for credit decisions and collections management, removing the administrative burden for suppliers in our network. Although our procurement solutions are presently focused on the transportation industry, we believe they have application across a variety of industries with similar needs.
Our procurement solutions provide the following key benefits to all participants in our network:
High-volume purchasing power. Our procurement solutions allow our customers to more comprehensively compete when it comes to purchasing power and spend management. We aggregate the purchasing power of our customers to offer pricing consistent with that available to high volume purchasers. In addition to the aggregation benefits, we have also developed purchasing relationships with hundreds of national vendors, which has resulted in greater business for suppliers. During the year ended December 31, 2014, our customers purchased approximately $504 million in goods and services through our program.
Deep expertise in strategic procurement. Our supply management team has deep expertise in strategic sourcing, contract and price negotiation, supplier selection and supplier management. Our customers gain the benefit of this experience and expertise, allowing them to focus on their core business while we optimize their procurement. In the same way, our expertise benefits suppliers who access customers that they otherwise may not reach.
Seamless integration. Our cloud-based procurement solutions are delivered entirely using our OneConnect transaction engine, the same interface platform that supports our cloud-based financial process automation solutions. Our platform allows importing and exporting of file formats, primarily EDI and XML, from suppliers and customers. This translates every procurement transaction into standardized data that is transmitted into the relevant system in real-time, enabling fast connections and virtually seamless integration with legacy information systems.
Enhanced user experience. Our procurement solutions customers and suppliers input and process their transactions through our financial process automation platform, allowing purchasers the benefit of a comprehensive buyer's guide, workflow improvement tools and automated spending analysis in addition to our procurement benefits. We believe purchaser and supplier user experiences are intuitive and accessible to novice users with minimal training.
89
In addition, our procurement solutions provide the following key benefits specific to purchasers:
Enhanced access to supplier network. Our purchasers gain access to more than 5,000 dealers and distributors for over 135 suppliers using our solutions. We believe that our aggregation and direct relationship with suppliers gives our purchasers access to more, and in many cases different, suppliers than they could reach if they operated individually.
Management of suppliers. Under the group purchasing framework, we negotiate pricing levels on behalf of all clients, manage all aspects of the supplier-customer relationship, and advocate on behalf of all of our purchasers. Since we manage purchases directly, our customers can reach all of their suppliers with a single point of sale and invoice. As a result, purchasers greatly simplify the myriad of complex supply relationships.
Our procurement solutions also provide the following key benefits specific to suppliers:
Enhanced access to purchasers. We assume credit responsibility for customers purchasing through our system and guarantee timely payment to suppliers. As a result, we enable suppliers to reach customers that they may not otherwise engage with because their purchasing volumes were too small to justify the expense of completing that supplier's new customer intake process.
Enhanced management of credit risk. Our assumption of the credit risk also takes the credit and collections monitoring burden off of the supplier, allowing them to serve more customers and focus on their core operations.
Asset management solutions
Our asset management solutions provide data-driven strategic planning, asset acquisition, asset financing and asset utilization alternatives that aim to lower total cost of capital asset ownership. Although our asset management solutions are presently focused on the transportation industry, we believe they have application across a variety of industries with similar needs. Our asset management solutions provide the following key benefits:
Data-driven asset management strategy. Utilizing our proprietary technology platform and deep transportation industry expertise we are able to provide businesses with analyses of their current asset usage and suggest alternative strategies, allowing businesses to gain operational leverage by lowering the total cost of ownership for capital equipment and benefit from transitioning operational expenses into fixed costs based on a long term asset management and utilization strategy that we have designed and helped the business implement.
Lower asset acquisition costs and optimum resale gains. When capital equipment is identified and specified properly by an acquirer, and is part of an overall asset lifecycle strategy, companies benefit from lower asset acquisition costs, and can also dispose of their assets at the optimal time to ensure the highest possible proceeds. Additionally, we actively enter into agreements with financial institutions to purchase certain assets at the end of lease terms helping to facilitate a larger resale market.
Deep domain expertise in asset management and regulatory compliance. Our team of highly experienced asset management employees has deep expertise in all facets of fleet management, including parts and service procurement, maintenance, asset lifecycle costing, leasing, regulatory compliance, sales of equipment, and dedicated contract carriage. Our established relationships with some of the country's largest lenders allow us to provide advice and access strategic financing for our customers for the lifecycle of capital assets. Our asset management experts also have deep knowledge of asset regulations and mandates to ensure fleets are in compliance with regulations enabling maximum asset operability.
90
Our asset management and finance solutions are an important element to our overall business model, as it often provides access to customers at an early stage before they may need financial process automation or procurement solutions. Furthermore, our experience with asset management and finance solutions in the transportation industry in particular has historically helped to increase our market profile and to establish credibility and trust with prospective customers, further establishing our offerings as an end-to-end solution suite.
Our strengths
We believe that we are well-positioned to benefit from the transformations occurring in the business-to-business transaction market, including the growing trend toward system-wide automation. Our key competitive strengths include:
End-to-end solution suite. Our financial process automation solutions are designed to cover the treasury and accounts payable functions for businesses, allowing us to be a full-service solution for our customers. Our accounts payable solution is designed to support the full source-to-payment procurement cycle, including purchase order requisitioning, e-invoicing, outsourced scan and capture, workflow visibility, automatic matching functionality, check request approval and e-payment processing. Our accounts receivable solution is designed to address the full order-to-cash revenue and sales cycle with a paperless conduit among suppliers, customers and buying groups. Our procurement and asset management solutions assist in managing the procurement and full capital asset purchase and use cycle needs of our customers.
Highly scalable, proprietary technology. Our technology is designed to monitor for exceptions and minimize the need for attention by personnel except in the most complicated, unusual circumstances. Our infrastructure has the flexibility to support growth in transaction volume and onboarding of large, new transaction processing customers with low incremental operating cost and capital investment. For example, in 2013, we added a new network of over 700 suppliers, all of whom are Daimler parts dealers. Since December 31, 2012, our financial process automation and procurement solutions transaction volume has increased from $3.4 billion to $12.2 billion, or 259%, and the number of transactions has increased from 2.7 million to 9.2 million, or 241%, without the need for substantial capital expenditures or significant changes to our technology infrastructure to support the increased demands on our solutions. This increased demand was primarily due to the addition of a new network of over 700 suppliers, all of whom are Daimler parts dealers, in February 2013.
Powerful network effect. We are intimately involved in our clients' financial and operational processes. Our suite of products and services are a critical component of our clients' cost management and operational improvement initiatives. Our platform electronically connects businesses with their entire community to make the exchange of documents among suppliers, vendors, dealers and their customers seamless and cost-effective. As our networks of purchasers and suppliers grow, they become more powerful and mutually reinforcing, thus driving significant benefits to all participants in our ecosystem, increasing the value of our networks and helping sustain our growth. Additionally, many vendors and dealers participate in multiple network subgroups within our CorConnect community, making it increasingly useful for them to benefit from the efficiencies of our OneConnect integration.
Strong customer retention. We focus extensively on ensuring that customers achieve maximum benefit from our solutions, and we frequently engage with our customers to continue improving our software to meet their needs. As an illustration, 96% of our top 100 financial process automation and procurement solutions customers in 2012 made purchases from us in the nine month period ended September 30, 2015. We determined our top 100 financial process automation and procurement solutions customers based on our customers' overall gross transaction volume in dollars in 2012.
91
Deep domain expertise. We have deep domain experience spanning nearly 20 years. Our senior management's deep experience in our solution areas and industry verticals allows us to effectively navigate the challenges of our business while maintaining a consistent corporate presence internally and externally. Reflecting our leadership and expertise in the transportation industry, approximately a third of North America's 100 largest private trucking fleets utilize one or more of our financial process automation, procurement or asset management solutions.
Highly visible business model. Our transaction-based model with volume minimums for our financial process automation solutions and consistency of customer transaction levels year-over-year for our procurement solutions provide strong visibility of future revenue, enhancing our ability to effectively manage our business. This visibility is enhanced by the ingrained nature of our financial process automation and procurement solutions. Over time, our customers rely on our solutions, making any transition to another platform a lengthy process. In addition, our asset management solutions customers are frequently party to multi-year leases if we provide financing. This visibility and stability, combined with the diversity of our three lines of business and the loyalty of our customers, provides a strong and visible business model.
Our growth strategy
We intend to continue to expand our position as a provider of cloud-based financial process automation, technology-enabled procurement solutions, and knowledge-driven asset management solutions. To accomplish this, we are pursuing the following growth strategies:
Selectively expand into new markets. We intend to continue to selectively expand into new markets in which we can leverage our domain expertise. For example, we successfully established a presence in the manufacturing market because vehicle dealer networks are adjacent to, and have similar connectivity characteristics as, the transportation market. We continue to identify expansion opportunities in industries lagging in the adoption of paperless solutions for processes such as procurement and billing. As we identify potential markets, we will continue to develop industry expertise to match our expertise in the transportation industry.
Further penetrate our existing markets. We will continue to focus our efforts on acquiring new customers in our largest customer segment, transportation, as well as building our customer base of equipment manufacturers and distributors. We intend to do this by investing in sales and marketing to increase our profile within the transportation industry, while also increasing our emphasis on customer acquisition opportunities in adjacent industries, such as the manufacturing and industrial markets. We intend to expand our direct sales force to augment our current marketing efforts. We believe this will improve our sales coverage and effectiveness, enabling us to acquire new clients. We will continue to pursue additional strategic relationships wherever it enhances the value proposition for our suppliers and customers. We believe that there is substantial opportunity to expand our business as adoption of business-to-business technology platforms continues to increase.
Capitalize on cross-selling opportunities. We believe that there is substantial opportunity within our existing base of over 2,250 customers to cross-sell additional solutions, given that during the fiscal year ended December 31, 2014, only 9% of our customers purchased more than one of our solutions. For example, customers often begin using our procurement solutions to purchase truck tires but they soon expand their purchases beyond tires to include other equipment. The same customers might further benefit from implementing our financial process automation solutions. As we expand our product capabilities to include additional features, we believe customers will perceive and derive even greater value from our platform and expand their use in the future.
Leverage our technology offerings. We believe that we have developed a deep understanding of the challenges faced by both our customers and our suppliers in the transportation and manufacturing markets, and we continue to collaborate with them to build functionality to address their needs
92
and requirements. Investing in the development of our software solutions is an integral part of our long-term growth strategy and has been a key factor in solidifying our position as a leader in our market. This investment in our software solutions, expansion of our procurement capabilities and development of new applications, features and functionality will allow us to expand our addressable market across other verticals.
Selectively pursue acquisitions. Although we do not currently have specific acquisition targets identified, we may pursue acquisitions of businesses, technologies, and solutions that complement our existing offerings in an effort to accelerate our growth, enhance the capabilities of our existing solutions, and broaden our offerings. We also may pursue acquisitions that allow us to expand into new industries or geographies where we do not currently have a significant presence. We have a history of successfully integrating acquired businesses that have transformed our original business over time into its current form. For example, we acquired Corcentric in 2002, NationaLease Purchasing Corporation in 2006, and both CURE Leasing and Maintenance and COR360 in 2010.
Our products and services
We have developed a diverse mix of products and services to address issues with financial processes, procurement and asset management for companies in many industries. By developing our products and services over time around our customers and suppliers, we are able to offer our solutions in an á la carte format for customers to realize specific, applicable value from each of our offerings. Our products and services consist of the following:
Financial process automation
We deliver our financial process automation solutions via two products:
- •
- CorConnect. Our closed loop business-to-business commerce
solution that utilizes our proprietary transaction engine to enable multiple trading partners in a business-to-business network to automate, streamline, and manage complex transaction processes such
as credit management, order management, billing, receivables, collections, and dispute management on one platform; and
- •
- COR360. Our easy-to-use, cloud-based accounts payable automation platform that automates the invoice approval process.
CorConnect
Our CorConnect solution takes the cost, friction and risk out of the order-to-cash payment process for companies with disparate distribution channels. CorConnect provides a closed-loop private commerce network that connects the entire ecosystem—suppliers, dealers, distributors and purchasers—to an electronic network regardless of their internal systems. This network enables participants to transact quickly and accurately without the use of paper, which saves time and reduces the likelihood of errors. CorConnect abstracts key transactional elements, such as invoices, purchase orders, advanced shipping notices and delivery notes, from the systems of record that create them. CorConnect customers can also take advantage of invoice payment by CorConnect. CorConnect eliminates the
93
supplier's credit risk, as we pay the supplier on behalf of the customer, and take responsibility for billing and collection with those customers.
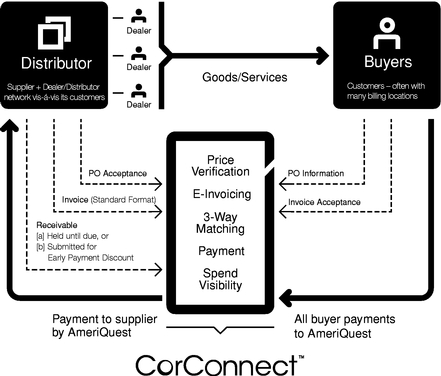
CorConnect's technology provides the following key features to users:
OneConnect transaction engine. Enables fast and seamless connections among trading partners by turning every trading network transaction into standardized data instantly transmitted into the relevant system. Our technology enables us to import and export a variety of file formats (e.g., EDI, XML or flat file) using a number of file delivery methods, such as FTP and web services. For example, a customer can send us data in certain file formats and our technology instantly converts that data and sends it to the supplier in the file format that it prefers.
Business intelligence. Enables line item detail on every transaction processed through the system, providing detailed business intelligence, analytics and reporting.
Order management. Enables purchase orders, acknowledgments and shipping documents to be exchanged electronically. Via the platform both buyers and suppliers are able to gain visibility into order fulfillment and shipment status. For example, users can log on to track shipments at each stage of the order process: when the order is logged, when the order is shipped and when the order is delivered.
E-invoicing. Fully automates the invoice capture and receipt process through direct integrations with supplier ERP systems. Invoice data down to the line item detail level flows directly from the supplier to the customer's workflow or back-office system without any manual intervention.
Price file management. CorConnect automates labor intensive price file management processes to ensure trading partners receive accurate and validated pricing for their products.
Invoice workflow and matching. Enables customers to streamline their invoice processing with electronic three-way matching of purchase orders, advanced shipping notice or receipt of goods, and invoices by using automated workflows.
Electronic payment and remittance processing. Provides payment facilitation and electronic payment and processing.
94
In addition to the software-based features, our CorConnect customers also have access to our customer service team. Our team provides outsourced credit services to manage the credit risk for accounts receivable. Our accounts receivable outsourcing options are available to participating suppliers, distributors and dealers, enabling them to unlock working capital, support additional sales growth and receive timely, guaranteed payment on receivables.
COR360
We believe our COR360 accounts payable solution eliminates paper and has the capability to automate an entire accounts payable department, without compromising customers' business requirements or creating IT hassles.
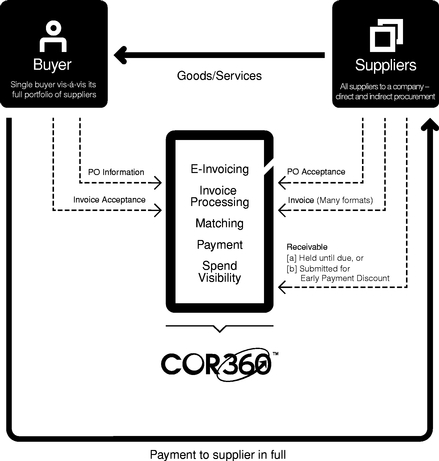
COR360's purchase-to-pay solution includes:
Electronic purchase order and workflow solutions. Purchase order requisition technology enables customers to generate electronic purchase orders and route them online for approval using our proprietary routing technology. Upon approval, purchase orders can be electronically invoiced from suppliers directly through COR360 for an efficient, paperless process.
Electronic invoice delivery. Electronic invoicing eliminates the paper trail by providing suppliers with a comprehensive network for remitting e-invoices. COR360 also offers a comprehensive, fully-integrated invoice virtualization solution for paper-based invoices. Our third-party Invoice Virtualization Centers provide electronic invoice conversion services such as scanning and optical character recognition data capture.
Invoice workflow and matching. COR360's automated workflow software delivers the benefits of configurable invoice approval routing and automated three-way invoice matching, while eliminating
95
the hassle of managing paper-based invoices. With the COR360 purchase order matching process, invoice data is completely electronic and can be matched to the purchase order and receipt of goods to complete the three-way match. Our invoice automation solution allows invoices to be received electronically, indexed, and stored in a centralized repository, then routed electronically to the appropriate party for approval based on customizable business rules.
Enterprise Resource Planning system integration. COR360 integrates with any accounts payable system, enterprise resource planning connector, or accounting system. Once an invoice is matched or approved within COR360, all the requisite invoice data for matching and payment is integrated electronically to any ERP or accounts payable system using our proprietary connector technology.
Automated Clearing House payment automation solutions and check mailing services. COR360 provides both formatting and, using a third-party provider, delivery of Automated Clearing House, or ACH, payments to banks, and provides legacy check printing services for suppliers who cannot accept ACH payments for maximum efficiency in the supplier payment handling process.
Our COR360 service team assists our customers by onboarding their suppliers. Our team advises customers on operational changes that they can undertake to fully realize the benefits of our technology, recommends accounts payable best practices and consults on regulatory compliance.
Procurement solutions
Our procurement solutions enable organizations to realize the benefits of procurement solutions by identifying and establishing contracts with suppliers, aggregating the collective purchasing power of all participating customers, driving spend to those contracts, and promoting process efficiencies through electronic transactions.
During the year ended December 31, 2014, we aggregated the purchasing power of more than 1,400 of our procurement customers in order to offer pricing that we believe is comparable to large national enterprises, while also allowing us to work locally with dealers. We have developed our own collaborative relationships with hundreds of national vendors, allowing them to offer our customers competitive pricing. This allows businesses, regardless of size, to benefit from high-volume purchasing power in an increasingly aggressive business environment. Procurement programs are available for both capital and non-capital expenditures. Our portfolio of contracts is designed to offer customers a flexible solution to achieve the best pricing available. We negotiate and execute contracts on behalf of participants in our network and make such contracts available to them. We also provide customers with access to the latest spend management tools to strategically manage their purchasing decisions. Customers are able to analyze trends and forecast needs to more efficiently manage their procurement spend.
Asset management solutions
Our asset management solutions provide a comprehensive menu of data-driven fleet management services including equipment selling, asset planning and financing, and leasing and maintenance services to lower a company's total cost of ownership. Our solutions are offered through our AmeriQuest and CURE brands. Our services are focused towards commercial truck fleet operators but have applications across a variety of industries.
Financing, fleet management and sales of equipment
We coordinate cost-effective financing programs that best suit each customer's budget, forecast and goals. By partnering with some of the country's largest lenders, we are able to arrange flexible financing at competitive rates. Before implementation of our solutions, we perform an in-depth analysis of the customer's asset finance needs based on historical data. Our experts look at a wide range of factors including acquisition costs, utilization patterns, maintenance expenses and fuel. We also facilitate the
96
planning, marketing, and execution of inventory divestitures using our extensive database of qualified buyers.
CURE Leasing and Maintenance
We provide financing and maintenance services to companies using independent contractors as part of fleet transportation programs. We offer comprehensive programs that assist with the inherent separation between the carrier and independent contractor while also delivering valuable cost savings and efficiencies through our procurement programs.
Our customers
During the year ended December 31, 2014, we served more than 2,250 customers across all of our solutions.
Financial process automation solutions customers
As of December 31, 2014, we had more than 650 financial process automation solutions customers. 67 of these customers were associated as dealers for a single direct customer. In addition, approximately 592 customers were associated as dealers for five other direct customers. During the years ended December 31, 2012, 2013 and 2014, our top five financial process automation solutions customers comprised 36%, 53% and 51%, respectively, of our gross financial process automation solutions gross transaction volume. In the year ended December 31, 2012, no financial process automation solutions customer represented more than 10% of our revenue. In each of the years ended December 31, 2013 and 2014, only one financial process automation solutions customer network, the Daimler network, represented more than 10% of our revenue. Daimler represented 12.6% and 13.5% of our total revenue and 45% and 47% of our financial process automation revenue in the years ended December 31, 2013 and 2014, respectively.
We have many types of customers of varying sizes, such as equipment and equipment parts distributors, resellers, and retailers; telecommunication companies; group purchasing organizations; supply chain management companies; financial services firms; and various other service organizations. Our customers come from many different industries, such as transportation, manufacturing, retail, healthcare, financial services, telecommunications, media and entertainment, and energy. As of December 31, 2014, our financial process automation solutions were utilized by Fortune 500 companies, as well as small and medium businesses.
Procurement solutions customers
During the year ended December 31, 2014, we had approximately 1,400 procurement solutions customers, none of which represented a significant percentage of total revenue in each of the years ended December 31, 2012, 2013 and 2014. Our procurement solutions are utilized by companies of all sizes from a variety of industries.
Asset management solutions customers
During the year ended December 31, 2014, we served more than 240 asset management solutions customers. In each of the years ended December 31, 2012 and 2013, no asset management solutions customer represented more than 10% of our revenue for that year. In the year ended December 31, 2014, one asset management solutions customer represented more than 10% of our revenue for that year. As of December 31, 2014, our asset management solutions were utilized by several Fortune 500 companies as well as small and medium businesses.
97
Customer case studies
The following examples illustrate how our customers use our solutions:
Daimler Trucks North America—Financial process automation solutions optimize parts business for major manufacturer
Daimler is the largest heavy-duty truck manufacturer in North America and a leading producer of medium-duty trucks and specialized commercial vehicles. Daimler manufactures, sells, and services several renowned commercial vehicle brands under the Freightliner, Western Star, Detroit, and Thomas Built Buses nameplates. Daimler's National Account parts division provides billing and support services to small, regional, and national fleets. As the fleet parts business continued to grow, they realized they needed a more robust technology solution to provide a higher level of premium support to its hundreds of dealers and customers, with more than 11,000 locations nationwide.
Realizing that a higher level of digital expertise was needed to manage their extensive parts business, Daimler looked to our CorConnect product to provide a private commerce platform to transform their billing and support services across their dealer network and customers. CorConnect's transaction engine, OneConnect enables more than 15,000 unique connections between the dealers' and buyers' ERP and point of sale systems. By normalizing hundreds of types of data formats across the business network and turning that data into a digital format, CorConnect transformed Daimler's billing and support network, so they could focus on providing premium support to their fleet customers.
Daimler reports that our CorConnect solution platform has provided a number of benefits, including the ability to sign new customers, which might not have been possible otherwise, an improvement in customer retention, and the re-engagement of several previously inactive, major accounts that were willing to participate in a new industry-leading technology platform. Less than two years after the CorConnect implementation, Daimler experienced significant processing efficiency gains and saw a dramatic decrease in invoice disputes, with no additional overhead needed to accommodate its increased parts business. Our CorConnect solution provides access to year-over-year data by customer and location, so Daimler can now identify customer trends and patterns, enabling them to forecast spend, develop strategic marketing initiatives, and assess inventory by dealer. CorConnect also assumes the credit risk of Daimler's customers by paying Daimler for their customers' purchases prior to CorConnect receiving payment from the customers. This has increased the payment speed to its dealers and eliminated the need for Daimler to seek payment from delinquent purchasers.
University of Florida—Financial process automation solutions streamline a major university
The University of Florida, or the University, is a major, public university serving more than 50,000 students on a 2,000-acre campus that houses more than 900 buildings, including 170 with classrooms and laboratories. In 2012, the University set out to find an option to streamline the vendor payment process. The University receives 180,000 invoices per year from 50,000 vendors, many of them one-time vendors, including students and employees who needed reimbursement for out-of-pocket expenses. University departments were receiving vendor invoices, reviewing and approving invoices for payment, creating vouchers in the University enterprise resource planning system, and filing hard copies of the invoices. Inefficiencies in this process were costly to the University and did not allow the University to effectively manage the payables process.
The University turned to our COR360 product to solve their problem because it is cloud-based and easy to use. We helped the University set up a best-in-class, automated accounts payable system that includes a vendor portal, e-invoicing, optical character recognition scanning technology and automated workflows for authorized staff members. Within weeks of the implementation, the University had transformed its accounts payable processes. Some of their biggest vendors send 2,000 to 3,000 invoices a week. Before transitioning to COR360, the process of scanning the invoices and inputting
98
them into the accounting system was completely manual. The invoices are now received electronically, reducing the error rate, and eliminating the paper. In addition, the information is getting into the system in a more timely manner, which allows the University to take better advantage of early payment discounts.
Dot Transportation—Financial process automation solutions and procurement solutions help major food redistributor
Dot Transportation, Inc., or Dot Transportation, is the transportation arm of the largest food redistribution company in the United States. Dot Foods offers more than 105,500 products which are primarily delivered by Dot Transportation in less-than-truckload, or LTL, quantities to distributors in all 50 states. Dot Transportation manages a complex supply chain that stretches from coast to coast. For an organization of its size, simplifying operations and keeping costs down are essential to success. Since 2002, we have helped Dot Transportation achieve both with a range of solutions that support the unique needs of their organization as it evolves and grows.
Our flexible, menu-driven service model enabled Dot Transportation to select two service areas that delivered maximum value and impact: procurement solutions and financial process automation solutions. In 2002, Dot Transportation asked us to help them optimize the return on their investment in tires and other business essentials. By looking at the lifetime value of these materials and selecting top-tier products in certain cases, we recommended products that save Dot Transportation money, on tires and retreads, hardware, truck parts and supplies, batteries, cleaners and solvents, and forklift wheels and tires. In addition to finding high-quality products at compelling prices, we also gave Dot Transportation access to greater negotiating power. With the pooled resources of 1,400 organizations, we can leverage stronger buying power to realize greater savings for each member organization.
Our streamlined, automated solution helps Dot Transportation ensure that every Dot Transportation location is complying with its purchasing program and buying the right products at the right price. Our solution gives Dot Transportation consistent products, as well as consistent purchase pricing, invoicing and billing at every location.
Cardinal Logistics—Asset management solutions help customer manage a major fleet merger
Cardinal Logistics Management Corporation, or Cardinal Logistics, manages one of the largest, most diverse dedicated truck fleets in the United States and delivers a range of services to move products along the supply chain, including dedicated contract carriage, bulk transport, home/jobsite delivery, life science logistics, temperature control, transportation management, warehousing and distribution, supply chain consulting, and technology solutions. Cardinal Logistics has been a customer since 2004, using our asset management solutions and procurement solutions. This ongoing relationship led them to turn to us again in 2013 to help implement a significant acquisition.
In February 2013, when Cardinal Logistics completed a major merger, it faced the challenge of managing nearly triple the amount of equipment it had previously managed. Cardinal Logistics turned to us to analyze their fleet from mileage to fuel economy to lender payouts and analyze the opportunity for more efficient fleet management. With access to comprehensive, industry-wide benchmark data, we were able to run a deeper analysis of all the variable expenses, verify Cardinal Logistics' assumption that they could improve their fleet planning, and quantify the potential savings. In addition to providing them with critical market intelligence, Cardinal Logistics benefited from the collective buying power of our 700,000 vehicle network. We helped them to negotiate a more favorable buy-out with Cardinal Logistics' leasing company. Finally, the deal we brokered helped Cardinal save 8 cents per mile on maintenance costs alone. At 100,000 miles per unit, that translates to a savings of $8,000 per unit on an 80-unit fleet.
99
Sales and marketing
We primarily rely on sales representatives focused on selling our various solutions often in particular geographic regions. As of September 30, 2015, our sales team consisted of 84 employees. In addition, we utilize a robust inbound marketing strategy to generate new leads, including collaborating heavily with our suppliers to leverage their existing sales forces and seek referrals. Our sales team is also responsible for identifying cross-selling opportunities across our range of products and services.
We utilize a marketing strategy that includes promoting brand advocacy in addition to traditional marketing methods. We utilize a variety of channels to communicate brand messaging and build relationships with customers. Our digital strategy includes social media, inbound marketing, blogs and our own website. We also use additional methods to appeal to customers including public relations, conferences and tradeshows, direct marketing and trade publications.
We promote several of our offerings through joint partnerships with the Food Marketing Institute, Snack Food Association, GRM Information Management Systems, Inc., Iron Mountain Incorporated, and BillZap, Inc.
Our competition
We operate in several intensely competitive markets, often characterized by change and innovation. We believe that we generally compete favorably with our competitors because of the features and performance of our various offerings, the ease of integration of our solutions with the technological infrastructures of our customers and suppliers, our willingness to provide financing and credit risk management services to customers, our domain expertise, and the incremental return on investment that our platform offers to our customers.
Our competition includes:
- •
- financial automation solution firms such as MultiService Technology Solutions Inc., Genpact Limited, Ariba Inc. (a
subsidiary of SAP), Basware Corporation, Bottomline Technologies, Inc., Kofax Limited (a subsidiary of Lexmark International, Inc.), SciQuest, Inc. and ReadSoft AB (a subsidiary of
Lexmark International, Inc.);
- •
- existing manual, paper and spreadsheet-based systems that corporate personnel employ to manage their financial, procurement, and asset
management processes;
- •
- small and large companies that offer point solutions that compete with some of the features present in our platform, such as product
suppliers and distributors or banks, leasing companies and other institutions that provide financing solutions; and
- •
- fleet management providers such as Ryder Fleet Management Solutions.
Our technology, operations, and development
Technology
Our CorConnect accounts receivable automation platform utilizes our OneConnect transaction engine to enable multiple trading partners in a network to automate, streamline, and manage complex transaction processes on one platform. Our systems can accommodate the transmission of transactions in numerous ways, most notably e-invoicing. Our OneConnect transaction engine specializes in handling the electronic transmission of documents in EDI or XML format.
Our cloud-based solutions are designed to scale rapidly to support additional new subscribers through the addition of incremental commodity processing and storage hardware. This architecture flexibility allows us to sustain high levels of uptime without degradation of system performance despite significant subscriber growth. Our existing architecture and infrastructure has been designed with
100
sufficient capacity to meet our current and anticipated future needs. Furthermore, customer data is stored in separate databases to help ensure data confidentiality among customers.
We are standardized on Microsoft .NET frameworks and write the majority of our software in industry-standard software programming languages, such as C# and VB.NET. We use technologies, such as AJAX, extensively to enhance the usability, performance and overall user experience of our solutions. Microsoft SQL Server software is deployed for our relational database management system. Apart from these and other third-party industry standard technologies, our solutions have been specifically built and upgraded by our in-house development team.
Operations
We house our production systems in a hosting facility located in Virginia. This is the primary site where all data processing takes place, and where our customer-accessible websites are hosted. We house a disaster recovery site in a hosting facility located in Pennsylvania. Both facilities have Internet connectivity to multiple backbones, utilize guarded and restricted access, advanced monitoring and numerous other redundant services.
We also utilize an infrastructure-as-a-service provider for certain processes, which provides similar redundancy and security benefits to our facilities noted above. We expect to migrate several of our customers onto this infrastructure in the coming year, giving us additional flexibility to scale our operations for geographic and performance purposes.
All of our implementations are performed in-house, and we work with our customers to clearly understand their business needs in order to ensure a rapid deployment. Our implementations do not require our customers to install anything on site since we offer cloud-based solutions. When integrating with our customers' trading partners, we utilize our OneConnect Transaction Engine to accommodate their needs. We enable our customers to outsource any necessary technical integration work to us.
Software development
The responsibilities of our software development team include product management, product development, quality assurance and technology operations for our COR360 and CorConnect solutions. We invested $1.5 million, $3.6 million, $5.0 million, $3.8 million and $4.5 million during the years ended December 31, 2012, 2013 and 2014, and nine months ended September 30, 2014 and 2015, respectively, in our software development, of which we capitalized internal software costs. Our primary software development teams are based in Virginia and New Jersey.
Intellectual property
Our intellectual property rights are important to our business. We rely on a combination of copyright, trade secret, trademark, and, to a lesser degree, patent rights in the United States and other jurisdictions, as well as confidentiality procedures and contractual provisions to protect our proprietary technology, processes and other intellectual property. We own one issued U.S. patent that expires in May 2019.
We also license technology from third parties. We believe our license agreements for third-party software and other intellectual property are generally consistent with industry standard terms and conditions. We integrate third-party software and other intellectual property to develop and provide our solutions.
Although the protection afforded by copyright, trade secret, trademark and patent law, written agreements and common law may provide some advantages, we believe that the following factors help us to maintain a competitive advantage:
- •
- the technological skills of our software development team;
101
- •
- frequent enhancements to our solutions; and
- •
- continued expansion of our proprietary technology.
We generally enter into confidentiality and other written agreements with our employees, consultants and partners, and through these and other written agreements, we attempt to control access to and distribution of our software, documentation and other proprietary technology and other information.
We also own eleven registered U.S. trademarks and four pending U.S. trademark/service mark applications. Those trademarks primarily relate to the AmeriQuest name, logos and slogan and the COR360, CORCENTRIC and CORCONNECT solutions.
We own over 50 domain registrations that are used in connection with our business presence on the Internet.
Customer service and support
We provide customer support as part of our software. Our internal teams are proactive and contact our customers by phone to help them utilize additional features of our solutions and answer questions. Additional assistance is available via phone or email. We believe the high level of support we provide is a critical component of our customers' satisfaction. In addition to our proactive communication and support capabilities, we engage in periodic feedback sessions with our customers. We recently began a COR360 user group meeting at our annual customer symposium.
Employees
As of September 30, 2015, we had 227 full-time employees. Of that total, 54 were based in our Cherry Hill, New Jersey headquarters, 35 were based in Downers Grove, Illinois; and the remaining were in our various offices in Florida, Georgia, New Jersey, Tennessee and Virginia. By department, 84 were in sales and marketing, 30 in product development, 40 in technology operations, 46 in operational support services and 27 in general and administrative. None of our employees is represented by a labor organization or is a party to any collective bargaining arrangement. We have never had a work stoppage or an employee layoff, and we consider our relationship with our employees to be good.
Facilities and property
Our corporate headquarters is located in Cherry Hill, New Jersey, where we currently lease approximately 12,915 square feet of office space for a term expiring in January 2017. We lease approximately 9,290 square feet of office space in Downers Grove, Illinois under a lease agreement that expires in December 2023. We also lease facilities for our employees in Florida, Georgia, New Jersey, Tennessee and Virginia.
We anticipate leasing additional office space in all short- and medium-term future periods to support our growth. We intend to further expand our facilities or add new facilities as we add employees and enter new geographic markets, and we believe that suitable additional or alternative space will be available as needed to accommodate any such growth. However, we expect to incur additional expenses in connection with such new or expanded facilities.
Legal proceedings
From time to time, we may become involved in legal proceedings in the ordinary course of our business. We are not presently a party to any legal proceedings that, if determined adversely to us, would individually or in the aggregate have a material adverse effect on our business, operating results, financial condition or cash flows.
102
Executive Officers and Directors
The following table sets forth certain information regarding our executive officers and directors as of December 31, 2015:
Name
|
Age | Position(s) | |||
|---|---|---|---|---|---|
Executive Officers: |
|||||
Douglas Clark |
73 | President, Chief Executive Officer, Class I Director and Chairman of the Board | |||
Mark Joyce |
45 | Executive Vice President and Chief Financial Officer | |||
James Guice |
69 | Executive Vice President | |||
Non-Employee Directors: |
|||||
John Gavin(1)(2)(3) |
59 | Class II Director | |||
Brian J. Hogan |
54 | Class III Director and Lead Director | |||
Kirk Tilley(1)(3) |
51 | Class II Director | |||
Thomas Brown(2)(3) |
70 | Class I Director | |||
Michael Enright(1)(2) |
51 | Class III Director | |||
- (1)
- Member of the audit committee.
- (2)
- Member of the compensation committee.
- (3)
- Member of the nominating and governance committee.
Executive officers
Douglas Clark has served as a member of our board of directors since December 1996, as our President and our Chief Executive Officer since January 1997 and chairman of our board of directors since December 2015. Mr. Clark received a bachelor of arts degree in accounting from the University of Miami and a master of business administration degree from Drexel University. We believe Mr. Clark is qualified to serve as a member of our board of directors because of his extensive background in business management, his role as founder, President and Chief Executive Officer of our company, and his years of service on our board of directors.
Mark Joyce is our Executive Vice President and Chief Financial Officer. He has held those positions since December 2006. He previously served in various financial roles, including chief financial officer, at NationaLease Purchasing Corporation from 2001 to 2006. Mr. Joyce received a bachelor of science degree in business administration from John Carroll University and a master of business administration degree from DePaul University. Mr. Joyce is a licensed certified public accountant in the State of Illinois and is a member of the American Institute of Certified Public Accountants.
James Guice is our Executive Vice President, a position he has held since April 2004. Prior to joining us, Mr. Guice served as chief executive officer for TEAM Vehicle Sales, a used truck, tractor, and trailer sales organization. Mr. Guice received a bachelor of arts degree in business and technology from Eastern Kentucky University.
Non-employee directors
John Gavin has served as a member of our board of directors since December 2012. Mr. Gavin is a Senior Operating Advisor with LLR Partners, a private equity firm, which he joined in 2010. Prior to LLR Partners, Mr. Gavin was the chief executive officer and president, and then vice chairman, of Drake Beam Morin, Inc., a career management and transitions management firm, from 2006 to 2010. From 1996 to 2004, Mr. Gavin was president and chief operating officer of Right Management Consultants, a provider of integrated consulting solutions across the employment lifecycle. Prior to
103
joining Right Management, Mr. Gavin was a Partner at Arthur Andersen & Co, an international accounting and management consulting firm, where he was employed from 1979 to 1996. Mr. Gavin currently serves on the boards of directors of SDI, Inc. (as chairman), GMS, Inc., Careerminds (as chairman) and PSAV, Inc. Mr. Gavin holds a bachelors of business administration degree in accounting from Temple University. We believe that Mr. Gavin is qualified to serve on our board of directors because of his extensive management and operational experience, his current and prior service on the board of directors of other publicly and privately held companies, and his financial and accounting experience, including his experience as a certified public accountant with a nationally recognized public accounting firm and his service on the audit committees of other publicly held companies.
Brian J. Hogan has served as a member of our board of directors since January 1997. Since 1986, he has served as an officer of, and since 1990, as president and chief executive officer of, Hogan Truck Leasing, Inc., a full-service truck leasing and transportation company. Mr. Hogan also serves as a director of Western Refining, Inc., a publicly-traded independent crude oil refiner and marketer of refined products. In addition, Mr. Hogan serves as a board member of Parkside Bank and Trust, on various transportation and leasing industry professional association boards, and on various charitable organization boards. Mr. Hogan received a bachelor of science degree in accounting and finance from the University of Arizona. We believe that Mr. Hogan is qualified to serve as a member of our board of directors because of his business, financial management, and leadership experience, as well as his years of service on our board.
Kirk Tilley has served as a member of our board of directors since January 2007. Mr. Tilley is the co-president of Tandet Management Inc., a transportation-focused investment company and parent company of the Tandet Group of companies, or the Tandet Group, a position he has held since 2001. From 1988, Mr. Tilley has held various leadership positions at The Tandet Group. Mr. Tilley received a bachelor's in physical education in science and kinesiology from McMaster University. We believe Mr. Tilley is qualified to serve as a member of our board of directors because of his business management experience and his past service on our board of directors.
Thomas Brown has served as a member of our board of directors since March 2015. Mr. Brown was previously a member of our board of directors from March 2010 to December 2014. Mr. Brown has served as the president and chief executive officer of Brown NationaLease since 1968. Mr. Brown is a member of various transportation and leasing industry professional associations. Mr. Brown received a bachelor of arts degree in economics from Cornell College. We believe Mr. Brown is qualified to serve as a member of our board of directors because of his business, financial management and leadership experience and his years of service on our board of directors.
Michael Enright has served as a member of our board of directors since March 2015. Mr. Enright serves as vice president of financial planning and analysis for NBTY, Inc., a manufacturer of vitamins and supplements, a position he has held since April 2014. From August 2001 through March 2014, Mr. Enright served in various positions at Campbell Soup Company, a publicly traded food manufacturer, most recently as vice president finance and strategy- Asia-Pacific division, a position Mr. Enright held from August 2001 through March 2014. Mr. Enright holds a bachelor of science degree in mechanical engineering from the University of Illinois and a master of business administration degree from the University of Chicago. We believe that Mr. Enright is qualified to serve as a member of our board of directors because of his business, financial management and leadership experience.
Board composition
Our business and affairs are managed under the direction of our board of directors. The number of directors is determined by our board of directors, subject to the terms of our certificate of incorporation and bylaws that will become effective upon the completion of this offering. Upon the
104
completion of this offering, our board of directors will consist of six members, divided into three classes serving staggered three-year terms. Upon expiration of the term of a class of directors, directors in that class will be eligible to be elected for a new three-year term at the annual meeting of stockholders in the year in which their term expires. As a result of this classification of directors, it generally takes at least two annual meetings of stockholders for stockholders to effect a change in a majority of the members of our board of directors. Our directors will be divided among the three classes as follows:
- •
- The Class I directors will be Douglas Clark and Thomas Brown, and their terms will expire at the annual meeting of stockholders
to be held in 2016;
- •
- The Class II directors will be John Gavin and Kirk Tilley, and their terms will expire at the annual meeting of stockholders to
be held in 2017; and
- •
- The Class III directors will be Michael Enright and Brian Hogan, and their terms will expire at the annual meeting of stockholders to be held in 2018.
Any increase or decrease in the number of directors will be distributed among the three classes so that, as nearly as possible, each class will consist of one-third of the directors.
Director independence
Upon the completion of this offering, our common stock will be listed on the NASDAQ Global Market. Under the rules of the NASDAQ Global Market, independent directors must comprise a majority of a listed company's board of directors within a specified period after completion of this offering. In addition, the rules of the NASDAQ Global Market require that, subject to specified exceptions, each member of a listed company's audit, compensation and nominating and governance committees be independent. Under the rules of the NASDAQ Global Market, a director will only qualify as an "independent director" if, in the opinion of that company's board of directors, that person does not have a relationship that would interfere with the exercise of independent judgment in carrying out the responsibilities of a director.
Audit committee members must also satisfy the independence criteria set forth in Rule 10A-3 under the Securities Exchange Act of 1934, as amended. In order to be considered to be independent for purposes of Rule 10A-3, a member of an audit committee of a listed company may not, other than in his or her capacity as a member of the audit committee, the board of directors, or any other board committee: (1) accept, directly or indirectly, any consulting, advisory, or other compensatory fee from the listed company or any of its subsidiaries; or (2) be an affiliated person of the listed company or any of its subsidiaries.
Our board of directors undertook a review of its composition, the composition of its committees and the independence of each director. Based upon information requested from and provided by each director concerning his background, employment and affiliations, including family relationships, our board of directors has determined that Messrs. Brown, Enright, Gavin and Tilley, representing a majority of our directors, do not have any relationships that would interfere with the exercise of independent judgment in carrying out the responsibilities of a director and that each of these directors is "independent" as that term is defined under the rules of the NASDAQ Global Market. In making these determinations, our board of directors considered the relationships that each non-employee director has with our company and all other facts and circumstances our board of directors deemed relevant in determining their independence, including the beneficial ownership of our capital stock by each non-employee director.
Board committees
Our board of directors has established an audit committee, a compensation committee and a nominating and governance committee.
105
Audit committee
Our audit committee consists of Messrs. Enright, Gavin and Tilley, with Mr. Gavin serving as chairman. In accordance with our audit committee charter, after this offering, our audit committee will: oversee our corporate accounting and financial reporting processes and our internal controls over financial reporting; evaluate the independent public accounting firm's qualifications, independence and performance; engage and provide for the compensation of the independent public accounting firm; approve the retention of the independent public accounting firm to perform any proposed permissible non-audit services; review our consolidated financial statements; review our critical accounting policies and estimates and internal controls over financial reporting; and discuss with management and the independent registered public accounting firm the results of the annual audit and the reviews of our quarterly consolidated financial statements. We believe that our audit committee members meet the requirements for financial literacy under the current requirements of the Sarbanes-Oxley Act of 2002, the NASDAQ Global Market and SEC rules and regulations. In addition, the board of directors has determined that Mr. Gavin is qualified as an audit committee financial expert within the meaning of SEC regulations. We have made this determination based on information received by our board of directors, including questionnaires provided by the members of our audit committee.
Compensation committee
Our compensation committee consists of Messrs. Brown, Enright and Gavin, with Mr. Enright serving as chairman. In accordance with our compensation committee charter, after this offering, our compensation committee will review and recommend policies relating to compensation and benefits of our officers and employees, including reviewing and approving corporate goals and objectives relevant to compensation of the Chief Executive Officer and other senior officers, evaluating the performance of these officers in light of those goals and objectives and setting compensation of these officers based on such evaluations. The compensation committee will also administer the issuance of stock options and other awards under our equity-based incentive plans. We believe that the composition of our compensation committee meets the requirements for independence under, and the functioning of our compensation committee complies with, any applicable requirements of the Sarbanes-Oxley Act of 2002, the NASDAQ Global Market and SEC rules and regulations. We intend to comply with future requirements to the extent they become applicable to us.
Nominating and governance committee
Our nominating and governance committee consists of Messrs. Brown, Gavin and Tilley, with Mr. Brown serving as chairman. In accordance with our nominating and governance committee charter, after this offering, our nominating and governance committee will: recommend to the board of directors nominees for election as directors, and meet as necessary to review director candidates and nominees for election as directors; recommend members for each committee of the board; oversee corporate governance standards and compliance with applicable listing and regulatory requirements; develop and recommend to the board governance principles applicable to the company; and oversee the evaluation of the board and its committees. We believe that the composition of our nominating and governance committee meets the requirements for independence under, and the functioning of our compensation committee complies with, any applicable requirements of the Sarbanes-Oxley Act of 2002, the NASDAQ Global Market and SEC rules and regulations. We intend to comply with future requirements to the extent they become applicable to us.
Code of business conduct and ethics
Our board of directors has adopted a code of business conduct and ethics, which establishes the standards of ethical conduct applicable to all directors, officers and employees of our company. The code addresses, among other things, conflicts of interest, compliance with disclosure controls and
106
procedures and internal controls over financial reporting, corporate opportunities and confidentiality requirements.
Compensation committee interlocks and insider participation
None of the members of our compensation committee is an executive officer or employee of our company. None of our executive officers serves as a member of the board of directors or compensation committee of any entity that has one or more executive officers serving on our board of directors or compensation committee.
Director compensation
The following table presents the total compensation for each person who served as a non-employee member of our board of directors during 2015. Other than as set forth in the table and described more fully in the following table, we did not pay any compensation to, make any equity awards or non-equity awards to, or pay any other compensation to any of the non-employee members of our board of directors in the year ended December 31, 2015. Mr. Young resigned as a member of our board of directors in March 2015. Mr. Brown resigned from our board of directors in December 2014 and was reappointed to our board of directors in March 2015. Mr. Hogan ceased to be chairman of our board of directors in December 2015.
Name
|
Fees Earned or Paid in Cash ($) |
Stock Awards ($)(1) |
Total ($) | |||||||
|---|---|---|---|---|---|---|---|---|---|---|
Thomas Brown(2) |
$ | 35,500 | $ | 25,000 | $ | 60,500 | ||||
Michael Enright(3) |
— | — | — | |||||||
John Gavin(4) |
50,500 | 25,000 | 75,500 | |||||||
Brian Hogan(4) |
70,500 | 25,000 | 95,500 | |||||||
Kirk Tilley(4) |
38,000 | 25,000 | 63,000 | |||||||
Terry Young(5) |
— | — | — | |||||||
- (1)
- The
amounts reported represent the aggregate grant date fair value computed in accordance with FASB ASC Topic 718.
- (2)
- Mr. Brown
resigned from the board December 31, 2014, but was reappointed in March 2015. Per our non-employee director annual grant policy,
Mr. Brown received a grant on November 9, 2015 at the fair market value of our common stock on the grant date, which represented a grant of 3,224 shares.
- (3)
- Mr. Enright
received 3,572 shares in connection with his appointment to the Board in 2015 pursuant to our non-employee director compensation policy.
- (4)
- Each
of Messrs. Enright, Gavin, Hogan and Tilley received 3,572 shares in connection with their annual service on our board of directors per our
non-employee director compensation policy.
- (5)
- Mr. Young resigned in March 2015, thus he received no compensation from us in 2015.
2015 director compensation policy
During 2015, non-employee members of our board of directors received a combination of cash and stock-based compensation for their services as directors. Mr. Clark, our president and chief executive officer, receives no compensation for his service as a director, and the compensation received by Mr. Clark as an employee during 2015 is presented in "Executive Compensation—Summary Compensation Table."
The annual cash retainer for the chairman of our board of directors was $60,000. All other non-employee directors received an annual cash retainer of $25,000. The annual cash retainer for serving as chairperson of either of the audit committee or compensation committee of our board of directors was $5,000. The annual cash retainer for serving as a member of either the audit committee
107
or compensation committee of our board of directors was $2,500. Each director further received a $2,000 cash fee for each scheduled board meeting. Additionally, all of our directors are entitled to reimbursement for reasonable travel expenses incurred in attending our board of directors meetings and committee meetings.
In May 2013, we adopted a non-employee director compensation policy whereby each person who becomes a non-employee director receives $25,000 of restricted stock and is eligible to purchase $100,000 of restricted stock. Thereafter, each non-employee director is granted an annual equity award of restricted stock of $25,000.
2016 director compensation policy
In consultation with a third-party compensation consultant, we reviewed our non-employee director compensation policies to be effective following this offering. Based upon the recommendation of our third-party compensation consultant and the recommendation of our compensation committee, the non-employee director compensation plan will be modified effective following this offering. Accordingly, effective upon this offering, the annual cash retainer for the chairman of our board of directors will be $80,000, if such director is a non-employee. All non-employee directors will receive an annual cash retainer of $45,000. The annual cash retainer for serving as chairperson of either of the audit committee or compensation committee of our board of directors will be $10,000. The annual cash retainer for serving as a member of either the audit committee or compensation committee of our board of directors will be $5,000. The annual cash retainer for serving as the chairperson of the nominating and corporate governance committee of our board of directors will be $7,500. The annual cash retainer for serving as a member of the nominating and governance committee of our board of directors will be $2,500. Each non-employee director will also receive an annual equity award of restricted stock of $45,000. This policy will apply to the full calendar year in which we become a public company and will be applied retroactively to the calendar year. Additionally, all of our directors are entitled to reimbursement for reasonable travel expenses incurred in attending our board of directors meetings and committee meetings.
Limitations on director and officer liability and indemnification
Our certificate of incorporation limits the liability of our directors to the maximum extent permitted by Delaware law. Delaware law provides that directors of a corporation will not be personally liable for monetary damages for breach of their fiduciary duties as directors, except liability for:
- •
- any breach of their duty of loyalty to the corporation or its stockholders;
- •
- acts or omissions not in good faith or which involve intentional misconduct or a knowing violation of law;
- •
- unlawful payments of dividends or unlawful stock repurchases or redemptions; or
- •
- any transaction from which the director derived an improper personal benefit.
Upon completion of this offering, our certificate of incorporation and our bylaws will provide that we are required to indemnify our directors and officers, in each case to the fullest extent permitted by Delaware law. Any repeal of or modification to our certificate of incorporation and our bylaws may not adversely affect any right or protection of a director or officer for or with respect to any acts or omissions of such director or officer occurring prior to such amendment or repeal. Upon completion of this offering, our bylaws will also provide that we shall advance expenses incurred by a director or officer in advance of the final disposition of any action or proceeding, and permit us to secure insurance on behalf of any officer, director, employee or other agent for any liability arising out of his or her actions in connection with their services to us, regardless of whether our bylaws permit such indemnification.
108
Prior to the completion of this offering, we intend to enter into separate indemnification agreements with our directors and executive officers, in addition to the indemnification provided for in our bylaws. These agreements, among other things, provide that we will indemnify our directors and executive officers for certain expenses (including attorneys' fees), judgments, fines, penalties and settlement amounts incurred by a director or executive officer in any action or proceeding arising out of such person's services as one of our directors or executive officers, or any other company or enterprise to which the person provides services at our request. We believe that these provisions and agreements are necessary to attract and retain qualified persons as directors and executive officers.
The limitation of liability and indemnification provisions that will be contained in our certificate of incorporation and our bylaws upon completion of this offering may discourage stockholders from bringing a lawsuit against our directors for breach of their fiduciary duty. They may also reduce the likelihood of derivative litigation against our directors and officers, even though an action, if successful, might benefit us and other stockholders. Further, a stockholder's investment may be adversely affected to the extent that we pay the costs of settlement and damage awards against directors and officers as required by these indemnification provisions. There is no pending litigation or proceeding involving one of our directors or executive officers as to which indemnification is required or permitted, and we are not aware of any threatened litigation or proceeding that may result in a claim for indemnification.
109
Summary compensation table
The following table sets forth summary compensation information for the following persons: (i) all persons serving as our principal executive officer during 2014 and 2015 and (ii) our two other most highly compensated executive officers who received compensation during 2014 or 2015 of at least $100,000 and who were executive officers on December 31, 2014 or 2015. We refer to these persons as our "named executive officers" elsewhere in this prospectus. The following table includes all compensation earned by the named executive officers for the respective period, regardless of whether such amounts were actually paid during the period.
Name and Principal Position
|
Year | Salary ($) |
Bonus ($)(1) |
All Other Compensation ($) |
Total ($)(5) |
|||||||||||
|---|---|---|---|---|---|---|---|---|---|---|---|---|---|---|---|---|
Douglas Clark |
2015 | $ | 421,385 | $ | — | $ | 28,888 | (2) | $ | 450,273 | ||||||
President and Chief Executive Officer |
2014 | $ | 400,000 | $ | 450,000 | $ | 27,887 | (3) | $ | 877,887 | ||||||
James Guice |
2015 |
$ |
276,366 |
$ |
— |
$ |
12,866 |
(4) |
$ |
289,232 |
||||||
Executive Vice President |
2014 | $ | 262,341 | $ | 175,000 | $ | 12,609 | (4) | $ | 449,950 | ||||||
Mark Joyce |
2015 |
$ |
258,446 |
$ |
— |
$ |
13,864 |
(4) |
$ |
272,310 |
||||||
Executive Vice President and Chief Financial Officer |
2014 | $ | 243,023 | $ | 205,000 | $ | 12,743 | (4) | $ | 460,766 | ||||||
- (1)
- The
final amounts of bonus payments to be made to our named executive officers for services performed in 2015 has not yet been determined by our
compensation committee; however, our compensation committtee has approved target bonus amounts of $450,000, $175,000 and $205,000 to Messrs. Clark, Guice and Joyce, respectively.
- (2)
- Includes
medical and disability insurance premiums of $9,574, a car allowance of $9,000 and life insurance premiums of $10,314.
- (3)
- Includes
medical and disability insurance premiums of $10,272, a car allowance of $9,000 and life insurance premiums of $8,615.
- (4)
- Includes
medical, disability and life insurance premiums.
- (5)
- The final amounts of bonus payments to be made to our named executive officers for services performed in 2015 has not yet been determined by our compensation committee; however, our compensation committtee has approved target bonus amounts of $450,000, $175,000 and $205,000 to Messrs. Clark, Guice and Joyce, respectively. We expect that the final amounts of such bonuses will be determined by our compensation committee in the first quarter of 2016.
Outstanding equity awards at December 31, 2015
The following table shows outstanding option awards held by the named executive officers as of December 31, 2015. The option awards were granted under the Equity and Incentive Plan.
Name
|
Equity Incentive Plan Awards: Number of Securities Underlying Unexercised Unearned Options(#) |
Option Exercise Price($) |
Option Expiration Date |
|||||
|---|---|---|---|---|---|---|---|---|
Douglas Clark(1)(2) |
1,800,000 | $ | 2.43 | 01/01/2022 | ||||
James Guice(2)(3) |
900,000 | $ | 2.43 | 01/01/2022 | ||||
Mark Joyce(2)(3) |
900,000 | $ | 2.43 | 01/01/2022 | ||||
- (1)
- In
the event of Mr. Clark's death or disability or in the event of a change in control, all of Mr. Clark's unvested options
shall be fully vested and fully exercisable.
- (2)
- Subject
to continued employment through each such date, 25% of the shares underlying the option shall vest on the later of January 1,
2013 or the occurrence of an initial public offering; 25% of the shares underlying the option shall vest on the later of January 1, 2014 or the occurrence of an initial public offering; 25% of
the shares underlying the option shall vest on the later of January 1, 2015 or the occurrence of an initial public offering; and 25% of the shares underlying the option shall vest on the later
of January 1, 2016 or the occurrence of an initial public offering.
- (3)
- In the event of a change in control, all of such named executive officer's unvested options shall be fully vested and fully exercisable.
110
Potential Payments and Benefits Upon Termination or Change in Control
In June 2015, our board of directors approved our entry into a severance and change-in-control agreement with each of our executive officers named in our Summary Compensation Table. These agreements provide that in the event of a termination of the executive officer's employment without cause or resignation for good reason (as defined) within a change-in-control period beginning 6 months prior to and ending 24 months after a change in control of the Company (as defined) the executive officer shall be entitled to receive (i) a lump-sum payment equal to 18 months (24 months for Mr. Clark) of the executive's base salary (as in effect prior to the termination date) plus 150% (200% for Mr. Clark) of his target annual bonus for the year of termination, (ii) pro-rated payment of the executive's annual incentive bonus for the year of termination, based on actual performance (or at target if actual performance cannot be evaluated), (iii) reimbursement of Company COBRA health coverage for a period of up to 18 months (24 months for Mr. Clark) and (iv) 100% vesting of the executive's outstanding Company equity awards. In addition, the agreements provide that if the executive officer's employment is terminated without cause or due to resignation for good reason other than during the change-in-control period referenced above, the executive officer shall be entitled to receive (i) a lump-sum payment equal to 12 months (18 months Mr. Clark) of the executive's base salary (as in effect prior to the termination date), (ii) pro-rated payment of the executive's annual incentive bonus for the year of termination, based on actual performance (or at target if actual performance cannot be evaluated), (iii) reimbursement of Company COBRA health coverage for a period of up to 12 months (18 months for Mr. Clark), (iv) Company provided outplacement services for up to 3 months and (v) pro-rated vesting of executive's outstanding Company equity awards through the termination date. Severance payments are conditioned on the executive officer executing a release of claims agreement within 60 days of termination and abiding by post-termination non-solicitation and non-competition covenants for the severance period.
Also as described above, the options held by each of our executive officers will become fully vested upon the occurrence of a change of control of the Company. In addition, the options held by Mr. Clark become fully vested in the event of his termination due to death or disability.
The following table describes the payments and benefits that each of our named executive officers would be entitled to receive pursuant to the severance and change-in-control agreements and their outstanding option agreements, assuming that each of the following triggers occurred on December 31, 2015: (i) their employment was terminated without "cause" or by them for "good reason" during the period prior to 6 months before or after 24-months following a "change in control," (ii) their employment was terminated without "cause" or by them for "good reason" during the period 6 months before or 24-months following a "change in control," and (iii) there occurred a change in control of the Company or termination due to death or disability.
| |
Termination Without Cause or for Good Reason Not During Change-in-Control Period |
Termination Without Cause or for Good Reason Within 24 Months Following or 6 Months Prior to Change in Control |
Change in Control, Death, Disability |
|||||||||||||||||||
|---|---|---|---|---|---|---|---|---|---|---|---|---|---|---|---|---|---|---|---|---|---|---|
Name
|
Severance Payments |
Equity Acceleration (1) |
Benefits (3) |
Severance Payments |
Equity Acceleration (1) |
Benefits (3) |
Equity Acceleration (2) |
|||||||||||||||
Douglas Clark |
$ | 927,047 | $ | 8,613,000 | $ | 28,706 | $ | 1,727,679 | $ | 17,226,000 | $ | 24,942 | $ | 17,226,000 | ||||||||
James Guice |
$ | 414,549 | $ | 4,306,500 | $ | 27,177 | $ | 760,007 | $ | 8,613,000 | $ | 25,765 | $ | 8,613,000 | ||||||||
Mark Joyce |
$ | 387,669 | $ | 4,306,500 | $ | 27,177 | $ | 710,727 | $ | 8,613,000 | $ | 25,765 | $ | 8,613,000 | ||||||||
- (1)
- Represents the value of acceleration of vesting of a percentage of the unvested shares of stock subject to outstanding options granted on January 1, 2012 triggered by a termination under the severance and change in control agreement. Such percentage shall be determined by the amount of such executive officer's completed service from the vesting commencement date through the termination date and assuming satisfaction of the vesting condition related to occurrence of an initial public offering as of such date. The aggregate dollar amount realized upon the acceleration of vesting of an
111
equity award represents the aggregate market price of the shares of our common stock underlying the equity award on the acceleration date (assumed to be the midpoint of the price range set forth on the cover page of this prospectus) multiplied by the shares vesting on the acceleration date.
- (2)
- Represents
the value of acceleration of vesting of 100% of the unvested shares of stock subject to outstanding options granted on January 1, 2012
triggered by a change of control, and death or disability pursuant to the terms of the option agreements. The aggregate dollar amount realized upon the acceleration of vesting of an equity award
represents the aggregate market price of the shares of our common stock underlying the equity award on the acceleration date (assumed to be the midpoint of the price range set forth on the cover page
of this prospectus) multiplied by the shares vesting on the acceleration date.
- (3)
- Represents the value of Company COBRA health coverage and, for terminations other than during a change-in-control period, the value of Company provided outplacement benefits.
Incentive bonus plan
The compensation committee of the board of directors approves an annual discretionary cash-based incentive bonus plan for Company employees at the beginning of each fiscal year. The compensation committee, upon recommendations of management, selects Company-specific performance goals that must be achieved to fund a bonus pool under the plan. For fiscal 2015, the amount of the bonus pool was determined according to a formula based on actual Company EBITDA in relation to the Company's annual operating plan. Individual bonus amounts are determined by management and the compensation committee in its discretion.
Employee benefit plans
Equity and incentive plan
Our board of directors adopted the amended and restated AmeriQuest Transportation Services, Inc. Equity and Incentive Plan, or the Equity and Incentive Plan, on March 27, 2008. The Equity and Incentive Plan allows for the discretionary grant of nonstatutory stock options, stock appreciation rights, restricted stock, phantom stock units, dividend equivalents and other stock-based or cash-based awards to our employees, and to employees of our subsidiaries or affiliates.
Authorized shares. A maximum of 5,000,000 shares were authorized for issuance under our Equity and Incentive Plan. The Equity and Incentive Plan will terminate in connection with this offering, and no shares will be available for issuance following the completion of this offering. The Equity and Incentive Plan will continue to govern outstanding awards granted thereunder. As of September 30, 2015, a total of 4,005,000 options to purchase shares of our common stock were outstanding and 587,016 shares subject to restricted stock awards were issued and outstanding under our Equity and Incentive Plan.
Plan administration. Our board of directors or a committee of our board (the administrator) administers our Equity and Incentive Plan. Subject to the provisions of the Equity and Incentive Plan, the administrator has the full authority and discretion to take any actions it deems necessary or advisable for the administration of the Equity and Incentive Plan. All decisions, interpretations and other actions of the administrator are final and binding on all participants in the Equity and Incentive Plan.
Options. Stock options may be granted under our Equity and Incentive Plan. The Equity and Incentive Plan requires options to have an exercise price per share equal to at least 100% of the fair market value per share of our common stock on the date of grant, as determined by the administrator and a term not exceeding 10 years. The administrator determines the terms and conditions of options in accordance with the Equity and Incentive Plan. After termination of an employee, he or she may exercise his or her option for the period of time as specified in the option agreement.
Restricted Stock. Restricted stock may be granted under our Equity and Incentive Plan. Restricted stock awards are grants of shares of our common stock that are granted with transferability and other
112
restrictions determined by the administrator. The administrator may impose conditions to vesting based on achievement of performance goals or continued service as it determines. Shares of restricted stock that do not vest are subject to our right of repurchase or forfeiture. Unless provided otherwise in the award agreement, holders of restricted stock will have all the rights of a stockholder, including voting and dividend rights.
Transferability of awards. Our Equity and Incentive Plan generally does not allow for the transfer or assignment of awards, except by will or by the laws of descent and distribution. Shares issued pursuant to an award under our Equity and Incentive Plan will be subject to such special forfeiture conditions, rights of repurchase, rights of first refusal, and other transfer restrictions as the administrator may determine.
Certain adjustments. In the event of a subdivision of our outstanding stock, a dividend payable in cash or shares or other distribution, a reorganization, merger, combination or consolidation of our outstanding stock into a lesser number of shares, a reclassification, or any other increase or decrease in the number of issued shares of stock, the administrator will appropriately adjust the class and maximum number of securities subject to the Equity Incentive Plan and the class, number of securities and price per share of common stock subject to outstanding awards under the Equity and Incentive Plan to prevent dilution or enlargement rights of participants.
In addition, the Equity and Incentive Plan allows the administrator to make adjustments to the terms and conditions of awards, including cancellation of awards in exchange for intrinsic value of the vested portion thereof or substitution of awards using shares of a successor entity or other entity or acceleration of the expiration date of awards, in recognition of certain unusual or nonrecurring events affecting the company or a subsidiary or affiliate. Notwithstanding the foregoing, if such event results in the acquisition of all or substantially all of the company's shares, then the document governing the acquisition may govern treatment of awards without need for action by the administrator.
Change in control. Our Equity and Incentive Plan provides that, unless otherwise determined by the administrator and evidenced in an award agreement, in the event of a change of control:
- •
- any award carrying a right to exercise that was not previously vested shall become fully vested and exercisable; and
- •
- the restrictions, payment conditions and forfeiture conditions applicable to other awards shall lapse and such awards shall be deemed fully vested and any performance goals will be deemed fully achieved.
Amendment; termination. Our board of directors may amend, suspend or terminate our Equity and Incentive Plan at any time, provided that such action does not impair a participant's rights under outstanding awards without such participant's written consent. As noted above, upon completion of this offering, our Equity and Incentive Plan will be terminated and no further awards will be granted thereunder. All outstanding awards will continue to be governed by their existing terms.
Non-employee director stock purchase plan 2011
Our board of directors adopted our Non-Employee Director Stock Purchase Plan 2011, or Director Plan, on January 27, 2011. The Director Plan allows each non-employee director of the Company to elect to purchase shares of our common stock with annual director fees that would otherwise be payable in cash. The Director Plan will terminate pursuant to its terms upon consummation of this offering. Eligibility in the Director Plan is limited to non-employee directors of the Company.
Authorized shares. A total of 1,000,000 shares of our common stock were authorized for issuance under the Director Plan. As of September 30, 2015, 208,328 shares of our common stock had been issued under the Director Plan.
113
Plan operation. The Director Plan is administered by our board of directors. Under the Director Plan, each non-employee director may file an irrevocable election to invest a portion of their annual retainer fees in shares of our common stock in lieu of receiving such amounts in cash. Elections must be made no later than the 20th business day of the fiscal year. Shares are purchase on the last day of the quarter in which such retainer fees would otherwise be paid. The purchase price of shares is the fair market value based on an annual independent valuation.
Nontransferability. Purchase rights under the Director Plan may not be assigned by a participating non-employee director, voluntarily or by operation of law. Shares purchased under the Director Plan are subject to restrictions on transferability and a company repurchase right under the terms of a stock purchase agreement, which restrictions will lapse pursuant to their terms upon the consummation of this offering.
Plan amendment and termination. Our board of directors may amend or terminate the Director Plan at any time, provided no amendment may impair the rights of participating directors.
Employee stock purchase plan 2011
Our board of directors adopted our amended and restated 2011 Employee Stock Purchase Plan, or the Purchase Plan, on April 6, 2011. The Purchase Plan allows full-time employees of the Company to elect to purchase shares of our common stock using annual bonus compensation that would otherwise be payable in cash. The Purchase Plan will terminate pursuant to its terms upon consummation of this offering. Eligibility in the Purchase Plan is limited to full-time employees of the Company.
Authorized shares. A total of 1,000,000 shares of our common stock were authorized for issuance under the Purchase Plan. As of September 30, 2015, a total of 329,652 shares of our common stock had been issued under the Purchase Plan.
Plan operation. The Purchase Plan is administered by our board of directors. Under the Purchase Plan, each full-time employee may file an irrevocable election no later than April 30 of the fiscal year to invest a portion, not exceeding 50%, of their annual bonus in shares of our common stock in lieu of receiving such amounts in cash. Shares are purchased on the last day of the quarter in which such bonus amounts would otherwise be paid. Shares are purchased at a discounted purchase price equal to 85% of the fair market value based on an annual independent valuation. The amount of such discount is treated as additional taxable income to the employee.
Nontransferability. Purchase rights under the Purchase Plan may not be assigned by a participating employee, voluntarily or by operation of law. Shares purchased under the Purchase Plan are subject to restrictions on transferability and a company repurchase right under the terms of a stock purchase agreement, which restrictions will lapse pursuant to their terms upon the consummation of this offering.
Plan amendment and termination. Our board of directors may amend or terminate the Purchase Plan at any time, provided no amendment may impair the rights of participating employees.
2015 equity incentive plan
Our board of directors adopted our 2015 Equity Incentive Plan, or the 2015 Plan, which our stockholders have approved. The 2015 Plan is effective upon the later to occur of its adoption by our board of directors or the business day immediately prior to the effective date of the registration statement of which this prospectus forms a part, but is not expected to be used until after the completion of this offering. The 2015 Plan provides for the grant of incentive stock options, within the meaning of Section 422 of the Internal Revenue Code, to our employees and any parent and subsidiary corporations' employees, and for the grant of non-statutory stock options, restricted stock, restricted stock units, stock appreciation rights, performance units and performance shares to our employees, directors and consultants and our parent and subsidiary corporations' employees and consultants.
114
Authorized shares. A total of 2,933,332 shares of our common stock are reserved for issuance pursuant to the 2015 Plan, of which no awards are issued and outstanding. The number of shares available for issuance under the 2015 Plan will also include an annual increase on the first day of each fiscal year beginning in 2016, equal to the least of:
- •
- 1,466,000 shares;
- •
- 5% of the outstanding shares of our common stock as of the last day of our immediately preceding year; or
- •
- any such other amount as our board of directors may determine.
Plan administration. Our board of directors or the compensation committee of our board of directors will administer the 2015 Plan. Subject to the provisions of the 2015 Plan, the administrator has the power to determine the terms of the awards, including the exercise price, the number of shares subject to each such award, the exercisability of the awards, and the form of consideration, if any, payable upon exercise. The administrator also has the authority to amend existing awards to reduce their exercise price, to allow participants the opportunity to transfer outstanding awards to a financial institution or other person or entity selected by the administrator and to institute an exchange program by which outstanding awards may be surrendered in exchange for awards with a higher or lower exercise price.
Stock options. The exercise price of options granted under the 2015 Plan must at least be equal to the fair market value of our common stock on the date of grant. The term of an incentive stock option may not exceed ten years, except that with respect to any employee who owns more than 10% of the voting power of all classes of our outstanding stock, the term must not exceed five years and the exercise price must equal at least 110% of the fair market value of our common stock on the grant date. Subject to the provisions of the 2015 Plan, the administrator determines the term of all other options. After the termination of service of an employee, director or consultant, he or she may exercise his or her option for the period of time stated in his or her option agreement. Generally, if termination is due to death or disability, the option will remain exercisable for twelve months. In all other cases, the option will generally remain exercisable for three months following the termination of service. However, in no event may an option be exercised later than the expiration of its term.
Stock appreciation rights. Stock appreciation rights may be granted under the 2015 Plan. Stock appreciation rights allow the recipient to receive the appreciation in the fair market value of shares of our common stock between the exercise date and the date of grant. Subject to the provisions of the 2015 Plan, the administrator determines the terms of stock appreciation rights, including when such rights become exercisable and whether to pay any increased appreciation in cash or with shares of our common stock, or a combination thereof, except that the per share exercise price for the shares to be issued pursuant to the exercise of a stock appreciation right will be no less than 100% of the fair market value per share on the date of grant.
Restricted stock. Restricted stock may be granted under the 2015 Plan. Restricted stock awards are grants of shares of our common stock that vest in accordance with terms and conditions established by the administrator. The administrator will determine the number of shares of restricted stock granted to any employee, director, or consultant. The administrator may impose whatever conditions to vesting it determines to be appropriate (for example, the administrator may set restrictions based on the achievement of specific performance goals or continued service to us); provided, however, that the administrator, in its sole discretion, may accelerate the time at which any restrictions will lapse or be removed. Shares of restricted stock that do not vest are subject to our right of repurchase or forfeiture.
Restricted stock units. Restricted stock units may be granted under the 2015 Plan. Restricted stock units are bookkeeping entries representing an amount equal to the fair market value of one share of our common stock. The administrator determines the terms and conditions of restricted stock units,
115
including the vesting criteria (which may include accomplishing specified performance criteria or continued service to us) and the form and timing of payment. Notwithstanding the foregoing, the administrator, in its sole discretion, may accelerate the time at which any restrictions will lapse or be removed.
Performance units and performance shares. Performance units and performance shares may be granted under the 2015 Plan. Performance units and performance shares are awards that will result in a payment to a participant only if performance goals established by the administrator are achieved or the awards otherwise vest. The administrator will establish organizational or individual performance goals in its discretion, which, depending on the extent to which they are met, will determine the number and/or the value of performance units and performance shares to be paid out to participants. After the grant of a performance unit or performance share, the administrator, in its sole discretion, may reduce or waive any performance criteria or other vesting provisions for such performance units or performance shares. Performance units shall have an initial dollar value established by the administrator prior to the grant date. Performance shares shall have an initial value equal to the fair market value of our common stock on the grant date. The administrator, in its sole discretion, may pay earned performance units or performance shares in the form of cash, in shares or in some combination thereof.
Outside directors. The 2015 Plan will provide that all non-employee directors will be eligible to receive all types of awards (except for incentive stock options) under the 2015 Plan.
Non-transferability of awards. Unless the administrator provides otherwise, the 2015 Plan generally does not allow for the transfer of awards, other than by will or by the laws of descent or distribution, and only the recipient of an award may exercise an award during his or her lifetime.
Certain adjustments. In the event of certain changes in our capitalization, to prevent diminution or enlargement of the benefits or potential benefits available under the 2015 Plan, the administrator will adjust the number and class of shares that may be delivered under the Plan and/or the number, class and price of shares covered by each outstanding award, and the numerical share limits set forth in the 2015 Plan. In the event of our proposed liquidation or dissolution, the administrator will notify participants as soon as practicable and all awards will terminate immediately prior to the consummation of such proposed transaction.
Merger or change in control. The 2015 Plan will provide that in the event of a merger or change in control, as defined under the 2015 Plan, each outstanding award will be treated as the administrator determines, except that if a successor corporation or its parent or subsidiary does not assume or substitute an equivalent award for any outstanding award, then such award will fully vest, all restrictions on such award will lapse, all performance goals or other vesting criteria applicable to such award will be deemed achieved at 100% of target levels and such award will become fully exercisable, if applicable, for a specified period prior to the transaction. The award will then terminate upon the expiration of the specified period of time. If the service of an outside director is terminated on or following a change in control, other than pursuant to a voluntary resignation, his or her options, restricted stock units and stock appreciation rights, if any, will vest fully and become immediately exercisable, all restrictions on his or her restricted stock will lapse, all performance goals or other vesting requirements for his or her performance shares and units will be deemed achieved at 100% of target levels, and all other terms and conditions will be deemed met.
Amendment, termination. Our board of directors will have the authority to amend, suspend or terminate the 2015 Plan provided such action does not impair the existing rights of any participant. The 2015 Plan will automatically terminate in 2025, unless we terminate it sooner.
116
2015 employee stock purchase plan
Our board of directors adopted our 2015 Employee Stock Purchase Plan, or the ESPP, and our stockholders have approved. The ESPP became effective upon its adoption by our board of directors but will not be in use until the completion of this offering.
The ESPP includes a component that is intended to qualify as an "employee stock purchase plan" under Section 423 of the Internal Revenue Code of 1986, as amended, or the 423 Component, and a component that does not comply with Section 423, or the Non-423 Component. For purposes of this disclosure, a reference to the "ESPP" will mean the 423 Component. Unless determined otherwise by the administrator, each of our non-U.S. subsidiaries will participate in a separate offering under the Non-423 Component.
Authorized shares. A total of 266,668 shares of our common stock will be made available for sale. In addition, our ESPP provides for annual increases in the number of shares available for issuance under the ESPP on the first day of each fiscal year beginning in fiscal year 2016, equal to the least of:
- •
- 1% of the outstanding shares of our common stock on the last day of the previous fiscal year;
- •
- 800,000 shares; or
- •
- such other amount as may be determined by our board of directors.
Plan administration. Our board of directors or a committee appointed by our board of directors will administer the ESPP. The administrator has authority to administer the plan, including but not limited to, full and exclusive authority to interpret the terms of the ESPP, determine eligibility to participate subject to the conditions of our ESPP as described below, and to establish procedures for plan administration necessary for the administration of the Plan, including creating sub-plans.
Eligibility. Generally, all of our employees will be eligible to participate if they are employed by us, or any participating subsidiary, for at least 20 hours per week and more than five months in any calendar year. However, an employee may not be granted an option to purchase stock under the ESPP if such employee:
- •
- immediately after the grant would own stock constituting 5% or more of the total combined voting power or value of all classes of our
capital stock; or
- •
- holds rights to purchase stock under all of our employee stock purchase plans that accrue at a rate that exceeds $25,000 worth of stock for each calendar year in which the option is outstanding.
Offering periods. Our ESPP will be intended to qualify under Section 423 of the Code, and provides for six month offering periods. The offering periods generally start on the first trading day on or after September 1 and March 1 of each year, except that the first offering period will commence on the first trading day following the effective date of the registration statement of which this prospectus forms a part. The administrator may, in its discretion, modify the terms of future offering periods.
Payroll deductions. Our ESPP will permit participants to purchase common stock through payroll deductions of up to 20% of their eligible compensation, which includes a participant's base straight time gross earnings, but exclusive of payments for incentive compensation, bonuses, payments for overtime and shift premium, equity compensation income and other similar compensation. A participant may purchase a maximum of 5,000 shares during an offering period.
Exercise of option. Amounts deducted and accumulated by the participant are used to purchase shares of our common stock at the end of each six month offering period. The purchase price of the shares will be 85% of the lower of the fair market value of our common stock on the first trading day of each offering period or on the exercise date. Participants may end their participation at any time during an offering period, and will be paid their accrued payroll deductions that have not yet been used
117
to purchase shares of common stock. Participation ends automatically upon termination of employment with us.
Non-transferability. A participant may not transfer rights granted under our ESPP other than by will, the laws of descent and distribution, or as otherwise provided under our ESPP.
Merger or change in control. In the event of our merger or change in control, as defined under the ESPP, a successor corporation may assume or substitute for each outstanding option. If the successor corporation refuses to assume or substitute for the option, the offering period then in progress will be shortened, and a new exercise date will be set. The administrator will notify each participant that the exercise date has been changed and that the participant's option will be exercised automatically on the new exercise date unless prior to such date the participant has withdrawn from the offering period.
Amendment, termination. Our ESPP will automatically terminate in 2035, unless we terminate it sooner. The administrator has the authority to amend, suspend or terminate our ESPP at any time.
401(k) Plan
We maintain a tax-qualified retirement plan, or the 401(k) Plan, that provides eligible employees with an opportunity to save for retirement on a tax-advantaged basis. All participants' interests in their contributions are 100% vested when contributed. Historically, we have not made any matching contributions to the 401(k) Plan. Pre-tax contributions are allocated to each participant's individual account and are then invested in selected investment alternatives according to the participants' directions. The 401(k) Plan is intended to qualify under Sections 401(a) and 501(a) of the Internal Revenue Code.
118
CERTAIN RELATIONSHIPS AND RELATED TRANSACTIONS
Policies and procedures for transactions with related persons
Our board of directors intends to adopt a written related person transaction policy to set forth the policies and procedures for the review and approval or ratification of related person transactions. Related persons include any executive officer, director or a holder of more than five percent of our common stock, including any of their immediate family members and any entity owned or controlled by such persons. Related person transactions refers to any transaction, arrangement or relationship, or any series of similar transactions, arrangements or relationships in which (i) we were or are to be a participant, (ii) the amount involved exceeds $120,000, and (iii) a related person had or will have a direct or indirect material interest. Related person transactions include, without limitation, purchases of goods or services by or from the related person or entities in which the related person has a material interest, indebtedness, guarantees of indebtedness, and employment by us of a related person, in each case subject to certain exceptions set forth in Item 404 of Regulation S-K under the Securities Act of 1933, as amended.
We expect that the policy will provide that in any related person transaction, our audit committee and board of directors shall consider all of the available material facts and circumstances of the transaction, including: the direct and indirect interests of the related persons; in the event the related person is a director (or immediate family member of a director or an entity with which a director is affiliated), the impact that the transaction will have on a director's independence; the risks, costs and benefits of the transaction to us; and whether any alternative transactions or sources for comparable services or products are available. After considering all such facts and circumstances, our audit committee and board of directors shall determine whether approval or ratification of the related person transaction is in our best interests. For example, if our audit committee determines that the proposed terms of a related person transaction are reasonable and at least as favorable as could have been obtained from unrelated third parties, it will recommend to our board of directors that such transaction be approved or ratified. In addition, once we become a public company, if a related person transaction will compromise the independence of one of our directors, our audit committee may recommend that our board of directors reject the transaction if it could affect our ability to comply with securities laws and regulations or the NASDAQ Stock Market listing requirements.
Each transaction described in "Transactions and Relationships with Directors, Officers and 5% Stockholders" was entered into prior to the adoption of our audit committee charter and the foregoing policy proposal. Accordingly, each was approved by disinterested members of our board of directors after making a determination that the transaction was executed on terms no less favorable than those we could have obtained from unrelated third parties unless otherwise indicated.
Transactions and relationships with directors, officers and 5% stockholders
The following is a summary of related person transactions since January 1, 2012.
Procurement solutions purchases
Several of our board members have an ownership interest in entities that make purchases through our procurement solution. The purchases were and are made in the ordinary course of business pursuant to our standard terms and conditions.
Brian Hogan, our former chairman and current board member, is the president of, and has a direct ownership interest in, Hogan Motor Leasing, Inc. During the years ended December 31, 2012, 2013, 2014 and nine months ended September 30, 2015, Hogan Motor Leasing, Inc. purchased $20.5 million, $23.1 million, $25.9 million and $19.5 million, respectively, of products through our procurement solution.
119
Terry Young, a member of our board of directors until March 2015, is the principal and chairman of, and has a direct ownership interest in, Advantage Truck Leasing, Inc. and Advantage Truck Centers. During the years ended December 31, 2012, 2013, 2014 and the nine months ended September 30, 2015, Advantage Truck Leasing, Inc. and Advantage Truck Centers purchased $0.8 million, $0.6 million, $0.6 million and $0.4 million, respectively, of products.
Thomas Brown, a member of our board of directors, is the president of, and has a direct ownership interest in, Brown NationaLease. During the years ended December 31, 2012, 2013, 2014 and the nine months ended September 30, 2015, Brown NationaLease purchased $5.0 million, $4.8 million, $4.2 million and $3.0 million, respectively, of products.
Steve Lawrence, a member of our board of directors until December 2014, is the chairman and chief executive officer of, and has an ownership interest in, LTX, Inc. During the years ended December 31, 2012, 2013, 2014 and the nine months ended September 30, 2015, LTX, Inc. purchased $7.5 million, $6.1 million, $8.3 million and $4.3 million, respectively, of products.
Kirk Tilley, a member of our board of directors, is the president of, and has a direct ownership interest in Tandet Management Inc., the parent company of The Tandet Group. During the years ended December 31, 2012, 2013, 2014 and the nine months ended September 30, 2015, The Tandet Group purchased $4.2 million, $4.5 million, $4.3 million and $3.6 million, respectively, of products through our procurement solution.
CURE Leasing and Maintenance truck purchases
Terry Young, a member of our board of directors until March 2015 is the principal and chairman of, and has a direct ownership interest in, Advantage Truck Leasing, Inc. and Advantage Truck Centers. During the years ended December 31, 2012, 2013, 2014 and the nine months ended September 30, 2015, we purchased $6.2 million, $1.7 million, $1.3 million and $0.0 million, respectively, of trucks from Advantage Truck Leasing, Inc. and Advantage Truck Centers. The purchases were made in the ordinary course of business pursuant to a negotiated agreement after we evaluated other commercial alternatives and concluded that Advantage Truck Leasing, Inc. and Advantage Truck Centers were the most suitable alternatives. Mr. Young did not participate in the decision to negotiate with Advantage Truck Leasing, Inc. and Advantage Truck Centers or in the negotiations themselves.
Sales through AmeriQuest Remarketing
Terry Young, a member of our board of directors until March 2015 is the principal and chairman of, and has a direct ownership interest in, Advantage Truck Leasing, Inc. and Advantage Truck Centers. During the years ended December 31, 2012, 2013, 2014 and the nine months ended September 30, 2015, we acquired $0.8 million, $0.3 million, $0.2 million and $0.1 million, respectively, of capital equipment from Advantage Truck Leasing, Inc. and Advantage Truck Centers.
Employment relationships
Matt Clark, the son of Douglas Clark, our president and chief executive officer, is employed by us. During years ended December 31, 2012, 2013 and 2014, Matt Clark had total compensation, including base salary, bonus and other compensation in the aggregate during those periods of $634,239.
Matt Guice, the son of James Guice, our executive vice president, is employed by us. During years ended December 31, 2012, 2013 and 2014, Matt Guice had total compensation, including base salary, bonus and other compensation in the aggregate during those periods of $205,414.
The compensation levels of Matt Clark and Matt Guice were based on reference to external market practice of similar positions or internal pay equity when compared to the compensation paid to employees in similar positions that were not related to our executive officers and directors. They were
120
also eligible for equity awards on the same general terms and conditions as applicable to other employees in similar positions who were not related to our executive officers and directors.
Shareholders' agreement
We entered into a shareholders' agreement with certain of our executive officers, directors and stockholders. The shareholders' agreement, among other things, grants us a right of first refusal with respect to certain proposed transfers of our securities by stockholders. Each agreement also requires us to repurchase our securities from stockholders under certain circumstances. The shareholders' agreement will terminate upon the closing of this offering.
We also entered into a stock purchase and shareholders agreement with Douglas Clark, our president and chief executive officer. The stock purchase and shareholders' agreement grants us the right of first refusal with respect to certain proposed transfers of our securities by Mr. Clark.
Indemnification agreements
We have entered into an indemnification agreement with each of our directors and officers. The indemnification agreements and our certificate of incorporation and bylaws require us to indemnify our directors and officers to the fullest extent permitted by Delaware law. See "Management—Limitations on director and officer liability and indemnification."
Change in Control Arrangements
We will enter into change in control arrangements with certain of our executive officers that, among other things, provide for certain severance and change in control benefits. See "Executive Compensation—Potential Payment upon Termination or Change-In-Control."
121
PRINCIPAL AND SELLING STOCKHOLDERS
The following table sets forth certain information with respect to the beneficial ownership of our common stock as of December 31, 2015, referred to in the table below as the "Beneficial Ownership Date," and as adjusted to reflect the sale of shares of our common stock offered by this prospectus, by:
- •
- each beneficial owner of 5% or more of the outstanding shares of our common stock;
- •
- each of our named executive officers;
- •
- each of our directors;
- •
- all directors and executive officers as a group; and
- •
- each of the selling stockholders.
Beneficial ownership is determined in accordance with the rules of the SEC. In computing the number of shares beneficially owned by a person and the percentage ownership of that person, shares of common stock subject to options or warrants held by that person that are currently exercisable or exercisable within 60 days of the Beneficial Ownership Date and shares of restricted stock subject to vesting until the occurrence of certain events, including the consummation of this offering are deemed outstanding, but are not deemed outstanding for computing the percentage ownership of any other person. Percentage of beneficial ownership is based on 12,765,044 shares of common stock outstanding as of the Beneficial Ownership Date and 18,918,890 shares of common stock outstanding after this offering.
To our knowledge, except as set forth in the footnotes to this table and subject to applicable community property laws, each person named in the table has sole voting and investment power with respect to the shares set forth opposite such person's name. Except as otherwise indicated, the address of each of the persons in this table is c/o AmeriQuest, Inc. 457 Haddonfield Road, Suite 220, Cherry Hill, NJ 08002.
122
The percentage ownership information shown in the table after this offering assumes the underwriters' option to purchase 923,076 shares of our common stock from the selling stockholders is exercised in full.
| |
|
|
|
|
|
Shares Beneficially Owned After this Offering Sold if Underwriters' Option is Exercised in Full |
||||||||||||||||
|---|---|---|---|---|---|---|---|---|---|---|---|---|---|---|---|---|---|---|---|---|---|---|
| |
|
|
|
|
Number of Shares to be Sold if Underwriters' Option is Exercised in Full |
|||||||||||||||||
| |
Shares Beneficially Owned Prior to this Offering |
Shares Beneficially Owned After this Offering |
||||||||||||||||||||
Name of Beneficial Owner
|
Shares | Percentage | Shares | Percentage | Shares | Percentage | ||||||||||||||||
Principal and Selling Stockholders: |
||||||||||||||||||||||
Hogan Motor Leasing, Inc.(1) |
925,600 | 7.3 | % | 925,600 | 4.9 | % | 300,000 | 625,600 | 3.3 | % | ||||||||||||
McVestco Financial Limited(2) |
800,000 | 6.3 | % | 800,000 | 4.2 | % | 186,808 | 613,192 | 3.2 | % | ||||||||||||
Named Executive Officers and Directors: |
||||||||||||||||||||||
Douglas Clark(3) |
3,733,536 | 25.8 | % | 3,733,536 | 18.0 | % | 300,000 | 3,433,536 | 16.6 | % | ||||||||||||
James Guice(4) |
1,036,268 | 7.6 | % | 1,036,268 | 5.2 | % | 136,268 | 900,000 | 4.5 | % | ||||||||||||
Mark Joyce(5) |
920,336 | 6.7 | % | 920,336 | 4.6 | % | — | 920,336 | 4.6 | % | ||||||||||||
John Gavin(6) |
63,120 | * | 63,120 | * | — | 63,120 | * | |||||||||||||||
Brian Hogan(7) |
1,162,784 | 9.1 | % | 1,162,784 | 6.1 | % | 300,000 | 862,784 | 4.6 | % | ||||||||||||
Kirk Tilley(8) |
80,516 | * | 80,516 | * | — | 80,516 | * | |||||||||||||||
Thomas Brown(9) |
103,864 | * | 103,864 | * | — | 103,864 | * | |||||||||||||||
Michael Enright(10) |
7,144 | * | 7,144 | * | — | 7,144 | * | |||||||||||||||
All directors and executive officers as a group (8 persons) |
7,107,568 | 43.4 | % | 7,107,568 | 31.5 | % | 736,268 | 6,371,300 | 27.4 | % | ||||||||||||
- *
- Indicates
less than 1%.
- (1)
- Brian
Hogan is a principal shareholder of Hogan Motor Leasing, Inc. The address of Hogan Motor Leasing, Inc.'s parent company is 2150 Schuetz Road,
St. Louis, Missouri 63146. Brian Hogan has sole voting and investment control over the shares of our capital stock beneficially owned by Hogan Motor Leasing, Inc.
- (2)
- The
address of McVestco Financial Limited is 1700, 800-5 Avenue SW, Calgary, AB T2P-5A3.
- (3)
- Includes
(i) 1,350,000 shares subject to options that are immediately exercisable upon the consummation of this offering and (ii) 450,000
shares that are subject to options that are exercisable within 60 days of the Beneficial Ownership Date.
- (4)
- Includes
(i) 675,000 shares subject to options that are immediately exercisable upon the consummation of this offering and (ii) 225,000 shares
that are subject to options that are exercisable within 60 days of the Beneficial Ownership Date.
- (5)
- Includes
(i) 675,000 shares subject to options that are immediately exercisable upon the consummation of this offering and (ii) 225,000 shares
that are subject to options that are exercisable within 60 days of the Beneficial Ownership Date.
- (6)
- Includes
3,572 shares of restricted stock that are immediately exercisable upon the consummation of this offering.
- (7)
- Includes
(i) 3,572 shares of restricted stock that are immediately exercisable upon the consummation of this offering and (ii) 925,600 shares
owned by Hogan Motor Leasing, Inc. Mr. Hogan is a principal stockholder of Hogan Motor Leasing, Inc. See footnote 1.
- (8)
- Includes
(i) 3,572 shares of restricted stock that are immediately exercisable upon the consummation of this offering and (ii) 57,696 shares
owned by Tandet Transportation Leasing. Mr. Tilley is a principal stockholder of Tandet Transportation Leasing.
- (9)
- Includes
(i) 3,224 shares of restricted stock that are immediately exercisable within 60 days of the Beneficial Ownership Date and
(ii) 57,212 shares owned by Brown NationaLease. Mr. Brown is a principal stockholder of Brown NationaLease.
- (10)
- Includes 7,144 shares of restricted stock that are immediately exercisable upon the consummation of this offering.
123
The following information describes our common stock and preferred stock, as well as options to purchase our common stock and provisions of our certificate of incorporation and bylaws. This description is only a summary and reflects the expected terms of our certificate of incorporation and bylaws to be effective upon completion of this offering. You should also refer to our certificate of incorporation and bylaws, which will be filed with the Securities and Exchange Commission as exhibits to our registration statement, of which this prospectus forms a part.
General
Our authorized capital stock consists of 500,000,000 shares of common stock with a $0.001 par value per share, and 25,000,000 shares of preferred stock with a $0.001 par value per share, all of which shares of preferred stock are undesignated. Our board of directors may establish the rights and preferences of the preferred stock from time to time. As of December 31, 2015, there were 18,918,890 shares of common stock issued and outstanding, held of record by 245 stockholders.
Common stock
Each holder of our common stock is entitled to one vote for each share on all matters to be voted upon by the stockholders and there are no cumulative rights. Subject to any preferential rights of any outstanding preferred stock, holders of our common stock are entitled to receive ratably the dividends, if any, as may be declared from time to time by the board of directors out of legally available funds. If there is a liquidation, dissolution or winding up of our company, holders of our common stock would be entitled to share in our assets remaining after the payment of liabilities and any preferential rights of any outstanding preferred stock.
Holders of our common stock have no preemptive or conversion rights or other subscription rights, and there are no redemption or sinking fund provisions applicable to the common stock. All outstanding shares of our common stock will be fully paid and non-assessable. The rights, preferences and privileges of the holders of our common stock are subject to, and may be adversely affected by, the rights of the holders of shares of any series of preferred stock which we may designate and issue in the future.
Preferred stock
Under the terms of our certificate of incorporation, our board of directors is authorized to issue shares of preferred stock in one or more series without stockholder approval. Our board of directors has the discretion to determine the rights, preferences, privileges and restrictions, including voting rights, dividend rights, conversion rights, redemption privileges and liquidation preferences, of each series of preferred stock.
The purpose of authorizing our board of directors to issue preferred stock and determine its rights and preferences is to eliminate delays associated with a stockholder vote on specific issuances. The issuance of preferred stock, while providing flexibility in connection with possible future acquisitions and other corporate purposes, will affect, and may adversely affect, the rights of holders of common stock. It is not possible to state the actual effect of the issuance of any shares of preferred stock on the rights of holders of common stock until the board of directors determines the specific rights attached to that preferred stock. The effects of issuing preferred stock could include one or more of the following:
- •
- restricting dividends on the common stock;
- •
- diluting the voting power of the common stock;
- •
- impairing the liquidation rights of the common stock; or
124
- •
- delaying or preventing changes in control or management of our company.
We have no present plans to issue any shares of preferred stock.
Effect of certain provisions of our certificate of incorporation and bylaws and the Delaware anti-takeover statute
Certificate of incorporation and bylaws
Some provisions of Delaware law and our certificate of incorporation and bylaws contain provisions that could make the following transactions more difficult:
- •
- acquisition of us by means of a tender offer;
- •
- acquisition of us by means of a proxy contest or otherwise; or
- •
- removal of our incumbent officers and directors.
These provisions, summarized below, are expected to discourage coercive takeover practices and inadequate takeover bids and to promote stability in our management. These provisions are also designed to encourage persons seeking to acquire control of us to first negotiate with our board of directors.
- •
- Undesignated preferred stock. The ability to authorize
undesignated preferred stock makes it possible for our board of directors to issue one or more series of preferred stock with voting or other rights or preferences that could impede the success of any
attempt to change control. These and other provisions may have the effect of deferring hostile takeovers or delaying changes in control or management of our company.
- •
- Calling of special meetings of stockholders. Our charter
documents provide that a special meeting of stockholders may be called only by resolution adopted by our board of directors, chairman of the board of directors or chief executive officer.
- •
- Requirements for advance notification of stockholder nominations and
proposals. Our bylaws establish advance notice procedures with respect to stockholder proposals and the nomination of candidates for
election as directors, other than nominations made by or at the direction of the board of directors or a committee of the board of directors.
- •
- Board classification. Our board of directors is divided
into three classes. The directors in each class will serve for a three-year term, one class being elected each year by our stockholders and may only be removed for cause. This system of electing and
removing directors may tend to discourage a third party from making a tender offer or otherwise attempting to obtain control of us, because it generally makes it more difficult for stockholders to
replace a majority of the directors.
- •
- Limits on ability of stockholders to act by written
consent. We have provided in our certificate of incorporation that our stockholders may not act by written consent. This limit on the
ability of our stockholders to act by written consent may lengthen the amount of time required to take stockholder actions. As a result, a holder controlling a majority of our capital stock would not
be able to amend our bylaws or remove directors without holding a meeting of our stockholders called in accordance with our bylaws.
- •
- Amendment of certificate of incorporation and bylaws. The amendment of the above provisions of our certificate of incorporation and bylaws requires approval by holders of at least two-thirds of our outstanding capital stock entitled to vote generally in the election of directors.
125
Anti-takeover provisions
Section 203 of the Delaware General Corporation Law
Upon completion of this offering, we will be subject to the provisions of Section 203 of the Delaware General Corporation Law. In general, Section 203 prohibits a publicly held Delaware corporation from engaging in a "business combination" with an "interested stockholder" for a three-year period following the time that this stockholder becomes an interested stockholder, unless the business combination is approved in a prescribed manner. Under Section 203, a business combination between a corporation and an interested stockholder is prohibited unless it satisfies one of the following conditions:
- •
- before the stockholder became interested, our board of directors approved either the business combination or the transaction which
resulted in the stockholder becoming an interested stockholder;
- •
- upon consummation of the transaction which resulted in the stockholder becoming an interested stockholder, the interested stockholder
owned at least 85% of the voting stock of the corporation outstanding at the time the transaction commenced, excluding for purposes of determining the voting stock outstanding, shares owned by persons
who are directors and also officers, and employee stock plans, in some instances, but not the outstanding voting stock owned by the interested stockholder; or
- •
- at or after the time the stockholder became interested, the business combination was approved by our board of directors and authorized at an annual or special meeting of the stockholders by the affirmative vote of at least two-thirds of the outstanding voting stock which is not owned by the interested stockholder.
Section 203 defines a business combination to include:
- •
- any merger or consolidation involving the corporation and the interested stockholder;
- •
- any sale, transfer, lease, pledge or other disposition involving the interested stockholder of 10% or more of the assets of the
corporation;
- •
- subject to exceptions, any transaction that results in the issuance or transfer by the corporation of any stock of the corporation to
the interested stockholder;
- •
- subject to exceptions, any transaction involving the corporation that has the effect of increasing the proportionate share of the
stock of any class or series of the corporation beneficially owned by the interested stockholder; and
- •
- the receipt by the interested stockholder of the benefit of any loans, advances, guarantees, pledges or other financial benefits provided by or through the corporation.
In general, Section 203 defines an interested stockholder as any entity or person beneficially owning 15% or more of the outstanding voting stock of the corporation and any entity or person affiliated with or controlling or controlled by the entity or person.
Certain provisions of Delaware law, our certificate of incorporation and our bylaws contain provisions that could have the effect of delaying, deferring or discouraging another party from acquiring control of us. These provisions, which are summarized below, may have the effect of discouraging coercive takeover practices and inadequate takeover bids. These provisions are also designed, in part, to encourage persons seeking to acquire control of us to first negotiate with our board of directors. We believe that the benefits of increased protection of our potential ability to negotiate with an unfriendly or unsolicited acquiror outweigh the disadvantages of discouraging a
126
proposal to acquire us because negotiation of these proposals could result in an improvement of their terms.
Undesignated preferred stock
As discussed above, our board of directors has the ability to issue preferred stock with voting or other rights or preferences that could impede the success of any attempt to change control of us. These and other provisions may have the effect of deferring hostile takeovers or delaying changes in control or management of our company.
Limits on ability of stockholders to call a special meeting
Our bylaws provide that special meetings of the stockholders may be called only by the board of directors, the chairman of the board of directors or chief executive officer. A stockholder may not call a special meeting, which may delay the ability of our stockholders to force consideration of a proposal or for holders controlling a majority of our capital stock to take any action, including the removal of directors.
Requirements for advance notification of stockholder nominations and proposals
Our bylaws establish advance notice procedures with respect to stockholder proposals and the nomination of candidates for election as directors. However, our bylaws may have the effect of precluding the conduct of certain business at a meeting if the proper procedures are not followed. These provisions may also discourage or deter a potential acquiror from conducting a solicitation of proxies to elect the acquiror's own slate of directors or otherwise attempting to obtain control of our company.
No cumulative voting
The Delaware General Corporation Law provides that stockholders are not entitled to the right to cumulate votes in the election of directors unless our certificate of incorporation provides otherwise. Our certificate of incorporation and amended and restated bylaws do not expressly provide for cumulative voting.
Listing
We have applied for the listing of our common stock on the NASDAQ Global Market under the symbol "AMQ".
Transfer agent
Upon the completion of this offering, the transfer agent and registrar for our common stock will be American Stock Transfer & Trust Company, LLC. The transfer agent and registrar's address is 6201 15th Avenue, Brooklyn, NY 11219.
127
SHARES ELIGIBLE FOR FUTURE SALE
We will have 18,918,890 shares of common stock outstanding after the completion of this offering based on the number of shares outstanding on December 31, 2015 and assuming no exercise of outstanding options after such date. Of those shares, the 6,153,846 shares of common stock sold in the offering (7,076,922 shares if the underwriters exercise their option in full) will be freely transferable without restriction, unless purchased by persons deemed to be our "affiliates" as that term is defined in Rule 144 under the Securities Act. Any shares purchased by an affiliate may not be resold except pursuant to an effective registration statement or an applicable exemption from registration, including an exemption under Rule 144 promulgated under the Securities Act. The remaining 12,765,044 shares of common stock to be outstanding immediately following the completion of this offering are "restricted," which means they were originally sold in offerings that were not registered under the Securities Act. Restricted shares may be sold through registration under the Securities Act or under an available exemption from registration, such as provided through Rule 144, which rules are summarized below. Taking into account the lock-up agreements described below, and assuming the underwriters do not release any stockholders from the lock-up agreements, the restricted shares of our common stock will be available for sale in the public market as follows:
- •
- 2,361,068 shares will be eligible for sale immediately upon completion of this offering;
- •
- 152 shares will become eligible for sale, subject to the provisions of Rule 144 or Rule 701, beginning 90 days
after the date of this prospectus.
- •
- 10,403,824 shares will become eligible for sale, subject to the provisions of Rule 144 or Rule 701, upon the expiration of lock-up agreements not to sell such shares entered into between the underwriters and such stockholders beginning 180 days after the date of this prospectus, subject to extension in certain circumstances; and
Rule 144
In general, under Rule 144 of the Securities Act, as in effect on the date of this prospectus, a person (or persons whose shares are aggregated) who has beneficially owned restricted stock for at least six months, will be entitled to sell in any three-month period a number of shares that does not exceed the greater of:
- •
- 1% of the number of shares of common stock then outstanding (189,189 shares immediately after this offering); or
- •
- the average weekly trading volume of our common stock on the NASDAQ Global Market during the four calendar weeks immediately preceding the date on which the notice of sale is filed with the SEC.
Subject to the lock-up agreements described above, our affiliates who have beneficially owned shares of our common stock for at least six months, including the holding period of any prior owner other than one of our affiliates, will be entitled to sell within any three-month period a number of shares that does not exceed the greater of:
- •
- 1% of the number of shares of our common stock then outstanding, which will equal approximately 189,189 shares immediately after this
offering; and
- •
- the average weekly trading volume in our common stock on the NASDAQ Global Market during the four calendar weeks preceding the date of filing of a Notice of Proposed Sale of Securities Pursuant to Rule 144 with respect to the sale.
Sales pursuant to Rule 144 are subject to requirements relating to manner of sale, notice and availability of current public information about us. A person (or persons whose shares are aggregated)
128
who is not deemed to be an affiliate of ours for 90 days preceding a sale, and who has beneficially owned restricted stock for at least one year is entitled to sell such shares without complying with the manner of sale, public information, volume limitation or notice provisions of Rule 144. Rule 144 will not be available to any stockholders until we have been subject to the reporting requirements of the Exchange Act for 90 days.
Form S-8 registration statement
Promptly after the completion of this offering, we intend to file a registration statement on Form S-8 under the Securities Act to register the shares of our common stock that are issuable pursuant to our 2015 Equity Incentive Plan, 2015 Employee Stock Purchase Plan, Equity and Incentive Plan, 2011 Director Stock Purchase Plan and 2011 Employee Stock Purchase Plan. Shares covered by this registration statement shall be eligible for sale in the public markets, subject to vesting restrictions, any applicable lock-up agreements described below and Rule 144 limitations applicable to affiliates.
Rule 701
Rule 701 under the Securities Act, as in effect on the date of this prospectus, permits resale of shares in reliance upon Rule 144 but without compliance with certain restrictions of Rule 144, including the holding period requirement. Most of our employees, executive officers, directors or consultants who purchased shares under a written compensatory plan or contract may be entitled to rely on the resale provisions of Rule 701, but all holders of Rule 701 shares are required to wait until 90 days after the date of this prospectus before selling their shares. However, substantially all Rule 701 shares are subject to lock-up agreements as described below and under "Underwriting" included elsewhere in this prospectus and will become eligible for sale upon the expiration of the restrictions set forth in those agreements.
Lock-up agreements
All of the executive officers and directors and a substantial majority of our stockholders, including all of the selling stockholders, have agreed that, without the prior written consent of Raymond James & Associates, Inc. and Stephens Inc. on behalf of the underwriters, we and they will not, during the period ending 180 days after the date of this prospectus:
- •
- offer, pledge, sell, contract to sell, sell any option or contract to purchase, purchase any option or contract to sell, grant any
option, right or warrant to purchase, lend, or otherwise transfer or dispose of, directly or indirectly, any shares of our common stock or securities convertible into or exercisable or exchangeable
for our common stock; or
- •
- enter into any swap or other arrangement that transfers to another, in whole or in part, any of the economic consequences of ownership of our common stock;
whether any transaction described above is to be settled by delivery of shares of our common stock or such other securities, in cash or otherwise. This agreement is subject to certain exemptions, as set forth in the section entitled "Underwriting."
Rule 10b5-1 trading plans
Certain of our employees, including our executive officers, and/or directors, may enter into written trading plans that are intended to comply with Rule 10b5-1 under the Securities Exchange Act of 1934. Sales under these trading plans would not be permitted until the expiration of the lock-up agreements relating to the offering described above.
129
MATERIAL U.S. FEDERAL INCOME TAX CONSEQUENCES FOR NON-U.S. HOLDERS
This section summarizes the material U.S. federal income tax consequences of the ownership and disposition of our common stock by a non-U.S. holder. For purposes of this summary, a "non-U.S. holder" is any beneficial owner that for U.S. federal income tax purposes is not a U.S. person. The term "U.S. person" means:
- •
- an individual citizen or resident of the U.S.;
- •
- a corporation or entity treated as a corporation for U.S. federal income tax purposes, created or organized under the laws of the U.S.
or any state, including the District of Columbia, or otherwise treated as such for U.S. federal income tax purposes;
- •
- an estate whose income is subject to U.S. federal income tax regardless of source; or
- •
- a trust (i) whose administration is subject to the primary supervision of a court within the U.S. and which has one or more U.S. persons who have authority to control all substantive decisions of the trust or (ii) which has a valid election in effect under applicable U.S. Treasury regulations to be treated as a U.S. person.
Generally, an individual may be treated as a resident of the U.S. in any calendar year for U.S. federal income tax purposes by, among other ways, being present in the U.S. for at least 31 days in that calendar year and for an aggregate of at least 183 days during a three-year period ending in the current calendar year. For purposes of this calculation, such individual would count all of the days in which the individual was present in the current year, one-third of the days present in the immediately preceding year, and one-sixth of the days present in the second preceding year. Residents are taxed for U.S. federal income tax purposes as if they were citizens of the U.S.
This summary does not consider the tax consequences for partnerships, entities classified as a partnership for U.S. federal income tax purposes, or persons who hold their interests through a partnership or other entity classified as a partnership for U.S. federal income tax purposes. If a partnership, including any entity treated as a partnership for U.S. federal income tax purposes, is a beneficial owner of common stock, the tax treatment of a partner in the partnership will depend upon the status of the partner and the activities of the partnership. Partnerships that are beneficial owners of our common stock, and partners in such partnerships, should consult their tax advisors regarding the tax consequences to them of the ownership and disposition of our common stock.
This summary applies only to non-U.S. holders who acquire our common stock pursuant to this offering and who hold our common stock as a capital asset (generally property held for investment). This summary generally does not address tax considerations that may be relevant to particular investors because of their specific circumstances, or because they are subject to special rules. Certain former U.S. citizens or long-term residents, controlled foreign corporations, passive foreign investment companies, corporations that accumulate earnings to avoid U.S. federal income tax, life insurance companies, tax-exempt organizations, dealers in securities or currencies, brokers, banks or other financial institutions, certain trusts, hybrid entities, pension funds and investors that hold our common stock as part of a hedge, straddle or conversion transaction are among those categories of potential investors that are subject to special rules not covered in this discussion. This summary does not address any U.S. federal estate or gift tax consequences (except to the limited extent set forth below), state, local or non-U.S. tax consequences or the U.S. federal tax on net investment income. This summary does not provide a complete analysis of all potential tax considerations that may be relevant to a particular non-U.S. holder. The information provided below is based on existing authorities. These authorities may change, or the Internal Revenue Service, or IRS, might interpret the existing authorities differently. In either case, the tax considerations of owning or disposing of common stock could differ from those described below.
130
INVESTORS CONSIDERING THE PURCHASE OF COMMON STOCK SHOULD CONSULT THEIR OWN TAX ADVISORS REGARDING THE APPLICATION OF THE U.S. FEDERAL INCOME AND ESTATE TAX LAWS TO THEIR PARTICULAR SITUATIONS AND THE CONSEQUENCES OF OTHER U.S. FEDERAL, STATE, OR LOCAL OR NON-U.S. LAWS AND ANY APPLICABLE TAX TREATIES.
Dividends
As discussed under the section entitled "Dividend Policy", we do not expect to pay cash dividends on our common stock in the foreseeable future. If we make distributions of cash or property (other than certain distributions of our common stock) with respect to our common stock, such distributions will be treated as dividends for U.S. federal income tax purposes to the extent paid from our current or accumulated earnings and profits, as determined under U.S. federal income tax principles. To the extent those dividends exceed our current and accumulated earnings and profits, the dividends will constitute a return of capital and will first reduce a holder's basis, but not below zero, and then will be treated as gain from the sale of stock.
The gross amount of any dividend (out of earnings and profits) paid to a non-U.S. holder of common stock generally will be subject to U.S. withholding tax at a rate of 30% unless the holder is entitled to an exemption from or reduced rate of withholding under an applicable income tax treaty. In order to receive an exemption or a reduced treaty rate, prior to the payment of a dividend, a non-U.S. holder must provide us with an IRS Form W-8BEN or IRS Form W-8BEN-E (or successor form) certifying qualification for the exemption or reduced rate.
Dividends received by a non-U.S. holder that are effectively connected with a U.S. trade or business conducted by the non-U.S. holder (and dividends attributable to a non-U.S. holder's permanent establishment in the U.S. if an income tax treaty applies) are exempt from this withholding tax. To obtain this exemption, prior to the payment of a dividend, a non-U.S. holder must provide us with an IRS Form W-8ECI (or successor form) properly certifying this exemption. Effectively connected dividends (or dividends attributable to a permanent establishment in the U.S. if an income tax treaty applies), although not subject to withholding tax, are taxed at the same graduated rates applicable to U.S. persons, net of certain deductions and credits. In addition, dividends received by a corporate non-U.S. holder that are effectively connected with a U.S. trade or business of the corporate non-U.S. holder (or dividends attributable to a corporate non-U.S. holder's permanent establishment in the U.S. if an income tax treaty applies) may also be subject to a branch profits tax at a rate of 30% (or such lower rate as may be specified by an applicable income tax treaty).
A non-U.S. holder who provides us with an IRS Form W-8BEN, IRS Form W-8BEN-E or an IRS Form W-8ECI will be required to periodically update such form.
A non-U.S. holder of common stock that is eligible for a reduced rate of withholding tax pursuant to an income tax treaty may obtain a refund of any excess amounts currently withheld if an appropriate claim for refund is timely filed with the IRS.
Gain on disposition of common stock
Subject to the discussion below regarding foreign accounts, a non-U.S. holder will generally not be subject to U.S. federal income tax on any gains realized on the sale, exchange or other disposition of common stock unless:
- •
- the gain is effectively connected with a U.S. trade or business of the non-U.S. holder (or attributable to a permanent establishment in the U.S. if an income tax treaty applies), in which case the non-U.S. holder generally will be required to pay tax on the net gain derived from the sale under regular graduated U.S. federal income tax rates and, if the non-U.S. holder is a
131
- •
- the non-U.S. holder is an individual who is present in the U.S. for a period or periods aggregating 183 days or more during the
calendar year in which the sale or disposition occurs and certain other conditions are met, in which case the non-U.S. holder will be required to pay a flat 30% tax (or such lower rate as may be
specified by an applicable income tax treaty between the U.S. and such non-U.S. holder's country of residence) on the net gain derived from the disposition, which gain be offset by U.S. source capital
losses, if any, provided that the non-U.S. holder has timely filed U.S. federal income tax returns with respect to such losses; or
- •
- our common stock constitutes a U.S. real property interest by reason of our status as a "U.S. real property holding corporation" for U.S. federal income tax purposes at any time within the shorter of the five-year period preceding the disposition or the holder's holding period for our common stock. We believe that we are not currently, and we are not likely to become, a "U.S. real property holding corporation" for U.S. federal income tax purposes.
corporation, the branch profits tax may apply, at a 30% rate or such lower rate as may be specified by an applicable income tax treaty;
If we become a U.S. real property holding corporation after this offering, so long as our common stock is regularly traded on an established securities market and continues to be so traded, a non-U.S. holder will not be subject to U.S. federal income tax on gain recognized from the sale, exchange or other disposition of shares of our common stock as a result of such status unless (i) such holder actually or constructively owned more than 5% of our common stock at any time during the shorter of (A) the five-year period preceding the disposition, or (B) the holder's holding period for our common stock, and (ii) we were a U.S. real property holding corporation at any time during such period when the more than 5% ownership test was met. If any gain on your disposition is taxable because we are a U.S. real property holding corporation and your ownership of our common stock exceeds 5%, you will be taxed on such disposition generally in the manner applicable to U.S. persons. Any such non-U.S. holder that owns or has owned, actually or constructively, more than 5% of our common stock is urged to consult that holder's own tax advisor with respect to the particular tax consequences to such holder for the gain from the sale, exchange or other disposition of shares of our common stock if we were to be or to become a U.S. real property holding corporation.
Backup withholding and information reporting
Generally, we must report annually to the IRS the amount of dividends paid, the name and address of the recipient, and the amount, if any, of tax withheld. A similar report is sent to the recipient. Pursuant to tax treaties or other agreements, the IRS may make its reports available to tax authorities in the non-U.S. holder's country of residence.
Payments of dividends or of proceeds on the disposition of stock made to a non-U.S. holder may be subject to additional information reporting and backup withholding. Backup withholding will not apply if the non-U.S. holder establishes an exemption, for example, by properly certifying its non-U.S. person status on an IRS Form W-8BEN or IRS Form W-8BEN-E (or successor form). Notwithstanding the foregoing, backup withholding may apply if either we or our paying agent has actual knowledge, or reason to know, that the holder is a U.S. person.
Backup withholding is not an additional tax. Rather, the U.S. federal income tax liability of persons subject to backup withholding will be reduced by the amount of tax withheld. If withholding results in an overpayment of taxes, a credit or refund may be obtained from the IRS, provided that the required information is furnished to the IRS in a timely manner.
132
Foreign accounts
The Foreign Account Tax Compliance Act (FATCA) imposes a 30% U.S. federal withholding tax on dividends on stock of U.S. corporations, and on the gross proceeds from the disposition of such stock, paid to a "foreign financial institution" (as specially defined for this purpose), unless such institution enters into an agreement with the U.S. Treasury to collect and provide to the U.S. Treasury substantial information regarding its U.S. account holders and certain account holders that are foreign entities with U.S. owners. A 30% U.S. federal withholding tax will also generally apply to dividends paid on stock of U.S. corporations and on the gross proceeds from the disposition of such stock paid to a non-financial foreign entity unless such entity provides the withholding agent with a certification that it does not have any substantial U.S. owners or a certification identifying the direct and indirect substantial U.S. owners of the entity. The withholding taxes described above generally apply to dividend payments made after June 30, 2014 and payments of gross proceeds made after December 31, 2016. Under certain circumstances, a non-U.S. holder may be eligible for refunds or credits of such withholding taxes. Investors are urged to consult with their own tax advisors regarding the possible application of these rules to their investment in our common stock.
U.S. federal estate tax
The estates of nonresident alien individuals are generally subject to U.S. federal estate tax on property with a U.S. situs. Because we are a U.S. corporation, our common stock will be U.S. situs property and therefore will be included in the taxable estate of a nonresident alien decedent. The U.S. federal estate tax liability of the estate of a nonresident alien may be affected by a tax treaty between the U.S. and the decedent's country of residence.
133
Under the terms and subject to the conditions in an underwriting agreement dated the date of this prospectus, the underwriters named below, for whom Raymond James & Associates, Inc. and Stephens Inc. are acting as representatives, have severally agreed to purchase, and we have agreed to sell to them the number of shares indicated as follows:
Underwriter
|
Number of Shares | |||
|---|---|---|---|---|
Raymond James & Associates, Inc. |
||||
Stephens Inc. |
||||
Robert W. Baird & Co. Incorporated |
||||
William Blair & Company, L.L.C. |
||||
| | | | | |
Total |
6,153,846 | |||
| | | | | |
| | | | | |
| | | | | |
The underwriters and the representatives are collectively referred to as the "underwriters" and the "representatives," respectively. The underwriters are offering the shares of common stock subject to their acceptance of the shares from us and subject to prior sale and their right to reject any order in whole or in part. The underwriting agreement provides that the obligations of the several underwriters to pay for and accept delivery of the shares of common stock offered by this prospectus are subject to the approval of certain legal matters by their counsel and to certain other conditions. The underwriters are obligated to take and pay for all of the shares of common stock offered by this prospectus if any such shares are taken. However, the underwriters are not required to take or pay for the shares covered by the underwriters' option to purchase additional shares described below.
The underwriters initially propose to offer part of the shares of common stock directly to the public at the offering price listed on the cover page of this prospectus and part to certain dealers. After the initial offering of the shares of common stock, the offering price and other selling terms may from time to time be varied by the representatives.
The selling stockholders have granted to the underwriters an option, exercisable for 30 days from the date of this prospectus, to purchase up to 923,076 additional shares of common stock at the public offering price listed on the cover page of this prospectus, less underwriting discounts and commissions all of which will be sold by the selling stockholders. To the extent the option is exercised, each underwriter will become obligated, subject to certain conditions, to purchase about the same percentage of the additional shares of common stock as the number listed next to the underwriter's name in the preceding table bears to the total number of shares of common stock listed next to the names of all underwriters in the preceding table.
The following table shows the per share and total public offering price, underwriting discounts and commissions, and proceeds before expenses to us and the selling stockholders. These amounts are shown assuming both no exercise and full exercise of the underwriters' option to purchase up to an additional 923,076 shares of common stock sold by the selling stockholders.
| |
|
Total | ||||||||
|---|---|---|---|---|---|---|---|---|---|---|
| |
Per Share | No Exercise | Full Exercise | |||||||
Public offering price |
$ | $ | $ | |||||||
Underwriting discounts and commissions to be paid by: |
||||||||||
Us |
$ | $ | $ | |||||||
The selling stockholders |
$ | $ | $ | |||||||
Proceeds, before expenses, to: |
||||||||||
Us |
$ | $ | $ | |||||||
The selling stockholders |
$ | $ | $ | |||||||
The estimated offering expenses payable by us, exclusive of the underwriting discounts and commissions, are approximately $5.1 million. We have agreed to reimburse the underwriters for
134
expenses relating to clearance of this offering with the Financial Industry Regulatory Authority up to $30,000. We have also agreed to reimburse the underwriters for additional miscellaneous offering expenses in an amount up to $140,000.
The underwriters have informed us that they do not intend sales to discretionary accounts to exceed 5% of the total number of shares of common stock offered by them.
We have applied to list our common stock on the NASDAQ Global Market under the trading symbol "AMQ."
We, all of the executive officers, directors and certain stockholders, including all the selling stockholders, have agreed that, without the prior written consent of Raymond James & Associates, Inc. and Stephens Inc. on behalf of the underwriters, we and they will not, during the period ending 180 days after the date of this prospectus, or the restricted period:
- •
- offer, pledge, sell, contract to sell, sell any option or contract to purchase, purchase any option or contract to sell, grant any
option, right or warrant to purchase, lend or otherwise transfer or dispose of, directly or indirectly, any shares of common stock or any securities convertible into or exercisable or exchangeable for
shares of common stock;
- •
- file any registration statement with the Securities and Exchange Commission relating to the offering of any shares of common stock or
any securities convertible into or exercisable or exchangeable for common stock; or
- •
- enter into any swap or other arrangement that transfers to another, in whole or in part, any of the economic consequences of ownership of the common stock.
whether any such transaction described above is to be settled by delivery of common stock or such other securities, in cash or otherwise. In addition, we and each such person agrees that, without the prior written consent of Raymond James & Associates, Inc. and Stephens Inc. on behalf of the underwriters, we or such other person will not, during the restricted period, make any demand for, or exercise any right with respect to, the registration of any shares of common stock or any security convertible into or exercisable or exchangeable for common stock other than a registration statement on Form S-8 with respect to our 2015 Equity Incentive Plan, 2015 Employee Stock Purchase Plan, Equity and Incentive Plan, 2011 Director Stock Purchase Plan and 2011 Employee Stock Purchase Plan described in this prospectus.
The lock-up restrictions described in the foregoing do not apply to us, our directors, officers and holders of substantially all of our outstanding stock, including all the selling stockholders, stock options and warrants with respect to, among other things:
- (1)
- the
sale of shares being offered pursuant to this prospectus;
- (2)
- the
issuance of shares upon the exercise of an option or warrant, settlement of a restricted stock unit or the conversion of a security outstanding prior to
the effective date of the registration statement for this offering pursuant to stock plans or other agreements and disclosed herein;
- (3)
- the
issuance by us of shares or options to purchase shares pursuant to our equity plans disclosed herein;
- (4)
- sales
of shares to us pursuant to the terms of our Shareholders Agreement as disclosed herein;
- (5)
- transfers of shares (i) to the spouse, domestic partner, parent, sibling, child or grandchild (each, an "immediate family member") of the undersigned or to a trust formed for the benefit of the undersigned and/or an immediate family member of the undersigned, or (ii) by bona fide gift, will or intestacy;
135
- (6)
- the
exchange of shares with us in connection with our corporate reorganization as described in "Prospectus Summary—Corporate information and
reorganization;"
- (7)
- distributions
of shares to partners, members, or stockholders of a stockholder or to another corporation, partnership or other business entity that
controls, is controlled by or managed by or is under common control of such entity;
- (8)
- the
establishment of a trading plan pursuant to Rule 10b5-1 under the Exchange Act for the transfer of shares;
- (9)
- the
disposition of shares to us, or the withholding of shares by us, in a transaction exempt from Section 16(b) of the Exchange Act solely in
connection with the payment of taxes due with respect to the vesting of restricted stock or restricted stock units or the exercise of stock options, insofar as such restricted stock, restricted stock
units or stock options is or are outstanding as of the effective date of the registration statement for this offering;
- (10)
- transfers
of shares to us in connection with the repurchase of shares issued pursuant to employee benefit plans disclosed herein or pursuant to agreements
pursuant to which such shares were issued; and
- (11)
- transactions relating to shares acquired in open market transactions after the completion of this offering;
provided that with respect to clauses (2), (3), (5) and (7), no public reports, including but not limited to filings under Section 16 of the Exchange Act, will be required to be filed or will be voluntarily made within 30 days after the effective date of the registration statement for this offering; provided further, that with respect to clause (4), any public reports, including but not limited to filings under Section 16 of the Exchange Act, required to be filed or voluntarily made shall include a footnote indicating that the disposition was solely due to the exercise of our contractual rights pursuant to the terms of our Shareholders Agreement; provided further that in the case of any transfer pursuant to clause (5) and (7), each donee or transferee shall sign and deliver a lock up letter substantially in the same form as the prior holder; provided further that with respect to clause (8), such plan does not provide for the transfer of shares during the restricted period and to the extent a public announcement or filing under the Exchange Act, if any, is required of or voluntarily made by or on behalf of the stockholder or us regarding the establishment of such plan, such announcement or filing shall include a statement to the effect that no transfer of shares may be made under such plan during the restricted period; provided further that with respect to clause (9), no public reports, including but not limited to filings under Section 16 of the Exchange Act, will be required to be filed or will be voluntarily made by the undersigned within 30 days after the effective date of the registration statement for this offering, and after such 30th day, if required, any public report or filing under Section 16 of the Exchange Act shall clearly indicate in the footnotes thereto that the filing relates to the payment of taxes due with respect to the vesting of restricted stock or restricted stock units and that no shares were sold by the reporting person; and provided further that with respect to clause (11), no public reports, including but not limited to filings under Section 16 of the Exchange Act, will be required to be filed or will be voluntarily made by the stockholder in connection with the acquisition and subsequent disposition of shares acquired in such open market transactions during the restricted period.
Raymond James & Associates, Inc. and Stephens Inc., in their sole discretion, may release the common stock and other securities subject to the lock-up agreements described above in whole or in part at any time with or without notice. If any such release applies to one of our executive officers or directors, at least three business days before the release or waiver of any applicable lock-up, Raymond James & Associates, Inc. and Stephens Inc. will notify us of the impending release or waiver and at least two business days before such time, we will announce the impending release or waiver through a major news service, except where the release or waiver is effected solely to permit a transfer of securities that is not for consideration and where the transferee has agreed in writing to be bound by the same lock-up agreement terms in place for the transferor.
136
In order to facilitate the offering of the common stock, the underwriters may engage in transactions that stabilize, maintain or otherwise affect the price of the common stock. Specifically, the underwriters may sell more shares than they are obligated to purchase under the underwriting agreement, creating a short position. A short sale is covered if the short position is no greater than the number of shares available for purchase by the underwriters under the option. The underwriters can close out a covered short sale by exercising the option or purchasing shares in the open market. In determining the source of shares to close out a covered short sale, the underwriters will consider, among other things, the open market price of shares compared to the price available under the option. The underwriters may also sell shares in excess of the option, creating a naked short position. The underwriters must close out any naked short position by purchasing shares in the open market. A naked short position is more likely to be created if the underwriters are concerned that there may be downward pressure on the price of the common stock in the open market after pricing that could adversely affect investors who purchase in this offering. As an additional means of facilitating this offering, the underwriters may bid for, and purchase, shares of common stock in the open market to stabilize the price of the common stock. These activities may raise or maintain the market price of the common stock above independent market levels or prevent or retard a decline in the market price of the common stock. The underwriters are not required to engage in these activities and may end any of these activities at any time.
We, the selling stockholders, and the several underwriters have agreed to indemnify each other against certain liabilities, including liabilities under the Securities Act.
A prospectus in electronic format may be made available on websites maintained by one or more underwriters, or selling group members, if any, participating in this offering. The representative may agree to allocate a number of shares of common stock to underwriters for sale to their online brokerage account holders. Internet distributions will be allocated by the representative to underwriters that may make Internet distributions on the same basis as other allocations.
The underwriters and their respective affiliates are full service financial institutions engaged in various activities, which may include securities trading, commercial and investment banking, financial advisory, investment management, principal investment, hedging, financing and brokerage activities. Certain of the underwriters and their respective affiliates have, from time to time, performed, and may in the future perform, various financial advisory and investment banking services for us or our affiliates, for which they received or will receive customary fees and expenses.
In the ordinary course of their various business activities, the underwriters and their respective affiliates may make or hold a broad array of investments and actively trade debt and equity securities (or related derivative securities) and financial instruments (including bank loans) for their own account and for the accounts of their customers and may at any time hold long and short positions in such securities and instruments. Such investment and securities activities may involve our securities and instruments (directly, as collateral securing other obligations or otherwise). The underwriters and their respective affiliates may also make investment recommendations and/or publish or express independent research views in respect of such securities or instruments and may at any time hold, or recommend to clients that they acquire, long and/or short positions in such securities and instruments.
In the ordinary course of business, we have sold, and may in the future sell, products or services to one or more of the underwriters or their respective affiliates in arms-length transactions on market competitive terms.
Pricing of the offering
Prior to this offering, there has been no public market for our common stock. The initial public offering price was determined by negotiations between us and the representative. Among the factors considered in determining the initial public offering price were our future prospects and those of our industry in general, our sales, earnings and certain other financial and operating information in recent
137
periods, and the price-earnings ratios, price-sales ratios, market prices of securities, and certain financial and operating information of companies engaged in activities similar to ours.
Directed Share Program
At our request, the underwriters have reserved up to 5.0% of the shares of common stock to be issued by us and offered by this prospectus for sale, at the initial public offering price, to our directors, officers, employees, business associates, including certain of our customers, suppliers and other persons with which we have an existing business relationship. If purchased by these persons, these shares will be subject to a 180-day lock-up restriction. The number of shares of common stock available for sale to the general public will be reduced to the extent these individuals purchase such reserved shares. Any reserved shares that are not so purchased will be offered by the underwriters to the general public on the same basis as the other shares offered by this prospectus.
Selling restrictions
European economic area
In relation to each Member State of the European Economic Area which has implemented the Prospectus Directive (each, a "Relevant Member State") an offer to the public of any shares of our common stock may not be made in that Relevant Member State, except that an offer to the public in that Relevant Member State of any shares of our common stock may be made at any time under the following exemptions under the Prospectus Directive, if they have been implemented in that Relevant Member State:
- (a)
- to
any legal entity which is a qualified investor as defined in the Prospectus Directive;
- (b)
- to
fewer than 100 or, if the Relevant Member State has implemented the relevant provision of the 2010 PD Amending Directive, 150, natural or legal persons
(other than qualified investors as defined in the Prospectus Directive), as permitted under the Prospectus Directive, subject to obtaining the prior consent of the representatives for any such offer;
or
- (c)
- in any other circumstances falling within Article 3(2) of the Prospectus Directive, provided that no such offer of shares of our common stock shall result in a requirement for the publication by us or any underwriter of a prospectus pursuant to Article 3 of the Prospectus Directive.
For the purposes of this provision, the expression an "offer to the public" in relation to any shares of our common stock in any Relevant Member State means the communication in any form and by any means of sufficient information on the terms of the offer and any shares of our common stock to be offered so as to enable an investor to decide to purchase any shares of our common stock, as the same may be varied in that Member State by any measure implementing the Prospectus Directive in that Member State, the expression "Prospectus Directive" means Directive 2003/71/EC (and amendments thereto, including the 2010 PD Amending Directive, to the extent implemented in the Relevant Member State), and includes any relevant implementing measure in the Relevant Member State, and the expression "2010 PD Amending Directive" means Directive 2010/73/EU.
Canada
The shares of our common stock may be sold only to purchasers purchasing, or deemed to be purchasing, as principal that are accredited investors, as defined in National Instrument 45-106 Prospectus Exemptions or subsection 73.3(1) of the Securities Act (Ontario), and are permitted clients, as defined in National Instrument 31-103 Registration Requirements, Exemptions and Ongoing Registrant Obligations. Any resale of the shares of our common stock must be made in accordance with an exemption from, or in a transaction not subject to, the prospectus requirements of applicable securities laws.
138
Securities legislation in certain provinces or territories of Canada may provide a purchaser with remedies for rescission or damages if this prospectus (including any amendment thereto) contains a misrepresentation, provided that the remedies for rescission or damages are exercised by the purchaser within the time limit prescribed by the securities legislation of the purchaser's province or territory. The purchaser should refer to any applicable provisions of the securities legislation of the purchaser's province or territory for particulars of these rights or consult with a legal advisor.
Pursuant to section 3A.3 of National Instrument 33-105 Underwriting Conflicts (NI 33-105), the underwriters are not required to comply with the disclosure requirements of NI 33-105 regarding underwriter conflicts of interest in connection with this offering.
United Kingdom
Each underwriter has represented and agreed that:
- (a)
- it
has only communicated or caused to be communicated and will only communicate or cause to be communicated an invitation or inducement to engage in
investment activity (within the meaning of Section 21 of the FSMA) received by it in connection with the issue or sale of the shares of our common stock in circumstances in which
Section 21(1) of the FSMA does not apply to us; and
- (b)
- it has complied and will comply with all applicable provisions of the FSMA with respect to anything done by it in relation to the shares of our common stock in, from or otherwise involving the United Kingdom.
Hong Kong
The shares may not be offered or sold by means of any document other than (i) in circumstances which do not constitute an offer to the public within the meaning of the Companies Ordinance (Cap.32, Laws of Hong Kong), or (ii) to "professional investors" within the meaning of the Securities and Futures Ordinance (Cap.571, Laws of Hong Kong) and any rules made thereunder, or (iii) in other circumstances which do not result in the document being a "prospectus" within the meaning of the Companies Ordinance (Cap.32, Laws of Hong Kong), and no advertisement, invitation or document relating to the shares may be issued or may be in the possession of any person for the purpose of issue (in each case whether in Hong Kong or elsewhere), which is directed at, or the contents of which are likely to be accessed or read by, the public in Hong Kong (except if permitted to do so under the laws of Hong Kong) other than with respect to shares which are or are intended to be disposed of only to persons outside Hong Kong or only to "professional investors" within the meaning of the Securities and Futures Ordinance (Cap. 571, Laws of Hong Kong) and any rules made thereunder.
Singapore
This prospectus has not been registered as a prospectus with the Monetary Authority of Singapore. Accordingly, this prospectus and any other document or material in connection with the offer or sale, or invitation for subscription or purchase, of the shares may not be circulated or distributed, nor may the shares be offered or sold, or be made the subject of an invitation for subscription or purchase, whether directly or indirectly, to persons in Singapore other than (i) to an institutional investor under Section 274 of the Securities and Futures Act, Chapter 289 of Singapore, or the SFA, (ii) to a relevant person, or any person pursuant to Section 275(1A), and in accordance with the conditions, specified in Section 275 of the SFA or (iii) otherwise pursuant to, and in accordance with the conditions of, any other applicable provision of the SFA.
Where the shares are subscribed or purchased under Section 275 by a relevant person which is: (a) a corporation (which is not an accredited investor) the sole business of which is to hold investments and the entire share capital of which is owned by one or more individuals, each of whom is an accredited investor; or (b) a trust (where the trustee is not an accredited investor) whose sole purpose
139
is to hold investments and each beneficiary is an accredited investor, shares, debentures and units of shares and debentures of that corporation or the beneficiaries' rights and interest in that trust shall not be transferable for 6 months after that corporation or that trust has acquired the shares under Section 275 except: (1) to an institutional investor under Section 274 of the SFA or to a relevant person, or any person pursuant to Section 275(1A), and in accordance with the conditions, specified in Section 275 of the SFA; (2) where no consideration is given for the transfer; or (3) by operation of law.
Japan
The securities have not been and will not be registered under the Financial Instruments and Exchange Law of Japan (the Financial Instruments and Exchange Law) and each underwriter has agreed that it will not offer or sell any securities, directly or indirectly, in Japan or to, or for the benefit of, any resident of Japan (which term as used herein means any person resident in Japan, including any corporation or other entity organized under the laws of Japan), or to others for re-offering or resale, directly or indirectly, in Japan or to a resident of Japan, except pursuant to an exemption from the registration requirements of, and otherwise in compliance with, the Financial Instruments and Exchange Law and any other applicable laws, regulations and ministerial guidelines of Japan.
140
The validity of the shares of common stock offered hereby has been passed upon for the issuer by Wilson Sonsini Goodrich & Rosati, Professional Corporation, Washington, D.C. The underwriters have been represented in connection with this offering by King & Spalding LLP, Atlanta, Georgia.
The consolidated financial statements of AmeriQuest, Inc. as of December 31, 2013 and 2014, and for each of the three years in the period ended December 31, 2014, appearing in this prospectus and registration statement have been audited by Ernst & Young LLP, independent registered public accounting firm, as set forth in their report thereon appearing elsewhere herein, and are included in reliance upon such report given on the authority of such firm as experts in accounting and auditing.
WHERE YOU CAN FIND ADDITIONAL INFORMATION
We have filed a registration statement on Form S-1 for the common stock we are offering pursuant to this prospectus. The rules and regulations of the SEC allow us to omit certain information from this prospectus that is included in the registration statement. Statements made in this prospectus concerning the contents of any contract, agreement or other document are summaries of all material information about the contract, agreement or other document summarized, but are not complete descriptions of all terms of those contracts, agreements or other documents. If we filed any of those contracts, agreements or other documents as an exhibit to the registration statement, you may read the contract, agreement or other document itself for a complete description of its terms. When we complete this offering, we will also be required to file annual, quarterly and special reports, proxy statements and other information with the SEC.
You can read our SEC filings, including the registration statement, over the Internet at the SEC's website at www.sec.gov. You may also read and copy any document we file with the SEC at its public reference facilities at 100 F Street, N.E., Room 1580, Washington, D.C. 20549. To receive copies of public records not posted to the SEC's web site at prescribed rates, you may complete an online form at http://www.sec.gov, send a fax to (202) 772-9337 or submit a written request to the SEC, Office of FOIA/PA Operations, 100 F Street, N.E., Mail Stop 2736, Washington, D.C. 20549. Please call the SEC at 1-800-SEC-0330 for further information on their public reference room.
141
AMERIQUEST, INC.
Index to Consolidated Financial Statements
F-1
Report of Independent Registered Public Accounting Firm
The Board of Directors and Stockholders of Ameriquest, Inc.
We have audited the accompanying consolidated financial statements of Ameriquest, Inc. (the Company), which comprise the consolidated balance sheets as of December 31, 2014 and 2013, and the related consolidated statements of income, changes in redeemable common stock and stockholders' equity and cash flows for each of the three years in the period ended December 31, 2014, and the related notes to the consolidated financial statements. These financial statements are the responsibility of the Company's management. Our responsibility is to express an opinion on these financial statements based on our audits.
We conducted our audits in accordance with the standards of the Public Company Accounting Oversight Board (United States). Those standards require that we plan and perform the audit to obtain reasonable assurance about whether the financial statements are free of material misstatement. We were not engaged to perform an audit of the Company's internal control over financial reporting. Our audits included consideration of internal control over financial reporting as a basis for designing audit procedures that are appropriate in the circumstances, but not for the purpose of expressing an opinion on the effectiveness of the Company's internal control over financial reporting. Accordingly, we express no such opinion. An audit also includes examining, on a test basis, evidence supporting the amounts and disclosures in the financial statements, assessing the accounting principles used and significant estimates made by management, and evaluating the overall financial statement presentation. We believe that our audits provide a reasonable basis for our opinion.
In our opinion, the financial statements referred to above present fairly, in all material respects, the financial position of Ameriquest, Inc. at December 31, 2014 and 2013, and the consolidated results of its operations and its cash flows for each of the three years in the period ended December 31, 2014 in conformity with U.S. generally accepted accounting principles.
| /s/ Ernst & Young LLP |
Philadelphia, Pennsylvania
April 29, 2015, except for Note 1, as to which
the date is January 12, 2016
F-2
AmeriQuest, Inc.
Consolidated Balance Sheets
(in thousands except share and per share data)
| |
December 31, | ||||||
|---|---|---|---|---|---|---|---|
| |
2013 | 2014 | |||||
Assets |
|||||||
Current assets: |
|||||||
Cash and cash equivalents |
$ | 22,300 | $ | 25,673 | |||
Accounts receivable, net |
101,300 | 116,955 | |||||
Rebates, fees and other receivables |
8,743 | 9,819 | |||||
Inventories, prepaid expenses and other current assets |
5,979 | 7,180 | |||||
| | | | | | | | |
Total current assets |
138,322 | 159,627 | |||||
Property, equipment and revenue-earning equipment, net |
40,262 | 40,703 | |||||
Goodwill |
10,306 | 10,306 | |||||
Other intangible assets, net |
572 | 543 | |||||
Other assets |
2,048 | 3,883 | |||||
| | | | | | | | |
Total assets |
$ | 191,510 | $ | 215,062 | |||
| | | | | | | | |
| | | | | | | | |
| | | | | | | | |
Liabilities and stockholders' equity |
|||||||
Current liabilities: |
|||||||
Current portion of long-term debt |
$ | 5,926 | $ | 5,786 | |||
Accounts payable |
73,154 | 86,666 | |||||
Rebates payable |
9,372 | 11,127 | |||||
Accrued expenses and other current liabilities |
7,331 | 9,472 | |||||
| | | | | | | | |
Total current liabilities |
95,783 | 113,051 | |||||
Long-term debt |
64,761 | 60,297 | |||||
Deferred income taxes |
7,077 | 10,695 | |||||
Other liabilities |
504 | 608 | |||||
| | | | | | | | |
Total liabilities |
168,125 | 184,651 | |||||
Redeemable common stock—$0.001 par value 9,456,812 shares issued and outstanding at December 31, 2013; 9,474,596 shares issued and outstanding at December 31, 2014 |
8,266 | 8,344 | |||||
Stockholders' equity: |
|||||||
Common stock—$0.001 par value per share; 500,000,000 shares authorized; 5,019,680 shares issued and 3,053,412 shares outstanding at December 31, 2013; 5,160,396 shares issued and 3,132,088 shares outstanding at December 31, 2014 |
3 | 3 | |||||
Additional paid-in capital |
3,917 | 4,288 | |||||
Retained earnings |
15,368 | 22,196 | |||||
Treasury stock at cost, 1,966,268 and 2,028,308 shares at December 31, 2013 and 2014, respectively |
(4,169 | ) | (4,420 | ) | |||
| | | | | | | | |
Total stockholders' equity |
15,119 | 22,067 | |||||
| | | | | | | | |
Total liabilities, redeemable common stock and stockholders' equity |
$ | 191,510 | $ | 215,062 | |||
| | | | | | | | |
| | | | | | | | |
| | | | | | | | |
See accompanying notes to consolidated financial statements
F-3
AmeriQuest, Inc.
Consolidated Statements of Income
(in thousands except share and per share data)
| |
Year Ended December 31, | |||||||||
|---|---|---|---|---|---|---|---|---|---|---|
| |
2012 | 2013 | 2014 | |||||||
Revenue: |
||||||||||
Financial process automation solutions |
$ | 8,440 | $ | 18,914 | $ | 24,073 | ||||
Procurement solutions |
10,021 | 10,391 | 12,071 | |||||||
Asset management solutions: |
||||||||||
Sales of equipment |
16,452 | 14,885 | 23,620 | |||||||
Service revenue |
11,319 | 12,220 | 14,814 | |||||||
Operating lease revenue |
11,322 | 10,974 | 10,218 | |||||||
| | | | | | | | | | | |
Total revenue |
57,554 | 67,384 | 84,796 | |||||||
| | | | | | | | | | | |
Direct costs of revenue (excluding depreciation and amortization shown separately below): |
||||||||||
Financial process automation solutions |
3,918 | 7,518 | 8,291 | |||||||
Procurement solutions |
928 | 1,124 | 1,200 | |||||||
Asset management solutions: |
||||||||||
Cost of equipment sold |
15,224 | 14,103 | 22,437 | |||||||
Direct cost of service and leasing revenue |
7,160 | 4,096 | 4,346 | |||||||
| | | | | | | | | | | |
Total direct costs of revenue |
27,230 | 26,841 | 36,274 | |||||||
Operating Expenses: |
||||||||||
Sales and marketing |
11,497 | 12,491 | 15,100 | |||||||
General and administrative |
6,345 | 6,784 | 7,902 | |||||||
Depreciation and amortization |
10,341 | 10,191 | 10,622 | |||||||
| | | | | | | | | | | |
Total operating expenses |
28,183 | 29,466 | 33,624 | |||||||
| | | | | | | | | | | |
Operating income |
2,141 | 11,077 | 14,898 | |||||||
Interest expense |
(1,280 | ) | (3,239 | ) | (3,296 | ) | ||||
Interest income |
68 | 80 | 110 | |||||||
Foreign exchange (loss) gain |
43 | (382 | ) | (639 | ) | |||||
| | | | | | | | | | | |
Income before income taxes |
972 | 7,536 | 11,073 | |||||||
Provision for income taxes |
344 | 2,893 | 4,245 | |||||||
| | | | | | | | | | | |
Net income |
$ | 628 | $ | 4,643 | $ | 6,828 | ||||
| | | | | | | | | | | |
| | | | | | | | | | | |
| | | | | | | | | | | |
Basic income per common share |
$ | 0.05 | $ | 0.37 | $ | 0.54 | ||||
| | | | | | | | | | | |
| | | | | | | | | | | |
| | | | | | | | | | | |
Diluted income per common share |
$ | 0.05 | $ | 0.36 | $ | 0.52 | ||||
| | | | | | | | | | | |
| | | | | | | | | | | |
| | | | | | | | | | | |
Pro Forma diluted income per common share (note 14) |
$ | 0.49 | ||||||||
Weighted average shares outstanding: |
||||||||||
Basic shares |
12,511,328 | 12,406,060 | 12,578,160 | |||||||
| | | | | | | | | | | |
| | | | | | | | | | | |
| | | | | | | | | | | |
Diluted shares |
13,016,692 | 12,954,940 | 13,132,868 | |||||||
| | | | | | | | | | | |
| | | | | | | | | | | |
| | | | | | | | | | | |
Pro Forma diluted shares (note 14) |
13,910,464 | |||||||||
See accompanying notes to consolidated financial statements
F-4
AmeriQuest, Inc.
Consolidated Statement of Changes in Redeemable Common Stock and Stockholders' Equity
(in thousands, except share data)
| |
|
|
Stockholders' Equity | |||||||||||||||||||||||||
|---|---|---|---|---|---|---|---|---|---|---|---|---|---|---|---|---|---|---|---|---|---|---|---|---|---|---|---|---|
| |
Redeemable Common Stock |
|
|
|
|
Treasury Stock at Cost |
|
|||||||||||||||||||||
| |
Common Stock | |
|
|
||||||||||||||||||||||||
| |
Additional Paid In Capital |
Retained Earnings |
|
|||||||||||||||||||||||||
| |
Shares | Amount | Shares | Amount | Shares | Amount | Total | |||||||||||||||||||||
Balance at December 31, 2011 |
9,526,728 | $ | 8,441 | 4,522,184 | $ | 3 | $ | 2,506 | $ | 10,097 | 1,374,120 | $ | (2,826 | ) | $ | 9,780 | ||||||||||||
Employee stock purchases |
2,484 | 4 | 107,876 | — | 235 | — | — | — | 235 | |||||||||||||||||||
Non-employee stock purchases |
4,000 | 8 | 6,000 | — | 12 | — | — | — | 12 | |||||||||||||||||||
Stock-based compensation |
— | — | 8,888 | — | 62 | — | — | — | 62 | |||||||||||||||||||
Repurchases of common stock |
(194,276 | ) | (486 | ) | 194,276 | — | 486 | — | 552,612 | (1,241 | ) | (755 | ) | |||||||||||||||
Net income |
— | — | — | — | — | 628 | — | — | 628 | |||||||||||||||||||
| | | | | | | | | | | | | | | | | | | | | | | | | | | | | |
Balance at December 31, 2012 |
9,338,936 | 7,967 | 4,839,224 | 3 | 3,301 | 10,725 | 1,926,732 | (4,067 | ) | 9,962 | ||||||||||||||||||
Employee stock purchases |
71,780 |
168 |
52,024 |
— |
121 |
— |
— |
— |
121 |
|||||||||||||||||||
Non-employee stock purchases |
68,792 | 176 | 74,808 | — | 219 | — | — | — | 219 | |||||||||||||||||||
Stock-based compensation |
5,156 | 25 | 25,772 | — | 206 | — | — | — | 206 | |||||||||||||||||||
Repurchases of common stock |
(27,852 | ) | (70 | ) | 27,852 | — | 70 | — | 39,536 | (102 | ) | (32 | ) | |||||||||||||||
Net income |
— | — | — | — | — | 4,643 | — | — | 4,643 | |||||||||||||||||||
| | | | | | | | | | | | | | | | | | | | | | | | | | | | | |
Balance at December 31, 2013 |
9,456,812 | 8,266 | 5,019,680 | 3 | 3,917 | 15,368 | 1,966,268 | (4,169 | ) | 15,119 | ||||||||||||||||||
Employee stock purchases |
2,400 | 10 | 44,364 | — | 189 | — | — | — | 189 | |||||||||||||||||||
Stock-based compensation |
28,176 | 100 | 83,560 | — | 150 | — | — | — | 150 | |||||||||||||||||||
Repurchases of common stock |
(12,792 | ) | (32 | ) | 12,792 | — | 32 | — | 62,040 | (251 | ) | (219 | ) | |||||||||||||||
Net income |
— | — | — | — | — | 6,828 | — | — | 6,828 | |||||||||||||||||||
| | | | | | | | | | | | | | | | | | | | | | | | | | | | | |
Balance at December 31, 2014 |
9,474,596 | $ | 8,344 | 5,160,396 | $ | 3 | $ | 4,288 | $ | 22,196 | 2,028,308 | $ | (4,420 | ) | $ | 22,067 | ||||||||||||
| | | | | | | | | | | | | | | | | | | | | | | | | | | | | |
| | | | | | | | | | | | | | | | | | | | | | | | | | | | | |
| | | | | | | | | | | | | | | | | | | | | | | | | | | | | |
See accompanying notes to consolidated financial statements
F-5
AmeriQuest, Inc.
Consolidated Statements of Cash Flows
(in thousands)
| |
Year Ended December 31, | |||||||||
|---|---|---|---|---|---|---|---|---|---|---|
| |
2012 | 2013 | 2014 | |||||||
Cash flows from operating activities: |
||||||||||
Net income |
$ | 628 | $ | 4,643 | $ | 6,828 | ||||
Adjustments to reconcile net income to net cash provided by (used in) operating activities: |
||||||||||
Depreciation and amortization |
10,341 | 10,191 | 10,622 | |||||||
Bad debt expense (net of recoveries) |
1,110 | 1,823 | 1,417 | |||||||
Stock-based compensation |
62 | 231 | 250 | |||||||
Deferred income tax expense |
210 | 2,802 | 3,959 | |||||||
Amortization of debt issuance costs |
— | 302 | 310 | |||||||
Changes in operating assets and liabilities: |
||||||||||
Accounts receivable |
(2,643 | ) | (53,522 | ) | (18,147 | ) | ||||
Other current assets |
1,123 | (839 | ) | (2,401 | ) | |||||
Accounts payable |
(8,797 | ) | 22,512 | 13,512 | ||||||
Other current liabilities |
1,537 | 1,004 | 3,897 | |||||||
Other assets and liabilities |
1 | 32 | (285 | ) | ||||||
| | | | | | | | | | | |
Net cash provided by (used in) operating activities |
3,572 | (10,821 | ) | 19,962 | ||||||
Cash flows from investing activities: |
||||||||||
Purchases of property and equipment |
(2,241 | ) | (3,984 | ) | (5,948 | ) | ||||
Purchases of revenue earning equipment |
(2,684 | ) | (367 | ) | (1,327 | ) | ||||
Sales of revenue earning equipment |
3,500 | 6,529 | 3,898 | |||||||
Other investing activities |
(25 | ) | 38 | (87 | ) | |||||
| | | | | | | | | | | |
Net cash (used in) provided by investing activities |
(1,450 | ) | 2,216 | (3,464 | ) | |||||
| | | | | | | | | | | |
Cash flows from financing activities: |
||||||||||
Proceeds from line of credit |
189,430 | 1,229,620 | 1,659,282 | |||||||
Repayments on line of credit |
(173,215 | ) | (1,205,834 | ) | (1,662,282 | ) | ||||
Proceeds from equipment financing notes payable |
5,718 | 737 | — | |||||||
Repayments of equipment financing notes payable |
(17,999 | ) | (10,868 | ) | (9,235 | ) | ||||
Proceeds from issuance of common stock |
259 | 684 | 199 | |||||||
Repurchases of common stock |
(1,241 | ) | (102 | ) | (251 | ) | ||||
Debt issuance costs |
(1,465 | ) | (43 | ) | (28 | ) | ||||
Other financing activities |
— | — | (810 | ) | ||||||
| | | | | | | | | | | |
Net cash (used in) provided by financing activities |
1,487 | 14,194 | (13,125 | ) | ||||||
| | | | | | | | | | | |
Net increase in cash and cash equivalents |
3,609 | 5,589 | 3,373 | |||||||
Cash and cash equivalents, beginning of period |
13,102 | 16,711 | 22,300 | |||||||
| | | | | | | | | | | |
Cash and cash equivalents, end of period |
$ | 16,711 | $ | 22,300 | $ | 25,673 | ||||
| | | | | | | | | | | |
| | | | | | | | | | | |
| | | | | | | | | | | |
Supplemental disclosures of cash flow information: |
||||||||||
Cash paid for interest |
$ | 1,330 | $ | 2,895 | $ | 3,264 | ||||
Cash paid (refunded) for income taxes |
$ | 297 | $ | (266 | ) | $ | 81 | |||
Non-cash purchases of revenue earning equipment |
$ | 13,966 | $ | 17,050 | $ | 7,630 | ||||
See accompanying notes to consolidated financial statements
F-6
AmeriQuest, Inc.
Notes to Consolidated Financial Statements
(in thousands, except share and per share data and where noted)
1. Description of Business
AmeriQuest Business Services, Inc. was originally incorporated under the laws of New Jersey in 1996. On September 2, 2015, pursuant to the Agreement and Plan of Reorganization (the "Merger Agreement") by and among AmeriQuest, Inc., a Delaware corporation ("AmeriQuest" or the "Company"), ABS Merger Sub, Inc., a New Jersey corporation and wholly owned subsidiary of the Company ("Merger Sub") and AmeriQuest Business Services, Inc., a New Jersey corporation ("ABS"), the Company adopted a new holding company organizational structure whereby ABS became a wholly owned subsidiary of the Company. The new organizational structure was effected by the merger of Merger Sub with ABS with ABS as the surviving entity and the shareholders of ABS receiving shares of the Company in consideration for their shares of ABS (the "Merger"). The operations of the Company remained at the ABS level, thus the Merger had no impact on ABS subsidiaries, operations and customers. Accordingly, the historical financial statements reflect the effect of the reorganization for all periods presented. Pursuant to the Merger Agreement, all of the outstanding capital stock of ABS was converted, on a share for share basis, into the common stock of Company. As a result, each former shareholder of ABS became the owner of the number of shares of common stock of the Company, rounded up to the nearest whole share, if applicable, identical to the number of shares previously held in ABS and having the same designations, rights, powers and preferences, qualifications, limitations and restrictions, as those previously held. Additionally, each outstanding option to purchase shares of common stock of ABS was automatically converted into an option to purchase, upon the same terms and conditions, an identical number of shares of Company's common stock, rounded up to the nearest whole share, if applicable. Each outstanding share of restricted common stock of ABS was also converted into a share of restricted common stock of Company, rounded up to the nearest whole share, if applicable, upon the same terms and conditions. The directors and executive officers of the Company immediately after completion of the Merger are comprised of the same persons who were directors of and executive officers of ABS immediately prior to the Merger. This change in reporting entity has been retrospectively reflected in these financial statements. In addition, in connection with the reorganization all treasury shares held by ABS were retired upon execution of the reorganization.
On January 11, 2016 the Board of directors authorized a four to one forward stock split in the form of a stock dividend, whereby each common stockholder as of January 12, 2016 received three additional shares of common stock for each share held. Consistent with the provisions of the Company's equity plans, all outstanding equity awards were proportionately adjusted. All share and per share amounts for all periods presented have been retroactively adjusted to reflect the stock split.
The Company's solutions are designed to eliminate the inefficiency, expense and lost opportunities caused by traditional paper-based processes, allowing the Company's customers to be competitive. The Company leverages its deep industry expertise, proprietary technology and customer and supplier relationships to help enterprises and organizations of varying sizes manage complex and dynamic operational and administrative processes that are frequently managed manually and require substantial internal resources.
The Company is comprised of three operating segments, which are organized based upon the nature of the products and services offered within each respective segment. The operating segments are Financial Process Automation (Financial Process Automation), Procurement Solutions (Procurement) and Asset Management Solutions (Asset Management).
The Company's Financial Process Automation Solutions consist primarily of the Company's cloud-based technology offerings that automate accounts receivable and accounts payable processes for the Company's customers, including e-invoicing, credit and collections management, working capital
F-7
AmeriQuest, Inc.
Notes to Consolidated Financial Statements (Continued)
(in thousands, except share and per share data and where noted)
1. Description of Business (Continued)
management and reporting analytics. These solutions are delivered through two products: CorConnect, the Company's accounts receivable automation platform; and COR360, the Company's accounts payable automation platform. The Company's procurement solutions leverage the Financial Process Automation solutions technology to conduct group purchasing, enabling companies to optimize their procurement processes from sourcing through payment. The Company's Asset Management Solutions provide data-driven strategic planning, asset acquisition and disposition, and asset financing and usage alternatives to help businesses lower the total cost of capital asset ownership. The Company's cloud-based solutions are highly scalable and offered in an `a la carte format, so that the Company's customers can selectively purchase those solutions that they need. These complementary business solutions enable the Company to capitalize on its customer and supplier network, cross-selling opportunities and operational scale.
2. Basis of Presentation
Principles of Consolidation
The accompanying consolidated financial statements include the accounts of AmeriQuest and its subsidiaries and variable interest entities ("VIEs") for which the Company is the primary beneficiary. All intercompany balances and transactions have been eliminated in consolidation.
The Company sponsors the ATS Master Trust (the "Trust"), which is a vehicle titling trust that is primarily used to facilitate the Company's lease brokerage transactions. The Trust's primary purpose is to limit the administrative burden associated with recording liens and retitling vehicles at the department of motor vehicles if a lessor elects to assign its interest in a lease to another party.
The Company has determined that the Trust is a variable interest entity pursuant to ASC 810. The Trust consists of legally distinct portfolio interests, whereby the assets of each portfolio interest are not available to creditors or beneficial interest holders of other portfolio interests, and the liabilities of each portfolio interest cannot be enforced against other portfolio interests. The Company has also determined that each portfolio interest constitutes a "silo" pursuant to ASC 810.
The Company holds a variable interest in and is the primary beneficiary of the general Trust interest, and one of the portfolio interests that is held within the Trust and therefore consolidates the assets and liabilities in that interest in its consolidated financial statements. The Company would have the risk of loss related to any assets held in that portfolio interest, and obligations for any liabilities of that portfolio interest. There were no assets or liabilities of the Company's portfolio interests as of December 31, 2013 or 2014.
The Trust also holds certain assets in other portfolio interests for which other parties (principally financial institutions who purchase the assets) are the primary beneficiaries and therefore such portfolio interests are not consolidated in the Company's financial results.
The Company has entered into remarketing and residual value guarantee agreements with financial institutions holding certain portfolio interests. See Note 16.
Use of Estimates
The preparation of financial statements in conformity with U.S. generally accepted accounting principles (U.S. GAAP) requires management to make estimates and assumptions that affect the reported amounts of assets, liabilities, revenues, expenses and disclosure of contingent assets and
F-8
AmeriQuest, Inc.
Notes to Consolidated Financial Statements (Continued)
(in thousands, except share and per share data and where noted)
2. Basis of Presentation (Continued)
liabilities at the date of the financial statements and reported amounts of revenues and expenses during the reporting period. On an ongoing basis, management evaluates its estimates, including those related to: (1) the fair value of assets acquired and liabilities assumed for business combinations, (2) the realization of tax assets and estimates of tax liabilities, (3) the valuation of the Company's common stock, (4) the recognition and disclosure of contingent liabilities, (5) the collectability of accounts receivable, (6) the useful lives of long-lived assets (including definite lived intangible assets), (7) the evaluation of revenue recognition criteria, and (8) assumptions used in the Black-Scholes option-pricing model to determine the fair value of stock-based compensation. These estimates are based on historical data and experience, as well as various other factors that management believes to be reasonable under the circumstances, the results of which form the basis for making judgments about the carrying value of assets and liabilities that are not readily apparent from other sources. The Company has engaged and may, in the future, engage third-party valuation specialists to assist with estimates related to the valuation of its common stock, and the valuation of assets and liabilities acquired in business combinations. Such estimates often require the selection of appropriate valuation methodologies and models, and significant judgment in evaluating ranges of assumptions and financial inputs.
Although the Company believes the estimates and assumptions used in determining the recorded amounts in the accompanying consolidated financial statements are reasonable, actual results may differ from those estimates under different assumptions or circumstances.
3. Summary of Significant Accounting Policies
Revenue Recognition
The Company recognizes revenue when persuasive evidence of an arrangement exists, the services have been rendered to the customer or delivery has occurred, the pricing is fixed or determinable, and collectability is reasonably assured.
Financial Process Automation Solutions
The Company generates Financial Process Automation Solutions revenue from two principal products: CorConnect, the Company's accounts receivable platform; and COR360, the Company's accounts payable platform. Key revenue sources and the related recognition policies are as follows:
Transaction fees: The Company assesses fees for transaction processing, which are based upon either a fixed amount per transaction or a percentage of the transaction value. Such fees are recognized at the time that the transaction is processed and validated in the Company's system.
Monthly usage fees: The Company charges monthly usage fees when the Company hosts and provides software to its customers to facilitate efficient transaction processing. These fees are recognized each month when the Company begins to provide the hosting service under the terms of the agreement.
Implementation and training fees: These fees are generally a fixed amount for each new customer and are assessed at the beginning of a contract. As noted below, they do not qualify as a separate unit of accounting and therefore are deferred and recognized over the period of the expected customer relationship.
F-9
AmeriQuest, Inc.
Notes to Consolidated Financial Statements (Continued)
(in thousands, except share and per share data and where noted)
3. Summary of Significant Accounting Policies (Continued)
Procurement Solutions
The Company receives Procurement Solutions revenue from both purchasers and the Company's suppliers as follows:
Revenue from purchasers: Purchasers in the Company's procurement networks pay a fee to the Company in connection with their transactions. Fees are based on a product margin that varies by procurement program and typically includes a nominal fee per invoice.
Revenue from suppliers: Suppliers that participate in the Company's network pay a fee to the Company calculated either as a percentage of the transaction value under specific preferred procurement programs or as a pre-determined fee per transaction or item. In addition, many suppliers pay the Company volume based rebates on a quarterly or annual basis, a portion of which is passed through to our customers and a portion of which is retained by the Company.
Fees from both suppliers and purchasers are recognized when the underlying customer order has been fulfilled.
Rebate revenues are recognized based upon the actual purchase volume achieved in the period. Rebate revenue is recognized net of any amounts that must be passed through to our customers.
Asset Management Solutions
The Company's Asset Management Solutions provide a comprehensive offering of data-driven fleet management services including vehicle remarketing, asset planning and financing, and leasing and maintenance services. Key revenue sources and the related recognition policies are as follows:
Sales of equipment: The Company purchases equipment, primarily trucks, for resale. Revenue on equipment sales are recognized when (1) an agreement of sale has been reached, (2) the customer has secured a funding source, and (3) the customer has taken title and possession of the vehicle.
Operating lease revenues: Revenue from operating leases under Financial Accounting Standards Board ("FASB") Accounting Standards Codification ("ASC") 840 is recognized on a straight line basis over the lease term. Revenue recognition ceases when the Company has not received any payments from a customer for a period of six weeks.
Service revenues: Service revenues consist primarily of (1) lease brokerage fees, which are recognized when the underlying lease transaction is consummated, (2) equipment brokerage fees from manufacturers, which are recognized when our customers purchase a capital asset from a specific vendor within the Company's supplier network, (3) membership dues, which are recognized on a straight line basis over the period that membership services are provided, and (4) maintenance fees, which represent a mark-up on maintenance services arranged by the Company, and are recognized when the related service is performed by the third-party provider.
Up-front fees
Although the Company does not offer bundled pricing for its various service offerings, the Company's contracts with customers in the Financial Process Automation Solutions and Asset Management Solutions segments often require customers to pay "up-front" implementation or contract set up fees, which are deferred and recognized over the estimated period that the contract or customer relationship is expected to generate revenue.
F-10
AmeriQuest, Inc.
Notes to Consolidated Financial Statements (Continued)
(in thousands, except share and per share data and where noted)
3. Summary of Significant Accounting Policies (Continued)
Within the Financial Process Automation Solutions segment, these fees are charged at the beginning of the customer relationship as compensation for the Company's efforts to configure the system to specific customer needs and provide training to the customer. These fees do not represent a separate unit of accounting as they do not have value apart from the broader transaction processing contract. As a result, they are recognized on a straight line basis over the estimated life of the customer relationship, which the Company estimates ranges from three to five years.
Within the Asset Management Solutions segment, these fees are assessed at the inception of our operating leases in order to compensate the Company for its costs incurred in preparing the asset for lease. These fees do not represent a separate unit of accounting as they do not have value apart from the related lease. As a result, they are recognized on a straight line basis over the contract term.
Cash and Cash Equivalents
Cash and cash equivalents are comprised of highly liquid investments with original maturities of three months or less.
Lease Classification
The Company evaluates its owner operator leases on a lease by lease basis to determine whether lease payments are reasonably predictable. The Company's experience indicates that the vast majority of its leases will terminate prior to the expiration of the term, with most of the terminations occurring within one year of the initial lease commencement. As the Company is unable to conclude that the payments under such leases are reasonably predictable over the contractual lease term, its owner-operator leases have been classified as operating leases in the financial statements as required by ASC 840.
Accounts Receivable
Accounts receivable includes amounts due from the Company's customers in the normal course of business. The Company generates accounts receivable when customers in its purchasing programs purchase a product from one of the suppliers, who also participates in the Company's purchasing programs. Although the Company is not responsible for the delivery of the underlying goods, it acts as an intermediary between the parties and bears all risk associated with paying the supplier and collecting from the customer. The Company also generates accounts receivable when lease payments become due under its operating leases. These receivables are short term, with an average maturity around 35 days, and do not bear interest.
Allowance for Doubtful Accounts
The Company manages its accounts receivable by regularly monitoring the financial strength of its customers and adjusting credit limits and security requirements accordingly. Customers with a strong financial position and payment history are given more favorable credit terms, while customers in a weaker financial position or with a history of late payments are subject to more stringent credit limits and may be required to post a security deposit or other collateral. When accounts become past due, the Company responds by placing collection calls and limiting additional customer purchases. If accounts are not collected after these initial efforts, the Company may take action against any collateral or security deposits that it may have obtained. If all of its collection efforts prove unsuccessful, the Company may refer its accounts receivable to collection agencies for a nominal price, which earn a
F-11
AmeriQuest, Inc.
Notes to Consolidated Financial Statements (Continued)
(in thousands, except share and per share data and where noted)
3. Summary of Significant Accounting Policies (Continued)
commission on any amounts collected. If the collection agency is unable to make any collections for 90 days, the receivables are written off. The Company's collection policies have historically been successful in collecting the majority of at risk accounts.
A significant portion of the Company's accounts receivables are generated by our Procurement and Financial Process Automation solutions businesses (also referred to as program receivables). The Company develops its allowance for doubtful accounts receivable based upon its historical experience with customers and the age of its underlying receivables. Each customer account is assigned a risk rating based upon the customer's financial strength, payment history and any known actions, such as liquidation or bankruptcy. An allowance is established for each customer risk grouping after considering the historical level of write offs for customers with a similar risk profile, any known economic or industry trends, and customer specific information. This assessment is done on a customer by customer basis each quarter. As the customer risk rating and the age of the underlying receivables increases the Company's allowance for that account is also increased. While the Company does not currently foresee any significant changes in its ability to collect its receivables, deterioration in the financial strength of its customers could cause a significant increase in the Company's historical level of write offs and the related bad debt expenses. See additional information regarding the Company's accounts receivable in note 5 to the consolidated financial statements.
The Company assesses finance charges when accounts are past due. Finance charge revenue is recognized when cash is received, as management does not believe collectability will be reasonably assured until that point.
Inventories
Inventories consist of equipment, primarily trucks, which the Company has purchased with the intent to sell in the normal course of business and are stated at the lower of cost or market, using the specific identification costing method.
Deferred Contract Costs
The Company incurs certain costs to implement customer contracts within its Asset Management Solutions and Financial Process Automation Solutions segments. These costs are recovered from the customer through fees that are charged and collected at the inception of the contract. The costs incurred and the related revenues are deferred and amortized over the contract term (within the Asset Management Solutions segment) or estimated life of the customer relationship (within the Financial Process Automation Solutions segment). The deferred contract costs consist primarily of third-party costs incurred to bring an asset in line with customer specifications (within the Asset Management Solutions segment) and payroll incurred related to employees working directly on the customer contracts (within both the Asset Management Solutions and the Financial Process Automation Solutions segments).
Software Development Costs
The Company capitalizes certain development costs incurred to acquire or create the Company's internal-use software. These capitalized costs are primarily related to applications hosted by the Company and accessed by the Company's customers. Costs incurred in the preliminary stages of development are expensed as incurred. Once the application development stage is reached, internal and external costs, if direct and incremental, are capitalized until the software is substantially complete and
F-12
AmeriQuest, Inc.
Notes to Consolidated Financial Statements (Continued)
(in thousands, except share and per share data and where noted)
3. Summary of Significant Accounting Policies (Continued)
ready for its intended use. Capitalization ends when all substantial testing is complete. The Company's internal capitalized costs consist primarily of direct labor and fringe benefits. The Company also capitalizes costs related to specific upgrades and enhancements when it is probable the expenditures will result in additional functionality. Capitalized costs are included in the internally developed software class in property, equipment and revenue earning equipment. These costs are amortized on a straight line basis over their estimated useful life, which is typically three years. Maintenance and training costs are expensed as incurred. Management evaluates the remaining useful lives of these assets on an annual basis and tests for impairment whenever events or changes in circumstances occur that could impact the recoverability of these assets. There were no impairments of the Company's internally developed software for the years ended December 31, 2012, 2013 and 2014.
Property and Equipment
Property and equipment consist primarily of internally developed software, purchased software, computer hardware, office equipment, furniture and leasehold improvements and are recorded at cost, net of accumulated depreciation and amortization. Depreciation on property and equipment is computed using the straight line method and expensed over the estimated useful lives of the assets.
Revenue-Earning Equipment
Revenue-earning equipment consists of equipment, primarily trucks, which are either on lease with a customer or in the Company's possession awaiting assignment. Depreciation on revenue-earning equipment is recorded using the straight line method over the assets, useful lives, which range from 2.5 to 10 years. The Company periodically reviews and adjusts, as appropriate, the residual values and useful lives of the revenue-earning equipment. The Company's review of the residual values and useful lives of revenue-earning equipment is established with a long-term view considering historical market price changes, current and expected future market price trends and the expected life of the equipment.
Goodwill and Other Intangible Assets
Goodwill and intangible assets deemed to have indefinite lives are not amortized but rather are tested at least annually for impairment, or when circumstances indicate that the carrying amount of the asset may not be recoverable. Goodwill is tested for impairment at the reporting unit level. A reporting unit is an operating segment or a component of an operating segment. Goodwill is tested for impairment by either performing a qualitative evaluation or a two-step quantitative test. The qualitative evaluation is an assessment of factors to determine whether it is more likely than not that the fair value of a reporting unit is less than its carrying amount, including goodwill. The Company may elect not to perform the qualitative assessment for some or all reporting units and perform a two-step quantitative impairment test. For purposes of performing the two step quantitative test, fair value is determined based on discounted cash flow analysis, the use of market multiples applied to the reporting unit's earnings. Both valuation methods include significant management assumptions such as revenue growth rates, operating margins, weighted average cost of capital, the selection of comparable companies and future economic and market conditions. If the carrying value of the reporting unit exceeds fair value, goodwill is considered impaired. The amount of the impairment is the difference between the carrying value of the goodwill and its "implied" fair value, which is calculated as if the reporting unit had just been acquired and accounted for as a business combination.
F-13
AmeriQuest, Inc.
Notes to Consolidated Financial Statements (Continued)
(in thousands, except share and per share data and where noted)
3. Summary of Significant Accounting Policies (Continued)
For its most recent annual impairment test, the Company performed a quantitative test for all of its reporting units and no impairment was identified.
Indefinite-lived intangible assets consist of trademarks and are tested for impairment by comparing the fair value of the asset to the carrying value. Fair value is determined based on discounted cash flow analyses that include significant management assumptions such as revenue growth rates, weighted average cost of capital, and assumed royalty rates. If the fair value is less than the carrying value, the asset is reduced to fair value.
Definite-lived intangible assets consist primarily of customer relationships, which are being amortized based on estimated customer attrition of 25 years.
Impairment of Long-Lived Assets, Including Finite-Lived Intangible Assets
Long-lived assets held and used by the Company are reviewed for impairment whenever events or changes in circumstances indicate that the carrying amount of an asset may not be recoverable. Recoverability of long-lived assets is evaluated by comparing the carrying amount of an asset or asset group to management's best estimate of the undiscounted future operating cash flows expected to be generated by the asset or asset group. If these comparisons indicate that the carrying amount of the asset or asset group is not recoverable, an impairment loss is recognized for the amount by which the carrying value exceeds fair value. Fair value is determined by quoted market price, if available, or an estimate of projected future operating cash flows. Long-lived assets and certain identifiable intangibles to be disposed of are reported at the lower of carrying amount or fair value less cost to sell.
Other Assets
Other assets include deferred legal, accounting and underwriting charges related to the Company's planned initial public offering. When the planned offering is completed, these costs will be recorded in equity as an offset to the proceeds raised. Other assets also include costs incurred to establish the Company's revolving credit agreement. These costs are deferred and amortized into interest expense on a straight line basis over the term of the facility.
Stock-Based Compensation
The Company offers stock options to certain employees and accounts for stock-based compensation in accordance with FASB ASC 718, Compensation—Stock Compensation, by recognizing the fair value of stock-based compensation in the consolidated statements of income. The fair value of the Company's stock option awards are estimated using a Black-Scholes option valuation model. This model requires the input of highly subjective assumptions including expected stock price volatility and the estimated life of each award. In addition, the calculation of compensation costs requires that the Company estimate the number of awards if any that will be forfeited during the vesting period. The fair value of a stock award is recognized over the vesting period of the award net of estimated forfeitures, if any. For stock-based awards that vest based on performance conditions (e.g., the achievement of certain milestones), expense is recognized over the remaining vesting period beginning on the date that it is probable the condition will be met.
The Company offers restricted stock awards to its board of directors and certain key executives. These awards do not contain performance conditions and vest at the end of the related service periods, which range from one to three years. The Company recognizes expenses for the grant date fair value of the awards on a straight line basis over the vesting period.
F-14
AmeriQuest, Inc.
Notes to Consolidated Financial Statements (Continued)
(in thousands, except share and per share data and where noted)
3. Summary of Significant Accounting Policies (Continued)
Income Taxes
The Company accounts for deferred income taxes under the asset and liability method of accounting for income taxes. The objective of the asset and liability method is to recognize an asset or liability for the expected future tax effects attributable to temporary differences between the financial reporting and tax bases of assets and liabilities. Under the asset and liability method, deferred tax assets and liabilities are adjusted to reflect changes in tax rates and other provisions of the tax law in the period in which such changes are enacted. Deferred tax assets are recognized unless it is more likely than not that some portion or all of the deferred tax assets will not be realized. Based upon the available evidence, management has determined that no valuation allowance is necessary as of December 31, 2013 and 2014.
The Company follows guidance issued by the FASB for financial statement recognition, measurement and disclosure of uncertain tax positions recognized in an enterprise's financial statements. Significant management judgment is required to determine the amount of benefit to be recognized in relation to an uncertain tax position. The Company uses a two-step process to evaluate tax positions. The first step requires an entity to determine whether it is more likely than not (greater than 50% chance) that the tax position will be sustained. The second step requires an entity to recognize in the financial statements the benefit of a tax position that meets the more likely than not recognition criterion. The amounts ultimately paid upon resolution of issues raised by taxing authorities may differ materially from the amounts accrued and may materially impact the financial statements of the Company in future periods. The Company's policy is to recognize interest and penalties accrued on any unrecognized tax benefits as a component of interest expense and other operating expense, respectively. The amount of interest and penalties recorded is insignificant in all periods presented.
Advertising Expense
The Company expenses the cost of advertising as incurred. Advertising expense was $787, $824 and $1,373 for the years ended December 31, 2012, 2013, and 2014, respectively.
Foreign Currency
The Company's foreign currency denominated assets and liabilities consist of receivables, payables and cash balances and are remeasured into U.S. dollars at end of period exchange rates, with any fluctuations caused by changes in exchange rates being recorded directly to earnings during the period of the change.
Concentrations
The Company maintains cash and cash equivalents in excess of federally insured limits in two banks; however the Company has not experienced any losses in such accounts and believes it is not exposed to any significant credit risk on cash and cash equivalents.
The Company entered into a vendor program with Daimler Trucks North America LLC during 2013, which accounted for $8.5 million and $11.5 million or 13% and 14% of the Company's total revenues, respectively, for the years ended December 31, 2013 and 2014. In addition, the Company had one customer representing 13% of net accounts receivable as of both December 31, 2013 and 2014.
F-15
AmeriQuest, Inc.
Notes to Consolidated Financial Statements (Continued)
(in thousands, except share and per share data and where noted)
3. Summary of Significant Accounting Policies (Continued)
Fair Value
The carrying amounts of financial instruments held by the Company, which include cash and cash equivalents, accounts receivable, rebates receivable and payable, other current assets, accounts payable, accrued expenses, and other current liabilities, approximate fair value due to the short-term nature of those instruments. In addition, the carrying value of the Company's debt instruments, which do not have readily ascertainable market values and would be classified as level 2 within the hierarchy below, approximate market value, given that the interest rates on the borrowings approximate market rates.
The FASB accounting guidance establishes a three-level fair value hierarchy that prioritizes the inputs used to measure fair value. This hierarchy requires entities to maximize the use of observable inputs and minimize the use of unobservable inputs. The three levels of inputs used to measure fair value are as follows:
- •
- Level 1—inputs are unadjusted quoted prices in active markets for identical assets or liabilities that the Company
can access at the measurement date
- •
- Level 2—inputs include quoted prices for similar assets or liabilities in active markets, quoted prices for
identical or similar assets or liabilities in markets that are not active, and inputs other than quoted prices that are observable for the asset or liability
- •
- Level 3—inputs are unobservable inputs for the asset or liability
The classification of a fair value measurement of an asset or liability within the fair value hierarchy is based on the lowest level of any input that is significant to the fair value assessment.
Subsequent Events
The Company has evaluated subsequent events through April 29, 2015, which is the date the financial statements were available to be issued. No material subsequent events have occurred since December 31, 2014, that require recognition or disclosure in the consolidated financial statements, other than those matters disclosed elsewhere in the consolidated financial statements.
4. Recent Accounting Pronouncements
During 2012, the Company adopted FASB Accounting Standards Update ("ASU") No. 2012-02, Testing Indefinite-Lived Intangible Assets for Impairment, which amends ASC 350, Intangibles—Goodwill and Other. This ASU gives an entity the option to first assess qualitative factors to determine if indefinite-lived intangible assets are impaired. The entity may first determine based on qualitative factors if it is more likely than not that the fair value of indefinite-lived intangible assets are less than their carrying amount. If that assessment indicates no impairment, the quantitative impairment test is not required. The adoption did not have a material effect on the Company's consolidated financial statements.
During 2014, the Company adopted ASU No. 2013-11, Income Taxes (Topic 740): Presentation of an Unrecognized Tax Benefit When a Net Operating Loss Carryforward, a Similar Tax Loss, or a Tax Credit Carryforward Exists. ASU No. 2013-11, requires presentation of an unrecognized tax benefit in the financial statements as a reduction to a deferred tax asset for a net operating loss carryforward, a similar tax loss, or a tax credit carryforward. To the extent a net operating loss carryforward, a similar
F-16
AmeriQuest, Inc.
Notes to Consolidated Financial Statements (Continued)
(in thousands, except share and per share data and where noted)
4. Recent Accounting Pronouncements (Continued)
tax loss, or a tax credit carryforward is not available at the reporting date under the tax law of the applicable jurisdiction to settle any additional income taxes that would result from the disallowance of a tax position or the tax law of the applicable jurisdiction does not require the entity to use, and the entity does not intend to use, the deferred tax asset for such purpose, the unrecognized tax benefit would be presented in the financial statements as a liability and would not be combined with deferred tax assets. The adoption did not have a material effect on the Company's consolidated financial statements.
In May 2014, the FASB issued ASU No. 2014-09, Revenue from Contracts with Customers. The standard will eliminate the transaction-specific and industry-specific revenue recognition guidance under current U.S. GAAP and replace it with a principle based approach for determining revenue recognition. Public entities are required to apply the revenue recognition standard for annual reporting periods beginning after December 15, 2017, including interim periods within that annual reporting period. However, because the Company is an "emerging growth company" under the JOBS Act, the Company is able to defer application of this standard until the effective date for private companies, which is for any annual reporting period beginning after December 15, 2018 and includes any interim reporting periods therein. Early application is not permitted. The Company has not yet selected a transition method and is evaluating the effect that the updated standard will have on its consolidated financial statements and related disclosures.
5. Accounts Receivable and Operating Lease Receivables
Accounts receivable consist of the following:
| |
December 31, | ||||||
|---|---|---|---|---|---|---|---|
| |
2013 | 2014 | |||||
Program receivables |
$ | 102,667 | $ | 118,522 | |||
Operating lease receivables |
689 | 665 | |||||
Less: Allowance for doubtful accounts |
|||||||
Program receivables |
(1,933 | ) | (2,030 | ) | |||
Operating lease receivables |
(123 | ) | (202 | ) | |||
| | | | | | | | |
Accounts receivable, net |
$ | 101,300 | $ | 116,955 | |||
| | | | | | | | |
| | | | | | | | |
| | | | | | | | |
As of December 31, 2013 and 2014, $102,667 and $118,522, respectively, of our accounts receivable were pledged as collateral to secure our revolving line of credit (see note 15).
F-17
AmeriQuest, Inc.
Notes to Consolidated Financial Statements (Continued)
(in thousands, except share and per share data and where noted)
5. Accounts Receivable and Operating Lease Receivables (Continued)
The following describes the changes in the allowance for doubtful accounts:
| |
Program Receivables | Operating Lease Receivables |
Total | |||||||
|---|---|---|---|---|---|---|---|---|---|---|
Balance at December 31, 2011 |
$ | 838 | $ | 230 | $ | 1,068 | ||||
Bad debt expense |
439 | 1,104 | 1,543 | |||||||
Recoveries |
(32 | ) | (401 | ) | (433 | ) | ||||
Deductions from reserves |
(562 | ) | (765 | ) | (1,327 | ) | ||||
| | | | | | | | | | | |
Balance at December 31, 2012 |
$ | 683 | $ | 168 | $ | 851 | ||||
| | | | | | | | | | | |
Bad debt expense |
1,410 | 708 | 2,118 | |||||||
Recoveries |
— | (295 | ) | (295 | ) | |||||
Deductions from reserves |
(160 | ) | (458 | ) | (618 | ) | ||||
| | | | | | | | | | | |
Balance at December 31, 2013 |
$ | 1,933 | $ | 123 | $ | 2,056 | ||||
| | | | | | | | | | | |
Bad debt expense |
713 | 893 | 1,606 | |||||||
Recoveries |
— | (189 | ) | (189 | ) | |||||
Deductions from reserves |
(616 | ) | (625 | ) | (1,241 | ) | ||||
| | | | | | | | | | | |
Balance at December 31, 2014 |
$ | 2,030 | $ | 202 | $ | 2,232 | ||||
| | | | | | | | | | | |
| | | | | | | | | | | |
| | | | | | | | | | | |
The Company's operating lease receivables are generally billed weekly and due within three weeks of billing. These receivables are considered to be at risk of default when they reach six weeks of age, at which time the Company records a full valuation allowance against such receivables.
Based upon its historical experience, the Company does not consider its program receivables to be at risk of default until they reach the age of 90 days. The table below summarizes the Company's at risk receivables as of December 31, 2014 and 2013.
| |
December 31, | ||||||
|---|---|---|---|---|---|---|---|
| |
2013 | 2014 | |||||
At risk program receivables |
$ | 7,485 | $ | 6,062 | |||
At risk operating lease receivables |
92 | 172 | |||||
Allowance for at risk program receivables |
(1,738 | ) | (1,820 | ) | |||
Allowance for at risk operating lease receivables |
(92 | ) | (172 | ) | |||
| | | | | | | | |
Net carrying value of at risk receivables |
$ | 5,747 | $ | 4,242 | |||
| | | | | | | | |
| | | | | | | | |
| | | | | | | | |
The Company engages in operating leases whereby it leases equipment, primarily trucks, to its customers. Future minimum lease payments receivable from lessors under operating leases are
F-18
AmeriQuest, Inc.
Notes to Consolidated Financial Statements (Continued)
(in thousands, except share and per share data and where noted)
5. Accounts Receivable and Operating Lease Receivables (Continued)
summarized below. The majority of the lessees default on their obligations prior to the expiration of the lease term.
2015 |
$ | 9,728 | ||
2016 |
8,613 | |||
2017 |
7,093 | |||
2018 |
3,591 | |||
2019 |
819 | |||
| | | | | |
Total |
$ | 29,844 | ||
| | | | | |
| | | | | |
| | | | | |
6. Inventories, Prepaid Expenses and Other Current Assets
| |
December 31, | ||||||
|---|---|---|---|---|---|---|---|
| |
2013 | 2014 | |||||
Deferred income taxes |
$ | 2,362 | $ | 2,021 | |||
Prepaid expenses and other current assets |
1,977 | 1,787 | |||||
Inventories |
670 | 2,424 | |||||
Deferred contract costs |
431 | 542 | |||||
Prepaid income taxes |
539 | 406 | |||||
| | | | | | | | |
Total |
$ | 5,979 | $ | 7,180 | |||
| | | | | | | | |
| | | | | | | | |
| | | | | | | | |
7. Property, Equipment and Revenue-Earning Equipment
| |
|
December 31, | |||||||
|---|---|---|---|---|---|---|---|---|---|
| |
Estimated Useful Lives (in years) |
||||||||
| |
2013 | 2014 | |||||||
Internally developed software |
3 | $ | 7,456 | $ | 12,447 | ||||
Computer hardware and software |
3 - 5 | 4,743 | 5,667 | ||||||
Office equipment, furniture, and leasehold improvements |
7 | 367 | 399 | ||||||
| | | | | | | | | | |
|
12,566 | 18,513 | |||||||
Accumulated depreciation and amortization |
(5,796 | ) | (9,316 | ) | |||||
| | | | | | | | | | |
Property and equipment, net |
6,770 | 9,197 | |||||||
Revenue-earning equipment |
2.5 - 10 |
44,626 |
44,657 |
||||||
| | | | | | | | | | |
Accumulated depreciation |
(11,134 | ) | (13,151 | ) | |||||
| | | | | | | | | | |
Revenue earning equipment, net |
33,492 | 31,506 | |||||||
| | | | | | | | | | |
Property, equipment, and revenue-earning equipment, net |
$ | 40,262 | $ | 40,703 | |||||
| | | | | | | | | | |
| | | | | | | | | | |
| | | | | | | | | | |
Amortization expense related to internally developed software was $610, $1,373 and $2,616 for the years ended December 31, 2012, 2013 and 2014, respectively. Accumulated amortization related to internally developed software was $2,561 and $5,177 as of December 31, 2013 and 2014, respectively.
F-19
AmeriQuest, Inc.
Notes to Consolidated Financial Statements (Continued)
(in thousands, except share and per share data and where noted)
7. Property, Equipment and Revenue-Earning Equipment (Continued)
Revenue-earning equipment consists of equipment, primarily trucks, which are either on lease with a customer or in the Company's possession awaiting assignment. Depreciation expense related to revenue-earning equipment was $8,863, $7,861 and $7,044 for the years ended December 31, 2012, 2013 and 2014, respectively.
Depreciation expense on property, equipment and revenue earning equipment in total was $10,311, $10,162, and $10,594, during the years ended December 31, 2012, 2013 and 2014, respectively.
8. Goodwill and Intangibles
Goodwill is $7,191 in our Procurement Solutions segment and $3,115 in our Asset Management Solutions segment as of both December 31, 2013 and 2014. No impairment of goodwill has been recorded since the businesses were acquired.
The following table presents the components of other intangible assets:
| |
December 31, 2013 | December 31, 2014 | |||||||||||||||||
|---|---|---|---|---|---|---|---|---|---|---|---|---|---|---|---|---|---|---|---|
| |
Gross Carrying Amount |
Accumulated Amortization |
Net Carrying Amount |
Gross Carrying Amount |
Accumulated Amortization |
Net Carrying Amount |
|||||||||||||
Definite-lived: |
|||||||||||||||||||
Customer relationships |
$ | 650 | $ | (182 | ) | $ | 468 | $ | 650 | $ | (208 | ) | $ | 442 | |||||
Other |
73 | (69 | ) | $ | 4 | 73 | (72 | ) | $ | 1 | |||||||||
| | | | | | | | | | | | | | | | | | | | |
|
723 | (251 | ) | 472 | 723 | (280 | ) | 443 | |||||||||||
| | | | | | | | | | | | | | | | | | | | |
Indefinite-lived: |
|||||||||||||||||||
Trademarks |
100 | — | 100 | 100 | — | 100 | |||||||||||||
| | | | | | | | | | | | | | | | | | | | |
Total |
$ | 823 | $ | (251 | ) | $ | 572 | $ | 823 | $ | (280 | ) | $ | 543 | |||||
| | | | | | | | | | | | | | | | | | | | |
| | | | | | | | | | | | | | | | | | | | |
| | | | | | | | | | | | | | | | | | | | |
Amortization expense was $30, $29, and $28 for the years ended December 31, 2012, 2013 and 2014, respectively.
The following table presents estimated amortization expense for each of the next five years and thereafter:
2015 |
$ | 27 | ||
2016 |
26 | |||
2017 |
26 | |||
2018 |
26 | |||
2019 |
26 | |||
Thereafter |
412 | |||
| | | | | |
Total |
$ | 543 | ||
| | | | | |
| | | | | |
| | | | | |
F-20
AmeriQuest, Inc.
Notes to Consolidated Financial Statements (Continued)
(in thousands, except share and per share data and where noted)
9. Accrued Expenses and Other Current Liabilities
| |
December 31, | ||||||
|---|---|---|---|---|---|---|---|
| |
2013 | 2014 | |||||
Employment-related accruals |
$ | 3,278 | $ | 3,681 | |||
Pool and maintenance liabilities |
1,288 | 1,036 | |||||
Refundable deposits |
1,148 | 1,018 | |||||
Deferred revenue |
615 | 835 | |||||
Other accrued expenses |
1,002 | 2,902 | |||||
| | | | | | | | |
Total |
$ | 7,331 | $ | 9,472 | |||
| | | | | | | | |
| | | | | | | | |
| | | | | | | | |
Employment-related accruals include costs for salaries, commissions, bonuses and benefits.
Pool and maintenance liabilities are comprised of certain amounts collected from lessees to cover annual equipment registrations and maintenance costs for leased equipment. The amounts are deposited into the Company's operating cash account and the accumulated balances are tracked for each lease. At the end of the lease term, if the lessee fulfills his obligations under the lease agreement, any unused maintenance liability will be paid back to the lessee. If the lessee defaults on the lease, any unused maintenance funds will be retained by the Company.
Refundable deposits include amounts collected in advance from certain customers in order to limit the amount of credit risk that we extend.
Deferred revenue primarily consists of up-front implementation and contract set-up fees that are collected from customers at the inception of contracts within our Asset Management Solutions and Financial Process Automation Solutions segments. These costs are amortized over the contract term (within the Asset Management Solutions segment) or the expected life of the customer relationship (within the Financial Process Automation Solutions segment).
Other accrued expenses include accruals for income taxes payable and general corporate expenditures such as travel, telephone, postage, and utilities.
10. Income Taxes
The components of income tax provision (benefit) are as follows:
| |
Year ended December 31, | |||||||||
|---|---|---|---|---|---|---|---|---|---|---|
| |
2012 | 2013 | 2014 | |||||||
Current: |
||||||||||
Federal |
$ | 102 | $ | 1 | $ | 61 | ||||
State |
32 | 90 | 225 | |||||||
| | | | | | | | | | | |
|
134 | 91 | 286 | |||||||
Deferred: |
||||||||||
Federal |
344 | 2,569 | 3,946 | |||||||
State |
(134 | ) | 233 | 13 | ||||||
| | | | | | | | | | | |
|
210 | 2,802 | 3,959 | |||||||
| | | | | | | | | | | |
Total income tax provision |
$ | 344 | $ | 2,893 | $ | 4,245 | ||||
| | | | | | | | | | | |
| | | | | | | | | | | |
| | | | | | | | | | | |
F-21
AmeriQuest, Inc.
Notes to Consolidated Financial Statements (Continued)
(in thousands, except share and per share data and where noted)
10. Income Taxes (Continued)
A reconciliation of the federal statutory tax rate with the effective tax rate follows:
| |
Year ended December 31, |
|||||||||
|---|---|---|---|---|---|---|---|---|---|---|
| |
2012 | 2013 | 2014 | |||||||
Federal statutory tax rate |
34.0 | % | 34.0 | % | 34.0 | % | ||||
State income taxes, net of federal income tax benefit |
4.2 | 4.2 | 1.2 | |||||||
Change in deferred tax assets and liabilities due to tax rate changes |
0.4 | (0.9 | ) | 1.5 | ||||||
Non-deductible expenses |
5.7 | 1.2 | 0.9 | |||||||
Other items, net |
(8.9 | ) | (0.1 | ) | 0.7 | |||||
| | | | | | | | | | | |
Effective tax rate |
35.4 | % | 38.4 | % | 38.3 | % | ||||
| | | | | | | | | | | |
| | | | | | | | | | | |
| | | | | | | | | | | |
The Company's effective tax rate differs from the U.S. statutory tax rate due to state income taxes, certain permanent items, and corrections of prior period estimates based upon additional information that became available by the time the Company filed its income tax return in each given year.
The components of deferred tax assets and liabilities are as follows:
| |
December 31, | ||||||
|---|---|---|---|---|---|---|---|
| |
2013 | 2014 | |||||
Deferred income tax assets: |
|||||||
Net operating loss carryforwards |
$ | 5,578 | $ | 4,223 | |||
Reserve accounts |
1,025 | 1,068 | |||||
Other |
383 | 243 | |||||
Accrued rent |
101 | 102 | |||||
| | | | | | | | |
Total deferred income tax assets |
7,087 | 5,636 | |||||
| | | | | | | | |
Deferred income tax liabilities: |
|||||||
Depreciation and amortization |
(9,811 | ) | (11,205 | ) | |||
Capitalized software |
(1,981 | ) | (3,098 | ) | |||
Prepaid expenses |
(10 | ) | (7 | ) | |||
| | | | | | | | |
Total deferred income tax liabilities |
(11,802 | ) | (14,310 | ) | |||
| | | | | | | | |
Net deferred income tax liability |
$ | (4,715 | ) | $ | (8,674 | ) | |
| | | | | | | | |
| | | | | | | | |
| | | | | | | | |
Deferred tax assets have been classified in the accompanying consolidated balance sheets as follows:
| |
December 31, | ||||||
|---|---|---|---|---|---|---|---|
| |
2013 | 2014 | |||||
Deferred income tax asset—current (included in inventories, prepaid expenses and other current assets) |
$ | 2,362 | $ | 2,021 | |||
Deferred income tax liability—non-current |
(7,077 | ) | (10,695 | ) | |||
| | | | | | | | |
Net deferred income tax liability |
$ | (4,715 | ) | $ | (8,674 | ) | |
| | | | | | | | |
| | | | | | | | |
| | | | | | | | |
F-22
AmeriQuest, Inc.
Notes to Consolidated Financial Statements (Continued)
(in thousands, except share and per share data and where noted)
10. Income Taxes (Continued)
As of December 31, 2014, the Company has federal and state gross operating loss carryforwards of $9,982 and $13,793, respectively. The federal amounts expire in 18-20 years and the state amounts expire in 7-20 years.
In the normal course of business, the Company is subject to examination by taxing authorities from the Federal and state governments within the United States. There are not currently any examinations ongoing. Tax years from 2012 and forward remain open for examination by taxing authorities.
11. Benefit Plans
The Company sponsors a defined contribution profit-sharing plan in which employer contributions are at the discretion of management. The plan covers substantially all full-time employees who are 21 years of age or older with at least one year of service. The profit-sharing plan also includes a 401(k) provision for qualified employees who wish to contribute. The Company made no contributions to this plan for the years ended December 31, 2012, 2013 and 2014.
12. Common Stock
All common stock issued is restricted stock which limits its marketability. Under the Shareholders' Agreement, the Company has the right of first refusal to repurchase the stock at a price determined under the agreement.
Redeemable Common Stock
Under certain circumstances including a change in the control of the shareholder and transfer of the shares due to legal process, such as bankruptcy, receivership or divorce, as defined in the Shareholder Agreement, the Company may be required to repurchase shares from certain shareholders at a purchase price equal to the fair value of the shares as of the date of the triggering event.
The Company has classified equity subject to the redemption provisions outside of permanent equity on our consolidated balance sheets. Such amounts have been recorded at their historical cost because they are not currently redeemable and the occurrence of a triggering event as defined in such Shareholder Agreement is not probable at this time.
Share redemption provisions are automatically terminated upon completion of a successful initial public offering of the Company's common stock at which time the redeemable common stock would be reclassified into permanent equity.
Stock Purchase Agreement
On June 1, 1999, the Company entered into a stock purchase agreement in which the Company's largest shareholder (the "Shareholder") purchased 1,771,200 shares of common stock representing 20% of the outstanding common stock of the Company. Also, in accordance with this agreement, the Company granted an option to the Shareholder to purchase additional shares of common stock each January in order to maintain his 20% equity interest in the Company. A total of 18,228,800 shares of common stock have been reserved for this purpose. No shares were issued under this agreement for the years ended December 31, 2012, 2013 and 2014. As of December 31, 2014, the Shareholder had the
F-23
AmeriQuest, Inc.
Notes to Consolidated Financial Statements (Continued)
(in thousands, except share and per share data and where noted)
12. Common Stock (Continued)
right to purchase approximately 564,000 shares of common stock under this arrangement at a price equal to the fair value of the shares at the time of purchase.
Employee Stock Purchase Plan
On April 6, 2011, the Company's Board of Directors approved the Employee Stock Purchase Plan to enable full-time employees to purchase shares of the Company's common stock. The plan provides for 1,000,000 shares of common stock to be eligible for purchase by employees through the plan. This plan is considered non-compensatory per ASC 718, Compensation—Stock Compensation, as substantially all of the employees have the ability to participate, and there are no option features, as defined in ASC 718, contained within the pricing of the plan. Employees purchased 110,360, 123,804 and 46,764 shares of common stock under the plan during the years ended December 31, 2012, 2013 and 2014, respectively.
13. Stock Based Compensation
The Company's stock-based incentive compensation plans provide for the granting of awards in the form of stock options and restricted stock. The awards may be subject to the achievement of certain performance goals as determined by the Company's Board of Directors. Shares awarded under the plans are new shares that are issued by the Company.
Stock Options
Prior to 2012, the Company awarded options to purchase shares of stock to various key employees of which 405,000 are outstanding as of December 31, 2013, with exercise prices ranging from $0.20 to $0.50 per share, and a weighted-average exercise price of $0.26 per share. All of these options are fully vested and will never expire.
On January 1, 2012, the Company awarded non-qualified stock options to purchase 3,600,000 shares of stock to various key employees at an exercise price of $2.43 per share, the estimated fair value of the Company's stock on the grant date. The options vest over a four-year period and can only be exercised following a qualified event, such as, an initial public offering, a change in control or a liquidity event, as defined in the plan. The options expire on December 31, 2021. The total grant date fair value of each option was $1.24. As of December 31, 2014, the amount of vested but unrecognized compensation expense is $3,341. When an exercise event becomes probable, the Company will record all vested compensation expense. Any remaining unvested compensation expense will be recorded over the remaining vesting period.
There were no options granted during the years ended December 31, 2013 and 2014.
Stock options are valued at the grant date fair value using the Black-Scholes option pricing model. Valuations incorporate several variables, including expected term, expected volatility, and a risk-free interest rate. The expected term is derived from the terms of the option. Volatility is the expected fluctuation of the Company's stock price in the market and is derived from a combination of historical data about the Company's stock price and implied volatilities based on market data. The risk-free interest rate is the U.S. Treasury yield curve rate in effect at the date of the grant which has a contractual life similar to the option's expected term.
F-24
AmeriQuest, Inc.
Notes to Consolidated Financial Statements (Continued)
(in thousands, except share and per share data and where noted)
13. Stock Based Compensation (Continued)
The following table presents the weighted-average assumptions for options granted during the year ended December 31, 2012.
Stock price on grant date |
$ | 2.43 | ||
Expected dividends |
— | |||
Expected volatility |
49.2% | |||
Risk-free rate |
1.4% | |||
Expected term in years |
7.00 | |||
Grant date fair value |
$ | 1.24 |
The following is a summary of option activity under our stock option plans as of and for the year ended December 31, 2012. There has been no activity in the option plans during the years ended December 31, 2013 and 2014.
| |
Shares | Weighted Average Exercise Price |
Weighted Average Remaining Contractual Term (in years)* |
|||||||
|---|---|---|---|---|---|---|---|---|---|---|
Options outstanding at January 1, 2012 |
405,000 | $ | 0.26 | — | ||||||
Granted |
3,600,000 | 2.43 | 10 | |||||||
Exercised |
— | — | — | |||||||
Forfeited or expired |
— | — | — | |||||||
| | | | | | | | | | | |
Options outstanding at December 31, 2012, 2013 and 2014 |
4,005,000 | $ | 2.21 | — | ||||||
| | | | | | | | | | | |
Exercisable at December 31, 2012, 2013 and 2014 |
405,000 | $ | 0.26 | — | ||||||
| | | | | | | | | | | |
| | | | | | | | | | | |
| | | | | | | | | | | |
- *
- Options granted prior to 2012 have no contract term and do not expire.
Restricted Stock Grants
The Company's board of directors has approved the Non-Employee Director Stock Purchase Plan to enable board members to receive compensation in common stock. The plan provides for 1,000,000 shares of common stock to be eligible for board members' compensation. The Company recorded stock compensation expense for board fees of $62, $231 and $205 for the years ended December 31, 2012, 2013 and 2014, respectively. Pursuant to this plan, 30,928, 72,728 and 40,000 shares of common stock were granted for the years ended December 31, 2012, 2013 and 2014, respectively. These shares vest over one year and the related expense is recognized on a straight line basis over the vesting period.
The Company's board of directors has approved the AmeriQuest Transportation Services Inc. Equity and Incentive Plan to enable certain employees to receive compensation in common stock. Pursuant to this plan, 54,972 shares of restricted common stock were granted on July 1, 2014, which vest after three years. The Company recorded stock compensation expense for employee compensation of $45 for the year ended December 31, 2014.
F-25
AmeriQuest, Inc.
Notes to Consolidated Financial Statements (Continued)
(in thousands, except share and per share data and where noted)
13. Stock Based Compensation (Continued)
Stock based compensation charges are recorded in general and administrative expenses in the consolidated statements of income.
The following is a summary of the status of the Company's nonvested restricted stock awards as of and for the year ended December 31, 2014:
| |
Shares | Weighted Average Grant Date Fair Value |
|||||
|---|---|---|---|---|---|---|---|
Nonvested stock outstanding at January 1, 2014 |
72,728 | $ | 2.75 | ||||
Granted |
94,972 | 5.00 | |||||
Vested |
(112,728 | ) | 3.54 | ||||
| | | | | | | | |
Nonvested stock outstanding at December 31, 2014 |
54,972 | $ | 5.00 | ||||
| | | | | | | | |
| | | | | | | | |
| | | | | | | | |
As of December 31, 2014, there was $229 of remaining compensation expense to be recognized on unvested awards under these plans. All outstanding restricted stock awards vest immediately upon the consummation of an initial public offering of the Company's stock.
14. Earnings Per Share
Basic earnings per common share is computed by dividing net earnings or loss attributable to common stockholders by the weighted-average number of common shares outstanding during the period. Diluted earnings per common share is calculated by dividing net earnings by weighted-average common shares outstanding during the period plus dilutive potential common shares.
The dilutive effect of stock options and unvested restricted shares is computed using the treasury stock method, which assumes any proceeds that could be obtained upon the exercise of stock options would be used to purchase common shares at the market price for the period. The assumed proceeds include the purchase price the grantee pays, the windfall tax benefit that the Company receives upon assumed exercise and the unrecognized compensation expense at the end of each period.
Potentially dilutive securities include stock options and unvested restricted shares. The table below summarizes the impact of potentially dilutive securities.
| |
Year ended December 31, | |||||||||
|---|---|---|---|---|---|---|---|---|---|---|
| |
2012 | 2013 | 2014 | |||||||
Basic shares |
12,511,328 | 12,406,060 | 12,578,160 | |||||||
Effect of dilutive securities |
505,364 | 548,880 | 554,708 | |||||||
| | | | | | | | | | | |
Dilutive shares |
13,016,692 | 12,954,940 | 13,132,868 | |||||||
| | | | | | | | | | | |
| | | | | | | | | | | |
| | | | | | | | | | | |
The potentially dilutive effect of 3,600,000 management stock options granted on January 1, 2012 is not reflected in earnings per share under generally accepted accounting principles because such options are only exercisable upon the successful completion of an initial public offering of the Company's common stock (see note 13), which was not probable during any of the periods presented.
F-26
AmeriQuest, Inc.
Notes to Consolidated Financial Statements (Continued)
(in thousands, except share and per share data and where noted)
14. Earnings Per Share (Continued)
Unaudited Pro-Forma Diluted Earnings Per Share
Upon successful completion of an initial public offering, all performance conditions will be met, and the 3,600,000 options will vest on a straight line basis over the service period described in note 13. The following table presents diluted earnings per share for the year ended December 31, 2014, on a pro forma basis, assuming that the offering had occurred and the related performance conditions had been met at the beginning of the period. The vesting of the options had no impact on basic earnings per share.
| |
|
(Unaudited) | ||||||||
|---|---|---|---|---|---|---|---|---|---|---|
| |
As Presented | Pro forma adjustment |
As adjusted | |||||||
Net income |
$ | 6,828 | $ | — | $ | 6,828 | ||||
Diluted weighted average shares outstanding |
13,132,868 | 777,596 | 13,910,464 | |||||||
| | | | | | | | | | | |
Diluted earnings per share |
$ | 0.52 | $ | 0.03 | $ | 0.49 | ||||
| | | | | | | | | | | |
| | | | | | | | | | | |
| | | | | | | | | | | |
15. Debt
| |
Interest Rate or Range December 31, |
|
December 31, | ||||||||||
|---|---|---|---|---|---|---|---|---|---|---|---|---|---|
| |
2013 | 2014 | Maturity | 2013 | 2014 | ||||||||
Revolving line of credit |
2.75% | 2.50% | 2017 | $ | 40,000 | $ | 37,000 | ||||||
Notes payable* |
|||||||||||||
Third party financing |
4.75% - 5.30% | 4.75% - 5.30% | 2017 - 2019 | 20,584 | 23,894 | ||||||||
Third party financing |
4.45% - 4.70% | 4.45% - 4.70% | 2017 - 2018 | 5,467 | 3,743 | ||||||||
Credit Union |
6.75% | 6.75% | 2014 - 2016 | 2,562 | — | ||||||||
Bank |
3.71% - 4.04% | 3.71% - 4.04% | 2014 - 2016 | 2,074 | 1,446 | ||||||||
| | | | | | | | | | | | | | |
Total debt |
70,687 | 66,083 | |||||||||||
Current portion of notes payable |
(5,926 | ) | (5,786 | ) | |||||||||
| | | | | | | | | | | | | | |
Total long-term debt |
$ | 64,761 | $ | 60,297 | |||||||||
| | | | | | | | | | | | | | |
| | | | | | | | | | | | | | |
| | | | | | | | | | | | | | |
- *
- Secured by equipment
Revolving Line of Credit
During 2012, the Company executed a $100.0 million revolving line of credit with a financial institution (the "Revolving Line"). The Revolving Line expires in December 2017 and, at the option of the Company, bears interest at one of the following: (i) LIBOR plus 2.00% to 2.50%, or the highest of (i) the Prime Rate plus 1.00% to 1.50%, (ii) the Federal Funds Rate plus 0.50%, or (iii) the LIBOR for a 30-day interest period plus 1.00%. The Company is able to borrow up to 85% of eligible receivables. The amount of available borrowings as of December 31, 2013 and 2014 was $69,850 and $84,112, of which $40,000 and $37,000 had been drawn, respectively.
F-27
AmeriQuest, Inc.
Notes to Consolidated Financial Statements (Continued)
(in thousands, except share and per share data and where noted)
15. Debt (Continued)
The Revolving Line is secured by the Company's outstanding accounts receivable and contains customary conditions to borrowing, events of default and covenants, including covenants that restrict our ability to dispose of assets, merge with or acquire other entities, incur indebtedness, grant liens, make distributions to holders of our equity interests or make investments. The Revolving Line also prohibits us from taking accounts receivables write-offs in excess of 1% of gross CorConnect transaction dollar volume in a trailing twelve month period, and it requires us to maintain a minimum fixed charge coverage ratio. The Company was in compliance with such covenants as of December 31, 2013 and 2014.
The effective interest rate, including all fees, for the Revolving Line was approximately 5.0% and 3.9% for the years ended December 31, 2013, and 2014, respectively.
The following is a schedule of maturities of our debt as of December 31, 2014:
2015 |
$ | 5,786 | ||
2016 |
6,670 | |||
2017 |
45,165 | |||
2018 |
6,039 | |||
2019 |
2,423 | |||
| | | | | |
Total |
$ | 66,083 | ||
| | | | | |
| | | | | |
| | | | | |
Bank Line of Credit
In February 2014, the Company entered into a $7.5 million uncommitted credit agreement with a financial institution to facilitate certain short-term borrowing needs for equipment purchases of our Asset Management Solutions segment. Amounts borrowed are due within 120 days; therefore any amounts outstanding under this facility are shown as short-term debt. The credit agreement expires in February 2019 and, at the option of the Company, bears interest at LIBOR plus 2.50% or the financial institution's Prime Rate. No amounts were drawn against this line of credit as of December 31, 2014.
16. Commitments and Contingencies
Leases
The Company's operating leases for office space expire at various dates through 2022. The Company recorded rent expense under the operating leases of $1,065, $964 and $1,126 for the years ended December 31, 2012, 2013 and 2014, respectively.
F-28
AmeriQuest, Inc.
Notes to Consolidated Financial Statements (Continued)
(in thousands, except share and per share data and where noted)
16. Commitments and Contingencies (Continued)
Future minimum lease payments due from the Company over the next five years and thereafter are as follows:
2015 |
$ | 1,076 | ||
2016 |
900 | |||
2017 |
591 | |||
2018 |
574 | |||
2019 |
585 | |||
Thereafter |
1,721 | |||
| | | | | |
Total |
$ | 5,447 | ||
| | | | | |
| | | | | |
| | | | | |
Guaranteed Residuals
The Company periodically enters into agreements to remarket trucks, tractors and trailers at a residual price at the end of various third-party leases, if the lessee does not exercise their option to purchase the vehicles. The agreements require the vehicles to be maintained in accordance with manufacturer specifications and meet or exceed certain used truck standards. In certain cases the Company guarantees a portion of the residual value (expected sale price). The Company accounts for guarantees under ASC 460, Guarantees, which requires guarantees to be recorded at the fair value at the inception of the agreement. The Company calculates the estimated fair value of the guarantee obligation using a probability weighted cash flow model. Key inputs in the model include the likelihood that the guarantee will be called and the value that has been guaranteed relative to the estimated fair value of the equipment. Liabilities recorded related to these guarantees, which are included in other liabilities on the accompanying consolidated balance sheets were not significant as of both December 31, 2013 and 2014. Under terms of the agreements, future maximum annual commitments are as follows:
2016 |
$ | 380 | ||
2017 |
236 | |||
2018 |
133 | |||
2019 |
185 | |||
2020 |
765 | |||
| | | | | |
Total |
$ | 1,699 | ||
| | | | | |
| | | | | |
| | | | | |
17. Related Party Transactions
Procurement Solution Purchases
Several members of the Company's board of directors have an ownership interest in entities that make purchases through the Company's Procurement Solutions. During the years ended December 31, 2012, 2013 and 2014, companies related to the board members purchased $38,113, $39,131 and $43,237, respectively, of products through the Company's Procurement Solutions. Amounts receivable from these companies were $3,842 and $3,048 as of December 31, 2013, and 2014, respectively.
F-29
AmeriQuest, Inc.
Notes to Consolidated Financial Statements (Continued)
(in thousands, except share and per share data and where noted)
17. Related Party Transactions (Continued)
Asset Management Truck Purchases
A member of the Company's board of directors is the principal and chairman of, and has a direct ownership interest in, Advantage Truck Centers. During the years ended December 31, 2012, 2013 and 2014, the Company's Asset Management Solutions segment purchased $7.0 million, $2.0 million and $1.5 million, respectively, of trucks from Advantage Truck Centers. No amounts were payable related to these purchases as of December 31, 2013, or 2014.
Consulting Agreement
On September 6, 2003, the Company entered into an agreement with a member of the Company's board of directors, to provide strategic consulting services. This agreement terminated on December 31, 2013. In connection with the services provided by pursuant to this agreement, the Company paid the board member $43 in each of the years ended December 31, 2012 and 2013. The board member resigned from the board of directors in December 2014.
Stitzel and York Leasing
Through 2012, a former member of the Company's board of directors had a direct ownership interest in Stitzel Leasing LLC. The Company holds a $32 equity interest in Stitzel Leasing LLC, which represents approximately 16% of the underlying equity. This amount is recorded in other assets on the consolidated balance sheet.
The Company also has an agreement with Stitzel Leasing LLC and its primary shareholder whereby the Company may advance funds from time to time, at its discretion, for the purpose of financing equipment and providing working capital. As of December 31, 2013 and 2014, the balances owed to the Company under this arrangement were $711 and $797, respectively.
In addition, the Company's Asset Management Solutions segment leases certain equipment to Stitzel Leasing LLC. Revenue generated from such leases was $40, $98, and $114 during the years ended December 31, 2012, 2013 and 2014. As of December 31, 2013 and 2014, receivables related to these leases were not significant.
18. Segment Reporting
Each of the Company's operating segments, which are also its reportable segments, has a Chief Operating Decision Maker (CODM) who manages and is accountable for assessing the performance of the segment and for allocating resources to the respective segment, for which that accountability has been assigned. The operating results of each of the Company's reportable segments are evaluated based upon revenues and operating income. Separate asset disclosure is not used by the CODM as a measure of segment performance because the evaluation is driven by earnings. Therefore, segment assets are not disclosed in these notes to consolidated financial statements.
Shared services includes general expenses to support all segments that are not allocated. All of our operations are located in North America and all of our revenues are generated from customers in North America.
F-30
AmeriQuest, Inc.
Notes to Consolidated Financial Statements (Continued)
(in thousands, except share and per share data and where noted)
18. Segment Reporting (Continued)
The following tables present selected financial information by reportable segment:
| |
Year ended December 31, | |||||||||
|---|---|---|---|---|---|---|---|---|---|---|
| |
2012 | 2013 | 2014 | |||||||
Revenue: |
||||||||||
Financial Process Automation Solutions |
$ | 8,440 | $ | 18,914 | $ | 24,073 | ||||
Procurement Solutions |
10,021 | 10,391 | 12,071 | |||||||
Asset Management Solutions |
39,093 | 38,079 | 48,652 | |||||||
| | | | | | | | | | | |
Total |
$ | 57,554 | $ | 67,384 | $ | 84,796 | ||||
Segment operating income: |
||||||||||
Financial Process Automation Solutions |
$ | 2,062 | $ | 7,839 | $ | 10,009 | ||||
Procurement Solutions |
6,280 | 6,463 | 7,601 | |||||||
Asset Management Solutions |
1,185 | 4,840 | 6,916 | |||||||
| | | | | | | | | | | |
Total |
$ | 9,527 | $ | 19,142 | $ | 24,526 | ||||
| | | | | | | | | | | |
| | | | | | | | | | | |
| | | | | | | | | | | |
The reconciliation of segment operating income to income before income taxes is as follows:
| |
Year ended December 31, | |||||||||
|---|---|---|---|---|---|---|---|---|---|---|
| |
2012 | 2013 | 2014 | |||||||
Segment operating income |
$ | 9,527 | $ | 19,142 | $ | 24,526 | ||||
Shared services |
(7,386 | ) | (8,065 | ) | (9,628 | ) | ||||
Interest expense |
(1,280 | ) | (3,239 | ) | (3,296 | ) | ||||
Interest Income |
68 | 80 | 110 | |||||||
Foreign exchange (loss) gain |
43 | (382 | ) | (639 | ) | |||||
| | | | | | | | | | | |
Income before income taxes |
$ | 972 | $ | 7,536 | $ | 11,073 | ||||
| | | | | | | | | | | |
| | | | | | | | | | | |
| | | | | | | | | | | |
The following table presents depreciation and amortization by reportable segment:
| |
Year ended December 31, | |||||||||
|---|---|---|---|---|---|---|---|---|---|---|
| |
2012 | 2013 | 2014 | |||||||
Financial Process Automation Solutions |
$ | 1,071 | $ | 1,870 | $ | 3,038 | ||||
Asset Management Solutions |
8,936 | 7,977 | 7,134 | |||||||
Shared services |
334 | 344 | 450 | |||||||
| | | | | | | | | | | |
Total |
$ | 10,341 | $ | 10,191 | $ | 10,622 | ||||
| | | | | | | | | | | |
| | | | | | | | | | | |
| | | | | | | | | | | |
F-31
AmeriQuest, Inc.
Consolidated Balance Sheets (unaudited)
(in thousands except share and per share data)
| |
December 31, 2014 |
September 30, 2015 |
|||||
|---|---|---|---|---|---|---|---|
Assets |
|||||||
Current assets: |
|||||||
Cash and cash equivalents |
$ | 25,673 | $ | 32,767 | |||
Accounts receivable, net |
116,955 | 146,715 | |||||
Rebates, fees, and other receivables |
9,819 | 7,922 | |||||
Inventories, prepaid expenses, and other current assets |
7,180 | 5,349 | |||||
| | | | | | | | |
Total current assets |
159,627 | 192,753 | |||||
Property, equipment, and revenue-earning equipment, net |
40,703 | 46,038 | |||||
Goodwill |
10,306 | 10,306 | |||||
Other intangible assets, net |
543 | 523 | |||||
Other assets |
3,883 | 5,812 | |||||
| | | | | | | | |
Total assets |
$ | 215,062 | $ | 255,432 | |||
| | | | | | | | |
| | | | | | | | |
| | | | | | | | |
Liabilities and stockholders' equity |
|||||||
Current liabilities: |
|||||||
Current portion of long-term debt |
$ | 5,786 | $ | 7,120 | |||
Accounts payable |
86,666 | 104,212 | |||||
Rebates payable |
11,127 | 8,462 | |||||
Accrued expenses and other current liabilities |
9,472 | 7,119 | |||||
| | | | | | | | |
Total current liabilities |
113,051 | 126,913 | |||||
Long-term debt |
60,297 | 80,229 | |||||
Deferred income taxes |
10,695 | 12,786 | |||||
Other liabilities |
608 | 484 | |||||
| | | | | | | | |
Total liabilities |
184,651 | 220,412 | |||||
Redeemable common stock—$0.001 par value |
8,344 |
8,344 |
|||||
Stockholders' equity: |
|||||||
Common stock—$0.001 par value per share; 500,000,000 shares authorized; 5,160,396 shares issued and 3,132,088 shares outstanding at December 31, 2014; 3,428,980 shares issued and 3,415,372 shares outstanding at September 30, 2015 |
3 | 3 | |||||
Additional paid-in capital |
4,288 | 4,766 | |||||
Retained earnings |
22,196 | 22,012 | |||||
Treasury stock at cost, 2,028,308 and 13,608 shares at December 31, 2014 and September 30, 2015, respectively |
(4,420 | ) | (105 | ) | |||
| | | | | | | | |
Total stockholders' equity |
22,067 | 26,676 | |||||
| | | | | | | | |
Total liabilities, redeemable common stock, and stockholders' equity |
$ | 215,062 | $ | 255,432 | |||
| | | | | | | | |
| | | | | | | | |
| | | | | | | | |
See accompanying notes to consolidated financial statements
F-32
AmeriQuest, Inc.
Consolidated Statements of Income (unaudited)
(in thousands except share and per share data)
| |
Nine months ended September 30, |
||||||
|---|---|---|---|---|---|---|---|
| |
2014 | 2015 | |||||
Revenue: |
|||||||
Financial process automation solutions |
$ | 17,876 | $ | 21,073 | |||
Procurement solutions |
9,254 | 8,852 | |||||
Asset management solutions: |
|||||||
Sales of equipment |
19,411 | 16,457 | |||||
Service revenues |
9,749 | 11,621 | |||||
Operating lease revenue |
7,569 | 7,152 | |||||
| | | | | | | | |
Total revenues |
63,859 | 65,155 | |||||
Direct costs of revenues (excluding depreciation and amortization shown separately below): |
|||||||
Financial process automation solutions |
6,247 | 7,105 | |||||
Procurement solutions |
788 | 874 | |||||
Asset management solutions: |
|||||||
Cost of equipment sold |
18,400 | 15,607 | |||||
Direct cost of service and leasing revenue |
3,199 | 3,632 | |||||
| | | | | | | | |
Total direct costs of revenue |
28,634 | 27,218 | |||||
Operating expenses: |
|||||||
Sales and marketing |
11,149 | 12,106 | |||||
General and administrative |
6,063 | 5,638 | |||||
Depreciation and amortization |
7,750 | 9,434 | |||||
Other income |
— | (463 | ) | ||||
| | | | | | | | |
Total operating expenses |
24,962 | 26,715 | |||||
| | | | | | | | |
Operating income |
10,263 | 11,222 | |||||
Interest expense |
(2,499 | ) | (2,435 | ) | |||
Interest income |
86 | 106 | |||||
Foreign exchange loss |
(384 | ) | (1,035 | ) | |||
| | | | | | | | |
Income before income taxes |
7,466 | 7,858 | |||||
Provision for income taxes |
(2,853 | ) | (3,622 | ) | |||
| | | | | | | | |
Net income |
$ | 4,613 | $ | 4,236 | |||
| | | | | | | | |
| | | | | | | | |
| | | | | | | | |
Earnings per share: |
|||||||
Basic income per common share |
$ | 0.37 | $ | 0.34 | |||
| | | | | | | | |
| | | | | | | | |
| | | | | | | | |
Diluted income per common share |
$ | 0.35 | $ | 0.32 | |||
| | | | | | | | |
| | | | | | | | |
| | | | | | | | |
Pro forma diluted income per common share (note 12) |
$ | 0.29 | |||||
Weighted average shares outstanding: |
|||||||
Basic shares |
12,568,956 | 12,635,924 | |||||
| | | | | | | | |
| | | | | | | | |
| | | | | | | | |
Diluted shares |
13,119,856 | 13,203,104 | |||||
| | | | | | | | |
| | | | | | | | |
| | | | | | | | |
Pro forma diluted shares (note 12) |
14,517,663 | ||||||
See accompanying notes to consolidated financial statements
F-33
AmeriQuest, Inc.
Consolidated Statement of Changes in Redeemable Common Stock and Stockholders' Equity (unaudited)
(in thousands, except share data)
| |
|
|
Stockholders' Equity | |||||||||||||||||||||||||
|---|---|---|---|---|---|---|---|---|---|---|---|---|---|---|---|---|---|---|---|---|---|---|---|---|---|---|---|---|
| |
Redeemable Common Stock |
|
|
|
|
Treasury Stock at Cost |
|
|||||||||||||||||||||
| |
Common Stock | |
|
|
||||||||||||||||||||||||
| |
Additional Paid In Capital |
Retained Earnings |
|
|||||||||||||||||||||||||
| |
Shares | Amount | Shares | Amount | Shares | Amount | Total | |||||||||||||||||||||
Balance at December 31, 2014 |
9,474,596 | $ | 8,344 | 5,160,396 | $ | 3 | $ | 4,288 | $ | 22,196 | 2,028,308 | $ | (4,420 | ) | $ | 22,067 | ||||||||||||
Retirement of common stock |
— | — | (2,028,308 | ) | — | — | (4,420 | ) | (2,028,308 | ) | 4,420 | — | ||||||||||||||||
Stock-based compensation |
— | — | 117,976 | — | 206 | — | — | — | 206 | |||||||||||||||||||
Non-employee stock activity |
— | — | 137,700 | — | — | — | — | — | — | |||||||||||||||||||
Employee stock purchases |
— | — | 41,216 | — | 272 | — | — | — | 272 | |||||||||||||||||||
Repurchase of common stock |
— | — | — | — | — | — | 13,608 | (105 | ) | (105 | ) | |||||||||||||||||
Net income |
— | — | — | — | — | 4,236 | — | — | 4,236 | |||||||||||||||||||
| | | | | | | | | | | | | | | | | | | | | | | | | | | | | |
Balance at September 30, 2015 |
9,474,596 | $ | 8,344 | 3,428,980 | $ | 3 | $ | 4,766 | $ | 22,012 | 13,608 | $ | (105 | ) | $ | 26,676 | ||||||||||||
| | | | | | | | | | | | | | | | | | | | | | | | | | | | | |
| | | | | | | | | | | | | | | | | | | | | | | | | | | | | |
| | | | | | | | | | | | | | | | | | | | | | | | | | | | | |
See accompanying notes to consolidated financial statements
F-34
AmeriQuest, Inc.
Consolidated Statements of Cash Flows (unaudited)
(in thousands)
| |
Nine months ended September 30, |
||||||
|---|---|---|---|---|---|---|---|
| |
2014 | 2015 | |||||
Cash flows from operating activities: |
|||||||
Net income |
$ | 4,613 | $ | 4,236 | |||
Adjustments to reconcile net income to net cash flow from operating activities: |
|||||||
Depreciation and amortization |
7,750 | 9,434 | |||||
Bad debt expense (net of recoveries) |
1,126 | 908 | |||||
Stock-based compensation |
180 | 206 | |||||
Deferred income tax expense |
2,544 | 2,626 | |||||
Amortization of debt issuance costs |
232 | 234 | |||||
Gain on sale of assets |
— | (463 | ) | ||||
Changes in operating assets and liabilities: |
|||||||
Accounts receivable |
(20,967 | ) | (28,771 | ) | |||
Other current assets |
(1,466 | ) | 1,283 | ||||
Accounts payable |
23,348 | 17,546 | |||||
Other current liabilities |
(909 | ) | (5,019 | ) | |||
Other assets and liabilities |
(467 | ) | (340 | ) | |||
| | | | | | | | |
Net cash provided by operating activities |
15,984 | 1,880 | |||||
Cash flows from investing activities: |
|||||||
Purchases of property and equipment |
(4,692 | ) | (5,269 | ) | |||
Purchases of revenue-earning equipment |
— | (43 | ) | ||||
Sales of revenue earning equipment |
3,206 | 2,219 | |||||
Other investing activities |
9 | 10 | |||||
| | | | | | | | |
Net cash used in investing activities |
(1,477 | ) | (3,083 | ) | |||
| | | | | | | | |
Cash flows from financing activities: |
|||||||
Proceeds from line of credit |
1,191,029 | 1,260,262 | |||||
Repayments on line of credit |
(1,186,029 | ) | (1,244,229 | ) | |||
Repayments of equipment financing notes payable |
(7,682 | ) | (5,946 | ) | |||
Repurchases of common stock |
(52 | ) | (105 | ) | |||
Proceeds from the issuance of common stock |
199 | 272 | |||||
Debt issuance costs |
(26 | ) | — | ||||
Other financing activities |
(246 | ) | (1,957 | ) | |||
| | | | | | | | |
Net cash (used in) provided by financing activities |
(2,807 | ) | 8,297 | ||||
| | | | | | | | |
Net increase in cash and cash equivalents |
11,700 | 7,094 | |||||
Cash and cash equivalents, beginning of period |
22,300 | 25,673 | |||||
| | | | | | | | |
Cash and cash equivalents, end of period |
$ | 34,000 | $ | 32,767 | |||
| | | | | | | | |
| | | | | | | | |
| | | | | | | | |
Supplemental disclosures of cash flow information: |
|||||||
Cash paid for interest |
$ | 2,224 | $ | 2,146 | |||
Cash paid for income taxes |
$ | 98 | $ | 1,306 | |||
Non-cash purchases of revenue-earning equipment |
$ | 7,630 | $ | 11,180 | |||
See accompanying notes to consolidated financial statements
F-35
AmeriQuest, Inc.
Notes to Consolidated Financial Statements (unaudited)
(in thousands, except share and per share data and where noted)
1. Description of Business
AmeriQuest Business Services, Inc. was originally incorporated under the laws of New Jersey in 1996. On September 2, 2015, pursuant to the Agreement and Plan of Reorganization (the "Merger Agreement") by and among AmeriQuest, Inc., a Delaware corporation ("AmeriQuest" or the "Company"), ABS Merger Sub, Inc., a New Jersey corporation and wholly owned subsidiary of the Company ("Merger Sub") and AmeriQuest Business Services, Inc., a New Jersey corporation ("ABS"), the Company adopted a new holding company organizational structure whereby ABS became a wholly owned subsidiary of the Company. The new organizational structure was effected by the merger of Merger Sub with ABS with ABS as the surviving entity and the shareholders of ABS receiving shares of the Company in consideration for their shares of ABS (the "Merger"). The operations of the Company remained at the ABS level, thus the Merger had no impact on ABS subsidiaries, operations and customers. Accordingly, the historical financial statements reflect the effect of the reorganization for all periods presented. Pursuant to the Merger Agreement, all of the outstanding capital stock of ABS was converted, on a share for share basis, into the common stock of Company. As a result, each former shareholder of ABS became the owner of the number of shares of common stock of the Company, rounded up to the nearest whole share, if applicable, identical to the number of shares previously held in ABS and having the same designations, rights, powers and preferences, qualifications, limitations and restrictions, as those previously held. Additionally, each outstanding option to purchase shares of common stock of ABS was automatically converted into an option to purchase, upon the same terms and conditions, an identical number of shares of Company's common stock, rounded up to the nearest whole share, if applicable. Each outstanding share of restricted common stock of ABS was also converted into a share of restricted common stock of Company, rounded up to the nearest whole share, if applicable, upon the same terms and conditions. The directors and executive officers of the Company immediately after completion of the Merger are comprised of the same persons who were directors of and executive officers of ABS immediately prior to the Merger. This change in reporting entity has been retrospectively reflected in these financial statements. In addition, in connection with the reorganization all treasury shares held by ABS were retired upon execution of the reorganization.
On January 11, 2016 the Board of Directors authorized a four to one forward stock split in the form of a stock dividend, whereby each common shareholder as of January 12, 2016 received three additional shares of common stock for each share held. Consistent with the provisions of the Company's equity plans, all outstanding equity awards were proportionately adjusted. All share and per share amounts for all periods presented have been retroactively adjusted to reflect the stock split.
The Company's solutions are designed to eliminate the inefficiency, expense and lost opportunities caused by traditional paper-based processes, allowing the Company's customers to be competitive. The Company leverages its deep industry expertise, proprietary technology and customer and supplier relationships to help enterprises and organizations of varying sizes manage complex and dynamic operational and administrative processes that are frequently managed manually and require substantial internal resources.
The Company is comprised of three operating segments, which are organized based upon the nature of the products and services offered within each respective segment. The operating segments are Financial Process Automation (FPA), Procurement Solutions (Procurement) and Asset Management Solutions (AM).
The Company's financial process automation solutions consist primarily of the Company's cloud-based technology offerings that automate accounts receivable and accounts payable processes for the
F-36
AmeriQuest, Inc.
Notes to Consolidated Financial Statements (unaudited) (Continued)
(in thousands, except share and per share data and where noted)
1. Description of Business (Continued)
Company's customers, including e-invoicing, credit and collections management, working capital management and reporting analytics. These solutions are delivered through two products: CorConnect, the Company's accounts receivable automation platform; and COR360, the Company's accounts payable automation platform. The Company's procurement solutions leverage its financial process automation technology to conduct group purchasing, enabling companies to optimize their procurement processes from sourcing through payment. The Company's asset management solutions provide data-driven strategic planning, asset acquisition and disposition, and asset financing and usage alternatives to help businesses lower the total cost of capital asset ownership. The Company's cloud-based solutions are highly scalable and offered in an `a la carte format, so that the Company's customers can selectively purchase those solutions that they need. These complementary business solutions enable the Company to capitalize on its customer and supplier network, cross-selling opportunities and operational scale.
2. Basis of Presentation
Interim Financial Statements
These interim consolidated financial statements are unaudited and have been prepared in accordance with U.S. generally accepted accounting principles ("U.S. GAAP") on the same basis as the audited consolidated financial statements for the year ended December 31, 2014 included elsewhere in this registration statement, and, in the opinion of management, include all adjustments of a normal recurring nature considered necessary to present fairly the Company's financial position at September 30, 2015, and the results of operations and cash flows for the nine months ended September 30, 2014 and 2015. The results of operations for the nine months ended September 30, 2015 are not necessarily indicative of the results that may be expected for the year ending December 31, 2015 or any other future periods. Certain information and note disclosures normally included in the financial statements prepared in accordance with U.S. GAAP have been condensed or omitted under the SEC's rules and regulations. These unaudited interim consolidated financial statements should be read in conjunction with the audited consolidated financial statements and accompanying notes for the year ended December 31, 2014. The accompanying unaudited consolidated financial statements have been prepared in accordance with the instructions to the Quarterly Report on Form 10-Q and, therefore, do not include all information and footnotes required by U.S. GAAP for complete financial statements.
Principles of Consolidation
The accompanying consolidated financial statements include the accounts of AmeriQuest and its subsidiaries and variable interest entities ("VIEs") for which the Company is the primary beneficiary. All intercompany balances and transactions have been eliminated in consolidation.
The Company sponsors the ATS master trust (the "Trust"), which is a vehicle titling trust that is primarily used to facilitate the Company's lease brokerage transactions. The Trust's primary purpose is to limit the administrative burden associated with recording liens and retitling vehicles at the department of motor vehicles if a lessor elects to assign its interest in a lease to another party.
The Company has determined that the Trust is a variable interest entity pursuant to ASC 810. The Trust consists of legally distinct portfolio interests, whereby the assets of each portfolio interest are not
F-37
AmeriQuest, Inc.
Notes to Consolidated Financial Statements (unaudited) (Continued)
(in thousands, except share and per share data and where noted)
2. Basis of Presentation (Continued)
available to creditors or beneficial interest holders of other portfolio interests, and the liabilities of each portfolio interest cannot be enforced against other portfolio interests. The Company has also determined that each portfolio interest constitutes a "silo" pursuant to ASC 810.
The Company holds a variable interest in and is the primary beneficiary of the general Trust interest, and one of the portfolio interests that are held within the Trust and therefore consolidates the assets held in those interests in its consolidated financial statements. The consolidated financial statements include $690 of assets and no liabilities held in such interests as of September 30, 2015 and assets and liabilities within such interests were insignificant as of December 31, 2014.
The Trust also holds certain assets in other portfolio interests for which other parties (principally financial institutions who purchase the assets) are the primary beneficiaries and therefore such portfolio interests are not consolidated in the Company's financial results.
The Company has entered into remarketing and residual value guarantee agreements with financial institutions holding certain portfolio interests (see Note 14).
Use of Estimates
The preparation of financial statements in conformity with U.S. generally accepted accounting principles (U.S. GAAP) requires management to make estimates and assumptions that affect the reported amounts of assets, liabilities, revenues, expenses and disclosure of contingent assets and liabilities at the date of the financial statements, and reported amounts of revenues and expenses during the reporting period. On an ongoing basis, management evaluates its estimates, including but not limited to those related to: (1) the fair value of assets acquired and liabilities assumed for business combinations, (2) the realization of tax assets and estimates of tax liabilities, (3) the valuation of the Company's common stock, (4) the recognition and disclosure of contingent liabilities, (5) the collectability of accounts receivable, (6) the useful lives of long-lived assets (including definite lived intangible assets), (7) the evaluation of revenue recognition criteria, and (8) assumptions used in the Black-Scholes option-pricing model to determine the fair value of stock-based compensation. These estimates are based on historical data and experience, as well as various other factors that management believes to be reasonable under the circumstances, the results of which form the basis for making judgments about the carrying value of assets and liabilities that are not readily apparent from other sources. The Company has engaged and may, in the future, engage third-party valuation specialists to assist with estimates related to the valuation of its common stock, and the valuation of assets and liabilities acquired in business combinations. Such estimates often require the selection of appropriate valuation methodologies and models, and significant judgment in evaluating ranges of assumptions and financial inputs.
Although the Company believes the estimates and assumptions used in determining the recorded amounts in the accompanying consolidated financial statements are reasonable, actual results may differ from those estimates under different assumptions or circumstances.
F-38
AmeriQuest, Inc.
Notes to Consolidated Financial Statements (unaudited) (Continued)
(in thousands, except share and per share data and where noted)
3. Summary of Significant Accounting Policies
Significant Accounting Policies
The Company's significant accounting policies are disclosed in the audited consolidated financial statements for the year ended December 31, 2014 included elsewhere in this registration statement. Since the date of those financial statements, there have been no material changes to the Company's significant accounting policies.
Revenue Recognition
The Company recognizes revenue when persuasive evidence of an arrangement exists, the services have been rendered to the customer or delivery has occurred, the pricing is fixed or determinable, and collectability is reasonably assured.
Financial process automation solutions
The Company generates financial process automation solutions revenue from two principal products: CorConnect, the Company's accounts receivable platform; and COR360, the Company's accounts payable platform. Key revenue sources and the related recognition policies are as follows:
Transaction fees: The Company assesses fees for transaction processing, which are based upon either a fixed amount per transaction or a percentage of the transaction value. Such fees are recognized at the time that the transaction is processed and validated in the Company's system.
Monthly usage fees: The Company charges monthly usage fees when the Company hosts and provides software to its customers to facilitate efficient transaction processing. These fees are recognized each month when the Company begins to provide the hosting service under the terms of the agreement.
Implementation and training fees—These fees are generally a fixed amount for each new customer and are assessed at the beginning of a contract. As noted below, they do not qualify as a separate unit of accounting and therefore are deferred and recognized over the period of the expected customer relationship.
Procurement solutions
The Company receives procurement solutions revenue from both purchasers and the Company's suppliers as follows:
Revenue from purchasers—Purchasers in the Company's procurement networks pay a fee to the Company in connection with their transactions. Fees are based on a product margin that varies by procurement program and typically includes a nominal fee per invoice.
Revenue from suppliers—Suppliers that participate in the Company's network pay a fee to the Company calculated either as a percentage of the transaction value under specific preferred procurement programs or as a pre-determined fee per transaction or item. In addition, many suppliers pay the Company volume based rebates on a quarterly or annual basis, a portion of which is passed through to customers and a portion of which is retained by the Company.
Fees from both suppliers and purchasers are recognized when the underlying customer order has been fulfilled.
F-39
AmeriQuest, Inc.
Notes to Consolidated Financial Statements (unaudited) (Continued)
(in thousands, except share and per share data and where noted)
3. Summary of Significant Accounting Policies (Continued)
Rebate revenue is recognized based upon the actual purchase volume achieved in the period. Rebate revenue is recognized net of any amounts that are passed through to customers.
Asset management solutions
The Company's Asset Management solutions provide a comprehensive offering of data-driven fleet management services including vehicle remarketing, asset planning and financing, and leasing and maintenance services. Key revenue sources and the related recognition policies are as follows:
Sales of equipment—The Company purchases equipment (primarily trucks) for resale. Revenue on equipment sales are recognized when (1) an agreement of sale has been reached, (2) the customer has secured a funding source, and (3) the customer has taken title and possession of the vehicle.
Operating lease revenues—Revenue from operating leases under ASC 840 is recognized on a straight line basis over the lease term. Revenue recognition ceases when the Company has not received any payments from the customer for a period of 6 weeks.
Service revenues—Service revenues consist primarily of (1) lease brokerage fees, which are recognized when the underlying lease transaction is consummated, (2) equipment brokerage fees from manufacturers, which are recognized when our customers purchase a capital asset from a specific vendor within the Company's supplier network, (3) membership dues, which are recognized on a straight line basis over the period that membership services are provided, and (4) maintenance fees, which represent a markup on maintenance services arranged by the Company and are recognized when the related service is performed by the third-party provider.
Up front fees:
Although the Company does not offer bundled pricing for its various service offerings, the Company's contracts with customers within the FPA and AM segments often require customers to pay "up front" implementation or contract set up fees, which are deferred and recognized over the estimated period that the contract or customer relationship is expected to generate revenue.
Within the FPA segment, these fees are charged at the beginning of the customer relationship as compensation for the Company's efforts to configure the system to specific customer's needs and provide training to the customer. These fees do not represent a separate unit of accounting as they do not have value apart from the broader transaction processing contract. As a result, they are recognized on a straight line basis over the estimated life of the customer relationship, which ranges from 3-5 years.
Within the AM segment, these fees are assessed at the inception of our operating leases in order to compensate the Company for its costs incurred in preparing the asset for lease. These fees do not represent a separate unit of accounting as they do not have value apart from the related lease. As a result, they are recognized on a straight-line basis over the contract term.
Cash and Cash Equivalents
Cash and cash equivalents are comprised of cash deposits with banks and highly liquid investments with original maturities of three months or less.
F-40
AmeriQuest, Inc.
Notes to Consolidated Financial Statements (unaudited) (Continued)
(in thousands, except share and per share data and where noted)
3. Summary of Significant Accounting Policies (Continued)
Lease Classification
The Company evaluates its owner operator leases on a lease by lease basis to determine whether lease payments are reasonably predictable. The Company's experience indicates that the vast majority of its leases will terminate prior to the expiration of the term, with most of the terminations occurring within one year of the initial lease commencement. As the Company is unable to conclude that the payments under such leases are reasonably predictable over the contractual lease term, its owner-operator leases have been classified as operating leases in the financial statements as required by ASC840.
Accounts Receivable
Accounts receivable includes amounts due from the Company's customers in the normal course of business. The Company generates accounts receivable when customers in its purchasing programs purchase a product from one of the suppliers, who also participates in the Company's purchasing programs. Although the Company is not responsible for the delivery of the underlying goods, it acts as an intermediary between the parties and bears all risk associated with paying the supplier and collecting from the customer. The Company also generates accounts receivable when lease payments become due under its operating leases. These receivables are short term, with an average maturity around 35 days, and do not bear interest.
Allowance for Doubtful Accounts
The Company manages its accounts receivable by regularly monitoring the financial strength of its customers and adjusting credit limits and security requirements accordingly. Customers with a strong financial position and payment history are given more favorable credit terms, while customers in a weaker financial position or with a history of late payments are subject to more stringent credit limits and may be required to post a security deposit or other collateral. When accounts become past due, the Company responds by placing collection calls and limiting additional customer purchases. If accounts are not collected after these initial efforts, the Company may take action against any collateral or security deposits that it may have obtained. If all of its collection efforts prove unsuccessful, the Company may refer its accounts receivable to collection agencies for a nominal price, which earn a commission on any amounts collected. If the collection agency is unable to make any collections for a period of 90 days after the account has been referred, the receivables are written off. The Company's collection policies have historically been successful in collecting the majority of at risk accounts.
A significant portion of our accounts receivables are generated by our Procurement and Financial Process Automation solutions businesses (also referred to as program receivables). The Company develops its allowance for doubtful accounts receivable based upon its historical experience with customers and the age of its underlying receivables. Each customer account is assigned a risk rating based upon the customer's financial strength, payment history and any known actions, such as liquidation or bankruptcy. An allowance is established for each customer account after considering the historical level of write offs for customers with a similar risk profile, any known economic or industry trends, and customer specific information. This assessment is done on a customer by customer basis each quarter. As the customer risk rating and the age of the underlying receivables increases the Company's allowance for that account is also increased. While the Company does not currently foresee any significant changes in its ability to collect its receivables, deterioration in the financial strength of
F-41
AmeriQuest, Inc.
Notes to Consolidated Financial Statements (unaudited) (Continued)
(in thousands, except share and per share data and where noted)
3. Summary of Significant Accounting Policies (Continued)
its customers could cause a significant increase in the Company's historical level of write offs and the related bad debt expenses. See additional information regarding the Company's accounts receivable in note 5 to the consolidated financial statements.
The Company assesses finance charges when accounts are past due. Finance charge revenue is recognized when cash is received, as management does not believe collectability will be reasonably assured until that point.
Inventories
Inventories consist of equipment, primarily trucks, which the Company has purchased with the intent to sell in the normal course of business and are stated at the lower of cost or market, using the specific identification costing method.
Deferred Contract Costs
The Company incurs certain costs to implement customer contracts within its AM and FPA segments. These costs are recovered from the customer through fees that are charged and collected at the inception of the contract. The costs incurred and the related revenues are deferred and amortized over the contract term (within AM) or estimated life of the customer relationship (within FPA). The deferred contract costs consist primarily of third-party costs incurred to bring an asset in line with customer specifications (within the AM segment) and payroll incurred related to employees working directly on the customer contracts (within both the AM and the FPA segments).
Software Development Costs
The Company capitalizes certain development costs incurred to acquire or create the Company's internal-use software. These capitalized costs are primarily related to applications hosted by the Company and accessed by the Company's customers. Costs incurred in the preliminary stages of development are expensed as incurred. Once the application development stage is reached, internal and external costs, if direct and incremental, are capitalized until the software is substantially complete and ready for its intended use. Capitalization ends when all substantial testing is complete. The Company's internal capitalized costs consist primarily of direct labor and fringe benefits. The Company also capitalizes costs related to specific upgrades and enhancements when it is probable the expenditures will result in additional functionality. Capitalized costs are included in the internally developed software class in property, equipment and revenue-earning equipment, net. These costs are amortized on a straight-line basis over their estimated useful life, which is typically three years. Maintenance and training costs are expensed as incurred. Management evaluates the remaining useful lives of these assets on an annual basis and tests for impairment whenever events or changes in circumstances occur that could impact the recoverability of these assets. There were no impairments of the Company's internally developed software during any of the periods presented.
Property and Equipment
Property and equipment consist primarily of internally developed software, purchased software, computer hardware, office equipment, furniture, and leasehold improvements and are recorded at cost,
F-42
AmeriQuest, Inc.
Notes to Consolidated Financial Statements (unaudited) (Continued)
(in thousands, except share and per share data and where noted)
3. Summary of Significant Accounting Policies (Continued)
net of accumulated depreciation and amortization. Depreciation on property and equipment is computed using the straight-line method and expensed over the estimated useful lives of the assets.
Revenue-Earning Equipment
Revenue-earning equipment consists of equipment, primarily trucks, which are either on lease with a customer or in the Company's possession awaiting assignment. Depreciation on revenue-earning equipment is recorded using the straight-line method over the assets' useful lives, which range from 2.5 to 10 years. The Company periodically reviews and adjusts, as appropriate, the residual values and useful lives of the revenue-earning equipment. The Company's review of the residual values and useful lives of revenue-earning equipment is established with a long-term view considering historical market price changes, current and expected future market price trends, and the expected life of the equipment.
Goodwill and Other Intangible Assets
Goodwill and intangible assets deemed to have indefinite lives are not amortized but rather are tested at least annually for impairment, or when circumstances indicate that the carrying amount of the asset may not be recoverable. Goodwill is tested for impairment at the reporting unit level. A reporting unit is an operating segment or a component of an operating segment. Goodwill is tested for impairment by either performing a qualitative evaluation or a two-step quantitative test. The qualitative evaluation is an assessment of factors to determine whether it is more likely than not that the fair value of a reporting unit is less than its carrying amount, including goodwill. The Company may elect not to perform the qualitative assessment for some or all reporting units and perform a two-step quantitative impairment test. For purposes of performing the two-step quantitative test, fair value is determined based on discounted cash flow analysis, and the use of market multiples applied to the reporting unit's earnings. Both valuation methods include significant management assumptions such as revenue growth rates, operating margins, weighted average cost of capital, the selection of comparable companies, and future economic and market conditions. If the carrying value of the reporting unit exceeds fair value, goodwill is considered impaired. The amount of the impairment is the difference between the carrying value of the goodwill and its "implied" fair value, which is calculated as if the reporting unit had just been acquired and accounted for as a business combination.
Goodwill is $7,191 in our Procurement segment and $3,115 in our AM segment as of both December 31, 2014 and September 30, 2015. No impairment of goodwill has been recorded since the businesses were acquired. For its most recent annual impairment test, the Company performed a quantitative test for all of its reporting units.
Indefinite-lived intangible assets consist of trademarks and are tested for impairment by comparing the fair value of the asset to the carrying value. Fair value is determined based on discounted cash flow analyses that include significant management assumptions such as revenue growth rates, weighted average cost of capital, and assumed royalty rates. If the fair value is less than the carrying value, the asset is reduced to fair value.
Definite-lived intangible assets consist primarily of customer relationships, which are being amortized based on estimated customer attrition of 25 years.
F-43
AmeriQuest, Inc.
Notes to Consolidated Financial Statements (unaudited) (Continued)
(in thousands, except share and per share data and where noted)
3. Summary of Significant Accounting Policies (Continued)
Impairment of Long-Lived Assets, Including Definite-Lived Intangible Assets
Long-lived assets held and used by the Company are reviewed for impairment whenever events or changes in circumstances indicate that the carrying amount of an asset may not be recoverable. Recoverability of long-lived assets is evaluated by comparing the carrying amount of an asset or asset group to management's best estimate of the undiscounted future operating cash flows expected to be generated by the asset or asset group. If these comparisons indicate that the carrying amount of the asset or asset group is not recoverable, an impairment loss is recognized for the amount by which the carrying value exceeds fair value. Fair value is determined by quoted market price, if available, or an estimate of projected future operating cash flows. Long-lived assets and certain identifiable intangibles to be disposed of are reported at the lower of carrying amount or fair value less cost to sell.
Other Assets
Other assets include deferred legal, accounting, and underwriting charges related to the Company's planned initial public offering. When the planned offering is completed, these costs will be recorded in equity as an offset to the proceeds raised. Other assets also include costs incurred to establish the Company's revolving credit agreement. These costs are deferred and amortized into interest expense on a straight-line basis over the term of the facility.
Stock-Based Compensation
The Company offers stock options to certain employees and accounts for stock-based compensation in accordance with the Financial Accounting Standards Board (FASB) Accounting Standards Codification (ASC) 718, Compensation—Stock Compensation, by recognizing the fair value of stock-based compensation in the consolidated statements of income. The fair value of the Company's stock option awards are estimated using a Black-Scholes option valuation model. This model requires the input of highly subjective assumptions including expected stock price volatility and the estimated life of each award. In addition, the calculation of compensation costs requires that the Company estimate the number of awards, if any, that will be forfeited during the vesting period. The fair value of a stock award is recognized over the vesting period of the award net of estimated forfeitures, if any. For stock-based awards that vest based on performance conditions (e.g., the achievement of certain milestones), expense is recognized over the remaining vesting period beginning on the date that it is probable the condition will be met.
The Company offers restricted stock awards to its board of directors and certain key executives. These awards do not contain performance conditions and vest at the end of the related service periods, which range from one to three years. The Company recognizes expenses for the grant date fair value of the awards on a straight-line basis over the vesting period.
Income Taxes
The Company accounts for deferred income taxes under the asset and liability method of accounting for income taxes. The objective of the asset and liability method is to recognize an asset or liability for the expected future tax effects attributable to temporary differences between the financial reporting and tax bases of assets and liabilities. Under the asset and liability method, deferred tax assets and liabilities are adjusted to reflect changes in tax rates and other provisions of the tax law in
F-44
AmeriQuest, Inc.
Notes to Consolidated Financial Statements (unaudited) (Continued)
(in thousands, except share and per share data and where noted)
3. Summary of Significant Accounting Policies (Continued)
the period in which such changes are enacted. Deferred tax assets are recognized unless it is more likely than not that some portion or all of the deferred tax assets will not be realized. Based upon the available evidence, management has determined that no valuation allowance is necessary as of December 31, 2014 and September 30, 2015.
The Company follows guidance issued by the FASB for financial statement recognition, measurement and disclosure of uncertain tax positions recognized in an enterprise's financial statements. Significant management judgment is required to determine the amount of benefit to be recognized in relation to an uncertain tax position. The Company uses a two-step process to evaluate tax positions. The first step requires an entity to determine whether it is more likely than not (greater than 50% chance) that the tax position will be sustained. The second step requires an entity to recognize in the financial statements the benefit of a tax position that meets the more likely than not recognition criterion. The amounts ultimately paid upon resolution of issues raised by taxing authorities may differ materially from the amounts accrued and may materially impact the financial statements of the Company in future periods. The Company's policy is to recognize interest and penalties accrued on any unrecognized tax benefits as a component of interest expense and other operating expense, respectively. The amount of interest and penalties recorded is insignificant in all periods presented.
Advertising Expense
The Company expenses the cost of advertising as incurred. Advertising expense was $1,073 and $934 for the nine months ended September 30, 2014, and 2015, respectively.
Foreign Currency
The Company's foreign currency denominated assets and liabilities consist of receivables, payables, and cash balances, principally denominated in Canadian dollars and are remeasured into U.S. dollars at end of period exchange rates, with any fluctuations caused by changes in exchange rates being recorded directly to earnings during the period of the change.
Fair Value
The carrying amounts of financial instruments held by the Company, which include cash and cash equivalents, accounts receivable, rebates receivable and payable, other current assets, accounts payable, accrued expenses, and other current liabilities, approximate fair value due to the short-term nature of those instruments. In addition, the carrying value of the Company's debt instruments, which do not have readily ascertainable market values and would be classified as level 2 within the hierarchy below, approximate market value, given that the interest rates on the borrowings approximate market rates.
The FASB accounting guidance establishes a three-level fair value hierarchy that prioritizes the inputs used to measure fair value. This hierarchy requires entities to maximize the use of observable inputs and minimize the use of unobservable inputs. The three levels of inputs used to measure fair value are as follows:
- •
- Level 1—inputs are unadjusted quoted prices in active markets for identical assets or liabilities that the Company can access at the measurement date
F-45
AmeriQuest, Inc.
Notes to Consolidated Financial Statements (unaudited) (Continued)
(in thousands, except share and per share data and where noted)
3. Summary of Significant Accounting Policies (Continued)
- •
- Level 2—inputs include quoted prices for similar assets or liabilities in active markets, quoted prices for
identical or similar assets or liabilities in markets that are not active, and inputs other than quoted prices that are observable for the asset or liability
- •
- Level 3—inputs are unobservable inputs for the asset or liability
The classification of a fair value measurement of an asset or liability within the fair value hierarchy is based on the lowest level of any input that is significant to the fair value assessment.
Subsequent Events
The Company has evaluated subsequent events through November 9, 2015, which is the date the financial statements were available to be issued. No material subsequent events have occurred since September 30, 2015, that require recognition or disclosure in the consolidated financial statements, other than those matters disclosed below, and elsewhere in the consolidated financial statements.
On September 2, 2015, in connection with a planned equity offering, the Company effected a corporate reorganization. Pursuant to this reorganization, AmeriQuest, Inc., a Delaware corporation formed in April 2015, acquired all of the outstanding shares of capital stock of AmeriQuest Business Services, Inc., or ABI, in a share exchange. Following such reorganization, ABI became a wholly owned subsidiary of AmeriQuest, Inc.
4. Recent Accounting Pronouncements
In May 2014, the FASB issued ASU No. 2014-09, Revenue from Contracts with Customers. The standard will eliminate the transaction-specific and industry-specific revenue recognition guidance under current U.S. GAAP and replace it with a principle based approach for determining revenue recognition. Public entities are required to apply the revenue recognition standard for annual reporting periods beginning after December 15, 2017, including interim periods within that annual reporting period. However, because the Company is an "emerging growth" company under the JOBS Act, the Company is able to defer application of this standard until the effective date for private companies, which is for any annual reporting period beginning after December 15, 20l8 and includes any interim reporting periods therein. Early application is not permitted. The Company has not yet selected a transition method and is evaluating the effect that the updated standard will have on its consolidated financial statements and related disclosures.
In April 2015, the FASB updated the accounting guidance related to the balance sheet presentation of debt issuance costs. The updated accounting guidance requires that debt issuance costs be presented as a direct deduction from the associated debt liability. In August 2014, this guidance was further clarified to indicate that debt issuance costs associated with revolving credit facilities will continue to be presented as a deferred asset on the balance sheet. The updated accounting guidance will be effective for us on January 1, 2016, and early adoption is permitted. The updated accounting guidance will be applied retrospectively to all prior periods presented. We do not currently expect that the updated accounting guidance will have a material impact on our consolidated balance sheet.
F-46
AmeriQuest, Inc.
Notes to Consolidated Financial Statements (unaudited) (Continued)
(in thousands, except share and per share data and where noted)
4. Recent Accounting Pronouncements (Continued)
In September 2015, the FASB issued Accounting Standards Update No. 2015-16, Business Combinations (Topic 805): Simplifying the Accounting for Measurement-Period Adjustments (ASU 2015-16), to simplify the accounting for adjustments made to provisional amounts recognized in a business combination and eliminate the requirement to retrospectively account for those adjustments. ASU 2015-16 is effective for annual reporting periods beginning after December 15, 2016, and interim periods therein, with early adoption permitted for financial statements that have not been issued. We adopted ASU 2015-16 during the third quarter of 2015, and the adoption of this standard did not have a material impact on our consolidated financial statements.
In November 2015, the FASB issued ASU 2015-07, Income Taxes—Balance Sheet Classification of Deferred Taxes ASU 2015-07, which requires all deferred tax liabilities and assets to be presented in the balance sheet as noncurrent. The Company does not expect the provision of ASU 2015-07 to have a material impact on its consolidated financial statements, as the application of this guidance affects classification only. The Company plans to early adopt this update in connection with its annual reporting period ending December 31, 2015.
5. Accounts Receivable
| |
December 31, 2014 |
September 30, 2015 |
|||||
|---|---|---|---|---|---|---|---|
Program receivables |
$ | 118,523 | $ | 148,149 | |||
Operating lease receivables |
665 | 557 | |||||
Less: allowance for doubtful accounts |
|||||||
Program receivables |
(2,030 | ) | (1,908 | ) | |||
Operating lease receivables |
(203 | ) | (83 | ) | |||
| | | | | | | | |
Accounts receivable, net |
$ | 116,955 | $ | 146,715 | |||
| | | | | | | | |
| | | | | | | | |
| | | | | | | | |
As of December 31, 2014 and September 30, 2015, respectively, $118,523 and $148,149, respectively, of our accounts receivable were pledged as collateral to secure our revolving line of credit (see note 13).
The Company's operating lease receivables are generally billed weekly and due within three weeks of billing. These receivables are considered to be at risk of default when they reach six weeks of age, at which time the Company records a full valuation allowance against such receivables.
Based upon its historical experience, the Company does not consider its program receivables to be at risk of default until they reach the age of 90 days. The table below summarizes the Company's at risk receivables as of December 31, 2014 and September 30, 2015.
| |
December 31, 2014 |
September 30, 2015 |
|||||
|---|---|---|---|---|---|---|---|
At risk program receivables |
$ | 6,062 | $ | 9,049 | |||
Operating lease receivables |
172 | 50 | |||||
Allowance for at risk program receivables |
(1,820 | ) | (1,624 | ) | |||
Allowance for at risk operating lease receivables |
(172 | ) | (50 | ) | |||
| | | | | | | | |
Net carrying value of at risk receivables |
$ | 4,242 | $ | 7,425 | |||
| | | | | | | | |
| | | | | | | | |
| | | | | | | | |
F-47
AmeriQuest, Inc.
Notes to Consolidated Financial Statements (unaudited) (Continued)
(in thousands, except share and per share data and where noted)
6. Inventories, Prepaid Expenses, and Other Current Assets
| |
December 31, 2014 |
September 30, 2015 |
|||||
|---|---|---|---|---|---|---|---|
Deferred income taxes |
$ | 2,021 | $ | 1,487 | |||
Prepaid expenses and other current assets |
1,787 | 1,899 | |||||
Inventories |
2,424 | 691 | |||||
Deferred contract costs |
542 | 647 | |||||
Prepaid income taxes |
406 | 625 | |||||
| | | | | | | | |
Total |
$ | 7,180 | $ | 5,349 | |||
| | | | | | | | |
| | | | | | | | |
| | | | | | | | |
7. Property, Equipment, and Revenue-Earning Equipment
| |
Estimated Useful Lives (in years) |
December 31, 2014 |
September 30, 2015 |
||||||
|---|---|---|---|---|---|---|---|---|---|
Internally developed software |
3 | $ | 12,447 | $ | 16,901 | ||||
Computer hardware and software |
3 - 5 | 5,667 | 6,472 | ||||||
Office equipment, furniture, and leasehold improvements |
7 | 399 | 407 | ||||||
| | | | | | | | | | |
|
18,513 | 23,780 | |||||||
Accumulated depreciation and amortization |
(9,316 | ) | (12,939 | ) | |||||
| | | | | | | | | | |
Property and equipment, net |
9,197 | 10,841 | |||||||
Revenue-earning equipment |
2.5 - 10 |
44,657 |
49,987 |
||||||
Accumulated depreciation |
(13,151 | ) | (14,790 | ) | |||||
| | | | | | | | | | |
Revenue earning equipment, net |
31,506 | 35,197 | |||||||
| | | | | | | | | | |
Property, equipment, and revenue-earning equipment, net |
$ | 40,703 | $ | 46,038 | |||||
| | | | | | | | | | |
| | | | | | | | | | |
| | | | | | | | | | |
Amortization expense related to internally developed software was $1,730 and $2,816 for the nine months ended September 30, 2014, and 2015, respectively. Accumulated amortization related to internally developed software was $5,177, and $7,993 as of December 31, 2014 and September 30, 2015, respectively.
Revenue-earning equipment consists of equipment, primarily trucks, which are either on lease with a customer or in the Company's possession awaiting assignment. Depreciation expense related to revenue-earning equipment was $5,355, and $5,777 for the nine months ended September 30, 2014, and 2015, respectively.
F-48
AmeriQuest, Inc.
Notes to Consolidated Financial Statements (unaudited) (Continued)
(in thousands, except share and per share data and where noted)
8. Accrued Expenses and Other Current Liabilities
| |
December 31, 2014 |
September 30, 2015 |
|||||
|---|---|---|---|---|---|---|---|
Employment-related accruals |
$ | 3,681 | $ | 2,618 | |||
Pool and maintenance liabilities |
1,036 | 826 | |||||
Refundable deposits |
1,018 | 1,083 | |||||
Deferred revenue |
835 | 758 | |||||
Other accrued expenses |
2,902 | 1,834 | |||||
| | | | | | | | |
Total |
$ | 9,472 | $ | 7,119 | |||
| | | | | | | | |
| | | | | | | | |
| | | | | | | | |
Employment-related accruals include costs for salaries, commissions, bonuses, and benefits.
Pool and maintenance liabilities are comprised of certain amounts collected from lessees to cover annual equipment registrations and maintenance costs for leased equipment. The amounts are deposited into the Company's operating cash account and the accumulated balances are tracked for each lease. At the end of the lease term, if the lessee fulfills the lessee's obligations under the lease agreement, any unused maintenance liability will be paid back to the lessee. If the lessee defaults on the lease, any unused maintenance funds will be retained by the Company.
Refundable deposits include amounts collected in advance from certain customers in order to limit credit risk.
Deferred revenue primarily consists of up-front implementation and contract set-up fees that are collected from customers at the inception of contracts within our AM and FPA segments. These costs are amortized over the contract term (within AM) or the expected life of the customer relationship (within FPA).
Other accrued expenses include accruals for income taxes payable and general corporate expenditures such as travel, telephone, postage, and utilities.
9. Income Taxes
During the nine months ended September 30, 2014 and 2015, the Company's effective tax rate was 38.2% and 46.1%, respectively. The increase in the effective tax rate is primarily due to higher estimated state taxes resulting from changes in the Company's state tax apportionments as its operations within higher tax jurisdictions increased during 2015. The Company's 2015 tax rate includes an adjustment of $435 or 5.5% of pretax income, related to the correction of 2014 state tax apportionments that were determined in connection with the filing of the Company's state tax returns.
10. Equity
Preferred Stock
Under the terms of the Company's certificate of incorporation, its Board of Directors is authorized to issue shares of preferred stock in one or more series without stockholder approval. The Company's Board of Directors has the discretion to determine the rights, preferences, privileges and restrictions, including voting rights, dividend rights, conversion rights, redemption privileges and liquidation preferences, of each series of preferred stock.
The purpose of authorizing the Company's Board of Directors to issue preferred stock and determine its rights and preferences is to eliminate delays associated with a stockholder vote on specific issuances. The issuance of preferred stock, while providing flexibility in connection with possible future
F-49
AmeriQuest, Inc.
Notes to Consolidated Financial Statements (unaudited) (Continued)
(in thousands, except share and per share data and where noted)
10. Equity (Continued)
acquisitions and other corporate purposes, will affect, and may adversely affect, the rights of holders of common stock. The Company has 25,000,000 shares of preferred stock authorized for issuance with no shares issued and outstanding with a par value of $0.001 per share.
Common Stock
All common stock issued is restricted stock which limits its marketability. Under the Shareholders' Agreement, the Company has the right of first refusal to repurchase the stock at a price determined under the agreement.
Redeemable Common Stock
Under certain circumstances including a change in the control of the shareholder and transfer of the shares due to legal process, such as bankruptcy, receivership or divorce, as defined in the Shareholder Agreement, the Company may be required to repurchase shares from certain shareholders at a purchase price equal to the fair value of the shares as of the date of the triggering event.
The Company has classified equity subject to the redemption provisions outside of permanent equity on its consolidated balance sheets. Such amounts have been recorded at their historical cost because they are not currently redeemable and the occurrence of a triggering event as defined in the related Shareholder Agreements is not probable at this time.
Share redemption provisions are automatically terminated upon completion of a successful initial public offering of the Company's common stock at which time the redeemable common stock will be reclassified into permanent equity.
Stock Purchase Agreement
On June 1, 1999, the Company entered into a stock purchase agreement in which the Company's largest shareholder (the Shareholder) purchased 1,771,200 shares of common stock representing 20% of the outstanding common stock of the Company. Also, in accordance with this agreement, the Company granted an option to the Shareholder to purchase additional shares of common stock each January in order to maintain his 20% equity interest in the Company. A total of 18,228,800 shares of common stock have been reserved for this purpose. No shares were issued under this agreement during 2014 or 2015. On February 5, 2015, as further amended on December 18, 2015, an amendment was executed, which provided for the immediate cancellation of the purchase option. However, if an initial public offering of the Company's common stock does not become effective prior to June 30, 2016, the cancellation is void.
Employee Stock Purchase Plan
On April 6, 2011, the Company's Board of Directors approved the Employee Stock Purchase Plan to enable full-time employees to purchase shares of the Company's common stock. The plan provides for 1,000,000 shares of common stock to be eligible for purchase by employees through the plan. This plan is considered non-compensatory per ASC 718, Compensation—Stock Compensation, as substantially all of the employees have the ability to participate, and there are no option features, as defined in ASC 718, contained within the pricing of the plan. As of September 30, 2015 approximately 672,000 shares of common stock remained eligible for purchase by employees under this plan.
F-50
AmeriQuest, Inc.
Notes to Consolidated Financial Statements (unaudited) (Continued)
(in thousands, except share and per share data and where noted)
11. Stock-Based Compensation
The Company's stock-based incentive compensation plans provide for the granting of awards in the form of stock options and restricted stock. The awards may be subject to the achievement of certain performance goals as determined by the Company's Board of Directors. Shares awarded under the plans are new shares that are issued by the Company.
Stock Options
Prior to 2012, the Company awarded options to purchase shares of stock to various key employees of which 405,000 are outstanding as of September 30, 2015, with exercise prices ranging from $0.20 to $0.50 per share, and a weighted-average exercise price of $0.26 per share. All of these options are fully vested and will never expire.
On January 1, 2012, the Company awarded non-qualified stock options to purchase 3,600,000 shares of stock to various key employees at an exercise price of $2.43 per share, the estimated fair value of the Company's stock on the grant date. The options vest over a four-year period and can only be exercised following a qualified event, such as, an initial public offering, a change in control or a liquidity event, as defined in the plan. The options expire on December 31, 2021. The total grant date fair value of each option was $1.24. As of September 30, 2015 the amount of vested but unrecognized compensation expense is $4,176. When an exercise event becomes probable, the Company will record all vested compensation expense. Any remaining unvested compensation expense will be recorded over the remaining vesting period.
There were no stock options granted during the nine months ended September 30, 2014 and 2015. As of September 30, 2015, 405,000 options were exercisable at a weighted average exercise price of $0.26.
Restricted Stock Grants
The Company's Board of Directors has approved the Non-Employee Director Stock Purchase Plan to enable board members to receive compensation in common stock. The plan provides for 1,000,000 shares of common stock to be eligible for board members' compensation. The Company granted restricted shares of 40,000 and 17,860, and recorded stock compensation expense for board fees of $157 and $109 during the nine months ended September 30, 2014 and 2015, respectively.
These shares vest over one year and the related expense is recognized on a straight-line basis over the vesting period.
The Company's Board of Directors has approved an equity and incentive plan to enable certain employees to receive compensation in common stock. Pursuant to this plan, 54,972 and 43,000 shares of restricted common stock were granted during the nine months ended September 30, 2014, and 2015, respectively with a vesting service commencement date of July 1, 2014 and 2015, respectively. These grants vest over three years and the related expense is recognized on a straight-line basis over the vesting period. The Company recorded stock compensation expense for employee compensation of $23 and $97 for the nine months ended September 30, 2014, and 2015, respectively. Stock-based compensation charges are recorded in general and administrative expenses in the consolidated statements of income.
F-51
AmeriQuest, Inc.
Notes to Consolidated Financial Statements (unaudited) (Continued)
(in thousands, except share and per share data and where noted)
11. Stock-Based Compensation (Continued)
The following is a summary of the status of the Company's nonvested restricted stock awards as of and for the nine months ended September 30, 2015:
| |
Shares | Weighted Average Grant Date Fair Value |
|||||
|---|---|---|---|---|---|---|---|
Nonvested stock outstanding at January 1, 2015 |
54,972 | $ | 5.00 | ||||
Granted |
60,860 | 7.53 | |||||
Forfeited |
(7,056 | ) | 5.41 | ||||
Vested |
— | — | |||||
| | | | | | | | |
Nonvested stock outstanding at September 30, 2015 |
108,776 | $ | 6.39 | ||||
| | | | | | | | |
| | | | | | | | |
| | | | | | | | |
As of September 30, 2015, there was $488 of remaining compensation expense to be recognized on unvested awards under these plans. All outstanding restricted stock awards vest immediately upon the consummation of an initial public offering of the Company's stock.
12. Earnings Per Share
Basic earnings per common share is computed by dividing net earnings or loss attributable to common stockholders by the weighted-average number of common shares outstanding during the period. Diluted earnings per common share is calculated by dividing net earnings by weighted-average common shares outstanding during the period plus dilutive potential common shares.
The dilutive effect of stock options and unvested restricted shares is computed using the treasury stock method, which assumes any proceeds that could be obtained upon the exercise of stock options would be used to purchase common shares at the market price for the period. The assumed proceeds include the purchase price the grantee pays, the windfall tax benefit that the Company receives upon assumed exercise and the unrecognized compensation expense at the end of each period.
Potentially dilutive securities include stock options and unvested restricted shares. The table below summarizes the impact of potentially dilutive securities.
| |
Nine months ended September 30, |
||||||
|---|---|---|---|---|---|---|---|
| |
2014 | 2015 | |||||
Basic shares |
12,568,956 | 12,635,924 | |||||
Effect of dilutive securities |
550,900 | 567,180 | |||||
| | | | | | | | |
Dilutive shares |
13,119,856 | 13,203,104 | |||||
| | | | | | | | |
| | | | | | | | |
| | | | | | | | |
The potentially dilutive effect of 3,600,000 management stock options granted on January 1, 2012 is not reflected in earnings per share under generally accepted accounting principles because such options are only exercisable upon the successful completion of an initial public offering of the Company's common stock (see note 11), which was not probable during any of the periods presented.
On November 9, 2015, subsequent to the issuance of the financial statements, the Company filed a registration statement on form S-1 with the intent to publicly offer its common stock for sale. If the planned offering is successful, all performance conditions will be met, and the 3,600,000 options will vest on a straight line basis over the service period described in note 11. The following table presents
F-52
AmeriQuest, Inc.
Notes to Consolidated Financial Statements (unaudited) (Continued)
(in thousands, except share and per share data and where noted)
12. Earnings Per Share (Continued)
diluted earnings per share for the nine months ended September 30, 2015, on a pro forma basis, assuming that the offering had occurred and the related performance conditions had been met at the beginning of the period. The vesting of the options had no impact on basic earnings per share.
| |
As Presented | Pro forma adjustment |
As adjusted | |||||||
|---|---|---|---|---|---|---|---|---|---|---|
Net income |
$ | 4,236 | $ | — | $ | 4,236 | ||||
Diluted weighted average shares outstanding |
13,203,104 | 1,314,559 | 14,517,663 | |||||||
| | | | | | | | | | | |
Diluted earnings per share |
$ | 0.32 | $ | 0.03 | $ | 0.29 | ||||
| | | | | | | | | | | |
| | | | | | | | | | | |
| | | | | | | | | | | |
13. Debt
| |
December 31, 2014 |
September 30, 2015 |
|||||
|---|---|---|---|---|---|---|---|
Revolving line of credit |
$ | 37,000 | $ | 53,033 | |||
Notes payable* |
|||||||
Third party financing |
23,894 | 30,979 | |||||
Third party financing |
3,743 | 3,016 | |||||
Bank |
1,446 | 321 | |||||
| | | | | | | | |
Total debt |
66,083 | 87,349 | |||||
Current portion of notes payable |
(5,786 | ) | (7,120 | ) | |||
| | | | | | | | |
Total long-term debt |
$ | 60,297 | $ | 80,229 | |||
| | | | | | | | |
| | | | | | | | |
| | | | | | | | |
- *
- Secured by equipment
Revolving Line of Credit
During 2012, the Company executed a $100.0 million revolving line of credit with a financial institution (the Revolving Line). The Revolving Line expires in December 2017 and, at the option of the Company, bears interest at one of the following: LIBOR plus 2.00% to 2.50%, or the highest of (1) the Prime Rate plus 1.00% to 1.50%, (2) the Federal Funds Rate plus 0.50%, or (3) the LIBOR for a 30-day interest period plus 1.00%. The Company is able to borrow up to 85% of eligible receivables. The amount of available borrowings as of December 31, 2014 and September 30, 2015 was $84,112 and $99,185, of which $37,000 and $53,033 had been drawn, respectively.
The Revolving Line of credit is secured by the Company's outstanding accounts receivable and contains customary conditions to borrowing, events of default and covenants, including covenants that restrict our ability to dispose of assets, merge with or acquire other entities, incur indebtedness, grant liens, make distributions to holders of our equity interests or make investments. The Revolving Line also prohibits us from taking accounts receivables write-offs in excess of 1% of gross billings in a trailing twelve month period, and it requires us to maintain a minimum fixed charge coverage ratio. The Company was in compliance with such covenants as of September 30, 2015.
The effective interest rate, including all fees, for the Revolving Line was approximately 2.9% and 2.4% for the nine months ended September 30, 2014 and 2015, respectively.
F-53
AmeriQuest, Inc.
Notes to Consolidated Financial Statements (unaudited) (Continued)
(in thousands, except share and per share data and where noted)
13. Debt (Continued)
On December 18, 2015, the Company entered into an amendment to its revolving credit agreement. The key terms of the amendment included reducing interest rate spreads for LIBOR-based and Prime Rate loans by 50 to 75 basis points, depending upon the amount of availability on the line of credit, and extending the maturity by 3 years from December 18, 2017 to December 18, 2020.
Bank Line of Credit
In February 2014, the Company entered into a $7.5 million uncommitted credit agreement with a financial institution to facilitate certain short-term borrowing needs for equipment purchases of our AM segment. Amounts borrowed are due within 120 days; therefore, any amounts outstanding under this facility are shown as short-term debt. The credit agreement expires in February 2019 and, at the option of the Company, bears interest at LIBOR plus 2.50% or the financial institution's Prime Rate. No amounts were drawn against this line of credit as of December 31, 2014 or September 30, 2015.
14. Commitments and Contingencies
Contingencies:
From time to time, the Company and its subsidiaries are parties to lawsuits, claims and other proceedings, which are handled in the ordinary course of business. Although the outcome of such items cannot be determined with certainty, management believes that the outcome of such matters will not have a material impact on the Company's financial position or results of operations.
Guaranteed Residuals
The Company periodically enters into agreements to remarket trucks, tractors and trailers at a residual price at the end of various third-party leases, if the lessee does not exercise their option to purchase the vehicles. The agreements require the vehicles to be maintained in accordance with manufacturer specifications and meet or exceed certain used truck standards. In certain cases the Company guarantees a portion of the residual value (expected sale price). The Company accounts for guarantees under ASC 460, Guarantees, which requires guarantees to be recorded at the fair value at the inception of the agreement. The Company calculates the estimated fair value of the guarantee obligation using a probability weighted cash flow model. Key inputs in the model include the likelihood that the guarantee will be called and the value that has been guaranteed relative to the estimated fair value of the equipment. Liabilities recorded related to these guarantees, which are included in other liabilities on the accompanying consolidated balance sheets were not significant as of both December 31, 2014 and September 30, 2015. Under terms of the agreements, future maximum annual commitments are approximately $2.2 million maturing between 2016 and 2022.
15. Related Party Transactions
Procurement Solution Purchases
Several members of the Company's board of directors have an ownership interest in entities that make purchases through the Company's procurement solution. During the nine months ended September 30, 2014, and 2015, companies related to the board members purchased $32,950 and $30,883, respectively, of products through the Company's procurement solution. Amounts receivable from these companies were $3,048 and $3,506 as of December 31, 2014 and September 30, 2015, respectively.
F-54
AmeriQuest, Inc.
Notes to Consolidated Financial Statements (unaudited) (Continued)
(in thousands, except share and per share data and where noted)
16. Segment Reporting
Each of the Company's operating segments, which are also its reportable segments, has a Chief Operating Decision Maker (CODM) who manages and is accountable for assessing the performance of the segment and for allocating resources to the respective segment, for which that accountability has been assigned. The operating results of each of the Company's reportable segments are evaluated based upon revenues and operating income. Separate asset disclosure is not used by the CODM as a measure of segment performance because the evaluation is driven by earnings. Therefore, segment assets are not disclosed in these notes to consolidated financial statements.
Shared services includes general expenses to support all segments that are not allocated. All of our operations are located in North America and all of our revenues are generated from customers in North America.
The following tables present selected financial information by reportable segment:
| |
Nine months ended September 30, |
||||||
|---|---|---|---|---|---|---|---|
| |
2014 | 2015 | |||||
Revenue: |
|||||||
FPA |
$ | 17,876 | $ | 21,073 | |||
Procurement |
9,254 | 8,852 | |||||
AM |
36,729 | 35,230 | |||||
| | | | | | | | |
Total |
$ | 63,859 | $ | 65,155 | |||
| | | | | | | | |
| | | | | | | | |
| | | | | | | | |
Segment operating income: |
|||||||
FPA |
$ | 7,537 | $ | 8,558 | |||
Procurement |
5,883 | 5,394 | |||||
AM |
3,976 | 4,546 | |||||
| | | | | | | | |
Total |
$ | 17,396 | $ | 18,498 | |||
| | | | | | | | |
| | | | | | | | |
| | | | | | | | |
The reconciliation of segment operating income to income before income taxes is as follows:
| |
Nine months ended September 30, |
||||||
|---|---|---|---|---|---|---|---|
| |
2014 | 2015 | |||||
Segment operating income |
$ | 17,396 | $ | 18,498 | |||
Shared services |
(7,133 | ) | (7,276 | ) | |||
Interest expense |
(2,499 | ) | (2,435 | ) | |||
Interest income |
86 | 106 | |||||
Foreign exchange (loss) gain |
(384 | ) | (1,035 | ) | |||
| | | | | | | | |
Income before income taxes |
$ | 7,466 | $ | 7,858 | |||
| | | | | | | | |
| | | | | | | | |
| | | | | | | | |
F-55
AmeriQuest, Inc.
Notes to Consolidated Financial Statements (unaudited) (Continued)
(in thousands, except share and per share data and where noted)
16. Segment Reporting (Continued)
The following table presents depreciation and amortization by reportable segment:
| |
Nine months ended September 30, |
||||||
|---|---|---|---|---|---|---|---|
| |
2014 | 2015 | |||||
FPA |
$ | 2,045 | $ | 3,181 | |||
AM |
5,425 | 5,838 | |||||
Shared Services |
280 | 415 | |||||
| | | | | | | | |
Total |
$ | 7,750 | $ | 9,434 | |||
| | | | | | | | |
| | | | | | | | |
| | | | | | | | |
F-56
6,153,846 Shares
Common Stock
PROSPECTUS
| RAYMOND JAMES | STEPHENS INC. |
| BAIRD | WILLIAM BLAIR |
, 2016
PART II
INFORMATION NOT REQUIRED IN PROSPECTUS
ITEM 13. Other Expenses of Issuance and Distribution
The following table sets forth all expenses to be paid by us, other than estimated underwriting discounts and commissions, in connection with this offering. All amounts shown are estimates except for the Securities and Exchange Commission registration fee, the Financial Industry Regulatory Authority, or FINRA, filing fee and the NASDAQ Global Market listing fee:
| |
Amount to be Paid |
|||
|---|---|---|---|---|
Securities and Exchange Commission registration fee |
$ | 9,265 | ||
FINRA filing fee |
14,301 | |||
The NASDAQ Global Market listing fee |
25,000 | |||
Blue Sky fees and expenses |
10,000 | |||
Printing and engraving expenses |
307,000 | |||
Legal fees and expenses |
2,562,000 | |||
Accounting fees and expenses |
2,088,000 | |||
Transfer agent and registrar fees |
10,000 | |||
Miscellaneous |
74,434 | |||
| | | | | |
Total |
$ | 5,100,000 | ||
| | | | | |
| | | | | |
| | | | | |
ITEM 14. Indemnification of Directors and Officers
Section 145(a) of the Delaware General Corporation Law provides that a Delaware corporation may indemnify any person who was or is a party or is threatened to be made a party to any threatened, pending or completed action, suit or proceeding, whether civil, criminal, administrative or investigative (other than an action by or in the right of the corporation) by reason of the fact that such person is or was a director, officer, employee or agent of the corporation, or is or was serving at the request of the corporation as a director, officer, employee or agent of another corporation or enterprise, against expenses (including attorneys' fees), judgments, fines and amounts paid in settlement actually and reasonably incurred by such person in connection with such action, suit or proceeding if he or she acted in good faith and in a manner he or she reasonably believed to be in or not opposed to the best interests of the corporation, and, with respect to any criminal action or proceeding, had no cause to believe his or her conduct was unlawful.
Section 145(b) of the Delaware General Corporation Law provides that a Delaware corporation may indemnify any person who was or is a party or is threatened to be made a party to any threatened, pending or completed action or suit by or in the right of the corporation to procure a judgment in its favor by reason of the fact that such person acted in any of the capacities set forth above, against expenses (including attorneys' fees) actually and reasonably incurred by such person in connection with the defense or settlement of such action or suit if he or she acted under similar standards, except that no indemnification may be made in respect of any claim, issue or matter as to which such person shall have been adjudged to be liable to the corporation unless and only to the extent that the court in which such action or suit was brought shall determine that, despite the adjudication of liability but in view of all the circumstances of the case, such person is fairly and reasonably entitled to be indemnified for such expenses which the court shall deem proper.
Section 145 of the Delaware General Corporation Law further provides that: (i) to the extent that a former or present director or officer of a corporation has been successful in the defense of any action, suit or proceeding referred to in subsections (a) and (b) or in the defense of any claim, issue or matter therein, such person shall be indemnified against expenses (including attorneys' fees) actually and reasonably incurred by him or her in connection therewith; (ii) indemnification provided for by
II-1
Section 145 shall not be deemed exclusive of any other rights to which the indemnified party may be entitled; and (iii) the corporation may purchase and maintain insurance on behalf of any present or former director, officer, employee or agent of the corporation or any person who at the request of the corporation was serving in such capacity for another entity against any liability asserted against such person and incurred by him or her in any such capacity or arising out of his or her status as such, whether or not the corporation would have the power to indemnify him or her against such liabilities under Section 145.
In addition, the proposed form of Underwriting Agreement (to be filed by amendment) is expected to provide for indemnification of our directors and officers by the underwriters against certain liabilities.
Article XI of our certificate of incorporation authorizes us to provide for the indemnification of directors to the fullest extent permissible under Delaware law.
Article VIII of our bylaws provides for the indemnification of officers, directors and third parties acting on our behalf if such person acted in good faith and in a manner reasonably believed to be in and not opposed to our best interest and, with respect to any criminal action or proceeding, the indemnified party had no reason to believe his or her conduct was unlawful.
We have entered into indemnification agreements with our directors, executive officers and others, in addition to indemnification provided for in our bylaws, and intend to enter into indemnification agreements with any new directors and executive officers in the future.
We have purchased and intend to maintain insurance on behalf of any person who is or was a director or officer against any loss arising from any claim asserted against him or her and incurred by him or her in any such capacity, subject to certain exclusions.
See also the undertakings set out in response to Item 17 herein.
ITEM 15. Recent Sales of Unregistered Securities
Since January 12, 2013, we have made the following sales of unregistered securities:
From January 12, 2013 through the date of this registration statement, we sold to our employees an aggregate of 211,784 shares of common stock under our Employee Stock Purchase Plan 2011, for an aggregate consideration of approximately $759,649.
From January 12, 2013 through the date of this registration statement, we sold to our non-employee directors an aggregate of 133,820 shares of common stock under our Non-Employee Director Stock Purchase Plan 2011, for an aggregate consideration of approximately $550,000.
From January 12, 2013 through the date of this registration statement, we granted to our employees an aggregate of 90,916 shares of restricted stock under our Equity and Incentive Plan, as amended, for services rendered to us.
From January 12, 2013 through the date of this registration statement, we sold to our board of directors an aggregate of 143,600 shares of common stock, for an aggregate consideration of approximately $394,902.
From January 12, 2013 through the date of this registration statement, we granted to the new members of the board of directors a one-time grant of 9,092 shares of common stock for services rendered to us.
None of the foregoing transactions involved any underwriters, underwriting discounts or commissions, or any public offering, and we believe the transactions were exempt from the registration requirements of the Securities Act of 1933 in reliance on Section 4(a)(2) thereof, and the rules and regulations promulgated thereunder, Regulation D thereof, and the rules and regulations promulgated thereunder, or Rule 701 thereunder, as transactions by an issuer not involving a public offering or
II-2
transactions pursuant to compensatory benefit plans and contracts relating to compensation as provided under such Rule 701. The recipients of securities in such transactions represented their intention to acquire the securities for investment only and not with a view to or for sale in connection with any distribution thereof, and appropriate legends were affixed to the share certificates and instruments issued in such transactions. Certain of the recipients of securities pursuant to Item 1 above represented to us that they were accredited investors, as defined in Rule 501 promulgated under the Securities Act, and received adequate information about the registrant or had access, through their respective relationships with the registrant, to such information.
ITEM 16. Exhibits and Financial Statement Schedules
(a) Exhibits
A list of exhibits filed herewith is contained in the exhibit index that immediately precedes such exhibits and is incorporated herein by reference.
(b) Financial Statement Schedules
All financial statement schedules are omitted because the information called for is not required or is shown either in the consolidated financial statements or in the notes thereto.
The undersigned Registrant hereby undertakes to provide to the underwriters at the closing specified in the underwriting agreement certificates in such denominations and registered in such names as required by the underwriters to permit prompt delivery to each purchaser.
Insofar as indemnification by the Registrant for liabilities arising under the Securities Act may be permitted to directors, officers and controlling persons of the Registrant pursuant to the provisions described in Item 14 or otherwise, the Registrant has been advised that in the opinion of the Securities and Exchange Commission such indemnification is against public policy as expressed in the Securities Act and is, therefore, unenforceable. In the event that a claim for indemnification against such liabilities (other than the payment by the Registrant of expenses incurred or paid by a director, officer or controlling person of the Registrant in the successful defense of any action, suit or proceeding) is asserted by such director, officer or controlling person in connection with the securities being registered, the Registrant will, unless in the opinion of its counsel the matter has been settled by controlling precedent, submit to a court of appropriate jurisdiction the question whether such indemnification by it is against public policy as expressed in the Securities Act and will be governed by the final adjudication of such issue.
The undersigned Registrant hereby undertakes that:
(1) For purposes of determining any liability under the Securities Act, the information omitted from the form of prospectus filed as part of this registration statement in reliance upon Rule 430A and contained in a form of prospectus filed by the Registrant pursuant to Rule 424(b)(l) or (4) or 497(h) under the Securities Act shall be deemed to be part of this registration statement as of the time it was declared effective.
(2) For the purpose of determining any liability under the Securities Act, each post-effective amendment that contains a form of prospectus shall be deemed to be a new registration statement relating to the securities offered therein, and the offering of such securities at that time shall be deemed to be the initial bona fide offering thereof.
II-3
Pursuant to the requirements of the Securities Act of 1933, the registrant has duly caused this Registration Statement to be signed on its behalf by the undersigned, thereunto duly authorized, in the Township of Cherry Hill, State of New Jersey, on the 12th day of January, 2016.
| AMERIQUEST, INC. | ||||
By: |
/s/ DOUGLAS CLARK Douglas Clark Chief Executive Officer |
|||
Pursuant to the requirements of the Securities Act of 1933, this Registration Statement has been signed by the following persons in the capacities and on the dates indicated:
Signature
|
Title
|
Date
|
||||
|---|---|---|---|---|---|---|
| /s/ DOUGLAS CLARK Douglas Clark |
Director, Chairman of the Board of Directors and Chief Executive Officer (Principal Executive Officer) | January 12, 2016 | ||||
/s/ MARK JOYCE Mark Joyce |
Chief Financial Officer (Principal Financial and Accounting Officer) |
January 12, 2016 |
||||
* Brian J. Hogan |
Director |
January 12, 2016 |
||||
* Thomas Brown |
Director |
January 12, 2016 |
||||
* Michael Enright |
Director |
January 12, 2016 |
||||
* John Gavin |
Director |
January 12, 2016 |
||||
* Kirk Tilley |
Director |
January 12, 2016 |
||||
*By |
/s/ MARK JOYCE Mark Joyce as Attorney-in-fact |
|||||
II-4
| Exhibit Number |
Description | ||
|---|---|---|---|
| 1.1 | * | Form of Underwriting Agreement. | |
| 3.1 | ** | Certificate of Incorporation of the Registrant, as currently in effect. | |
| 3.2 | ** | Bylaws of the Registrant, as currently in effect. | |
| 4.1 | ** | Form of Shareholders' Agreement by and among the Registrant and certain security holders of the Registrant, as amended by the Amendment to Shareholders' Agreement. | |
| 5.1 | * | Opinion of Wilson Sonsini Goodrich & Rosati, P.C. | |
| 10.1 | **+ | Form of Indemnification Agreement entered into between the Registrant and its directors and executive officers. | |
| 10.2 | ** | Lease between Brandywine Realty Trust and the Registrant, dated January 14, 1999, as amended May 15, 1999, August 1, 2000, November 5, 2003, August 2008, July 31, 2009, September 4, 2009, February 22, 2012 and November 19, 2014. | |
| 10.3 | ** | Office Lease between LBUBS 2005-C5 Warrenville Road, LLC and the Registrant, dated as of May 31, 2012. | |
| 10.4 | **+ | Employment Contract between the Registrant and Douglas Clark, dated as of June 1, 1999. | |
| 10.5 | **+ | Stock Purchase and Shareholders Agreement between the Registrant and Douglas Clark, dated as of June 1, 1999, as amended February 5, 2015. | |
| 10.6 | **+ | Equity and Incentive Plan and related form agreements. | |
| 10.7 | **+ | 2011 Employee Stock Purchase Plan and related form agreements. | |
| 10.8 | **+ | 2011 Non-Employee Director Stock Purchase Plan and related form agreements. | |
| 10.9 | **+ | Form of Restricted Stock Grant Agreement. | |
| 10.10 | **+ | 2015 Equity Incentive Plan. | |
| 10.11 | ** | Loan and Security Agreement by and among the Registrant, Corcentric Collective Business System Corp., AmeriQuest Leasing & Maintenance, Inc. and AmeriQuest Remarketing Services as Borrowers and the other signatory parties thereto as Lenders, Bank of America as Agent for the Lenders and Merrill Lynch, Pierce, Fenner & Smith Incorporated as the Lead Arranger and Book Manager, dated December 4, 2012, as amended October 23, 2014, December 2, 2014 and September 2, 2015. | |
| 10.12 | **† | Application Service Agreement by and between Corcentric Collective Business Systems, Inc. and Daimler Trucks North America LLC, dated as of February 3, 2012. | |
| 10.13 | ** | Credit Agreement by and between M&T Bank and AmeriQuest Remarketing Services, Inc. | |
| 10.14 | ** | Master Loan and Security Agreement by and between Volvo Financial Services and AmeriQuest Leasing & Maintenance, Inc. | |
| 10.15 | ** | Fixed Rate and Fixed Rate Period Agreement by and between PNC Equipment Finance, LLC and AmeriQuest Leasing & Maintenance, Inc. | |
| 10.16 | ** | Note and Security Agreement by and between Mercedes-Benz Financial Services USA LLC and AmeriQuest Leasing & Maintenance, Inc. | |
| 10.17 | ** | Loan and Security Agreement by and between PNC Equipment Finance, LLC and AmeriQuest Leasing & Maintenance, Inc. | |
| 10.18 | **+ | 2015 Employee Stock Purchase Plan. | |
| 10.19 | **+ | Form of Change of Control and Severance Agreement. | |
| Exhibit Number |
Description | ||
|---|---|---|---|
| 10.20 | Amendment No. 2 to Stock Purchase and Shareholders Agreement between the Registrant and Douglas Clark dated December 18, 2015. | ||
| 10.21 | Fourth Amendment to Loan and Security Agreement by and among the Registrant, AmeriQuest Business Services, Inc., Corcentric Collective Business System Corp., AmeriQuest Leasing & Maintenance, Inc. and AmeriQuest Remarketing Services, Inc. as Borrowers and the other signatory parties thereto as Lenders, Bank of America as Agent for the Lenders and Merrill Lynch, Pierce, Fenner & Smith Incorporated as the Lead Arranger and Book Manager, dated December 18, 2015. | ||
| 21.1 | ** | Subsidiaries of Registrant. | |
| 23.1 | Consent of Ernst & Young LLP, independent registered public accounting firm. | ||
| 23.2 | * | Consent of Wilson Sonsini Goodrich & Rosati, Professional Corporation (included in Exhibit 5.1). | |
| 24.1 | ** | Power of Attorney (included at Page II-4). | |
- *
- To
be filed by amendment.
- **
- Previously
filed.
- +
- Indicates
management contract or compensatory plan.
- †
- Indicates confidential treatment has been requested for certain portions of this agreement pursuant to an application for confidential treatment filed with the Securities and Exchange Commission.