Attached files
| file | filename |
|---|---|
| 8-K - 8-K - Sagent Pharmaceuticals, Inc. | d118284d8k.htm |
| EX-10.1 - EX-10.1 - Sagent Pharmaceuticals, Inc. | d118284dex101.htm |
Sagent Pharmaceuticals J.P. Morgan Healthcare Conference January 13, 2016 Exhibit 99.1
The following information contains, or may be deemed to contain, “forward-looking statements” (as defined in and made pursuant to the safe harbor provisions of the U.S. Private Securities Litigation Reform Act of 1995). Most forward-looking statements contain words that identify them as forward-looking, such as “may”, “plan”, “seek”, “will”, “expect”, “intend”, “estimate”, “anticipate”, “believe”, “project”, “opportunity”, “target”, and “continue” or other words that relate to future events, as opposed to past or current events. By their nature, forward-looking statements are not statements of historical facts and involve risks and uncertainties because they relate to events and depend on circumstances that may or may not occur in the future. These statements give our current expectation of future events or our future performance and do not relate directly to historical or current events or our historical performance. As such, our future results may vary from any expectations or targets expressed in, or implied by, the forward looking statements included in this presentation, possibly to a material degree. We cannot assure you that the assumptions made in preparing any of the forward-looking statements will prove accurate or that any performance targets will be realized. We expect that there will be differences, which could be significant, between performance targets and actual results. All forward-looking statements included in this presentation speak only as of the date made, and we undertake no obligation to update or revise publicly any such forward-looking statements, whether as a result of new information, future events, or otherwise. In particular, we caution investors not to place undue weight on certain forward-looking statements pertaining to potential growth opportunities or performance targets set forth herein. Actual results may vary significantly from these statements. For a discussion of some of the important factors that could cause our results to differ materially from those expressed in, or implied by, the forward-looking statements included in this presentation, investors should refer to our risk factors, as they may be amended from time to time, set forth in our Quarterly Report on Form 10-Q for the period ended September 30, 2015, filed with the SEC on November 3, 2015. This presentation includes a discussion of certain non-GAAP financial measures. Please refer to the appendix to this presentation for further definition of these measures and a reconciliation of such non-GAAP measures to the most closely comparable GAAP measures. Disclaimer
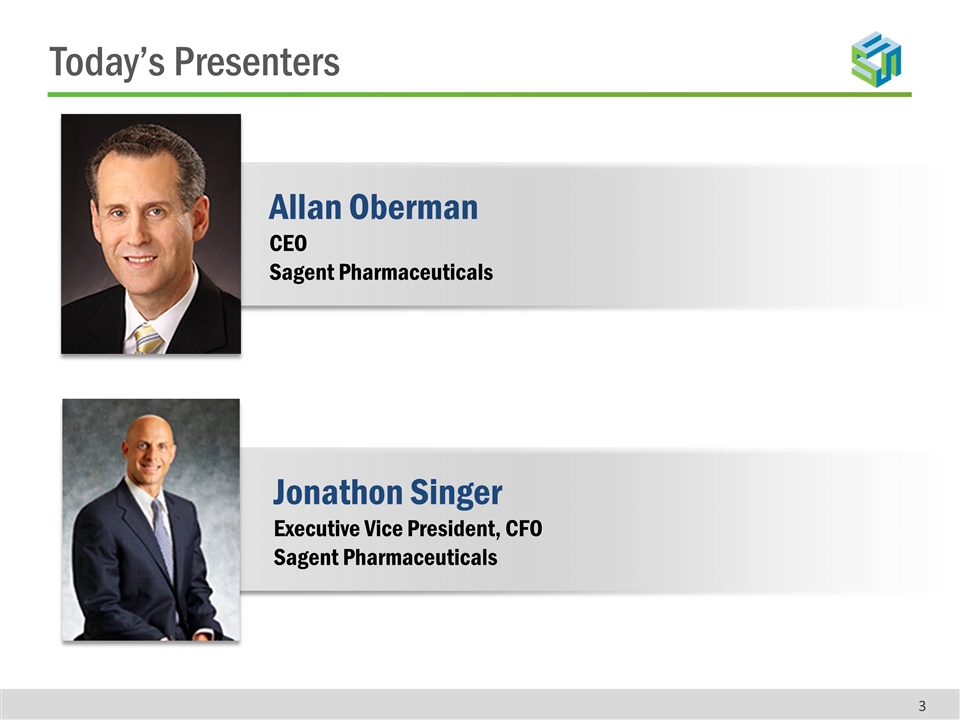
Allan Oberman CEO Sagent Pharmaceuticals Jonathon Singer Executive Vice President, CFO Sagent Pharmaceuticals Today’s Presenters
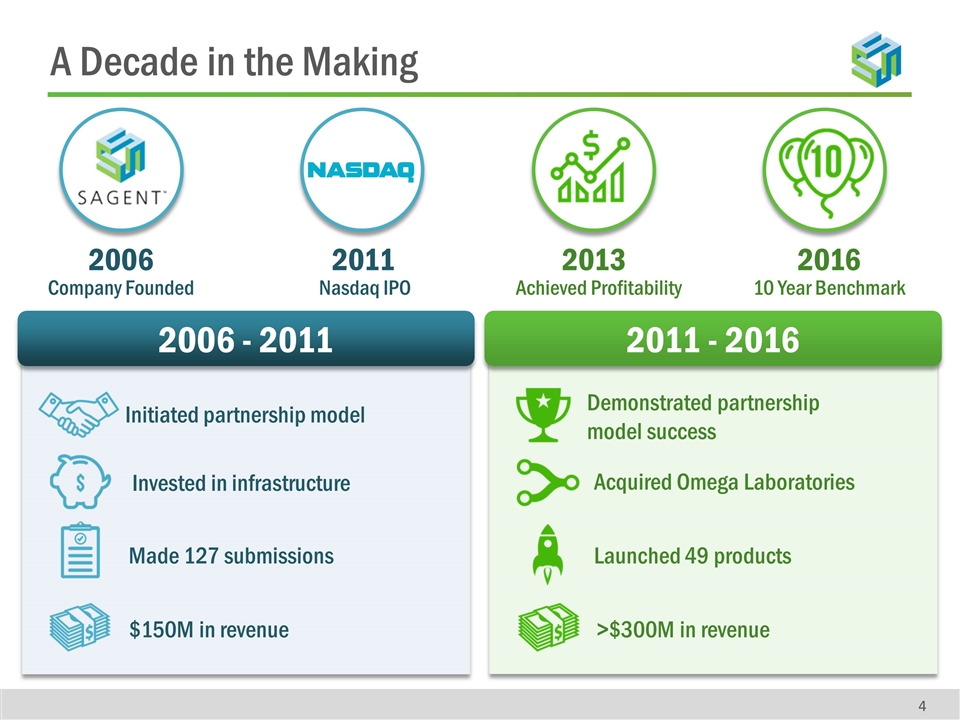
2006 - 2011 2011 - 2016 Initiated partnership model 2006 Company Founded 2011 Nasdaq IPO 2013 Achieved Profitability 2016 10 Year Benchmark A Decade in the Making Made 127 submissions $150M in revenue Invested in infrastructure Demonstrated partnership model success >$300M in revenue Acquired Omega Laboratories Launched 49 products
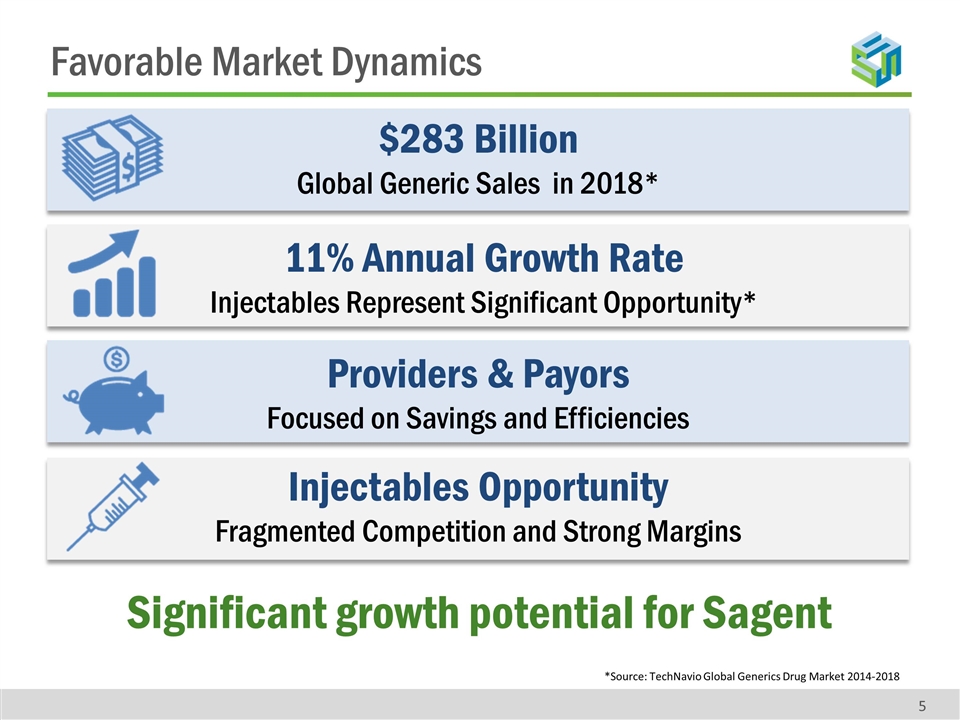
Favorable Market Dynamics 5 $283 Billion Global Generic Sales in 2018* 11% Annual Growth Rate Injectables Represent Significant Opportunity* Providers & Payors Focused on Savings and Efficiencies Injectables Opportunity Fragmented Competition and Strong Margins Significant growth potential for Sagent *Source: TechNavio Global Generics Drug Market 2014-2018
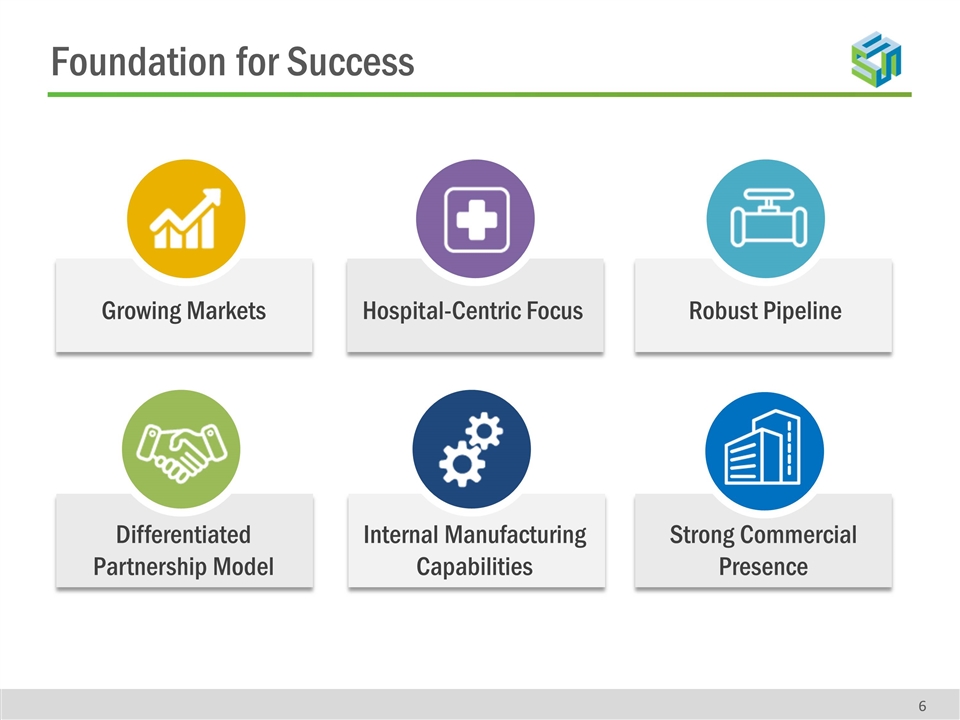
Foundation for Success Robust Pipeline Differentiated Partnership Model Internal Manufacturing Capabilities Hospital-Centric Focus Growing Markets Strong Commercial Presence
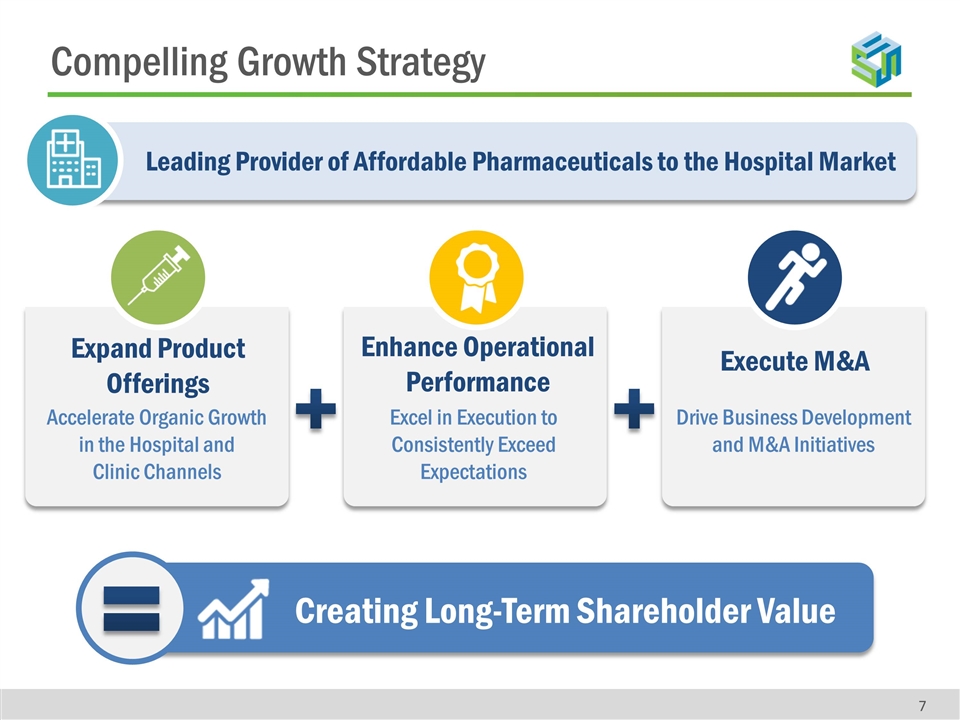
Leading Provider of Affordable Pharmaceuticals to the Hospital Market Compelling Growth Strategy Accelerate Organic Growth in the Hospital and Clinic Channels Expand Product Offerings Excel in Execution to Consistently Exceed Expectations Enhance Operational Performance Execute M&A Creating Long-Term Shareholder Value Drive Business Development and M&A Initiatives
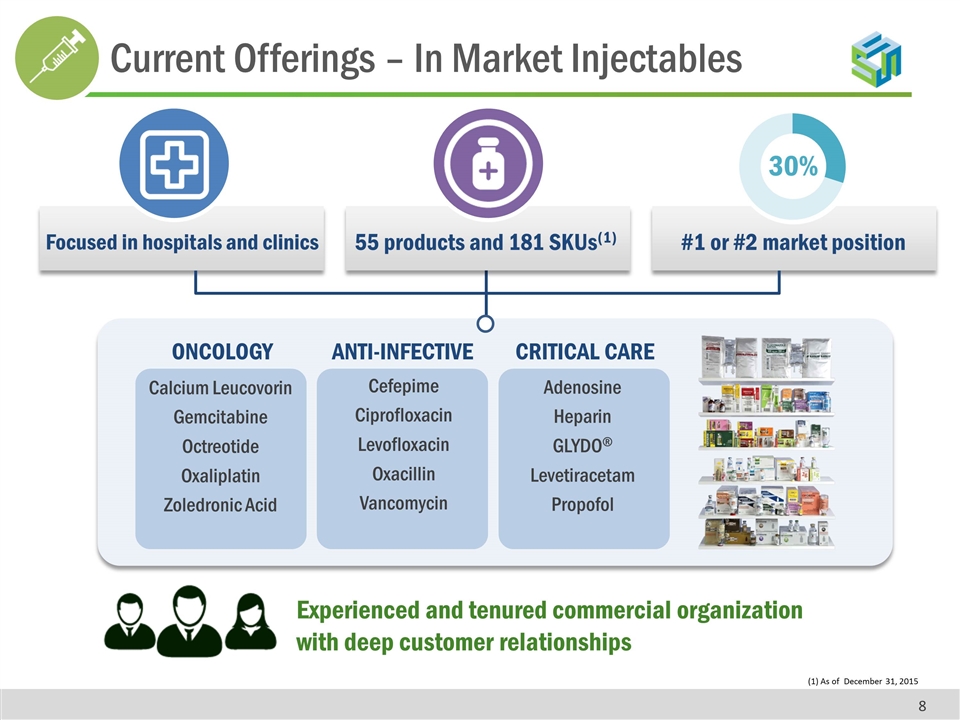
(1) As of December 31, 2015 30% #1 or #2 market position 55 products and 181 SKUs(1) Focused in hospitals and clinics Calcium Leucovorin Gemcitabine Octreotide Oxaliplatin Zoledronic Acid Cefepime Ciprofloxacin Levofloxacin Oxacillin Vancomycin Adenosine Heparin GLYDO® Levetiracetam Propofol ONCOLOGY ANTI-INFECTIVE CRITICAL CARE Experienced and tenured commercial organization with deep customer relationships Current Offerings – In Market Injectables
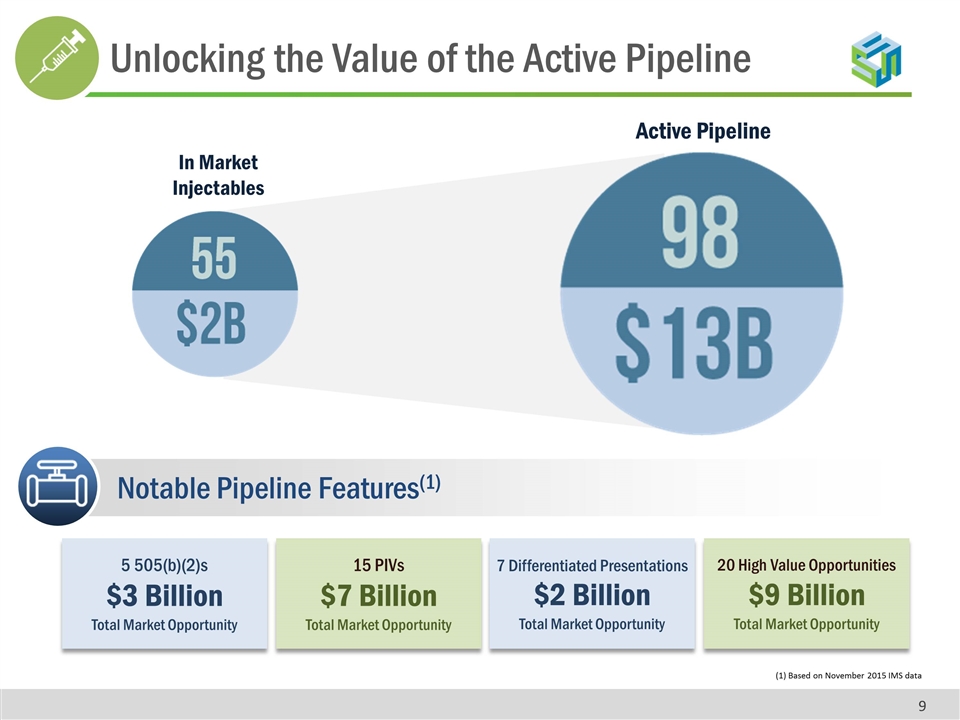
5 505(b)(2)s $3 Billion Total Market Opportunity 15 PIVs $7 Billion Total Market Opportunity 7 Differentiated Presentations $2 Billion Total Market Opportunity (1) Based on November 2015 IMS data Notable Pipeline Features(1) In Market Injectables Active Pipeline 20 High Value Opportunities $9 Billion Total Market Opportunity Unlocking the Value of the Active Pipeline
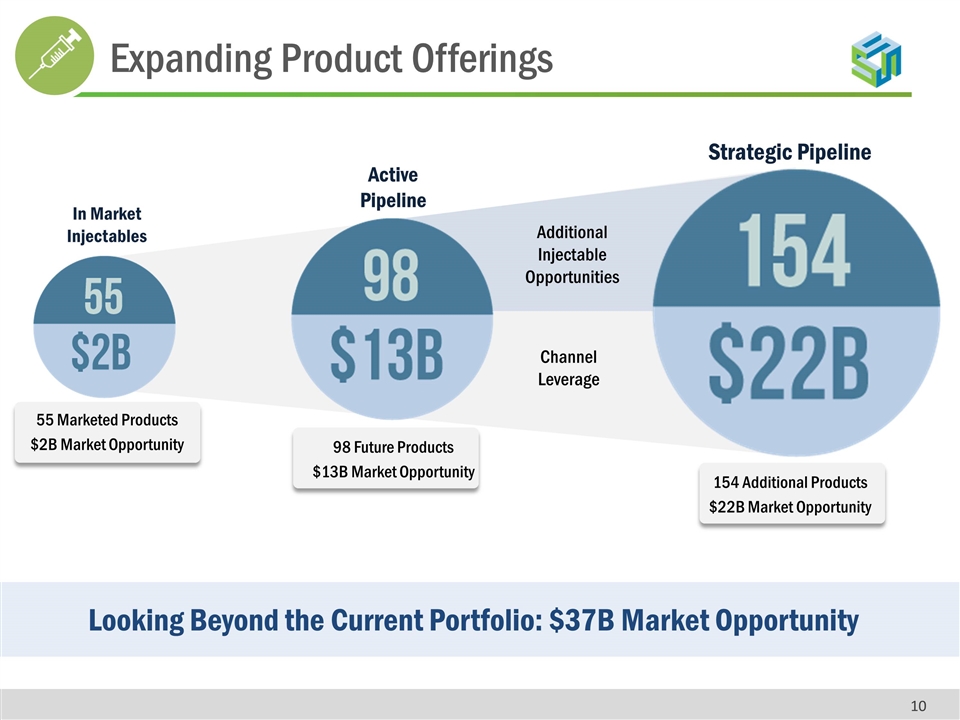
55 Marketed Products $2B Market Opportunity Looking Beyond the Current Portfolio: $37B Market Opportunity In Market Injectables Active Pipeline Strategic Pipeline Additional Injectable Opportunities Channel Leverage 98 Future Products $13B Market Opportunity 154 Additional Products $22B Market Opportunity Expanding Product Offerings
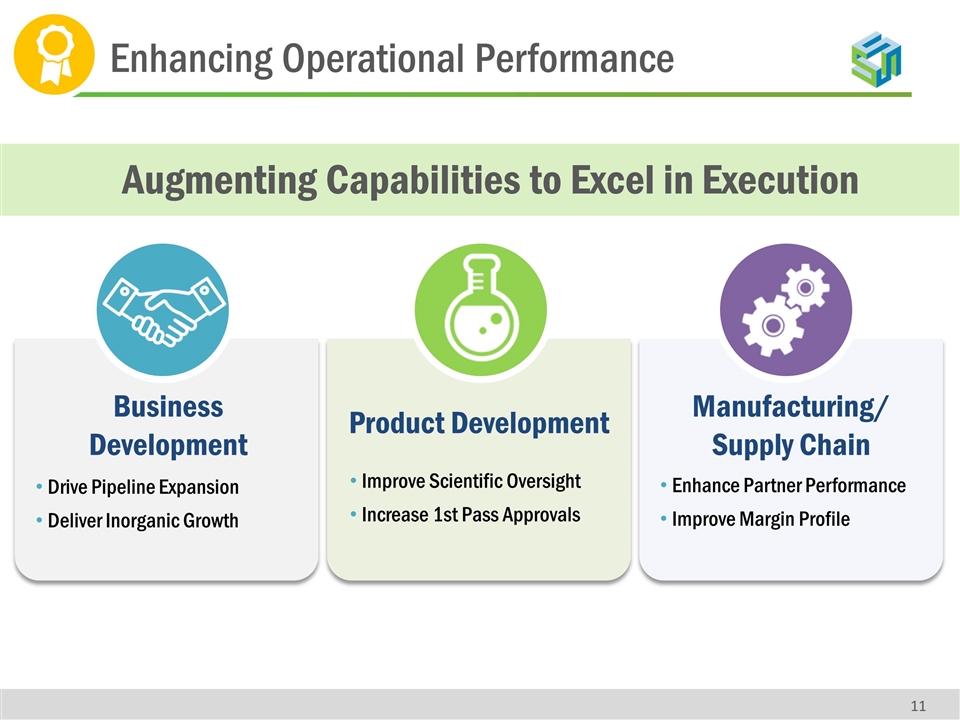
Enhancing Operational Performance Augmenting Capabilities to Excel in Execution Product Development Improve Scientific Oversight Increase 1st Pass Approvals Manufacturing/ Supply Chain Enhance Partner Performance Improve Margin Profile Business Development Drive Pipeline Expansion Deliver Inorganic Growth
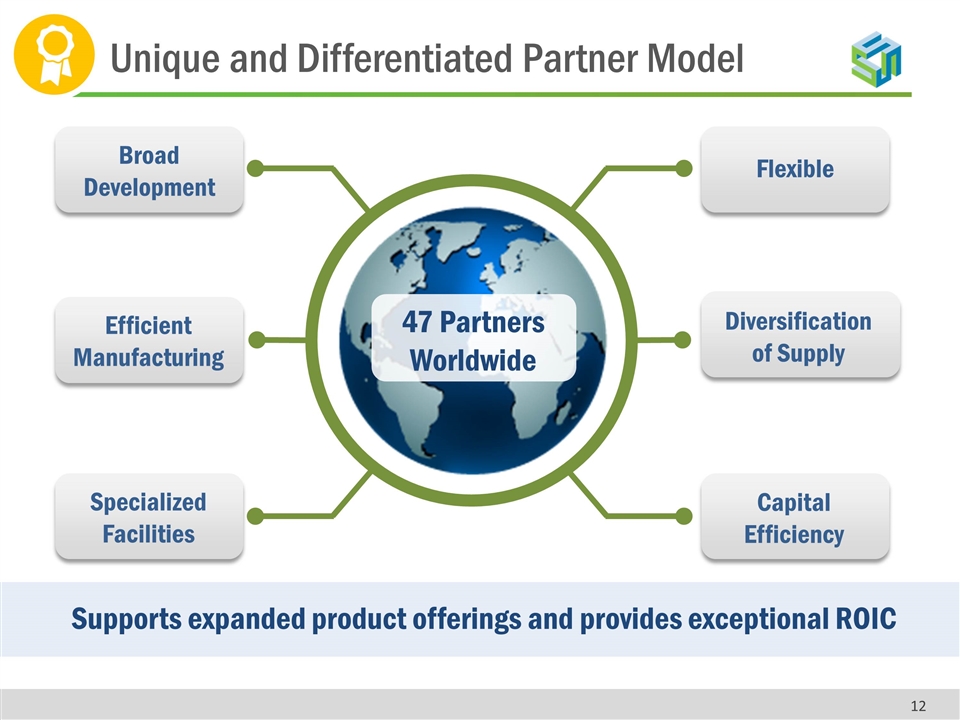
Flexible Capital Efficiency Broad Development Specialized Facilities Supports expanded product offerings and provides exceptional ROIC Diversification of Supply Efficient Manufacturing 47 Partners Worldwide Unique and Differentiated Partner Model
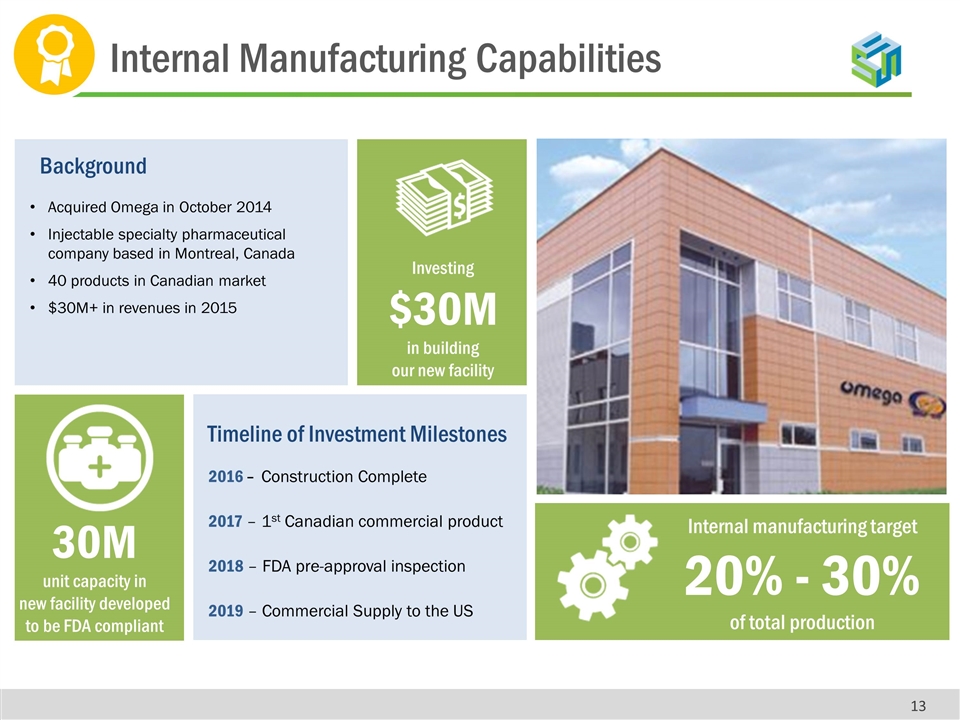
Acquired Omega in October 2014 Injectable specialty pharmaceutical company based in Montreal, Canada 40 products in Canadian market $30M+ in revenues in 2015 Background Investing $30M in building our new facility 2016 – Construction Complete 2017 – 1st Canadian commercial product 2018 – FDA pre-approval inspection 2019 – Commercial Supply to the US Timeline of Investment Milestones 30M unit capacity in new facility developed to be FDA compliant Internal manufacturing target 20% - 30% of total production Internal Manufacturing Capabilities
Sagent has the bandwidth and the balance sheet to pursue M&A opportunities that support the following: Leverage Hospital & Clinic Channel Accelerate Portfolio Expansion Complement Vertical Integration Executing Growth Opportunities
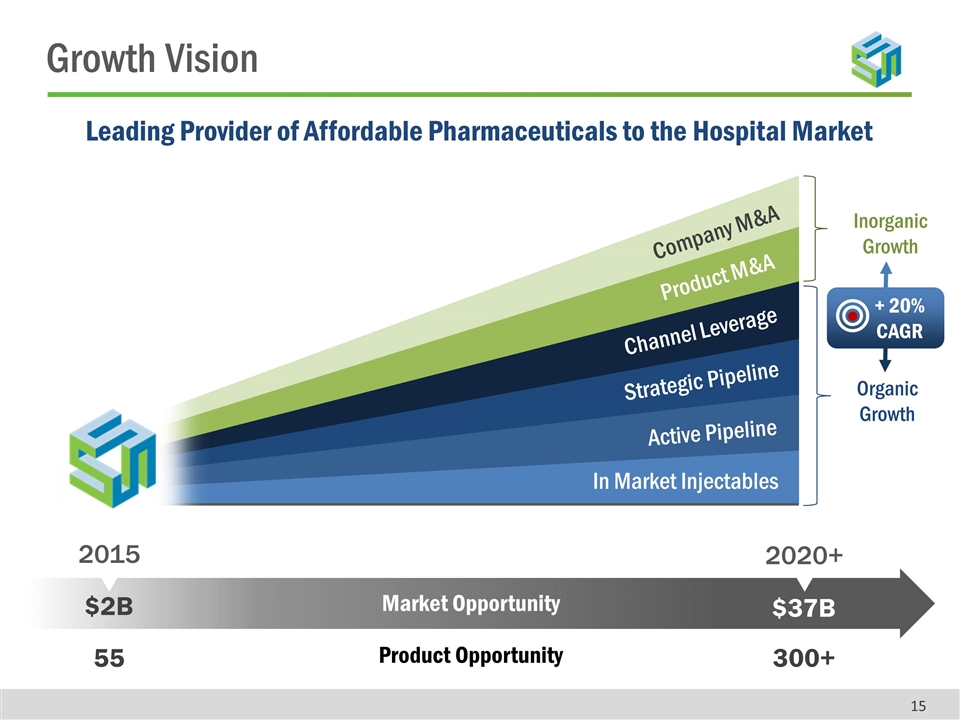
Strategic Pipeline Active Pipeline In Market Injectables Product M&A Channel Leverage Company M&A $2B $37B 2015 2020+ Leading Provider of Affordable Pharmaceuticals to the Hospital Market Market Opportunity Inorganic Growth Organic Growth 55 300+ Product Opportunity + 20% CAGR Growth Vision
Performance Outlook
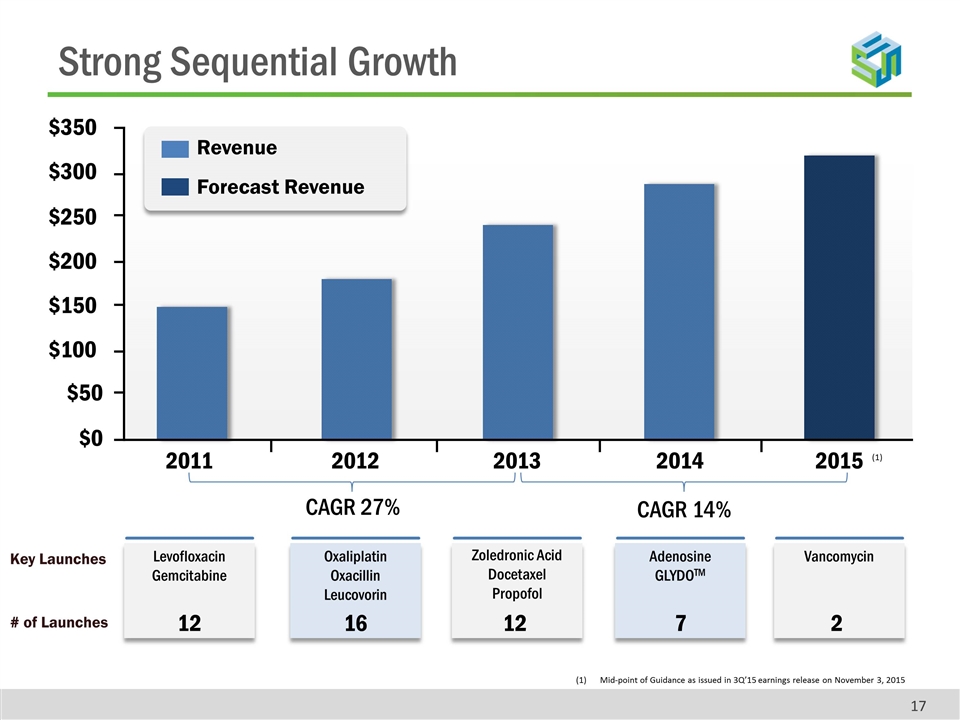
Strong Sequential Growth Mid-point of Guidance as issued in 3Q’15 earnings release on November 3, 2015 (1) Revenue Forecast Revenue Levofloxacin Gemcitabine Key Launches # of Launches $350 $300 $250 $200 $150 $100 $50 $0 2011 2012 2013 2014 2015 Oxaliplatin Oxacillin Leucovorin Zoledronic Acid Docetaxel Propofol Adenosine GLYDOTM Vancomycin CAGR 27% CAGR 14% 12 16 12 7 2
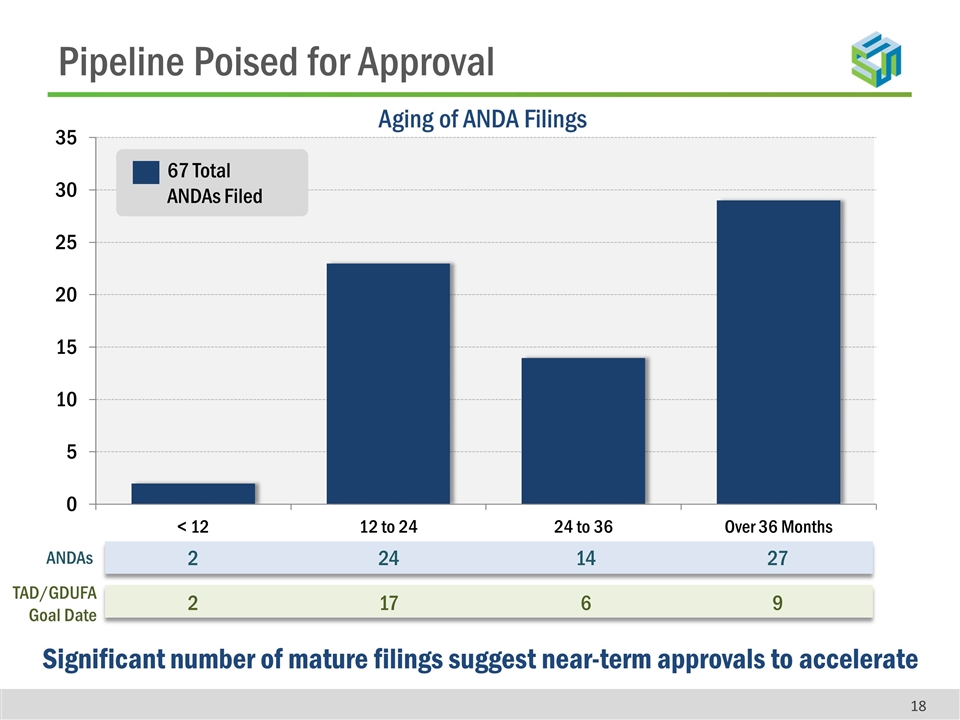
Pipeline Poised for Approval 67 Total ANDAs Filed Aging of ANDA Filings Significant number of mature filings suggest near-term approvals to accelerate ANDAs 2 24 14 27 TAD/GDUFA Goal Date 2 17 6 9
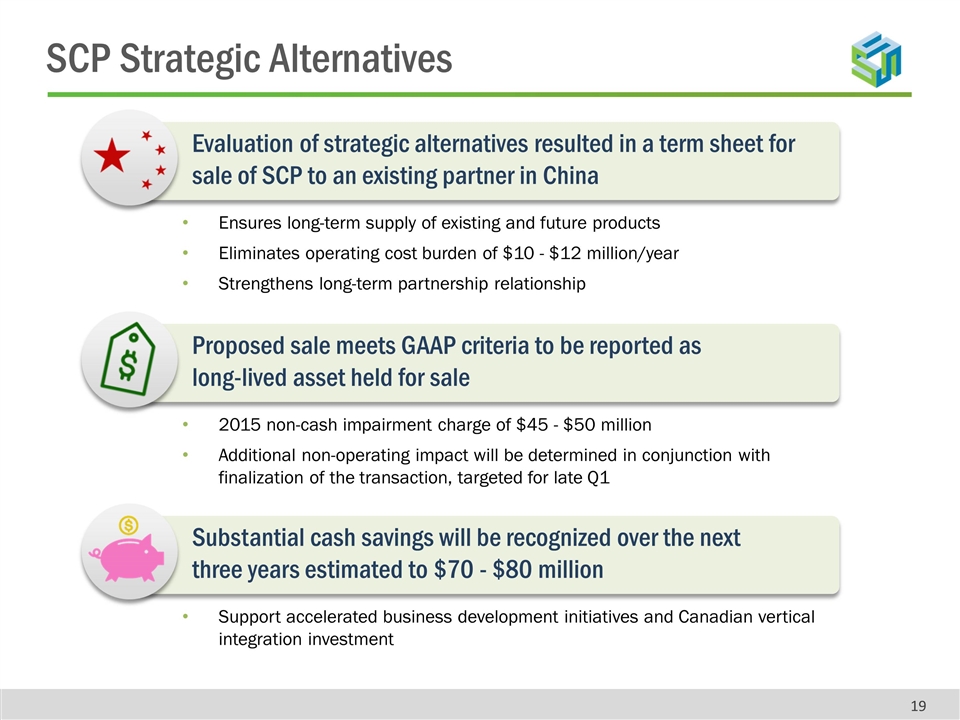
Evaluation of strategic alternatives resulted in a term sheet for sale of SCP to an existing partner in China Ensures long-term supply of existing and future products Eliminates operating cost burden of $10 - $12 million/year Strengthens long-term partnership relationship Proposed sale meets GAAP criteria to be reported as long-lived asset held for sale 2015 non-cash impairment charge of $45 - $50 million Additional non-operating impact will be determined in conjunction with finalization of the transaction, targeted for late Q1 Substantial cash savings will be recognized over the next three years estimated to $70 - $80 million Support accelerated business development initiatives and Canadian vertical integration investment SCP Strategic Alternatives
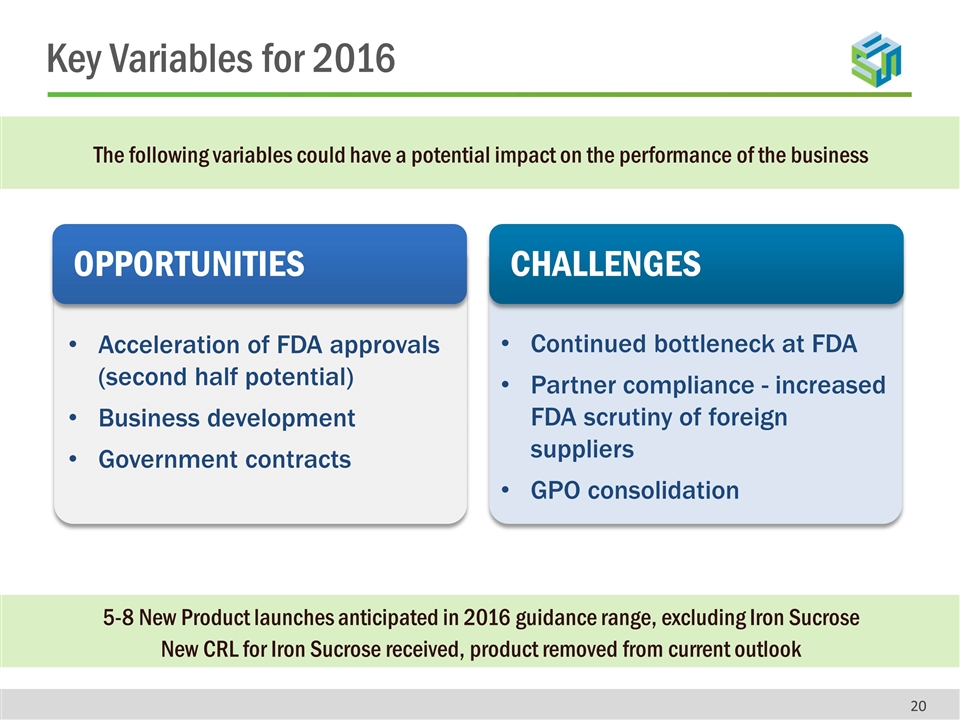
The following variables could have a potential impact on the performance of the business ? OPPORTUNITIES CHALLENGES Acceleration of FDA approvals (second half potential) Business development Government contracts Continued bottleneck at FDA Partner compliance - increased FDA scrutiny of foreign suppliers GPO consolidation 5-8 New Product launches anticipated in 2016 guidance range, excluding Iron Sucrose New CRL for Iron Sucrose received, product removed from current outlook Key Variables for 2016
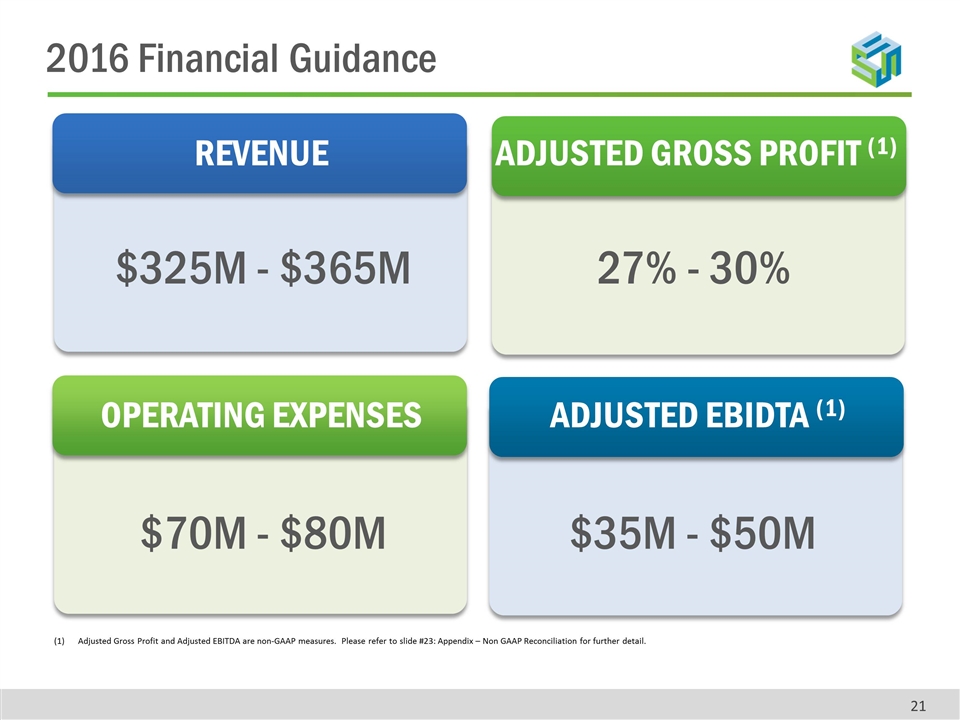
Adjusted Gross Profit and Adjusted EBITDA are non-GAAP measures. Please refer to slide #23: Appendix – Non GAAP Reconciliation for further detail. REVENUE ADJUSTED GROSS PROFIT (1) OPERATING EXPENSES ADJUSTED EBIDTA (1) $325M - $365M $70M - $80M $35M - $50M 27% - 30% 2016 Financial Guidance
Appendix
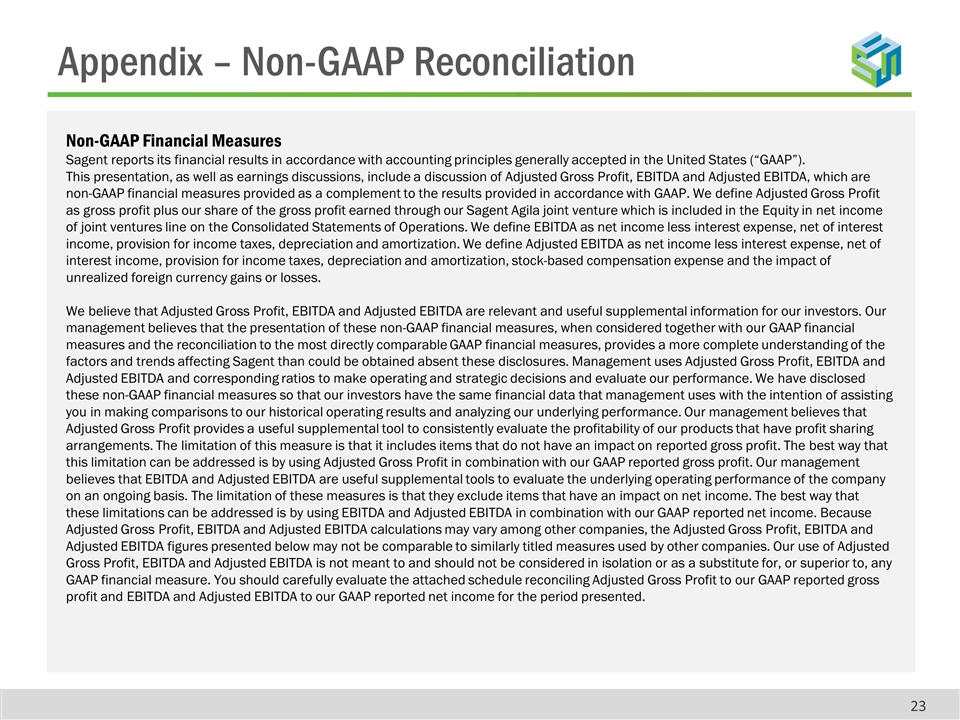
Non-GAAP Financial Measures Sagent reports its financial results in accordance with accounting principles generally accepted in the United States (“GAAP”). This presentation, as well as earnings discussions, include a discussion of Adjusted Gross Profit, EBITDA and Adjusted EBITDA, which are non-GAAP financial measures provided as a complement to the results provided in accordance with GAAP. We define Adjusted Gross Profit as gross profit plus our share of the gross profit earned through our Sagent Agila joint venture which is included in the Equity in net income of joint ventures line on the Consolidated Statements of Operations. We define EBITDA as net income less interest expense, net of interest income, provision for income taxes, depreciation and amortization. We define Adjusted EBITDA as net income less interest expense, net of interest income, provision for income taxes, depreciation and amortization, stock-based compensation expense and the impact of unrealized foreign currency gains or losses. We believe that Adjusted Gross Profit, EBITDA and Adjusted EBITDA are relevant and useful supplemental information for our investors. Our management believes that the presentation of these non-GAAP financial measures, when considered together with our GAAP financial measures and the reconciliation to the most directly comparable GAAP financial measures, provides a more complete understanding of the factors and trends affecting Sagent than could be obtained absent these disclosures. Management uses Adjusted Gross Profit, EBITDA and Adjusted EBITDA and corresponding ratios to make operating and strategic decisions and evaluate our performance. We have disclosed these non-GAAP financial measures so that our investors have the same financial data that management uses with the intention of assisting you in making comparisons to our historical operating results and analyzing our underlying performance. Our management believes that Adjusted Gross Profit provides a useful supplemental tool to consistently evaluate the profitability of our products that have profit sharing arrangements. The limitation of this measure is that it includes items that do not have an impact on reported gross profit. The best way that this limitation can be addressed is by using Adjusted Gross Profit in combination with our GAAP reported gross profit. Our management believes that EBITDA and Adjusted EBITDA are useful supplemental tools to evaluate the underlying operating performance of the company on an ongoing basis. The limitation of these measures is that they exclude items that have an impact on net income. The best way that these limitations can be addressed is by using EBITDA and Adjusted EBITDA in combination with our GAAP reported net income. Because Adjusted Gross Profit, EBITDA and Adjusted EBITDA calculations may vary among other companies, the Adjusted Gross Profit, EBITDA and Adjusted EBITDA figures presented below may not be comparable to similarly titled measures used by other companies. Our use of Adjusted Gross Profit, EBITDA and Adjusted EBITDA is not meant to and should not be considered in isolation or as a substitute for, or superior to, any GAAP financial measure. You should carefully evaluate the attached schedule reconciling Adjusted Gross Profit to our GAAP reported gross profit and EBITDA and Adjusted EBITDA to our GAAP reported net income for the period presented. Appendix – Non-GAAP Reconciliation
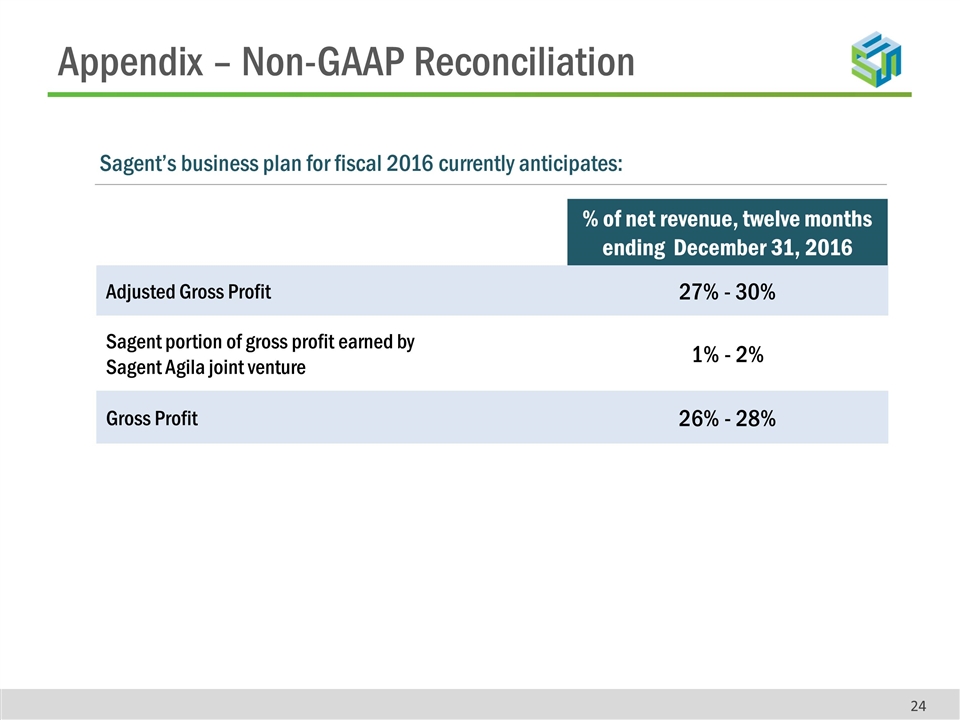
Appendix – Non-GAAP Reconciliation % of net revenue, twelve months ending December 31, 2016 Adjusted Gross Profit 27% - 30% Sagent portion of gross profit earned by Sagent Agila joint venture 1% - 2% Gross Profit 26% - 28% Sagent’s business plan for fiscal 2016 currently anticipates:
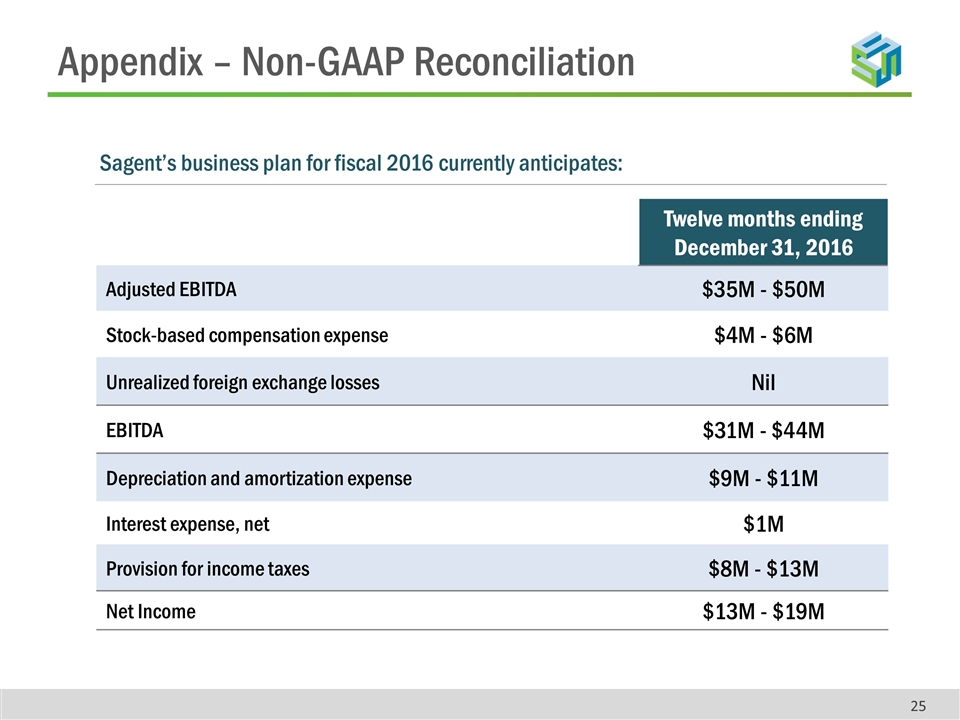
Appendix – Non-GAAP Reconciliation Twelve months ending December 31, 2016 Adjusted EBITDA $35M - $50M Stock-based compensation expense $4M - $6M Unrealized foreign exchange losses Nil EBITDA $31M - $44M Depreciation and amortization expense $9M - $11M Interest expense, net $1M Provision for income taxes $8M - $13M Net Income $13M - $19M Sagent’s business plan for fiscal 2016 currently anticipates:
