Attached files
| file | filename |
|---|---|
| EX-99.1 - EX-99.1 - ARCH RESOURCES, INC. | a16-1432_1ex99d1.htm |
| EX-10.1 - EX-10.1 - ARCH RESOURCES, INC. | a16-1432_1ex10d1.htm |
| 8-K - 8-K - ARCH RESOURCES, INC. | a16-1432_18k.htm |
Exhibit 99.2
Arch Coal, Inc. Disclosure Materials January 11, 2016
Forward-looking information This presentation contains “forward-looking statements” – that is, statements related to future, not past, events – as well as financial projections. Forward-looking statements and projections address our expected future business and financial performance including our financial projections and proposed business plan, and often contain words such as “expects,” “anticipates,” “intends,” “plans,” “believes,” “seeks,” or “will.” We do not typically make long-term projections as to future revenues, earnings, EBITDA or other results for extended periods due to, among other things, the unpredictability of the assumptions and estimates underlying such projections. Forward-looking statements and projections by their nature address matters that are, to different degrees, uncertain and depend upon important estimates and assumptions concerning our financial and operating results, including with respect to our coal pricing expectations, many of which are subject to change. No representations or warranties are made by us as to the accuracy of any such forward-looking statements or projections. Additionally, the projections and forward-looking statements contained herein have not been prepared with a view toward public disclosure, and the inclusion of this information should not be regarded as an indication that we consider it to be necessarily predictive of actual future results. While presented with numeric specificity, the financial projections contained herein reflect numerous estimates and assumptions with respect to coal market conditions, general economic conditions, weather conditions, natural gas prices and matters other matters specific to our business, all of which are difficult to predict and many of which are beyond our control. Uncertainties arise from changes in the demand for and pricing of our coal by the domestic electric generation industry; from legislation and regulations relating to the Clean Air Act and other environmental initiatives; from operational, geological, permit, labor and weather-related factors; from fluctuations in the amount of cash we generate from operations; from future integration of acquired businesses; and from numerous other matters of national, regional and global scale, including those of a political, economic, business, competitive or regulatory nature. There is significant risk that our current estimates and assumptions may not be accurate and that our actual results will vary significantly from our projected results. In addition, since our projections cover multiple years, such information by its nature becomes less predictive with each successive year. The inclusion of such projections herein should not be relied on as predictive of actual future events nor construed as financial guidance. Whether or not our projections are in fact achieved will also depend upon future events outside of our control. Accordingly, readers are cautioned not to rely on the forward-looking statements and projections contained herein. We do not undertake to update our forward-looking statements or projections, whether as a result of new information, future events or otherwise, except as may be required by law. For a description of some of the risks and uncertainties that may affect our future results, you should see the risk factors described from time to time in the reports we file with the Securities and Exchange Commission. This presentation includes certain non-GAAP financial measures, including Adjusted EBITDA and cash costs per ton. These non-GAAP financial measures are not measures of financial performance in accordance with generally accepted accounting principles and may exclude items that are significant in understanding and assessing our financial results. Therefore, these measures should not be considered in isolation or as an alternative to net income from operations, cash flows from operations, earnings per fully-diluted share or other measures of profitability, liquidity or performance under generally accepted accounting principles. You should be aware that our presentation of these measures may not be comparable to similarly-titled measures used by other companies. A reconciliation of these financial measures to the most comparable measures presented in accordance with generally accepted accounting principles has been included at the end of this presentation. 2
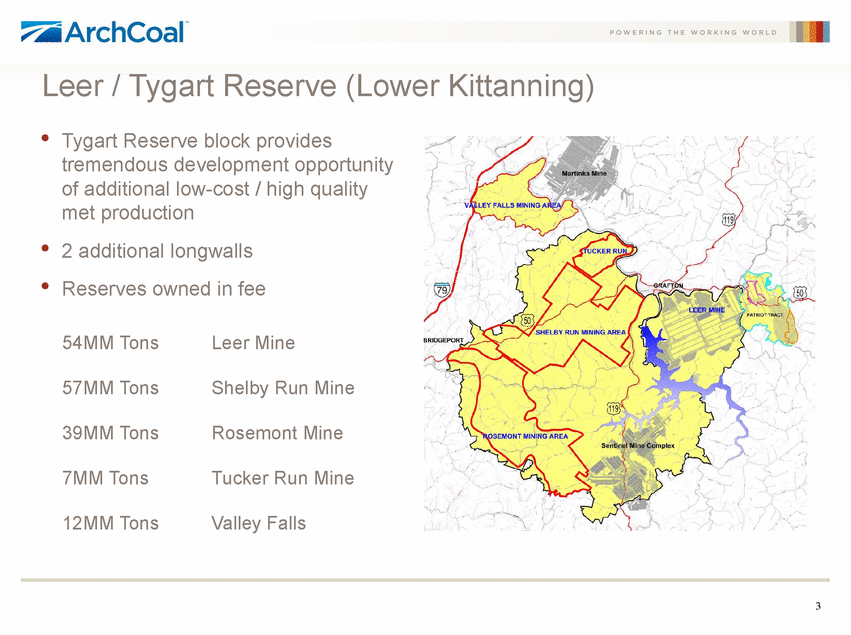
Leer / Tygart Reserve (Lower Kittanning) • Tygart Reserve block provides tremendous development opportunity of additional low-cost / high quality met production 2 additional longwalls Reserves owned in fee • • 54MM Tons Leer Mine 57MM Tons Shelby Run Mine 39MM Tons Rosemont Mine 7MM Tons Tucker Run Mine 12MM Tons Valley Falls 3
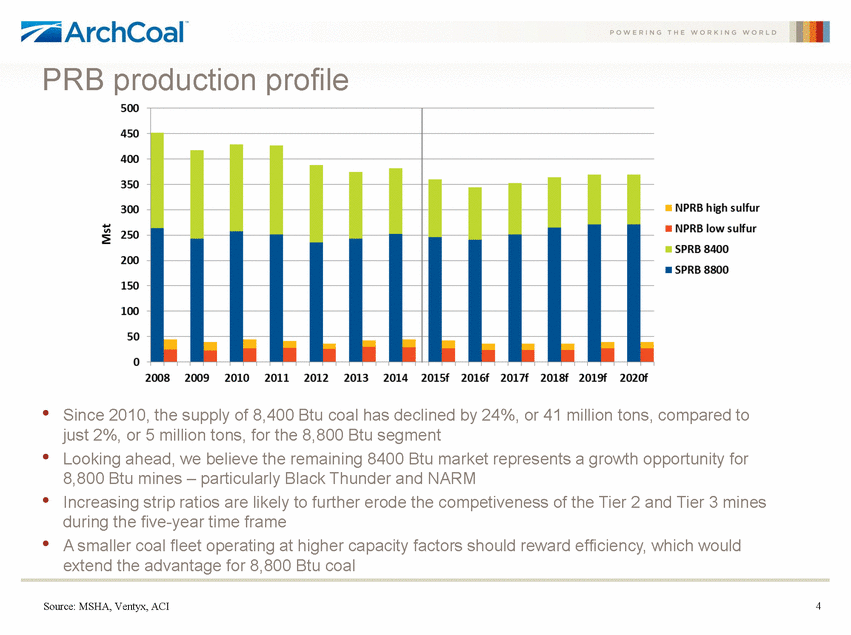
PRB production profile • • • • Since 2010, the supply of 8,400 Btu coal has declined by 24%, or 41 million tons, compared to just 2%, or 5 million tons, for the 8,800 Btu segment Looking ahead, we believe the remaining 8400 Btu market represents a growth opportunity for 8,800 Btu mines – particularly Black Thunder and NARM Increasing strip ratios are likely to further erode the competiveness of the Tier 2 and Tier 3 mines during the five-year time frame A smaller coal fleet operating at higher capacity factors should reward efficiency, which would extend the advantage for 8,800 Btu coal Source: MSHA, Ventyx, ACI 4
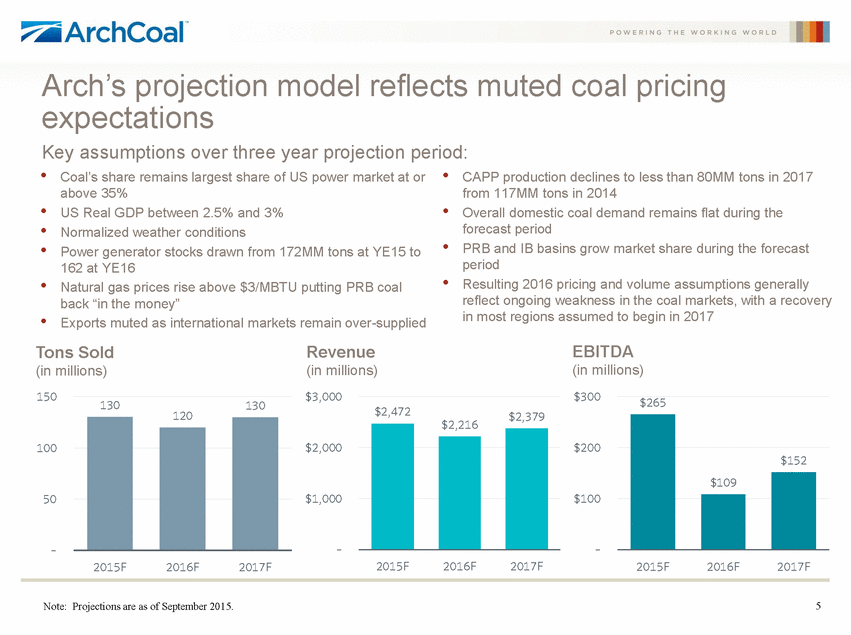
Arch’s projection model reflects muted coal pricing expectations Key assumptions over three year projection period: • • • • • • • • • • Coal’s share remains largest share of US power market at or above 35% US Real GDP between 2.5% and 3% Normalized weather conditions Power generator stocks drawn from 172MM tons at YE15 to 162 at YE16 Natural gas prices rise above $3/MBTU putting PRB coal back “in the money” Exports muted as international markets remain over-supplied CAPP production declines to less than 80MM tons in 2017 from 117MM tons in 2014 Overall domestic coal demand remains flat during the forecast period PRB and IB basins grow market share during the forecast period Resulting 2016 pricing and volume assumptions generally reflect ongoing weakness in the coal markets, with a recovery in most regions assumed to begin in 2017 EBITDA (in millions) Tons Sold (in millions) Revenue (in millions) 150 $3,000 $300 $265 130 130 $2,472 120 $2,379 $2,216 100 $2,000 $200 50 $1,000 $100 – – – 2015F 2016F 2017F 2015F 2016F 2017F 2015F 2016F 2017F Note: Projections are as of September 2015. 5 $152 $109
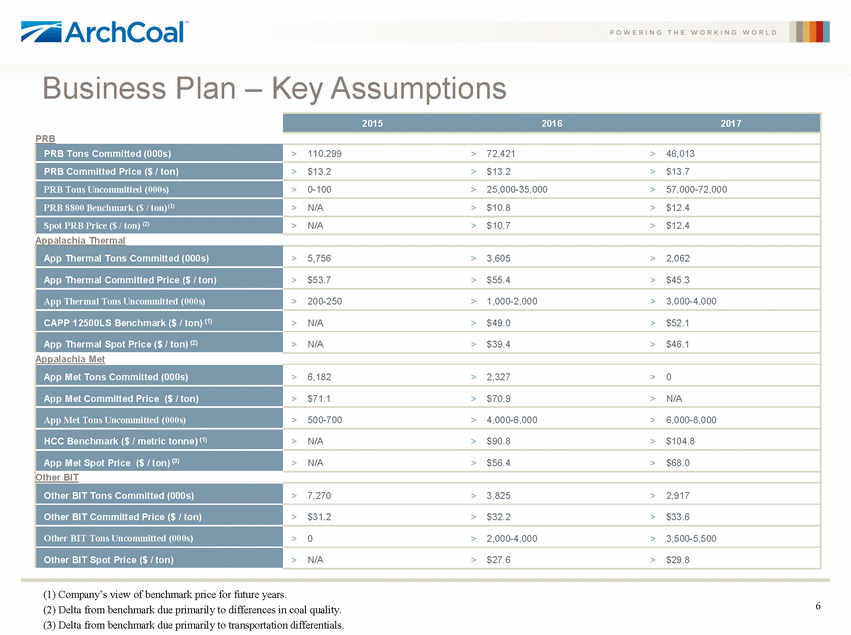
Business Plan – Key Assumptions (1) Company’s view of benchmark price for future years. (2) Delta from benchmark due primarily to differences in coal quality. (3) Delta from benchmark due primarily to transportation differentials. 6 201520162017 PRB PRB Tons Committed (000s) > 110,299> 72,421> 46,013 PRB Committed Price ($ / ton) > $13.2> $13.2> $13.7 PRB Tons Uncommitted (000s) > 0-100> 25,000-35,000> 57,000-72,000 PRB 8800 Benchmark ($ / ton)(1) > N/A> $10.8> $12.4 Spot PRB Price ($ / ton) (2) > N/A> $10.7> $12.4 Appalachia Thermal App Thermal Tons Committed (000s) > 5,756> 3,605> 2,062 App Thermal Committed Price ($ / ton) > $53.7> $55.4> $45.3 App Thermal Tons Uncommitted (000s) > 200-250> 1,000-2,000> 3,000-4,000 CAPP 12500LS Benchmark ($ / ton) (1) > N/A> $49.0> $52.1 App Thermal Spot Price ($ / ton) (2) > N/A> $39.4> $46.1 Appalachia Met App Met Tons Committed (000s) > 6,182> 2,327> 0 App Met Committed Price ($ / ton) > $71.1> $70.9> N/A App Met Tons Uncommitted (000s) > 500-700> 4,000-6,000> 6,000-8,000 HCC Benchmark ($ / metric tonne) (1) > N/A> $90.8> $104.8 App Met Spot Price ($ / ton) (3) > N/A> $56.4> $68.0 Other BIT Other BIT Tons Committed (000s) > 7,270> 3,825> 2,917 Other BIT Committed Price ($ / ton) > $31.2> $32.2> $33.6 Other BIT Tons Uncommitted (000s) > 0> 2,000-4,000> 3,500-5,500 Other BIT Spot Price ($ / ton) > N/A> $27.6> $29.8
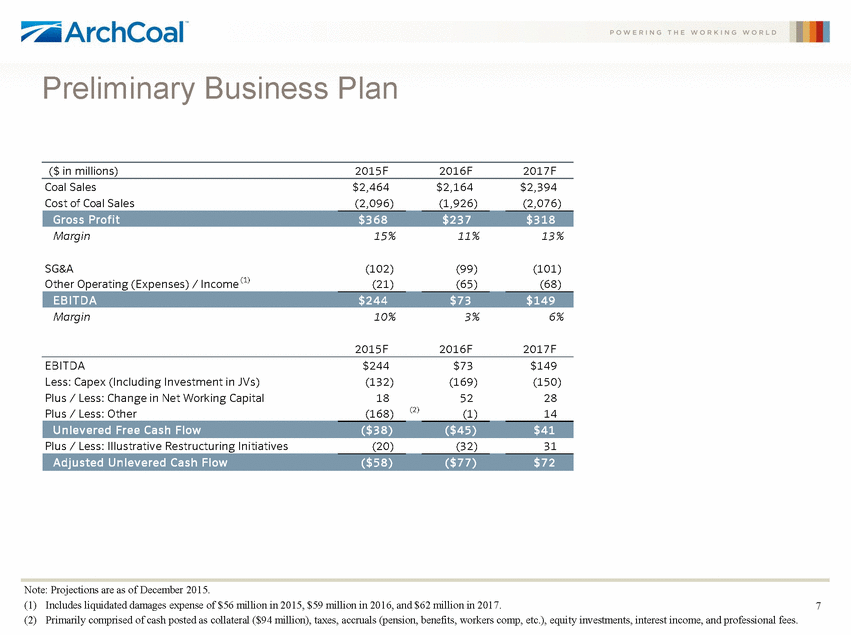
Preliminary Business Plan ($ in millions) 2015F 2016F 2017F Coal Sales Cost of Coal Sales $2,464 (2,096) $2,164 (1,926) $2,394 (2,076) Margin 15% 11% 13% SG&A Other Operating (Expenses) / Income (1) (102) (21) (99) (65) (101) (68) Margin 10% 3% 6% 2015F 2016F 2017F EBITDA Less: Capex (Including Investment in JVs) Plus / Less: Change in Net Working Capital Plus / Less: Other $244 (132) 18 (168) $73 (169) 52 (1) $149 (150) 28 14 (2) Plus / Less: Illustrative Restructuring Initiatives (20) (32) 31 Note: Projections are as of December 2015. (1) Includes liquidated damages expense of $56 million in 2015, $59 million in 2016, and $62 million in 2017. (2) Primarily comprised of cash posted as collateral ($94 million), taxes, accruals (pension, benefits, workers comp, etc.), equity investments, interest income, and professional fees. 7 Ad ju s ted U n lev ered Cas h Flow($ 5 8 )($ 7 7 )$72 U n lev ered Free Cas h Flow($ 3 8 )($ 4 5 )$41 EBI T DA$244$73$149 Gros s Prof it$368$237$318
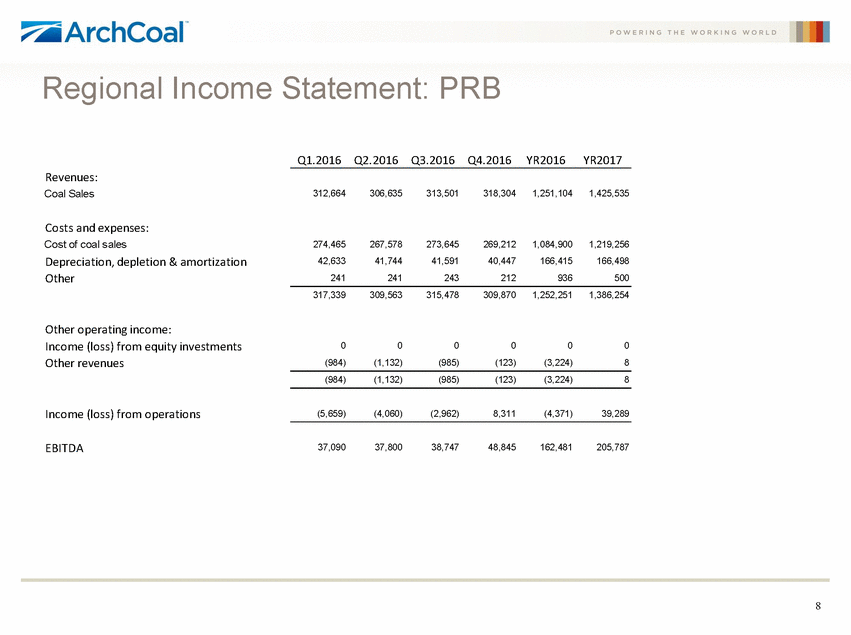
Regional Income Statement: PRB Q1.2016 Q2.2016 Q3.2016 Q4.2016 YR2016 YR2017 Revenues: Coal Sales 312,664 306,635 313,501 318,304 1,251,104 1,425,535 Costs and expenses: Cost of coal sales Depreciation, depletion & amortization Other 274,465 42,633 241 267,578 41,744 241 273,645 41,591 243 269,212 40,447 212 1,084,900 166,415 936 1,219,256 166,498 500 317,339 309,563 315,478 309,870 1,252,251 1,386,254 Other operating income: Income (loss) from equity investments Other revenues 0 (984) 0 (1,132) 0 (985) 0 (123) 0 (3,224) 0 8 (984) (1,132) (985) (123) (3,224) 8 Income (loss) from operations (5,659) (4,060) (2,962) 8,311 (4,371) 39,289 EBITDA 37,090 37,800 38,747 48,845 162,481 205,787 8
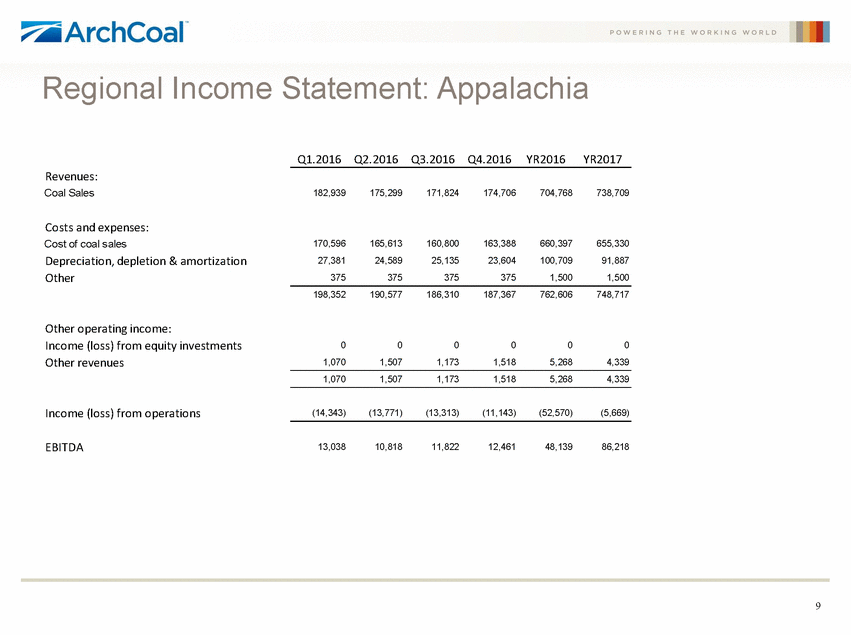
Regional Income Statement: Appalachia Q1.2016 Q2.2016 Q3.2016 Q4.2016 YR2016 YR2017 Revenues: Coal Sales 182,939 175,299 171,824 174,706 704,768 738,709 Costs and expenses: Cost of coal sales Depreciation, depletion & amortization Other 170,596 27,381 375 165,613 24,589 375 160,800 25,135 375 163,388 23,604 375 660,397 100,709 1,500 655,330 91,887 1,500 198,352 190,577 186,310 187,367 762,606 748,717 Other operating income: Income (loss) from equity investments Other revenues 0 1,070 0 1,507 0 1,173 0 1,518 0 5,268 0 4,339 1,070 1,507 1,173 1,518 5,268 4,339 Income (loss) from operations (14,343) (13,771) (13,313) (11,143) (52,570) (5,669) EBITDA 13,038 10,818 11,822 12,461 48,139 86,218 9
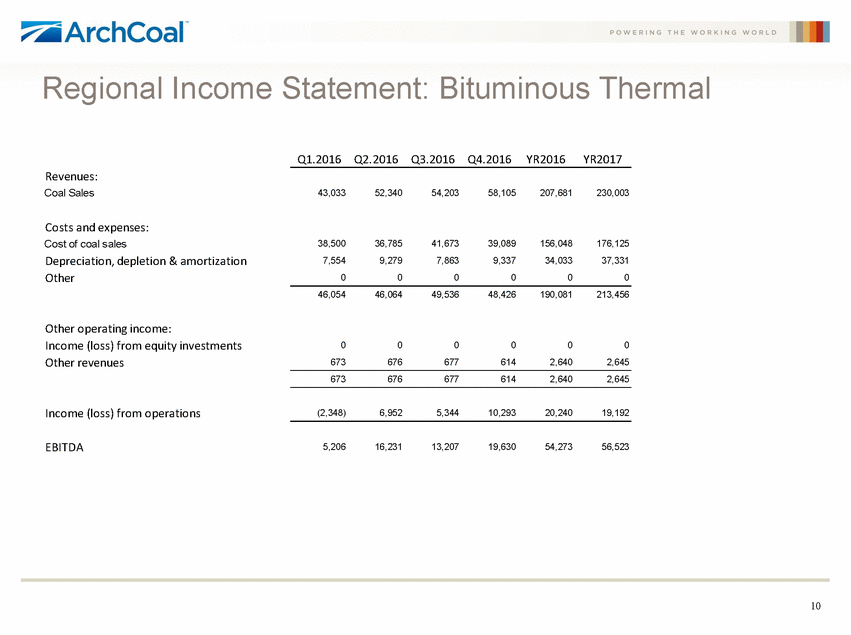
Regional Income Statement: Bituminous Thermal Q1.2016 Q2.2016 Q3.2016 Q4.2016 YR2016 YR2017 Revenues: Coal Sales 43,033 52,340 54,203 58,105 207,681 230,003 Costs and expenses: Cost of coal sales Depreciation, depletion & amortization Other 38,500 7,554 0 36,785 9,279 0 41,673 7,863 0 39,089 9,337 0 156,048 34,033 0 176,125 37,331 0 46,054 46,064 49,536 48,426 190,081 213,456 Other operating income: Income (loss) from equity investments Other revenues 0 673 0 676 0 677 0 614 0 2,640 0 2,645 673 676 677 614 2,640 2,645 Income (loss) from operations (2,348) 6,952 5,344 10,293 20,240 19,192 EBITDA 5,206 16,231 13,207 19,630 54,273 56,523 10
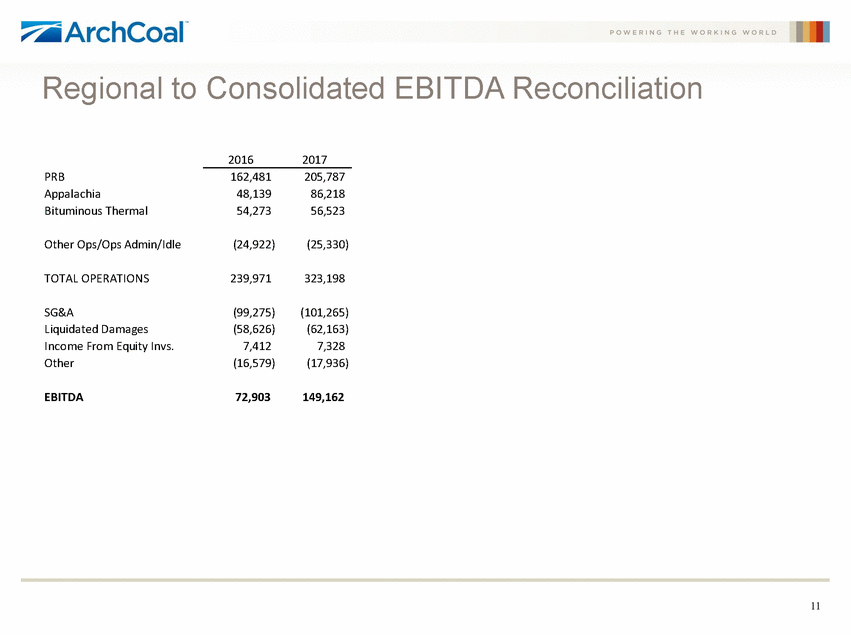
Regional to Consolidated EBITDA Reconciliation 2016 2017 PRB Appalachia Bituminous Thermal 162,481 48,139 54,273 205,787 86,218 56,523 Other Ops/Ops Admin/Idle (24,922) (25,330) TOTAL OPERATIONS 239,971 323,198 SG&A Liquidated Damages Income From Equity Invs. Other (99,275) (58,626) 7,412 (16,579) (101,265) (62,163) 7,328 (17,936) EBITDA 72,903 149,162 11
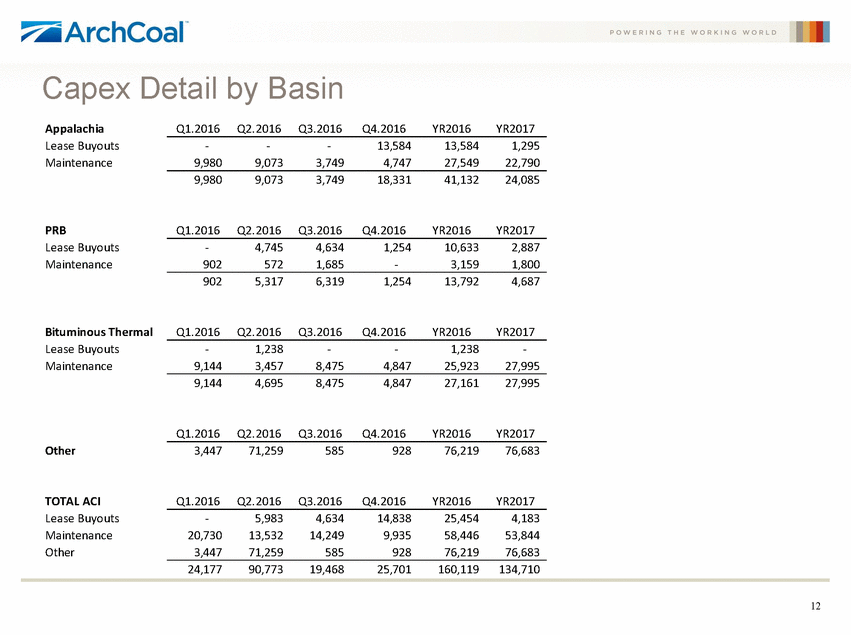
Capex Appalachia Lease Buyouts Maintenance Detail Q1.2016 by Basin Q2.2016 Q3.2016 Q4.2016 YR2016 YR2017 - 9,980 - 9,073 - 3,749 13,584 4,747 13,584 27,549 1,295 22,790 9,980 9,073 3,749 18,331 41,132 24,085 PRB Lease Buyouts Maintenance Q1.2016 Q2.2016 Q3.2016 Q4.2016 YR2016 YR2017 - 902 4,745 572 4,634 1,685 1,254 - 10,633 3,159 2,887 1,800 902 5,317 6,319 1,254 13,792 4,687 Bituminous Thermal Lease Buyouts Maintenance Q1.2016 Q2.2016 Q3.2016 Q4.2016 YR2016 YR2017 - 9,144 1,238 3,457 - 8,475 - 4,847 1,238 25,923 - 27,995 9,144 4,695 8,475 4,847 27,161 27,995 Q1.2016 Q2.2016 Q3.2016 Q4.2016 YR2016 YR2017 Other 3,447 71,259 585 928 76,219 76,683 TOTAL ACI Lease Buyouts Maintenance Other Q1.2016 Q2.2016 Q3.2016 Q4.2016 YR2016 YR2017 - 20,730 3,447 5,983 13,532 71,259 4,634 14,249 585 14,838 9,935 928 25,454 58,446 76,219 4,183 53,844 76,683 24,177 90,773 19,468 25,701 160,119 134,710 12
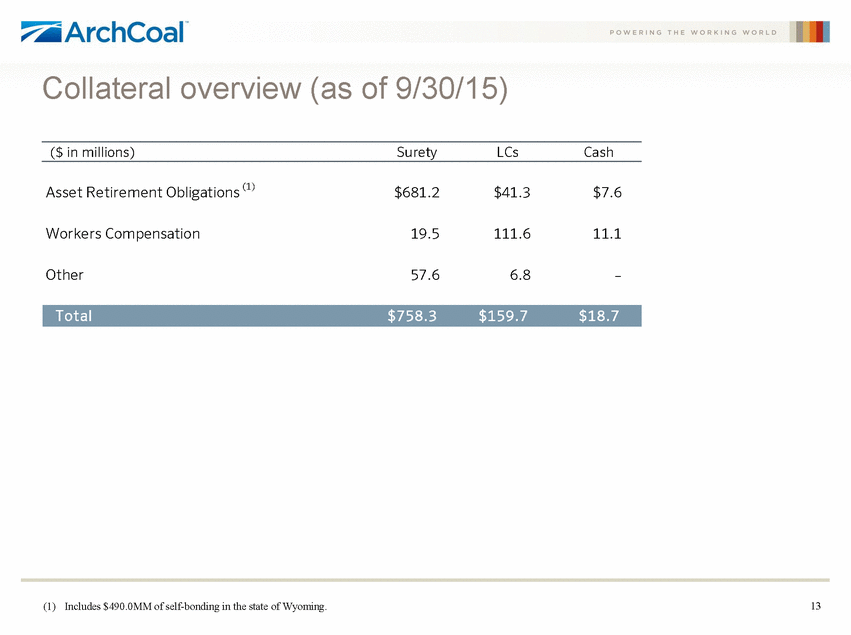
Collateral overview (as of 9/30/15) ($ in millions) Surety LCs Cash Asset Retirement Obligations (1) $681.2 $41.3 $7.6 Workers Compensation 19.5 111.6 11.1 Other 57.6 6.8 – (1) Includes $490.0MM of self-bonding in the state of Wyoming. 13 Total$758.3 $159.7 $18.7
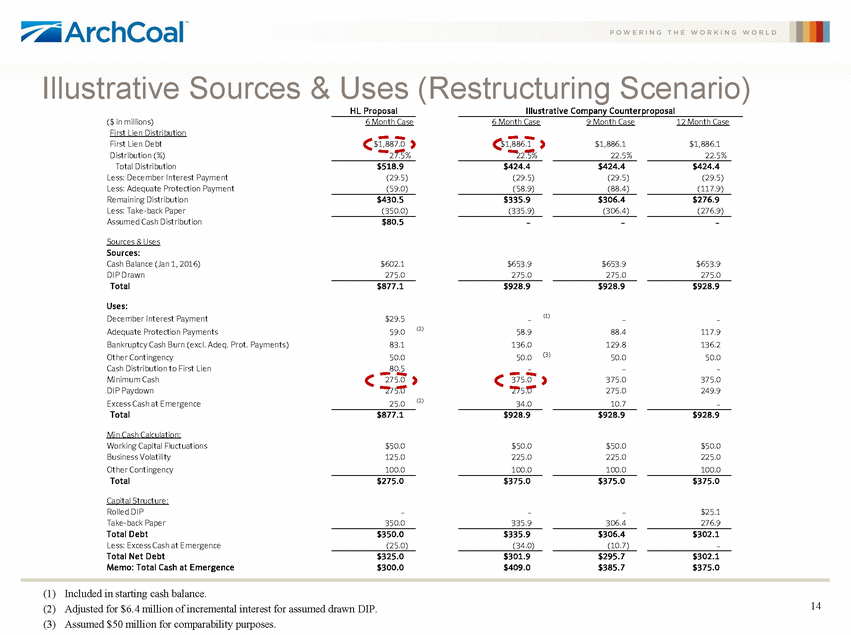
Illustrative Sources ($ in millions) First Lien Distribution & Uses (Restructuring Scenario) H L Pr oposal Illust r at ive Company Count e r pr oposal 6 Month Case 6 Month Case 9 Month Case 12 Month Case First Lien Debt Distribution (%) Total Distribution Less: December Interest Payment Less: Adequate Protection Payment Remaining Distribution Less: Take-back Paper Assumed Cash Distribution $1,887.0 27.5% $1,886.1 22.5% $1,886.1 22.5% $1,886.1 22.5% $518.9 (29.5) (59.0) $424.4 (29.5) (58.9) $424.4 (29.5) (88.4) $424.4 (29.5) (117.9) $430.5 (350.0) $335.9 (335.9) $306.4 (306.4) $276.9 (276.9) $80.5 – – – Sources & Uses Sour ce s: Cash Balance (Jan 1, 2016) DIP Drawn Tot al $602.1 275.0 $653.9 275.0 $653.9 275.0 $653.9 275.0 $877.1 $928.9 $928.9 $928.9 Use s: December Interest Payment Adequate Protection Payments Bankruptcy Cash Burn (excl. Adeq. Prot. Payments) Other Contingency Cash Distribution to First Lien Minimum Cash DIP Paydown Excess Cash at Emergence Tot al (1) $29.5 59.0 83.1 50.0 80.5 275.0 275.0 25.0 – 58.9 136.0 50.0 – 375.0 275.0 34.0 – 88.4 129.8 50.0 – 375.0 275.0 10.7 – 117.9 136.2 50.0 – 375.0 249.9 – (2) (3) ((34) (2) $877.1 $928.9 $928.9 $928.9 Min Cash Calculation: Working Capital Fluctuations Business Volatility Other Contingency Tot al $50.0 125.0 100.0 $50.0 225.0 100.0 $50.0 225.0 100.0 $50.0 225.0 100.0 $275.0 $375.0 $375.0 $375.0 Capital Structure: Rolled DIP Take-back Paper Tot al D e bt Less: Excess Cash at Emergence Tot al N e t D e bt Me mo: Tot al Cash at E me r ge nce – 350.0 – 335.9 – 306.4 $25.1 276.9 $350.0 (25.0) $335.9 (34.0) $306.4 (10.7) $302.1 – $325.0 $300.0 $301.9 $409.0 $295.7 $385.7 $302.1 $375.0 (1) (2) (3) Included in starting cash balance. Adjusted for $6.4 million of incremental interest for assumed drawn DIP. Assumed $50 million for comparability purposes. 14
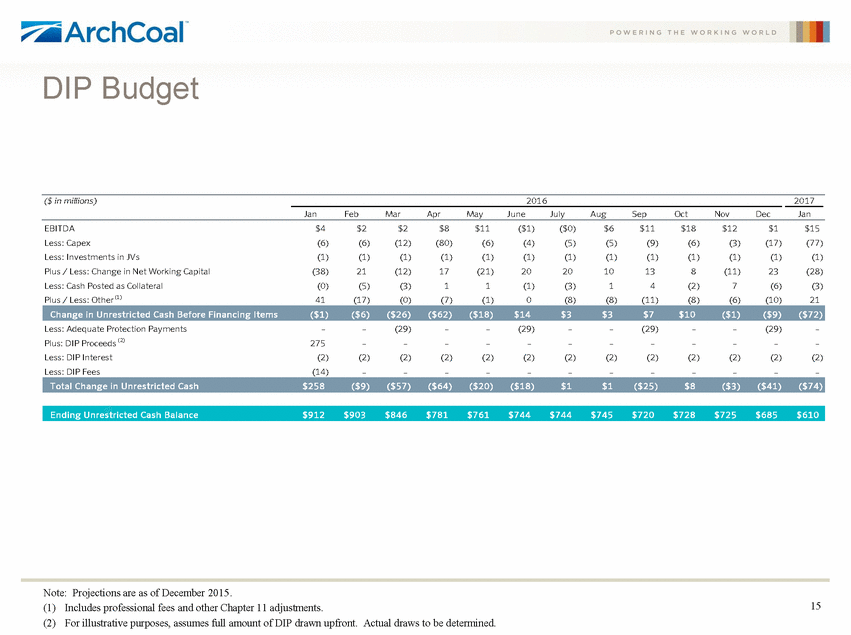
DIP Budget ($ in millions) 2016 2017 Jan Feb Mar Apr May June July Aug Sep Oct Nov Dec Jan EBITDA Less: Capex Less: Investments in JVs Plus / Less: Change in Net Working Capital Less: Cash Posted as Collateral Plus / Less: Other (1) $4 (6) (1) (38) (0) 41 $2 (6) (1) 21 (5) (17) $2 (12) (1) (12) (3) (0) $8 (80) (1) 17 1 (7) $11 (6) (1) (21) 1 (1) ($1) (4) (1) 20 (1) 0 ($0) (5) (1) 20 (3) (8) $6 (5) (1) 10 1 (8) $11 (9) (1) 13 4 (11) $18 (6) (1) 8 (2) (8) $12 (3) (1) (11) 7 (6) $1 (17) (1) 23 (6) (10) $15 (77) (1) (28) (3) 21 Less: Adequate Protection Payments Plus: DIP Proceeds (2) Less: DIP Interest Less: DIP Fees (29) – (2) – (29) – (2) – (29) – (2) – (29) – (2) – – 275 (2) (14) – – (2) – – – (2) – – – (2) – – – (2) – – – (2) – – – (2) – – – (2) – – – (2) – Note: Projections are as of December 2015. (1) Includes professional fees and other Chapter 11 adjustments. (2) For illustrative purposes, assumes full amount of DIP drawn upfront. Actual draws to be determined. 15 En d in g U n res tricted Cas h Balan ce$912$903$846$781$761$744$744$745$720$728$725$685$610 T otal Ch an ge in U n res tricted Cas h$258 ($ 9 ) ($ 5 7 ) ($ 6 4 ) ($ 2 0 ) ($ 1 8 ) $1 $1 ($ 2 5 ) $8 ($ 3 ) ($ 4 1 ) ($ 7 4 ) Ch an ge in U n res tricted Cas h Bef ore Fin an cin g Items($ 1 ) ($ 6 ) ($ 2 6 ) ($ 6 2 ) ($ 1 8 ) $14 $3 $3 $7 $10 ($ 1 ) ($ 9 ) ($ 7 2 )
