Attached files
| file | filename |
|---|---|
| 8-K - 8-K - ACCURAY INC | a16-1698_18k.htm |
Exhibit 99.1
J.P. Morgan Healthcare Conference January 2016 © Accuray and/or its affiliates. All rights reserved.
Safe Harbor Statement Forward Looking Statements Safe Harbor Statement Statements in this presentation (including the oral commentary that accompanies it) that are not statements of historical fact are forward-looking statements and are subject to the "safe harbor” provisions of the Private Securities Litigation Reform Act of 1995. Forward-looking statements in this presentation relate, but are not limited to the size and growth of the global market for radiation therapy systems, market position of our products, product roadmap, and our business opportunities and focus, including strategies for commercial execution, product positioning, customer accounts and emerging markets, and our expected financial results for the first quarter and full fiscal year 2016. Forward-looking statements are subject to risks and uncertainties that could cause actual results to differ materially from expectations, including but not limited to: the extent of market acceptance for the company’s products and services; the company’s ability to convert backlog to revenue; the success of its worldwide sales and marketing efforts; the ability to control operating expenses; continuing uncertainty in the global economic environment; potential differences between the Company’s preliminary financial analysis and the final results for the applicable period as a result of the completion of internal reporting process and review, and other risks detailed under the heading "Risk Factors" in the company’s report on Form 10-K for fiscal 2015, filed on August 28, 2015 and Form 10-Q for the period ended September 30, 2015, as filed on November 5, 2015 and as updated from time to time in our other filings with the Securities and Exchange Commission. Forward-looking statements speak only as of the date the statements are made and are based on information available to the company at the time those statements are made and/or management’s good faith belief as of that time with respect to future events. The company assumes no obligation to update forward-looking statements to reflect actual performance or results, changes in assumptions or changes in other factors affecting forward-looking information, except to the extent required by applicable securities laws. Accordingly, investors should not put undue reliance on any forward-looking statements. This presentation also contains non-GAAP financial information. Management believes that this non-GAAP financial measure provides useful supplemental information to management and investors regarding the performance of the company and facilitates a more meaningful comparison of results for current periods with previous operating results. Additionally, it will assist management in analyzing future trends, making strategic and business decisions and establishing internal budgets and forecasts. A reconciliation is available in the Appendix.
3 Accuray Overview Products: CyberKnife® and TomoTherapy® Systems Headquarters: Sunnyvale, CA Employees: 1,000 LTM Revenue(a): $387 million LTM Adjusted EBITDA(b): $23 million LTM Product Revenue: $186 million LTM Service Revenue: $201 million Service is recurring revenue source; average 3-year term Key Statistics LTM Revenue by Segment LTM Revenue by Geography Accuray At-a-Glance Accuray is a global radiation oncology company whose innovative products set the standard for precision and dosing accuracy Backlog as of 9/30/2015: $380M (a) Last twelve months as of September 30, 2016 (b) Excludes one-time legal expense of $3.4 million from Cowealth arbitration ruling $387 million LTM revenue International 53% U.S. 47% ©Accuray and/or its affiliates. All rights reserved. Product 48% Service 52%
4 Large and Growing Market Radiation Therapy is Integral to Cancer Treatment Worldwide incidence of cancer is estimated to reach 25 million cases by 2030; mainly driven by growth of aging population and lifestyle impacts 90% of all cancers projected as solid tumors: potentially treatable with radiotherapy Estimated 50% - 60% of all cancer patients worldwide would benefit from radiation therapy Growing preference for non-surgical treatment options Radiation Therapy Revenue (Hardware and Service, Excluding Protons) $4.4 billion in 2015 Sources: Radiation Therapy Equipment-A Global Strategic Business Report (Nov 2013); Comparative data is based upon information gathered from Fiscal year filings (Varian, Elekta, Accuray); Internal estimates for revenue growth forecast and regional breakdown; The Lancet Oncology Commission: “Expanding global access to radiotherapy” Expected constant-currency market growth of 2% to 3% ©Accuray and/or its affiliates. All rights reserved. Americas 44% EIMEA 33% APAC 23%
5 Radiation Therapy is Growing in Importance ©Accuray and/or its affiliates. All rights reserved. Cost Efficient 1 Increasing Support and Evidence for Efficacy 2 1x 3x 5x Relative Cost of Treatment
6 Global Radiotherapy Capacity Gaps 60% Growth in Market Capacity Projected Over Next 20 Years ©Accuray and/or its affiliates. All rights reserved. 2015 2035 GAP Radiotherapy Departments 7,700 10,900 3,200 Linear Accelerators 13,100 21,800 8,700 (Gap) +13,100 (Replacements) 21,800 (Total) Radiation Oncologists 23,200 45,500 22,300 Medical Physicists 10,000 39,300 29,300 Radiation Technologists 33,300 130,200 96,900 Coverage of radiotherapy services according to country as determined by global equipment databases, an activity-based operations model, cancer incidence, and evidence-based estimates of radiotherapy need.
Specialty Economy Premium Value 7 Accuray Opportunity: Products Positioned in Growth Segments ©Accuray and/or its affiliates. All rights reserved. $1M $2M $3M $4M $5M Clinical Precision ASP SRS/SBRT IMRT Conventional RT 0% +29% 15% - 23% CyberKnife® M6™ Series TomoTherapy® H ™ Series *Source: U.S. data. The Advisory Board Company – Service Line Forecast Compendium , April 2015 New Patient Volume: 5-Year Growth Estimate, 2014-2019
8 ©Accuray and/or its affiliates. All rights reserved. TomoTherapy® Accuray Products CyberKnife® CT scanner-based; ring gantry platform Daily, low-dose 3D CT scan Fast MLC delivers thousands of “beamlets” with continuous 360° rotation of the ring gantry Dose contouring superiority Spares healthy tissue Robotic architecture Continual imaging throughout treatment Automatically tracks and adjusts beam for tumor movement Sub-millimeter precision Spares healthy tissue Conventional LINAC C-arm based; standard gantry platform User discretion and intervention to image C-arm architecture and limited beam delivery angles requires larger treatment margin area and risk of healthy tissue exposure Competitor Accuray Differentiated Technology Products’ Unique Architecture Drives Superior Precision and Accuracy
9 ©Accuray and/or its affiliates. All rights reserved. Commercial Strategy Execution Five Primary Business Initiatives to Drive Revenue and Margin Growth Focus on Installed Base Satisfaction and Upcoming Replacement Opportunities Accelerate TomoTherapy® Mainstream Product Positioning Broaden CyberKnife® Clinical Versatility Around Multi-Leaf Collimators (MLC) Continued Focus on China Commercial Opportunity 1 2 3 5 4 Drive Order Growth by Focusing on Strategic Accounts With Key Hospital Networks
10 ©Accuray and/or its affiliates. All rights reserved. Accelerating TomoTherapy® System Mainstream Product Positioning In Fiscal Q2 2016 > 50% Overall New TomoTherapy System Mix Sales was in 1 or 2 Vault Facilities 1. Estimates based on U.S. IMV 2012/13 Radiation Therapy Market Summary Report, July 2013. 2. Internal Accuray information (July 2015). Opportunities in Single and Multi-Vault Hospital Facilities (U.S.) Type Cancer Facilities1 TomoTherapy® Share2 3+ vaults 345 25% 2 vaults 736 8% 1 vault 1,219 4% Total 2,300 9% Accuray Traditional Focus (Academic Medical Centers) Improved Access to Small/Medium Size Facilities
11 ©Accuray and/or its affiliates. All rights reserved. CyberKnife® InCise™ Multi-Leaf Collimator (MLC) Impact Treatment times reported by customers for clinical cases delivered to patients. Includes setup and delivery time. (Treatment times reported by MultiPlan® planning station for equivalent fixed/Iris plan. Includes estimated setup time.) Case Type Treatment Type MLC Treatment Times Fixed/Iris Treatment Times Intracranial SRS 22 min ~ 51 min SRS 30 min ~ 90 min IMRT 17 min IMRT 20 min Prostate SBRT 25 min ~ 40 min SBRT 18 min ~ 26 min IMRT 29 min ~ 49 min Lung SBRT 19 min In Fiscal Q2 2016 > Greater than 80% of all CyberKnife M6™ Orders Included an MLC Drives significant reduction in treatment times Expands clinical versatility from larger field size Addresses primary historical obstacles to clinical adoption MLC Benefits
12 ©Accuray and/or its affiliates. All rights reserved. Focusing on Strategic Accounts Includes integrated delivery networks for both hospitals and free standing centers Can drive multi-system orders Accuray has partnerships with the following GPOs: Orders : Key Opinion Leader (KOL) within the radiation oncology community Government customer/VA Trade-in trade-up by major university in Texas “Next generation” product collaboration with KOL in Japan Multi-system order for four TomoTherapy® Systems and one CyberKnife® M6™ System Three system orders placed by hospitals affiliated with our GPO partners went to backlog Strategic/GPO Accounts at a Glance Strategic Account First Half Activity
13 ©Accuray and/or its affiliates. All rights reserved. China Growth Potential Cancer Incidence in China Will Continue to Rise 65+ population will almost double in 15 years Source: World Health Organization, International Agency for Research on Cancer. http://globocan.iarc.fr/Pages/burden_sel.aspx accessed 1/7/2016 Cancer Incidence and Mortality Rates (Millions)* Population 65+ (Millions) 2015 2030 11 12 13 15 16 16 16 22 24 37 73 120 235 - 50 100 150 200 250 Turkey Spain Vietnam United Kingdom France Mexico Italy Germany Russia Japan USA India China
14 ©Accuray and/or its affiliates. All rights reserved. Radiotherapy Treatment Capacity - China Major Capacity Gap When Compared to Developed Markets RT Systems Per 1,000 Cancer Patients* * Accuray internal estimates **http://www-naweb.iaea.org/nahu/dirac/query3.asp accessed 1/7/2016 1,115 linear accelerators installed in China as of January 2016** Estimated RT Penetration* 2.42 1.56 0.46 0 1 2 3 US Japan China RT Systems Per 1,000 New Cancer Patients 57% 45% 20% 0% 10% 20% 30% 40% 50% 60% US Japan China RT Penetration
15 ©Accuray and/or its affiliates. All rights reserved. Accuray Commercial Progress – China Through Fiscal Q2 2016 Since 2013, Accuray products were placed in >85% of bunkers where Class A radiotherapy licenses were issued 34 licenses awarded to hospitals for Accuray products 39 licenses issued by NHFPC Accuray is well recognized and respected by Chinese KOL and NHFPC (Ministry of Health) Accuray strength in PLA (military) and large public sector facilities Private sector hospitals/cancer treatment facilities will drive growth going forward Go-to-market strategy for a “Non-Type A” product offering
16 ©Accuray and/or its affiliates. All rights reserved. Accuray Rated #1 in Independent Market Research Source: IMV ServiceTrak™ Radiation Oncology 2015 System Performance Factors System uptime meets expectations Reliability System ease of use Value of system upgrades Ease of treatment planning integration Accuray Rated #1 In Overall System Performance Highest Net Promoter Score In the Industry ServiceTrak™ Radiation Oncology Accuray rated #1 in 2015 459 U.S. Radiation Therapy Departments Surveyed 32% 0% 20% 40% 2014 2015 Net Promoter Score (NPS)
17 ©Accuray and/or its affiliates. All rights reserved. Installed Base Replacement Opportunities – Growth Catalyst Group Purchasing Organizations /Strategic Accounts 4.6X units will hit 10 year mark in next 3 years vs. previous 3 years Average radiation therapy system replacement cycle is 10 years 75% to 80% win rate when systems are replaced Installed base customer satisfaction critical to achieving replacement wins is highest ever as a result of increased TomoTherapy® System reliability 0 30 60 90 120 150 FY'03 FY'04 FY'05 FY'06 FY'07 FY'08 CK Tomo Gross Units
18 ©Accuray and/or its affiliates. All rights reserved. FY16 Q2 Order Demographics Continued Execution of Commercial Strategic Initiatives **Final Q2FY16 Results to be issued on January 28, 2016** Gross Orders Expected to be Approximately $67 Million Greater than 50% of TomoTherapy® System orders placed by sites with single or dual vaults Approximately 15% replacement sales to our existing customer base Approximately 30% to replace conventional linear accelerators in competitive bunkers Greater than 80% of orders for the CyberKnife® M6™ Series included an MLC 50% 15% 30% 80%
19 ©Accuray and/or its affiliates. All rights reserved. FY16 Q2 Update and FY16 Guidance Accuray Momentum Continues Gross orders of approximately $67M Revenues of approximately $107.5M; an increase of 10% (13% constant currency) Four gross product orders were converted from backlog to revenue in China during the quarter Cash, cash equivalents and short-term investments increased increased by approximately $3M in the second quarter and by approximately $12M during the first half of fiscal 2016 Represents a $33 million year-over-year improvement (1) FY2016 Guidance as presented on Q1 earnings release dated October 29, 2015. Prior guidance has not been updated and this is not intended as a reaffirmation of prior guidance GAAP Operating Income anticipated at upper end of EBITDA guidance range Q2 FY16 Expected Financial Perfomance FY16 Guidance(1) Gross Orders: $295 million +10% YoY growth Revenue: $395 to $410 million +4% to +8% YoY growth Adjusted EBITDA: $25 to $35 million +112% to +197% YoY growth
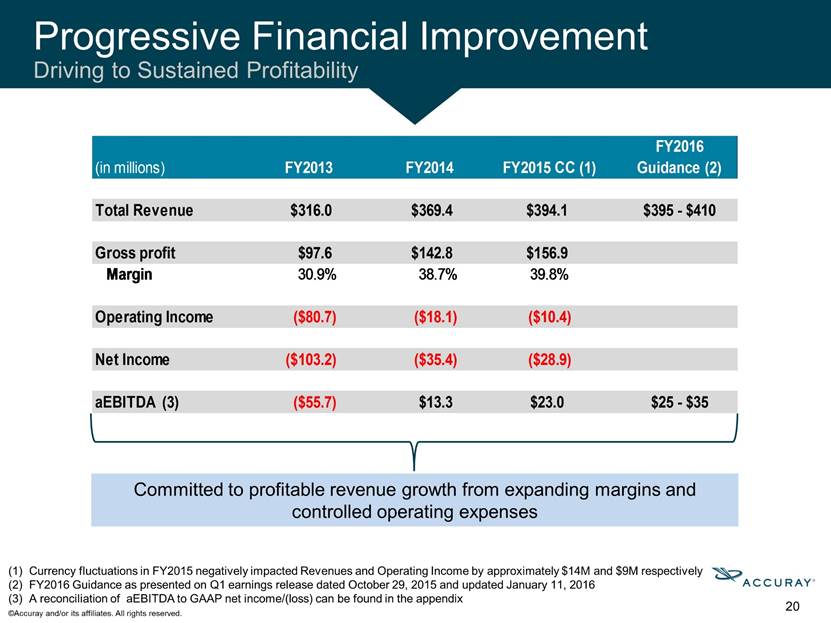
20 ©Accuray and/or its affiliates. All rights reserved. Progressive Financial Improvement Driving to Sustained Profitability Committed to profitable revenue growth from expanding margins and controlled operating expenses Currency fluctuations in FY2015 negatively impacted Revenues and Operating Income by approximately $14M and $9M respectively FY2016 Guidance as presented on Q1 earnings release dated October 29, 2015 and updated January 11, 2016 A reconciliation of aEBITDA to GAAP net income/(loss) can be found in the appendix aEBITDA (3) ($55.7) $13.3 $23.0 $25 - $35
[LOGO]