Attached files
| file | filename |
|---|---|
| EX-31.1 - CERTIFICATION - GOLDEN GRAIN ENERGY | a311certification103115.htm |
| EX-31.2 - CERTIFICATION - GOLDEN GRAIN ENERGY | a312certification103115.htm |
| EX-32.2 - CERTIFICATION - GOLDEN GRAIN ENERGY | a322certification103115.htm |
| EX-32.1 - CERTIFICATION - GOLDEN GRAIN ENERGY | a321certification103115.htm |
UNITED STATES
SECURITIES AND EXCHANGE COMMISSION
Washington, D.C. 20549
FORM 10-K
x | Annual report pursuant to Section 13 or 15(d) of the Securities Exchange Act of 1934. | |
For the fiscal year ended | October 31, 2015 | |
OR | ||
o | Transition report pursuant to Section 13 or 15(d) of the Securities Exchange Act of 1934. | |
For the transition period from to . | ||
COMMISSION FILE NUMBER 000-51177 | ||
GOLDEN GRAIN ENERGY, LLC
(Exact name of registrant as specified in its charter)
Iowa | 02-0575361 | |||
(State or other jurisdiction of incorporation or organization) | (I.R.S. Employer Identification No.) | |||
1822 43rd Street SW, Mason City, Iowa 50401 | ||||
(Address of principal executive offices) | ||||
(641) 423-8525 | ||||
(Registrant's telephone number, including area code) | ||||
Securities registered pursuant to Section 12(b) of the Act: | ||||
None | ||||
Securities registered pursuant to Section 12(g) of the Act: | ||||
Class A Membership Units | ||||
Indicate by check mark if the registrant is a well-known seasoned issuer, as defined in Rule 405 of the Securities Act.
o Yes x No
Indicate by check mark if the registrant is not required to file reports pursuant to Section 13 or Section 15(d) of the Act.
o Yes x No
Indicate by check mark whether the registrant: (1) has filed all reports required to be filed by Section 13 or 15(d) of the Securities Exchange Act of 1934 during the preceding 12 months (or for such shorter period that the registrant was required to file such reports), and (2) has been subject to such filing requirements for the past 90 days.
x Yes o No
Indicate by check mark whether the registrant has submitted electronically and posted on its corporate Website, if any, every Interactive Data File required to be submitted and posted pursuant to Rule 405 of Regulation S-T (§232.405 of this chapter) during the preceding 12 months (or for such shorter period that the registrant was required to submit and post such files).
x Yes o No
Indicate by check mark if disclosure of delinquent filers pursuant to Item 405 of Regulation S-K (§229.405 of this chapter) is not contained herein, and will not be contained, to the best of registrant's knowledge, in definitive proxy or information statements incorporated by reference in Part III of this Form 10-K or any amendment to this Form 10-K. x
Indicate by check mark whether the registrant is a large accelerated filer, an accelerated filer, a non-accelerated filer, or a smaller reporting company. See the definitions of "large accelerated filer," "accelerated filer" and "smaller reporting company" in Rule 12b-2 of the Exchange Act:
Large Accelerated Filer o | Accelerated Filer o |
Non-Accelerated Filer x | Smaller Reporting Company o |
Indicate by check mark whether the registrant is a shell company (as defined in Rule 12b-2 of the Exchange Act).
o Yes x No
As of April 30, 2015, the aggregate market value of the Class A membership units held by non-affiliates (computed by reference to the most recent offering price of Class A membership units) was $14,802,167. As of April 30, 2015, the aggregate market value of the Class B membership units held by non-affiliates (computed by reference to the most recent offering price of the Class B membership units) was $345,500.
Indicate the number of shares outstanding of each of the issuer's classes of common stock, as of the latest practicable date:
As of December 21, 2015, there were 18,953,000 Class A membership units outstanding and 920,000 Class B membership units outstanding.
DOCUMENTS INCORPORATED BY REFERENCE
The registrant has incorporated by reference into Part III of this Annual Report on Form 10-K portions of its definitive proxy statement to be filed with the Securities and Exchange Commission within 120 days after the close of the fiscal year covered by this Annual Report.
1
INDEX
Page Number | |
2
Forward Looking Statements
This report contains forward-looking statements that involve future events, our future performance and our expected future operations and actions. In some cases you can identify forward-looking statements by the use of words such as "may," "will," "should," "anticipate," "believe," "expect," "plan," "future," "intend," "could," "estimate," "predict," "hope," "potential," "continue," or the negative of these terms or other similar expressions. These forward-looking statements are only our predictions and involve numerous assumptions, risks and uncertainties, including, but not limited to those listed below and those business risks and factors described elsewhere in this report and our other Securities and Exchange Commission filings.
• | Ethanol, distiller grains and corn oil supply exceeding demand and corresponding price reductions; |
• | Any delays in shipping our products by rail and corresponding decreases in our sales as a result of these shipping delays; |
• | Changes in the availability and price of corn and natural gas; |
• | Our ability to profitably operate the ethanol plant, including the sale of distiller grains and corn oil, and maintain a positive spread between the selling price of our products and our raw material costs; |
• | The effect our hedging activities has on our financial performance and cash flows; |
• | Our ability to generate free cash flow to invest in our business, service our debt and satisfy the financial covenants contained in our credit agreement with our lender; |
• | Changes in our business strategy, capital improvements or development plans; |
• | Changes in plant production capacity or technical difficulties in operating the plant; |
• | Changes in general economic conditions or the occurrence of certain events causing an economic impact in the agriculture, oil or automobile industries; |
• | Changes in corn availability due to growing conditions, including unfavorable weather patterns; |
• | Lack of transport, storage and blending infrastructure preventing our products from reaching high demand markets; |
• | Changes in federal and/or state laws and environmental regulations (including the elimination or waiver of the Renewable Fuel Standard); |
• | Changes and advances in ethanol production technology; |
• | Competition from alternative fuel additives; |
• | Changes in interest rates or the lack of credit availability; and |
• | Our ability to retain key employees and maintain labor relations. |
Our actual results or actions could and likely will differ materially from those anticipated in the forward-looking statements for many reasons, including the reasons described in this report. We are not under any duty to update the forward-looking statements contained in this report. We cannot guarantee future results, levels of activity, performance or achievements. We caution you not to put undue reliance on any forward-looking statements, which speak only as of the date of this report. You should read this report and the documents that we reference in this report and have filed as exhibits, completely and with the understanding that our actual future results may be materially different from what we currently expect. We qualify all of our forward-looking statements with these cautionary statements. Unless otherwise stated, references in this report to particular years or quarters refer to our fiscal years ended in October and the associated quarters of those fiscal years.
PART I
ITEM 1. BUSINESS
Business Development
Golden Grain Energy, LLC was formed as an Iowa limited liability company on March 18, 2002, for the purpose of constructing, owning and operating a fuel-grade ethanol plant in Mason City in north central Iowa. References to "we," "us," "our" and the "Company" refer to Golden Grain Energy, LLC. Since December 2004, we have been engaged in the production of ethanol and distiller grains at the plant. We started producing corn oil at the plant in 2009.
We entered into an agreement with four companies which will develop a natural gas co-generation facility adjacent to our ethanol plant. We will purchase process steam from these companies at a discount compared to the cost of a comparable amount of natural gas which we would use to generate the process steam. We have also agreed to loan these companies $500,000 to assist in the development of the project. This natural gas co-generation facility will also produce electricity for sale. Management anticipates that this project will be operational in the spring of 2016.
On November 17, 2014, our board of directors declared a distribution of $2.60 per membership unit for members of record as of November 17, 2014. The total amount of the distribution was $51,669,800 which was paid in December 2014. On
3
May 18, 2015, our board of directors declared a distribution of $0.50 per membership unit for members of record as of that date. The total amount to be distributed was $9,936,500 and was paid in June 2015. On November 16, 2015, our board of directors declared a distribution of $0.70 per membership unit for members of record as of November 16, 2015. The total amount of the distribution was $13,911,100 which was paid on December 10, 2015.
Financial Information
Please refer to "ITEM 7. Management's Discussion and Analysis of Financial Condition and Results of Operations" for information about our revenue, profit and loss measurements and total assets and liabilities and "ITEM 8. Financial Statements and Supplementary Data" for our financial statements and supplementary data.
Principal Products
The principal products that we produce are ethanol, distiller grains and corn oil. The table below shows the approximate percentage of our total revenue which is attributed to each of our principal products for each of our last three fiscal years.
Product | Fiscal Year 2015 | Fiscal Year 2014 | Fiscal Year 2013 | |||
Ethanol | 80% | 81% | 76% | |||
Distiller Grains | 17% | 16% | 21% | |||
Corn Oil | 3% | 3% | 3% | |||
Ethanol
Ethanol is ethyl alcohol, a fuel component made primarily from corn and various other grains, which can be used as: (i) an octane enhancer in fuels; (ii) an oxygenated fuel additive for the purpose of reducing ozone and carbon monoxide vehicle emissions; and (iii) a non-petroleum-based gasoline substitute. Ethanol produced in the United States is primarily used for blending with unleaded gasoline and other fuel products. Ethanol blended fuel is typically designated in the marketplace according to the
percentage of the fuel that is ethanol, with the most common fuel blend being E10, which includes 10% ethanol. The United States Environmental Protection Agency ("EPA") has approved the use of gasoline blends that contain 15% ethanol, or E15, for use in all vehicles manufactured in model year 2001 and later. In addition, flexible fuel vehicles can use gasoline blends that contain up to 85% ethanol called E85.
Distiller Grains
The principal co-product of the ethanol production process is distiller grains, a high protein, high-energy animal feed supplement primarily marketed to the dairy and beef industry. We produce two forms of distiller grains: Modified/Wet Distillers Grains ("MWDG") and Distillers Dried Grains with Solubles ("DDGS"). MWDG is processed corn mash that has been dried to approximately 50% moisture. MWDG has a shelf life of approximately seven days and is often sold to nearby markets. DDGS is processed corn mash that has been dried to approximately 10% moisture. It has a longer shelf life and may be sold and shipped to any market regardless of its vicinity to our ethanol plant.
Corn Oil
We separate a portion of the corn oil contained in our distiller grains which we market separately from our distiller grains. The corn oil that we produce is not food grade corn oil and therefore cannot be used for human consumption. The primary uses of the corn oil that we produce are for animal feed, industrial uses and biodiesel production.
Principal Product Markets
As described below in "Distribution Methods," we market and distribute all of our ethanol, distiller grains and corn oil through RPMG, Inc. ("RPMG") a professional third party marketer. We have very limited control over the decisions RPMG makes regarding where our products are marketed. Our products are primarily sold in the domestic market, however, as domestic production of ethanol, distiller grains and corn oil continue to expand, we anticipate increased international sales of our products. The principal purchasers of ethanol are generally wholesale gasoline marketers or blenders. The principal markets for our ethanol are petroleum terminals in the continental United States.
Currently, the United States ethanol industry exports a significant amount of distiller grains. During our 2015 fiscal year, the largest importers of United States distiller grains were China, Mexico, South Korea, Vietnam and Canada. Demand for distiller
4
grains from China decreased during the second half of 2014 when China announced in June 2014 that it would stop issuing import permits for distiller grains from the United States due to the presence in some shipments of a genetically modified corn trait not approved for import. This announcement was followed in July 2014 by a new certification requirement that distiller grains shipments to China were free of the genetically modified corn trait. Further, a new registration requirement for Chinese importers of distillers grains began on September 1, 2015 which may lead to a decline in demand from this top importer of distillers grains.
During our 2015 fiscal year, exports of ethanol have increased with Canada receiving the largest percentage of ethanol produced in the United States and Brazil in second. India, the Philippines, South Korea and the United Arab Emirates have also been top destinations. However, ethanol export demand is more unpredictable than domestic demand and tends to fluctuate throughout the year as it is subject to monetary and political forces in other nations. An example of this, the recent imposition of a tax on imported ethanol by Brazil has created uncertainty as to the viability of that market for ethanol produced in the United States and may require United States producers to seek out other markets for their products. In addition, the strong U.S. Dollar may have negatively impacted ethanol exports from the United States during 2015.
We expect our ethanol, distiller grains and corn oil marketer to explore all markets for our products, including export markets. However, due to high transportation costs, and the fact that we are not located near a major international shipping port, we expect a majority of our products to continue to be marketed and sold domestically.
Distribution Methods
On October 1, 2012, we entered into an ethanol marketing agreement with RPMG. Because we are an owner of Renewable Products Marketing Group, LLC ("RPMG, LLC"), the parent company of RPMG, we receive favorable marketing fees from RPMG. Our ethanol marketing agreement allows us to elect to sell our ethanol through an index arrangement or at a fixed price agreed to between us and RPMG. Pursuant to the ethanol marketing agreement, RPMG is our exclusive marketer. The term of our ethanol marketing agreement is perpetual, until it is terminated by either party. The primary reasons our ethanol marketing agreement would terminate are if we cease to be an owner of RPMG, LLC, if there is a breach of the ethanol marketing agreement which is not cured, or if we give advance notice to RPMG that we wish to terminate the ethanol marketing agreement. Notwithstanding our right to terminate the ethanol marketing agreement, we may be obligated to continue to market our ethanol through RPMG for a period of time after the termination. Further, following the termination, we agreed to accept an assignment of certain railcar leases which RPMG has secured to service our ethanol sales. If our ethanol marketing agreement is terminated, it would trigger a redemption of our ownership interest in RPMG, LLC at our contributed capital balance at the time of termination.
On December 15, 2010, we entered into a distiller grains marketing agreement with RPMG. Pursuant to the agreement, RPMG agreed to market all of the distiller grains we produce. We agreed to pay RPMG a fee to market our distiller grains equal to the actual cost of marketing the distiller grains due to the fact that we are an owner of RPMG, LLC. The initial term of the RPMG distiller grains marketing agreement was nine months. Following the nine month period, we have the right to terminate the contract by giving RPMG ninety days written notice.
On February 2, 2009, we executed a corn oil marketing agreement with RPMG. Pursuant to the agreement, RPMG agreed to market all of the corn oil we produce, except for certain corn oil we may sell to corn oil customers we identified before we executed the agreement. Currently, all of our corn oil is being sold through RPMG. The initial term of the agreement was for one year. The agreement automatically renews for additional one year terms unless either party gives 180 days notice that the agreement will not be renewed. We agreed to pay RPMG a commission based on each pound of our corn oil that is sold by RPMG.
Sources and Availability of Raw Materials
Corn
Our plant currently uses approximately 40 million bushels of corn per year, or approximately 110,000 bushels per day, as the feedstock for its dry milling process. In October 2008, we received our Iowa grain dealer license which allows us to purchase corn directly from local producers in addition to local grain elevators as intermediaries. Our commodity manager is responsible for purchasing corn for our operations, scheduling corn deliveries and establishing hedging positions to protect the price we pay for corn.
Corn prices were lower during our 2015 fiscal year as a result of three consecutive years of favorable corn crops which has increased the amount of corn available to us. As a result of these favorable corn crops, we have not had difficulty securing the corn we need to operate the ethanol plant at prices that have allowed us to operate profitably. However, as we experienced during 2012, an unfavorable corn crop can have a significant negative impact on our profitability. We could experience a drought or other unfavorable weather condition during our 2016 fiscal year which could impact the price we pay for corn and could
5
negatively impact the availability of corn near our plant. If we experience a localized shortage of corn, we may be forced to purchase corn from producers who are farther away from our ethanol plant which can increase our transportation costs. In addition, if new corn customers enter the market, it can increase demand for corn which could result in higher corn prices. Since corn is the primary raw material we use to produce our products, the availability and cost of corn can have a significant impact on the profitability of our operations.
Natural Gas
Natural gas is an important input to our manufacturing process. We use natural gas to dry our distiller grains products to moisture contents at which they can be stored for longer periods of time. This allows the distiller grains we produce to be transported greater distances to serve broader livestock markets. We entered into an agreement with Interstate Power and Light Company to deliver all of the natural gas required by the plant. The agreement commenced in December 2004 and continued for a period of 10 years with an option for a 5 year renewal. During our 2014 fiscal year we provided notice to Interstate Power and Light Company of our election to renew our natural gas transportation agreement and we entered into a renewal of our natural gas transportation agreement until December 31, 2016. We do not anticipate any problems securing the natural gas we require to continue to operate the ethanol plant at capacity during our 2016 fiscal year or beyond.
Electricity
We entered into an agreement with Interstate Power and Light Company to supply all electrical energy required by the plant. The agreement commenced on June 2004 and continued through May 2007. After the expiration of the initial term, the agreement continues on a month-to-month basis and may be terminated by either party by giving 60 days prior written notice. We have elected to continue this contract on a month-to-month basis and have not given or received notice of termination of this agreement. We do not anticipate any problems securing the electricity that we require to continue to operate the ethanol plant at capacity during our 2016 fiscal year or beyond.
Water
The primary water supply for our plant is generated by one 800 gallon-per-minute pump at the well drilled at the plant site. We have a second high capacity well that has capacity to produce 600 gallons of water per minute. These two wells provide adequate water capacity to operate the plant under normal circumstances. In addition, we are connected to the City of Mason City's water supply for fire protection and in the event the water supplied by our wells is not sufficient. We have installed an underground distribution system for potable water, process water, fire protection and sanitary sewer lines. We paid a special fixed user fee of $3,333 per month to Mason City for our back-up water supply until February 2015. In addition, we pay Mason City for any potable water usage at the plant based on our actual usage times the current rate ordinance. In the future, we anticipate relying more on the City of Mason City to supply us with process water and to handle our wastewater discharge. We do not anticipate any problems securing the water that we require to continue to operate the ethanol plant at capacity during our 2016 fiscal year or beyond.
Patents, Trademarks, Licenses, Franchises and Concessions
We do not currently hold any patents, trademarks, franchises or concessions. We were granted a perpetual and royalty free license by ICM to use certain ethanol production technology necessary to operate our ethanol plant. The cost of the license granted by ICM was included in the amount we paid to Fagen to design and build our ethanol plant and expansion.
Seasonality Sales
We experience some seasonality of demand for our ethanol, distiller grains and corn oil. Since ethanol is predominantly blended with gasoline for use in automobiles, ethanol demand tends to shift in relation to gasoline demand. As a result, we experience some seasonality of demand for ethanol in the summer months related to increased driving and, as a result, increased gasoline demand. In addition, we experience some increased ethanol demand during holiday seasons related to increased gasoline demand. We also experience decreased distiller grains demand during the summer months due to natural depletion in the size of herds at cattle feed lots and when the animals are turned out to pasture or are slaughtered. Further, we expect some seasonality of demand for our corn oil since a major corn oil user is biodiesel plants which typically reduce production during the winter months.
6
Working Capital
We primarily use our working capital for purchases of raw materials necessary to operate the ethanol plant and for capital expenditures to maintain and upgrade the ethanol plant. Our primary sources of working capital are income from our operations as well as our revolving term loan with our primary lender, Farm Credit. For our 2016 fiscal year, we anticipate completing our water treatment building facility and installing upgrades to our pollution monitoring system amongst other smaller capital projects using cash from our operations. In addition, we anticipate using cash from our operations to maintain our current plant infrastructure. Management believes that our current sources of working capital are sufficient to sustain our operations and complete our capital expenditures during our 2016 fiscal year and beyond.
Dependence on a Major Customer
As discussed above, we rely on RPMG for the sale and distribution of all of our products and are highly dependent on RPMG for the successful marketing of our products. We do not currently have the ability to market our ethanol, distiller grains and corn oil internally should RPMG be unable to market these products for us at acceptable prices. We anticipate that we would be able to secure alternate marketers should RPMG fail, however, a loss of our marketer could significantly harm our financial performance.
Competition
We are in direct competition with numerous ethanol producers, many of which have greater resources than we do. As of November 13, 2015, the Renewable Fuels Association ("RFA") estimates that there are 214 ethanol production facilities in the United States with capacity to produce approximately 15.5 billion gallons of ethanol per year. The RFA estimates that approximately 3% of the ethanol production capacity in the United States was not operating as of November 13, 2015. The largest ethanol producers include Archer Daniels Midland, Flint Hills Resources, Green Plains Renewable Energy, POET, and Valero Renewable Fuels, each of which are capable of producing significantly more ethanol than we produce.
The following table identifies the largest ethanol producers in the United States along with their production capacities.
U.S. FUEL ETHANOL PRODUCTION CAPACITY
BY TOP PRODUCERS
Producers of Approximately 700
million gallons per year (MMgy) or more
Company | Current Capacity (MMgy) | Under Construction/Expansions (MMgy) | Percent of Market | ||||||
Archer Daniels Midland | 1,762 | — | 11 | % | |||||
Poet Biorefining | 1,626 | — | 10 | % | |||||
Valero Renewable Fuels | 1,300 | — | 8 | % | |||||
Green Plains Renewable Energy | 1,085 | — | 7 | % | |||||
Flint Hills Resources | 820 | — | 5 | % | |||||
Updated: November 13, 2015
Ethanol Competition
Ethanol is a commodity product where competition in the industry is predominantly based on price and consistent fuel quality. Larger ethanol producers may be able to realize economies of scale in their operations that we are unable to realize. Further, we have experienced increased competition from oil companies who have purchased ethanol production facilities, including Valero Renewable Fuels and Flint Hills Resources, which are subsidiaries of larger oil companies. These oil companies are required to blend a certain amount of ethanol each year. Therefore, the oil companies may be able to operate their ethanol production facilities at times when it is unprofitable for us to operate our ethanol plant. Further, some ethanol producers own multiple ethanol plants which may allow them to compete more effectively by providing them flexibility to run certain production facilities while they have other facilities shut down. This added flexibility may allow these ethanol producers to compete more effectively, especially during periods when operating margins are unfavorable in the ethanol industry. Finally some ethanol producers who own ethanol plants in geographically diverse areas of the United States may spread the risk they encounter related to feedstock prices. The drought that occurred during 2012 and 2013 led to some areas of the United States with very poor corn crops and other areas with plentiful corn crops. Ethanol producers that own production facilities in different areas of the United States may reduce their risk of experiencing higher feedstock prices due to localized decreased corn crops.
7
We anticipate increased competition from renewable fuels that do not use corn as the feedstock. Many of the current ethanol production incentives are designed to encourage the production of renewable fuels using raw materials other than corn. One type of ethanol production feedstock that is being explored is cellulose. Cellulose is the main component of plant cell walls and is the most common organic compound on earth. Cellulose is found in wood chips, corn stalks, rice straw, amongst other common plants. Cellulosic ethanol is ethanol produced from cellulose.
A handful of companies have begun construction or completed commercial scale cellulosic ethanol plants. If this technology can be profitably employed on a commercial scale, it could potentially lead to ethanol that is less expensive to produce than corn based ethanol. Cellulosic ethanol may also capture more government subsidies and assistance than corn based ethanol. This could decrease demand for our product or result in competitive disadvantages for our ethanol production process.
A number of automotive, industrial and power generation manufacturers are developing alternative clean power systems using fuel cells, plug-in hybrids, electric cars or clean burning gaseous fuels. Electric car technology has recently grown in popularity, especially in urban areas. While there are currently a limited number of vehicle recharging stations, making electric cars not feasible for all consumers, there has been increased focus on developing these recharging stations to make electric car technology more widely available in the future. Additional competition from these other sources of alternative energy, particularly in the automobile market, could reduce the demand for ethanol, which would negatively impact our profitability.
In addition to domestic producers of ethanol, we face competition from ethanol produced in foreign countries, particularly Brazil. Ethanol imports have been lower in recent years and ethanol exports have been higher which was one of the reasons for improved operating margins in the ethanol industry. As of May 1, 2013, Brazil increased its domestic ethanol use requirement from 20% to 25% which decreased the amount of ethanol available in Brazil for export. However, in the future we may experience increased ethanol imports from Brazil which could put negative pressure on domestic ethanol prices and result in excess ethanol supply in the United States.
Competition among ethanol producers may continue to increase as gasoline demand decreases due to more fuel efficient vehicles being produced. If the concentration of ethanol used in most gasoline does not increase and gasoline demand is lower due to increased fuel efficiency by the vehicles operated in the United States, competition may increase among ethanol producers to supply the ethanol market.
Distiller Grains Competition
Our ethanol plant competes with other ethanol producers in the production and sales of distiller grains. Distiller grains are primarily used as an animal feed which replaces corn and soybean meal. As a result, we believe that distiller grains prices are positively impacted by increases in corn and soybean prices. In addition, in recent years the United States ethanol industry has increased exports of distiller grains which management believes has positively impacted demand and prices for distiller grains in the United States. In the event these distiller grains exports decrease, it could lead to an oversupply of distiller grains in the United States which could result in increased competition among ethanol producers for sales of distiller grains and could negatively impact distiller grains prices in the United States.
Corn Oil Competition
We compete with many ethanol producers for the sale of corn oil. Many ethanol producers have installed the equipment necessary to separate corn oil from the distiller grains they produce which has increased competition for corn oil sales and has resulted in lower market corn oil prices.
Research and Development
We are continually working to develop new methods of operating the ethanol plant more efficiently. We continue to conduct research and development activities in order to realize these efficiency improvements.
Governmental Regulation and Federal Ethanol Supports
Federal Ethanol Supports
The ethanol industry is dependent on several economic incentives to produce ethanol, the most significant of which is the Federal Renewable Fuels Standard (the "RFS"). The RFS requires that in each year, a certain amount of renewable fuels must be used in the United States. The RFS is a national program that does not require that any renewable fuels be used in any particular
8
area or state, allowing refiners to use renewable fuel blends in those areas where it is most cost-effective. The RFS statutory volume requirement increases incrementally each year until the United States is required to use 36 billion gallons of renewable fuels by 2022. Starting in 2009, the RFS required that a portion of the RFS must be met by certain "advanced" renewable fuels. These advanced renewable fuels include ethanol that is not made from corn, such as cellulosic ethanol and biomass based biodiesel. The use of these advanced renewable fuels increases each year as a percentage of the total renewable fuels required to be used in the United States.
The United States Environmental Protection Agency (the "EPA") has the authority to waive the RFS statutory volume requirement, in whole or in part, provided one of the following two conditions have been met: (1) there is inadequate domestic renewable fuel supply; or (2) implementation of the requirement would severely harm the economy or environment of a state, region or the United States. Annually, the EPA is supposed to pass a rule that establishes the number of gallons of different types of renewable fuels that must be used in the United States which is called the renewable volume obligations.
The RFS statutory volume requirement for corn based ethanol is 14.4 billion gallons in 2014, 15 billion gallons in 2015 and 15 billion gallons in 2016. Previously, the EPA issued proposed renewable volume obligations pursuant to the RFS which were lower than these statutory requirements. On November 30, 2015, the EPA released its final renewable volume obligations for corn-based ethanol for 2014 through 2016. The final renewable volume obligations reduced the corn-based ethanol use requirements pursuant to the RFS below the statutory requirements. Pursuant to the final renewable volume obligation release, the RFS requirement for corn-based ethanol was 13.61 billion gallons for 2014, 14.05 billion gallons for 2015 and 14.5 billion gallons for 2016. Many in the ethanol industry believe that this significant departure from the statutory requirements for the RFS is not supported by the law and will have a significant negative impact on the ethanol industry. Management anticipates that there will be legal challenges to the EPA's final renewable volume obligation release.
In February 2010, the EPA issued new regulations governing the RFS. These new regulations are called RFS2. The most controversial part of RFS2 involves what is commonly referred to as the lifecycle analysis of greenhouse gas emissions. Specifically, the EPA adopted rules to determine which renewable fuels provided sufficient reductions in greenhouse gases, compared to conventional gasoline, to qualify under the RFS program. RFS2 establishes a tiered approach, where regular renewable fuels are required to accomplish a 20% greenhouse gas reduction compared to gasoline, advanced biofuels and biomass-based biodiesel must accomplish a 50% reduction in greenhouse gases, and cellulosic biofuels must accomplish a 60% reduction in greenhouse gases. Any fuels that fail to meet this standard cannot be used by fuel blenders to satisfy their obligations under the RFS program. The scientific method of calculating these greenhouse gas reductions has been a contentious issue. Many in the ethanol industry were concerned that corn based ethanol would not meet the 20% greenhouse gas reduction requirement based on certain parts of the environmental impact model that many in the ethanol industry believed was scientifically suspect. However, RFS2 as adopted by the EPA provides that corn-based ethanol from modern ethanol production processes does meet the definition of a renewable fuel under the RFS program. Our ethanol plant was grandfathered into the RFS due to the fact that it was constructed prior to the effective date of the lifecycle greenhouse gas requirement and is not required to prove compliance with the lifecycle greenhouse gas reductions. Many in the ethanol industry are concerned that certain provisions of RFS2 as adopted may disproportionately benefit ethanol produced from sugarcane which could make sugarcane based ethanol, which is primarily produced in Brazil, more competitive in the United States ethanol market. If this were to occur, it could reduce demand for the ethanol that we produce.
Most ethanol that is used in the United States is sold in a blend called E10. E10 is a blend of 10% ethanol and 90% gasoline. E10 is approved for use in all standard vehicles. Estimates indicate that gasoline demand in the United States is approximately 137 billion gallons per year. Assuming that all gasoline in the United States is blended at a rate of 10% ethanol and 90% gasoline, the maximum demand for ethanol is 13.7 billion gallons per year. This is commonly referred to as the "blend wall," which represents a theoretical limit where more ethanol cannot be blended into the national gasoline pool. This is a theoretical limit because it is believed that it would not be possible to blend ethanol into every gallon of gasoline that is being used in the United States and it discounts the use of higher percentage blends such as E15 or E85. These higher percentage blends may lead to additional ethanol demand if they become more widely available and accepted by the market.
Many in the ethanol industry believe that it will be impossible to meet the RFS requirement in future years without an increase in the percentage of ethanol that can be blended with gasoline for use in standard (non-flex fuel) vehicles. The United States Environmental Protection Agency (the "EPA") has approved the use of E15, gasoline which is blended at a rate of 15% ethanol and 85% gasoline, in vehicles manufactured in the model year 2001 and later. However, there are still state hurdles that need to be addressed in some states before E15 will become more widely available. Many states still have regulatory issues that prevent the sale of E15. Sales of E15 may be limited because it is not approved for use in all vehicles, the EPA requires a label that management believes may discourage consumers from using E15, and retailers may choose not to sell E15 due to concerns regarding liability. In addition, different gasoline blendstocks may be required at certain times of the year in order to use E15 due to federal regulations related to fuel evaporative emissions which may limit E15 sales in these markets. As a result, the approval of E15 by the EPA has not had an immediate impact on ethanol demand in the United States.
9
State Ethanol Supports
In 2006, Iowa passed legislation promoting the use of renewable fuels in Iowa. One of the most significant provisions of the Iowa renewable fuels legislation is a renewable fuels standard encouraging 10% of the gasoline sold in Iowa to be renewable fuels by 2009 and increasing incrementally to 25% renewable fuels by 2019. This is expected to be achieved through the use of tax credits that are designed to encourage the further utilization of renewable fuels in Iowa. This legislation could increase local demand for ethanol and may increase the local price for ethanol. In 2011, the Iowa legislature increased the E85 tax credit to 18 cents per gallon, created an E15 tax credit of 3 cents per gallon from 2011 until 2014, decreasing to 2.5 cents per gallon from 2015 until 2017 and waived the misfueling liability for retailers associated with E15. These changes were intended to encourage the use of higher level blends of ethanol in Iowa.
Effect of Governmental Regulation
The government's regulation of the environment changes constantly. We are subject to extensive air, water and other environmental regulations and we have been required to obtain a number of environmental permits to construct and operate the ethanol plant. It is possible that more stringent federal or state environmental rules or regulations could be adopted, which could increase our operating costs and expenses. It also is possible that federal or state environmental rules or regulations could be adopted that could have an adverse effect on the use of ethanol. Plant operations are governed by the Occupational Safety and Health Administration ("OSHA"). OSHA regulations may change such that the costs of operating the ethanol plant may increase. Any of these regulatory factors may result in higher costs or other adverse conditions effecting our operations, cash flows and financial performance.
We have obtained all of the necessary permits to operate the ethanol plant. During our 2015 fiscal year, we incurred costs and expenses of approximately $357,000 complying with environmental laws, including the cost of obtaining permits. Although we have been successful in obtaining all of the permits currently required, any retroactive change in environmental regulations, either at the federal or state level, could require us to obtain additional or new permits or spend considerable resources in complying with such regulations.
In late 2009, California passed a Low Carbon Fuels Standard ("LCFS"). The California LCFS requires that renewable fuels used in California must accomplish certain reductions in greenhouse gases which is measured using a lifecycle analysis, similar to the RFS. On December 29, 2011, a federal district court in California ruled that the California LCFS was unconstitutional which halted implementation of the California LCFS. However, the California Air Resources Board ("CARB") appealed this court ruling and on September 18, 2013, the federal appellate court reversed the federal district court finding the LCFS constitutional and remanding the case back to federal district court to determine whether the LCFS imposes a burden on interstate commerce that is excessive in light of the local benefits. On June 30, 2014, the United States Supreme Court declined to hear the appeal of the federal appellate court ruling and CARB recently re-adopted the LCFS with some slight modifications. The LCFS could have a negative impact on demand for corn-based ethanol and result in decreased ethanol prices affecting our ability to operate profitably.
The European Union concluded an anti-dumping investigation related to ethanol produced in the United States and exported to Europe. As a result of this investigation, the European Union imposed a tariff on ethanol which is produced in the United States and exported to Europe. This tariff could result in decreased exports of ethanol to Europe which could negatively impact the market price of ethanol in the United States.
Employees
As of October 31, 2015, we had 48 full-time employees and no part time employees.
Financial Information about Geographic Areas
All of our operations are domiciled in the United States. All of the products we sold to our customers for our fiscal years 2015, 2014 and 2013 were produced in the United States and all of our long-lived assets are domiciled in the United States. We have engaged a third-party professional marketer which decides where our products are marketed and we have limited control over the marketing decisions made by our marketer. Our marketer may decide to sell our products in countries other than the United States. However, we anticipate that our products will still primarily be marketed and sold in the United States.
10
ITEM 1A. RISK FACTORS.
You should carefully read and consider the risks and uncertainties below and the other information contained in this report. The risks and uncertainties described below are not the only ones we may face. The following risks, together with additional risks and uncertainties not currently known to us or that we currently deem immaterial could impair our financial condition and results of operation.
Risks Relating to Our Business
Our profitability is dependent on a positive spread between the price we receive for our products and the raw material costs required to produce our products. Practically all of our revenue is derived from the sale of our ethanol, distiller grains and corn oil. Our primary raw material costs are related to corn costs and natural gas costs. Our profitability depends on a positive spread between the market price of the ethanol, distiller grains and corn oil we produce and the raw material costs related to these products. While ethanol, distiller grains and corn oil prices typically change in relation to corn prices, this correlation may not always exist. In the event the prices of our products decrease at a time when our raw material costs are increasing, we may not be able to profitably operate the ethanol plant. Further, if the spread between the price we receive for our products and the raw material costs associated with producing those products is negative for an extended period of time, we may fail which could negatively impact the value of our units.
Decreasing gasoline prices may lower ethanol prices which could negatively impact our ability to operate profitably. In recent years, the price of ethanol has been less than the price of gasoline which increased demand for ethanol from fuel blenders. However, recently the price of gasoline has been decreasing significantly which has reduced the spread between the price of gasoline and the price of ethanol. This trend has reduced demand for ethanol and has negatively impacted ethanol prices. These lower ethanol prices have come at a time when corn prices are increasing which has decreased our profit margins. If this trend continues for a significant period of time, it could hurt our ability to profitably operate the ethanol plant which could decrease the value of our units.
We may be forced to reduce production or cease production altogether if we are unable to secure the corn we require to operate the ethanol plant. We require a significant amount of corn to operate the ethanol plant at capacity. While the last three corn crops, harvested in the fall of 2013, 2014 and 2015, were the three largest corn crops on record in the United States, it is possible that corn demand may increase such that a shortage could develop. Further, if the corn crop harvested in future years is smaller than we experienced in 2015, it is possible that we could experience corn shortages in the future which could negatively impact our ability to operate the ethanol plant. We may also experience a shortage of corn in our local market which may not increase national corn prices but may require us to increase our corn basis in order to attract corn which can impact our overall corn costs. If we are unable to secure the corn we require to continue to operate the ethanol plant, or we are unable to secure corn at prices that allow us to operate profitably, we may have to reduce production or cease operating altogether which may negatively impact the value of our units.
We engage in hedging transactions which involve risks that could harm our business. We are exposed to market risk from changes in commodity prices. Exposure to commodity price risk results from our dependence on corn and natural gas in the ethanol production process, along with sales of ethanol. We seek to minimize the risks from fluctuations in the prices of corn, natural gas and ethanol through the use of hedging instruments. The effectiveness of our hedging strategies is dependent on the price of corn, natural gas and ethanol and our ability to sell sufficient products to use all of the corn and natural gas for which we have futures contracts. Our hedging activities may not successfully reduce the risk caused by price fluctuation which may leave us vulnerable to high corn and natural gas prices or relatively lower ethanol prices. Alternatively, we may choose not to engage in hedging transactions in the future and our operations and financial conditions may be adversely affected during periods in which corn and/or natural gas prices increase or ethanol prices decrease. Further, we may be required to use a significant amount of cash to make margin calls required by our commodities broker as a result of decreases in corn prices and the resulting unrealized and realized losses we may experience on our hedging activities. Utilizing cash for margin calls has an impact on the cash we have available for our operations which could result in liquidity problems during times when corn prices change significantly which can harm our profitability.
Our business is not diversified. Our success depends almost entirely on our ability to profitably operate our ethanol plant. We do not have any other lines of business or other significant sources of revenue if we are unable to operate our ethanol plant and manufacture ethanol, distiller grains and corn oil. Further, all of our investments are in companies involved in the ethanol industry. If economic or political factors adversely affect the market for ethanol, distiller grains or corn oil, we have no other line of business to fall back on. Our business would also be significantly harmed if the ethanol plant could not operate at full capacity for any extended period of time.
11
If RPMG, which markets all of our products, fails, it may negatively impact our ability to profitably operate the ethanol plant. All of our ethanol, distiller grains and corn oil is marketed by RPMG. Therefore, nearly all of our revenue is derived from sales that are secured by RPMG. If RPMG is unable to market all of our products, it may negatively impact our ability to profitably operate the ethanol plant. While management believes that we could secure an alternative marketer if RPMG were to fail, switching marketers may negatively impact our cash flow and our ability to continue to operate the ethanol plant. If we are unable to sell all of our ethanol, distiller grains and corn oil at prices that allow us to operate profitably, it may decrease the value of our units.
We depend on our management and key employees, and the loss of these relationships could negatively impact our ability to operate profitably. We are highly dependent on our management team to operate our ethanol plant. We may not be able to replace these individuals should they decide to cease their employment with us, or if they become unavailable for any other reason. While we seek to compensate our management and key employees in a manner that will encourage them to continue their employment with us, they may choose to seek other employment. Any loss of these executive officers and key employees may prevent us from operating the ethanol plant profitably which could decrease the value of our units.
We may violate the terms of our credit agreements and financial covenants which could result in our lender demanding immediate repayment of our loans. We have a credit facility with Farm Credit. Our credit agreements with Farm Credit include various financial loan covenants. We are currently in compliance with all of our financial loan covenants. Current management projections indicate that we will be in compliance with our loan covenants for at least the next 12 months. However, unforeseen circumstances may develop which could result in us violating our loan covenants. If we violate the terms of our credit agreements, including our financial loan covenants, Farm Credit could deem us to be in default of our loans and require us to immediately repay the entire outstanding balance of our loans. If we do not have the funds available to repay the loans or we cannot find another source of financing, we may fail which could decrease or eliminate the value of our units.
Our operations may be negatively impacted by natural disasters, severe weather conditions, and other unforeseen plant shutdowns which can negatively impact our operations. Our operations may be negatively impacted by events outside of our control such as natural disasters, severe weather, strikes, train derailments and other unforeseen events which may negatively impact our operations. If we experience any of these unforeseen circumstances which negatively impact our operations, it may affect our cash flow and negatively impact the value of our business.
We may incur casualty losses that are not covered by insurance which could negatively impact the value of our units. We have purchased insurance which we believe adequately covers our losses from foreseeable risks. However, there are risks that we may encounter for which there is no insurance or for which insurance is not available on terms that are acceptable to us. If we experience a loss which materially impairs our ability to operate the ethanol plant which is not covered by insurance, the value of our units could be reduced or eliminated.
Risks Related to Ethanol Industry
Demand for ethanol may not continue to grow unless ethanol can be blended into gasoline in higher percentage blends for standard vehicles. Currently, ethanol is primarily blended with gasoline for use in standard (non-flex fuel) vehicles to create a blend which is 10% ethanol and 90% gasoline. Estimates indicate that approximately 137 billion gallons of gasoline are sold in the United States each year. Assuming that all gasoline in the United States is blended at a rate of 10% ethanol and 90% gasoline, the maximum demand for ethanol is 13.7 billion gallons. This is commonly referred to as the "blend wall," which represents a theoretical limit where more ethanol cannot be blended into the national gasoline pool. Many in the ethanol industry believe that the ethanol industry has reached this blend wall. In order to expand demand for ethanol, higher percentage blends of ethanol must be utilized in standard vehicles. Such higher percentage blends of ethanol are a contentious issue. Automobile manufacturers and environmental groups have fought against higher percentage ethanol blends. The EPA approved the use of E15 for standard (non-flex fuel) vehicles produced in the model year 2001 and later. The fact that E15 has not been approved for use in all vehicles and the labeling requirements associated with E15 may lead to gasoline retailers refusing to carry E15. In addition, restrictions on the evaporative emissions of E15 during the summer months can limit the availability of E15 in some markets. Without an increase in the allowable percentage blends of ethanol that can be used in all vehicles, demand for ethanol may not continue to increase which could decrease the selling price of ethanol and could result in our inability to operate the ethanol plant profitably, which could reduce or eliminate the value of our units.
Lack of rail transportation infrastructure and delayed rail shipments could negatively impact our financial performance. During 2014, the ethanol industry experienced difficulty transporting ethanol by rail, the primary manner in which our ethanol is transported to the market. During winter months, rail transportation can be slowed due to poor weather. If we are unable to transport our ethanol by rail, it may require that we reduce production or cease production altogether. Further, our ethanol inventory may increase due to the difficulty we may experience shipping our ethanol which can impact our financial performance.
12
Management anticipates that slower railcar shipments may reoccur in the future until the rail transportation capacity in the United States increases. Delays in shipping our products could have a negative impact on our financial performance which could negatively impact our ability to operate the ethanol plant profitably.
Excess ethanol supply in the market could put negative pressure on the price of ethanol which could lead to tight operating margins and may impact our ability to operate profitably. In the past the ethanol industry has confronted market conditions where ethanol supply exceeded demand which led to unfavorable operating conditions. Most recently, in 2012, profitability in the ethanol industry was reduced due to increased ethanol imports from Brazil at a time when gasoline demand in the United States was lower and domestic ethanol supplies were higher. This disconnect between ethanol supply and demand resulted in lower ethanol prices at a time when corn prices were higher which led to unfavorable operating conditions. We may experience periods of time when ethanol supply exceeds demand which could negatively impact our profitability. The United States benefited from additional exports of ethanol during our 2015 fiscal year which may not continue to occur during our 2016 fiscal year. We may experience periods of ethanol supply and demand imbalance during our 2016 fiscal year, especially since the corn-based ethanol use requirement in the RFS was reduced by the EPA in November 2015 compared to the statutory requirements. If we experience excess ethanol supply, either due to increased ethanol production or lower gasoline demand, it could negatively impact the price of ethanol which could hurt our ability to profitably operate the ethanol plant.
If distiller grains exports to China were to be reduced, this could have a negative effect on the price of distiller grains in the U.S. and negatively affect our profitability. China, the largest buyer of distiller grains in the world, announced in June 2014 that it would stop issuing import permits for U.S. distiller grains due to the presence of a genetically modified trait not approved by China for import. This announcement was followed in July 2014 by a new requirement by China of a certification by the U.S. government that distiller grains shipments to China are free of the genetically modified trait. These issues virtually closed the export market to China for a portion of 2014. While these issues were eventually resolved and the Chinese market was successfully reopened in December 2014, a new registration requirement for Chinese importers of distiller grains began on September 1, 2015. This new requirement along with other uncertainties with China may create trade barriers resulting in a decline in demand from this top importer. If export demand for distiller grains is significantly reduced as a result, the price of distiller grains in the U.S. would likely decline which would have a negative effect on our revenue and could impact our ability to profitably operate which could in turn reduce the value of our units.
Technology advances in the commercialization of cellulosic ethanol may decrease demand for corn-based ethanol which may negatively affect our profitability. The current trend in ethanol production research is to develop an efficient method of producing ethanol from cellulose-based biomass, such as agricultural waste, forest residue, municipal solid waste, and energy crops. This trend is driven by the fact that cellulose-based biomass is generally cheaper than corn, and producing ethanol from cellulose-based biomass would create opportunities to produce ethanol in areas of the country which are unable to grow corn. The Energy Independence and Security Act of 2007 and the 2008 Farm Bill offer strong incentives to develop commercial scale cellulosic ethanol. The RFS requires that 16 billion gallons per year of advanced bio-fuels must be consumed in the United States by 2022. Additionally, state and federal grants have been awarded to several companies which are seeking to develop commercial-scale cellulosic ethanol plants. This has encouraged innovation and has led to several companies which are either in the process or have completed construction of commercial scale cellulosic ethanol plants. If an efficient method of producing ethanol from cellulose-based biomass is developed, we may not be able to compete effectively. If we are unable to produce ethanol as cost-effectively as cellulose-based producers, our ability to generate revenue and our financial condition will be negatively impacted.
Changes and advances in ethanol production technology could require us to incur costs to update our plant or could otherwise hinder our ability to compete in the ethanol industry or operate profitably. Advances and changes in the technology of ethanol production are expected to occur. Such advances and changes may make the ethanol production technology installed in our ethanol plant less desirable or obsolete. These advances could allow our competitors to produce ethanol at a lower cost than us. If we are unable to adopt or incorporate technological advances, our ethanol production methods and processes could be less efficient than our competitors, which could cause the ethanol plant to become uncompetitive or completely obsolete. If our competitors develop, obtain or license technology that is superior to ours or that makes our technology obsolete, we may be required to incur significant costs to enhance or acquire new technology so that our ethanol production remains competitive. Alternatively, we may be required to seek third-party licenses, which could also result in significant expenditures. These third-party licenses may not be available or, once obtained, they may not continue to be available on commercially reasonable terms. These costs could negatively impact our financial performance by increasing our operating costs and reducing our net income which could decrease the value of our units.
We operate in an intensely competitive industry and compete with larger, better financed companies which could impact our ability to operate profitably. There is significant competition among ethanol producers. There are numerous producer-owned and privately-owned ethanol plants operating throughout the Midwest and elsewhere in the United States. We also face competition from ethanol producers located outside of the United States. The largest ethanol producers include Archer Daniels
13
Midland, Flint Hills Resources, Green Plains Renewable Energy, POET, and Valero Renewable Fuels, each of which are capable of producing significantly more ethanol than we produce. Further, many believe that there will be further consolidation occurring in the ethanol industry which will likely lead to a few companies which control a significant portion of the United States ethanol production market. We may not be able to compete with these larger producers. These larger ethanol producers may be able to affect the ethanol market in ways that are not beneficial to us which could negatively impact our financial performance and the value of our units.
Competition from the advancement of alternative fuels may lessen demand for ethanol. Alternative fuels, gasoline oxygenates and ethanol production methods are continually under development. A number of automotive, industrial and power generation manufacturers are developing alternative clean power systems using fuel cells, plug-in hybrids, and electric cars or clean burning gaseous fuels. Like ethanol, these emerging technologies offer an option to address worldwide energy costs, the long-term availability of petroleum reserves and environmental concerns. If these alternative technologies continue to expand and gain broad acceptance and become readily available to consumers for motor vehicle use, we may not be able to compete effectively. This additional competition could reduce the demand for ethanol, resulting in lower ethanol prices that might adversely affect our results of operations and financial condition.
If exports of ethanol are reduced, including as a result of the imposition by the European Union of a tariff on U.S. ethanol, ethanol prices may be negatively impacted. The United States ethanol industry was supported during our 2015 fiscal year with exports of ethanol which increased demand for our ethanol. Management believes these additional exports of ethanol were due to lower market ethanol prices in the United States and increased global demand for ethanol. However, these ethanol exports may not continue. In 2012, the European Union concluded an anti-dumping investigation related to ethanol produced in the United States and exported to Europe. As a result of this investigation, the European Union has imposed a tariff on ethanol which is produced in the United States and exported to Europe. While we continue to experience some ethanol exports to Europe, as a result of this tariff, if ethanol prices increase, these exports to the European Union may cease. Further, ethanol exports could potentially be higher without the European Union tariff. In addition, other importers of United States ethanol could reduce their imports which could negatively impact ethanol prices in the United States and could result in an imbalance between ethanol supply and ethanol demand. Any decrease in ethanol prices or demand may negatively impact our ability to profitably operate the ethanol plant.
Consumer resistance to the use of ethanol based on the belief that ethanol is expensive, adds to air pollution, harms engines and/or takes more energy to produce than it contributes or based on perceived issues related to the use of corn as the feedstock to produce ethanol may affect demand for ethanol. Certain individuals believe that the use of ethanol will have a negative impact on gasoline prices at the pump. Some also believe that ethanol adds to air pollution and harms car and truck engines. Still other consumers believe that the process of producing ethanol actually uses more fossil energy, such as oil and natural gas, than the amount of energy that is produced. Further, some consumers object to the fact that ethanol is produced using corn as the feedstock which these consumers perceive as negatively impacting food prices. These consumer beliefs could potentially be wide-spread and may be increasing as a result of efforts to increase the allowable percentage of ethanol that may be blended for use in vehicles. If consumers choose not to buy ethanol based on these beliefs, it would affect demand for the ethanol we produce which could negatively affect our profitability and financial condition.
Risks Related to Regulation and Governmental Action
On November 30, 2015 the EPA released its final renewable volume obligations for corn-based ethanol under the RFS which is lower than the statutory requirements. On November 30, 2015, the EPA released its final renewable volume obligations under the RFS for 2014, 2015 and 2016. The renewable volume obligations for conventional biofuels, including the corn-based ethanol we produce, is significantly lower than the statutory standard set in the RFS. The RFS requires the use of 14.40 billion gallons of conventional biofuels in 2014, 15 billion gallons in 2015 and 15 billion gallons in 2016. Pursuant to the EPA regulation, the requirement for conventional biofuels in 2014 was 13.61 billion gallons, 14.05 billion gallons in 2015 and 14.5 billion gallons in 2016. This is a significant reduction in each of these years compared to the requirements in the RFS. Further, due to the lower price of gasoline, we do not anticipate that renewable fuels blenders will use more ethanol than is required by the RFS which may result in a significant decrease in ethanol demand. This departure by the EPA from the statutory requirements in the RFS is expected to have a negative impact on ethanol prices and demand and is expected to result in reduced operating margins in the future. This reduction in ethanol demand is expected to have a material negative impact on our operating performance and financial condition.
Government incentives for ethanol production may be reduced or eliminated in the future, which could hinder our ability to operate at a profit. The ethanol industry is assisted by various federal and state ethanol incentives, the most important of which is the RFS set forth in the Energy Policy Act of 2005. The RFS helps support a market for ethanol that might disappear without this incentive. The United States Environmental Protection Agency ("EPA") has the authority to waive the RFS statutory volume requirement, in whole or in part, provided certain conditions have been met. Annually, the EPA is supposed to pass a rule
14
that establishes the number of gallons of different types of renewable fuels that must be used in the United States which is called the renewable volume obligations. There have also been proposals in Congress to reduce or eliminate the RFS. If the EPA further reduces the RFS requirements for corn-based ethanol such as the ethanol we produce or if the RFS were to be otherwise reduced or eliminated by Congress, the market price and demand for ethanol could decrease which will negatively impact our financial performance.
The California Low Carbon Fuel Standard may decrease demand for corn based ethanol which could negatively impact our profitability. California passed a Low Carbon Fuels Standard ("LCFS") which requires that renewable fuels used in California must accomplish certain reductions in greenhouse gases which reductions are measured using a lifecycle analysis. Management believes that these regulations could preclude corn based ethanol produced in the Midwest from being used in California. California represents a significant ethanol demand market. If the ethanol industry is unable to supply corn based ethanol to California, it could significantly reduce demand for the ethanol we produce. This could result in a reduction of our revenues and negatively impact our ability to profitably operate the ethanol plant.
Changes in environmental regulations or violations of these regulations could be expensive and reduce our profitability. We are subject to extensive air, water and other environmental laws and regulations. In addition, some of these laws require our plant to operate under a number of environmental permits. These laws, regulations and permits can often require expensive pollution control equipment or operational changes to limit actual or potential impacts to the environment. A violation of these laws and regulations or permit conditions can result in substantial fines, damages, criminal sanctions, permit revocations and/or plant shutdowns. In the future, we may be subject to legal actions brought by environmental advocacy groups and other parties for actual or alleged violations of environmental laws or our permits. Additionally, any changes in environmental laws and regulations, both at the federal and state level, could require us to spend considerable resources in order to comply with future environmental regulations. The expense of compliance could be significant enough to reduce our profitability and negatively affect our financial condition.
Carbon dioxide may be regulated in the future by the EPA as an air pollutant requiring us to obtain additional permits and install additional environmental mitigation equipment, which could adversely affect our financial performance. In 2007, the Supreme Court decided a case in which it ruled that carbon dioxide is an air pollutant under the Clean Air Act for motor vehicle emissions. In 2011 the EPA issued a tailoring rule that deferred greenhouse gas regulations for ethanol plants until July of 2014. However, in July of 2013 the D.C. Circuit issued an opinion vacating the EPA's deferral of those regulations for biogenic sources, including ethanol plants. On June 23, 2014 the U.S. Supreme Court affirmed in part and reversed in part the D.C. Circuit’s decision. For plants that already hold PSD permits the court generally affirmed the EPA's ability to regulate greenhouse gas regulations. Our plant produces a significant amount of carbon dioxide. While there are currently no regulations restricting carbon dioxide emissions, if the EPA or the State of Iowa were to regulate carbon dioxide emissions by plants such as ours, we may have to apply for additional permits or we may be required to install carbon dioxide mitigation equipment or take other as yet unknown steps to comply with these potential regulations. Compliance with any future regulation of carbon dioxide, if it occurs, could be costly and may prevent us from operating the ethanol plant profitably which could decrease or eliminate the value of our units.
ITEM 2. PROPERTIES
Our ethanol plant is located on an approximately 154-acre site in north-central Iowa. The plant's address is 1822 43rd Street SW, Mason City, Iowa. We produce all of our ethanol, distiller grains and corn oil at this site. The ethanol plant has capacity to produce more than 110 million gallons of ethanol per year. At the beginning of our 2015 fiscal year, we purchased an additional approximately 30 acres of land adjacent to our ethanol plant which will be used for the water treatment facility and natural gas co-generation project as well as other plant upgrade projects we may undertake in the future.
All of our tangible and intangible property serves as collateral for our senior credit facility with Farm Credit. Our senior credit facility is discussed in greater detail under "Item 7. Management's Discussion and Analysis of Financial Condition and Results of Operations - Short-Term and Long-Term Debt Sources."
ITEM 3. LEGAL PROCEEDINGS
From time to time in the ordinary course of business, we may be named as a defendant in legal proceedings related to various issues, including without limitation, workers' compensation claims, tort claims, or contractual disputes. We are not currently involved in any material legal proceedings.
ITEM 4. MINE SAFETY DISCLOSURES
None.
15
PART II
ITEM 5. MARKET FOR REGISTRANT'S COMMON EQUITY, RELATED STOCKHOLDER MATTERS AND ISSUER PURCHASES OF EQUITY SECURITIES.
There is no public trading market for our Class A or Class B membership units. We have created a qualified online matching service ("QMS") in order to facilitate trading of our units. The QMS consists of an electronic bulletin board that provides information to prospective sellers and buyers of our units. We do not receive any compensation for creating or maintaining the QMS. We do not become involved in any purchase or sale negotiations arising from the QMS. In advertising the QMS, we do not characterize the Company as being a broker or dealer or an exchange. We do not give advice regarding the merits or shortcomings of any particular transaction. We do not receive, transfer or hold funds or securities as an incident of operating the QMS. We do not use the QMS to offer to buy or sell securities other than in compliance with the securities laws, including any applicable registration requirements. We have no role in effecting the transactions beyond approval, as required under our operating agreement, and the issuance of new certificates. So long as we remain a publicly reporting company, information about the Company will be publicly available through the SEC's filing system. However, if at any time we cease to be a publicly reporting company, we anticipate continuing to make information about the Company publicly available on our website in order to continue operating the QMS.
As of December 21, 2015, there were approximately 860 members holders of record of our Class A and Class B units.
The following table contains historical information by quarter for the past two years regarding the actual unit transactions that were completed by our unit-holders during the periods specified. We believe this most accurately represents the current trading value of our units. The information was compiled by reviewing the completed unit transfers that occurred on the QMS bulletin board or through private transfers during the quarters indicated.
Quarter | Low Price | High Price | Average Price | Number of Units Traded | ||||||||
2014 1st | 3.34 | 3.50 | 3.46 | 65,000 | ||||||||
2014 2nd | 3.50 | 4.50 | 4.17 | 104,390 | ||||||||
2014 3rd | 4.50 | 4.50 | 4.50 | 84,000 | ||||||||
2014 4th | 2.20 | 6.25 | 4.96 | 210,000 | ||||||||
2015 1st | 5.70 | 6.00 | 5.83 | 18,000 | ||||||||
2015 2nd | 5.00 | 6.00 | 5.56 | 45,000 | ||||||||
2015 3rd | 5.90 | 6.25 | 6.09 | 26,000 | ||||||||
2015 4th | 5.50 | 6.50 | 6.04 | 57,000 | ||||||||
The following tables contain the bid and asked prices that were posted on the QMS bulletin board and includes some transactions that were not completed. We believe the table above more accurately describes the trading value of our units as the bid and asked prices below include some offers that never resulted in completed transactions. The information was compiled by reviewing postings that were made on the QMS bulletin board.
Seller's Quarter | Low Price | High Price | Average Price | Number of Units Traded | ||||||||
2014 1st | 3.50 | 3.75 | 3.63 | 65,000 | ||||||||
2014 2nd | 4.25 | 4.50 | 4.38 | 60,000 | ||||||||
2014 3rd | — | — | — | None | ||||||||
2014 4th | — | — | — | None | ||||||||
2015 1st | 6.00 | 6.00 | 6.00 | 33,000 | ||||||||
2015 2nd | 5.90 | 6.50 | 6.24 | 91,000 | ||||||||
2015 3rd | — | — | — | None | ||||||||
2015 4th | 6.85 | 6.85 | 6.85 | 6,000 | ||||||||
16
Buyer's Quarter | Low Price | High Price | Average Price | Number of Units Traded | ||||||||
2014 1st | 3.10 | 3.50 | 3.28 | 30,000 | ||||||||
2014 2nd | 3.70 | 4.25 | 4.06 | 63,000 | ||||||||
2014 3rd | 4.30 | 4.60 | 4.47 | 129,000 | ||||||||
2014 4th | 4.70 | 6.00 | 5.39 | 61,000 | ||||||||
2015 1st | 5.00 | 5.00 | 5.00 | 35,000 | ||||||||
2015 2nd | 4.00 | 4.00 | 4.00 | 10,000 | ||||||||
2015 3rd | 5.75 | 5.80 | 5.80 | 33,700 | ||||||||
2015 4th | — | — | — | None | ||||||||
As a limited liability company, we are required to restrict the transfers of our membership units in order to preserve our partnership tax status. Our membership units may not be traded on any established securities market or readily traded on a secondary market (or the substantial equivalent thereof). All transfers are subject to a determination that the transfer will not cause us to be deemed a publicly traded partnership.
DISTRIBUTIONS
Distributions are paid to our unit holders in proportion to the number of units held by each unit holder, regardless of class. A unit holder's distribution is determined by dividing the number of units owned by the unit holder by the total number of units outstanding, regardless of class. Our board of directors has complete discretion over the timing and amount of distributions to our unit holders subject to certain restrictions in our credit agreements and our operating agreement. Our operating agreement requires the board of directors to try to make cash distributions at such times and in such amounts as will permit our unit holders to satisfy their income tax liability related to owning our units in a timely fashion. Our expectations with respect to our ability to make future distributions are discussed further in "Item 7. Management's Discussion and Analysis of Financial Condition and Results of Operations." Distributions are restricted by certain loan covenants in our credit agreements with Farm Credit. During our 2015 fiscal year, we were allowed to make distributions to our members in an amount that does not exceed 75% of our net income for the prior fiscal year provided that we are not in default of our credit agreements and the payment of the distribution would not cause us to default on our credit agreements. Following the end of our 2015 fiscal year, our loan covenants with Farm Credit were amended to allow us to distribute up to 100% of our prior year's net income if following the distribution we have at least $15 million in working capital. Also, in the event our working capital will exceed $20 million following the distribution, our ability to make distributions to our members is not limited by our loan covenants. During our 2014 fiscal year, we made two distributions to our members for a total of $0.90 per membership unit for a total distribution of $17,894,700. During our 2015 fiscal year, we made two distributions to our members for a total of $3.10 per membership unit for a total distribution of $61,606,300. Subsequent to the end of our 2015 fiscal year, on November 16, 2015, our board of directors declared a distribution of $0.70 per membership unit for a total of $13,911,100 to be paid to members of record as of November 16, 2015. The distribution was paid in December 2015.
PERFORMANCE GRAPH
The following graph shows a comparison of cumulative total member return since November 1, 2010, calculated on a dividend reinvested basis, for the Company, the NASDAQ Composite Index (the "NASDAQ Market Index") and an index of other companies that have the same SIC code as the Company (the "SIC Code Index"). The graph assumes $100 was invested in each of our units, the NASDAQ Market Index, and the SIC Code Index on November 1, 2010. Data points on the graph are annual. Note that historic unit price performance is not necessarily indicative of future unit price performance.
17
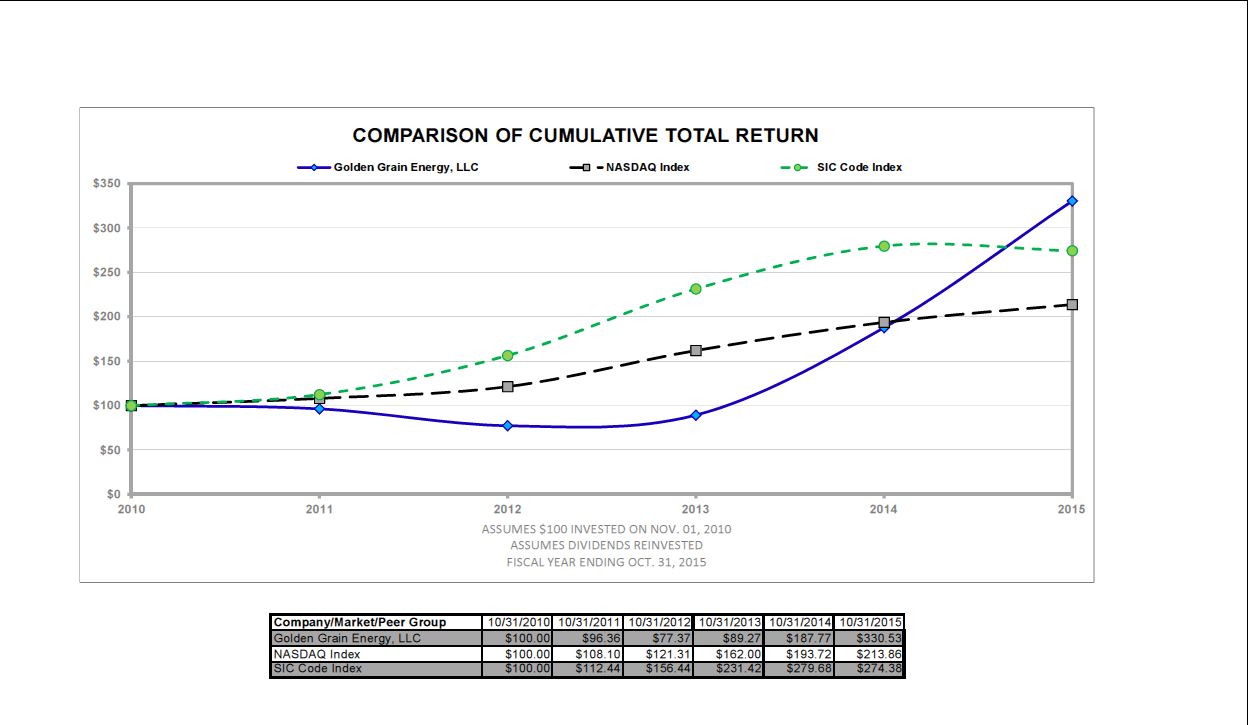
Pursuant to the rules and regulations of the Securities and Exchange Commission, the performance graph and the information set forth therein shall not be deemed to be filed for purposes of Section 18 of the Securities Exchange Act of 1934, and shall not be deemed to be incorporated by reference in any filing under the Securities Act of 1933, as amended, or the Exchange Act, except as shall be expressly set forth by specific reference in such a filing.
ITEM 6. SELECTED FINANCIAL DATA
The following table presents selected consolidated financial and operating data as of the dates and for the periods indicated. The selected balance sheet financial data as of October 31, 2013, 2012 and 2011 and the selected income statement data and other financial data for the years ended October 31, 2012 and 2011 have been derived from our audited consolidated financial statements that are not included in this Form 10-K. The selected balance sheet financial data as of October 31, 2015 and 2014 and the selected income statement data and other financial data for each of the years in the three year period ended October 31, 2015 have been derived from the audited Financial Statements included elsewhere in this Form 10-K. You should read the following table in conjunction with "Item 7. Management Discussion and Analysis of Financial Condition and Results of Operations" and the financial statements and the accompanying notes included elsewhere in this Form 10-K. Among other things, those financial statements include more detailed information regarding the basis of presentation for the following consolidated financial data.
Statement of Operations Data: | 2015 | 2014 | 2013 | 2012 | 2011 | |||||||||||||||
Revenues | $ | 221,149,134 | $ | 289,152,549 | $ | 350,721,175 | $ | 327,830,377 | $ | 324,927,805 | ||||||||||
Cost Goods Sold | 194,216,462 | 225,335,539 | 338,014,664 | 322,740,236 | 301,052,197 | |||||||||||||||
Gross Profit | 26,932,672 | 63,817,010 | 12,706,511 | 5,090,141 | 23,875,608 | |||||||||||||||
Operating Expenses | 3,407,954 | 3,569,152 | 2,550,236 | 2,207,634 | 2,524,830 | |||||||||||||||
Operating Income | 23,524,718 | 60,247,858 | 10,156,275 | 2,882,507 | 21,350,778 | |||||||||||||||
Other Income (Expense) | 8,421,801 | 19,031,679 | 4,026,753 | 3,706,912 | 5,474,218 | |||||||||||||||
Net Income | $ | 31,946,519 | $ | 79,279,537 | $ | 14,183,028 | $ | 6,589,419 | $ | 26,824,996 | ||||||||||
Weighted Average Units Outstanding | 19,873,000 | 19,881,333 | 20,645,833 | 24,460,000 | 24,460,000 | |||||||||||||||
Net Income Per Unit | $ | 1.61 | $ | 3.99 | $ | 0.69 | $ | 0.27 | $ | 1.10 | ||||||||||
Cash Distributions per Unit | $ | 3.10 | $ | 0.90 | $ | 0.10 | $ | 0.65 | $ | 0.25 | ||||||||||
18
Balance Sheet Data: | 2015 | 2014 | 2013 | 2012 | 2011 | |||||||||||||||
Current Assets | $ | 47,036,908 | $ | 70,279,557 | $ | 14,051,401 | $ | 19,215,366 | $ | 23,461,588 | ||||||||||
Net Property and Equipment | 62,130,548 | 59,644,340 | 66,114,201 | 71,121,448 | 72,557,819 | |||||||||||||||
Other Assets | 28,987,864 | 37,633,918 | 29,332,147 | 25,110,250 | 24,096,284 | |||||||||||||||
Total Assets | 138,155,320 | 167,557,815 | 109,497,749 | 115,447,064 | 120,115,691 | |||||||||||||||
Current Liabilities | 8,114,578 | 7,791,972 | 8,323,526 | 8,466,689 | 6,450,820 | |||||||||||||||
Long-Term Liabilities | 476,962 | 542,282 | 3,285,499 | 4,286,379 | 2,069,240 | |||||||||||||||
Members' Equity | 129,563,780 | 159,223,561 | 97,888,724 | 102,693,996 | 111,595,631 | |||||||||||||||
Book Value Per Unit | $ | 6.52 | $ | 8.01 | $ | 4.92 | $ | 4.20 | $ | 4.56 | ||||||||||
* See "Item 7. Management's Discussion and Analysis of Financial Condition and Results of Operations" for further discussion of our financial results.
ITEM 7. MANAGEMENT'S DISCUSSION AND ANALYSIS OF FINANCIAL CONDITION AND RESULTS OF OPERATIONS
Results of Operations
Comparison of the Fiscal Years Ended October 31, 2015 and 2014
The following table shows the results of our operations and the percentage of revenues, cost of goods sold, operating expenses and other items to total revenues in our statement of operations for the fiscal years ended October 31, 2015 and 2014:
2015 | 2014 | ||||||||||
Income Statement Data | Amount | % | Amount | % | |||||||
Revenue | $ | 221,149,134 | 100.0 | $ | 289,152,549 | 100.0 | |||||
Cost of Goods Sold | 194,216,462 | 87.8 | 225,335,539 | 77.9 | |||||||
Gross Profit | 26,932,672 | 12.2 | 63,817,010 | 22.1 | |||||||
Operating Expenses | 3,407,954 | 1.5 | 3,569,152 | 1.2 | |||||||
Operating Income | 23,524,718 | 10.6 | 60,247,858 | 20.8 | |||||||
Other Income | 8,421,801 | 3.8 | 19,031,679 | 6.6 | |||||||
Net Income | $ | 31,946,519 | 14.4 | $ | 79,279,537 | 27.4 | |||||
Revenues. Our total revenue was lower for our 2015 fiscal year compared to the same period of 2014, primarily due to decreases in the average price we received for each of our products. We produced more ethanol and corn oil during our 2015 fiscal year compared to the same period of 2014. For our 2015 fiscal year, ethanol sales accounted for approximately 80% of our total revenue, distiller grains sales accounted for approximately 17% of our total revenue, and corn oil sales accounted for approximately 3% of our total revenue. For our 2014 fiscal year, ethanol sales accounted for approximately 81% of our total revenue, distiller grains sales accounted for approximately 16% of our total revenue, and corn oil sales accounted for approximately 3% of our total revenue.
The average price we received per gallon of ethanol we sold was approximately 30% lower for our 2015 fiscal year compared to the same period of 2014. Management attributes this decrease in ethanol prices with decreased corn and gasoline prices which both impact the market price of ethanol. In addition, uncertainty existed throughout our 2015 fiscal year related to whether the EPA would reduce the ethanol use requirement in the Renewable Fuels Standard (RFS) for 2015. The EPA proposed reducing the amount of corn-based ethanol which was required to be used in 2015 to levels which were below the 2014 requirement. Management believes this uncertainty caused fuel blenders to reduce ethanol demand which negatively impacted ethanol prices. In addition, gasoline prices dropped during our 2015 fiscal year which negatively impacted ethanol prices.
Ethanol prices were unusually high during our 2014 fiscal year due to price increases during our first and second quarters of 2014 when the United States was dealing with rail shipping delays due to poor weather conditions and increased rail shipping demand. Due to these rail shipping delays, the supply of ethanol in the market was restricted which led to higher ethanol prices. While the higher ethanol prices improved our profitability during times when these rail shipping delays were occurring, we were forced to reduce our production as we had difficulty shipping our ethanol. Since we have a limited amount of on-site ethanol
19
storage, when that storage was full we were forced to shut down production. These rail shipment delays were reduced during the summer months of 2014 and market ethanol prices started to fall. We have not experienced comparable rail shipping delays during our 2015 fiscal year and management does not expect that they will reoccur during our 2016 fiscal year. However, rail shipping delays may occur again in the future, especially during the winter months if we were to experience unfavorable weather conditions, which could slow rail transportation times.
Throughout our 2015 fiscal year, management believes ethanol prices were negatively impacted by a proposal from the EPA to reduce the amount of renewable fuels which are required to be used in the United States pursuant to the RFS. The EPA is required to annually set the volume of renewable fuels which must be used in the United States. The EPA has the authority to set these renewable volume obligations at a level less than is required by the RFS in certain circumstances. In May 2015, the EPA issued proposed renewable volume obligations for 2014, 2015 and 2016 which were significantly lower than the requirements in the RFS. Management believes that fuel blenders limited the amount of ethanol they used because of the EPA's release which negatively impacted market ethanol prices. In November 2015, the EPA issued its final renewable volume obligations for 2014, 2015 and 2016. While these renewable volume obligations were slightly higher than the proposed renewable volume obligations released in May 2015, they were still lower than the statutory requirement under the RFS. The EPA's final renewable volume obligations are likely to result in legal challenges, potentially by both the ethanol industry and the oil industry. The reduced renewable volume obligations are expected to continue to negativley impact market ethanol prices through 2016 and potentially after that time. The negative impact of the EPA's release could be increased if ethanol exports do not continue at current levels. If ethanol exports are reduced in the future it may lead to excess ethanol supply in the United States which could further negatively impact ethanol prices. Management anticipates that ethanol prices will remain lower during our 2016 fiscal year as a result of lower corn prices, lower oil prices and the reduced renewable volume obligations. However, management anticipates that the lower ethanol prices will continue to result in ethanol exports which may provide support for ethanol prices. Management anticipates that, provided corn prices remain low, operating margins during our 2016 fiscal year should be favorable.
We sold approximately 4% more gallons of ethanol during our 2015 fiscal year, compared to the same period of 2014. This increase in ethanol sales was mainly due to logistics issues during 2014 which required us to reduce or cease operations when we were unable to transport ethanol from our plant, particularly during the end of our first quarter and during our second quarter of our 2014 fiscal year. These logistics issues were reduced during our third and fourth quarters of 2014 which allowed us to increase production. In addition, we had a 1% increase in our corn to ethanol conversion rate which allowed us to produce more gallons of ethanol. Management anticipates that ethanol production will be comparable during our 2016 fiscal year to our 2015 fiscal year.
During our 2015 fiscal year, we experienced combined realized and unrealized losses on our ethanol derivatives of approximately $21,000 which decreased our revenue. By comparison, we experienced combined realized and unrealized losses on our ethanol derivative instruments of approximately $4.0 million during our 2014 fiscal year which decreased our revenue.
The average price per ton we received for our dried distillers grains was approximately 15% less for our 2015 fiscal year compared to the same period of 2014, and the average price per ton we received for our modified/wet distillers grains was approximately 27% less for our 2015 fiscal year compared to the same period of 2014. Management attributes these price decreases with significantly lower corn and soybean prices and increased corn and soybean supplies during the 2015 period. Since distiller grains are primarily used as a feed substitute for corn and soybean meal, when corn and soybean prices decrease and the supply of these competing products increase, it negatively impacts distiller grains demand and prices. In prior years we experienced higher corn prices and reduced corn supplies and as a result, the price of distiller grains relative to the market price of corn reached record highs. However, this trend was no longer in effect starting with the corn harvest in the fall of 2013 and continuing to date. Management anticipates that corn prices and demand will remain relatively low during our 2016 fiscal year due to the size of the 2015 corn harvest and relatively stable corn demand. As a result, management anticipates distiller grains prices will remain lower during our 2016 fiscal year.
Distiller grains prices were negatively impacted during our 2014 and 2015 fiscal year as a result of Chinese trade policies which impacted both corn and distiller grains. The Chinese imposed a virtual ban on distiller grains imports from the United States during the first half of 2014 and significantly reduced corn imports by taking steps to terminate any imports of corn or distiller grains which contain a corn hybrid trait which is not approved in China. This Chinese trade policy hurt distiller grains prices in 2014 as it virtually eliminated the largest export market for distiller grains for six months and it also resulted in increased corn supplies in the United States which increased competition in the feed market. Management believes the impact of the Chinese trade policy continued into our 2015 fiscal year. Management believes that the Chinese trade policy is designed to help Chinese corn producers who experienced an unfavorable corn harvest which resulted in Chinese corn prices which are not competitive with United States corn prices.
20
We sold approximately 3% less total tons of distiller grains during our 2015 fiscal year compared to the same period of 2014 due to increased efficiencies of converting corn into ethanol which leads to less co-products such as distiller grains. We also increased the amount of corn oil we were extracting from our distiller grains during our 2015 fiscal year which reduced the total tons of distiller grains we had available for sale. Management anticipates relatively stable distiller grains production during our 2016 fiscal year as we anticipate a comparable amount of ethanol production during our 2016 fiscal year.
The average price we received for our corn oil was approximately 15% less during our 2015 fiscal year compared to the same period of 2014 due to a decrease in corn and soybean oil prices and an increase in corn oil supplies. Corn oil is used primarily as animal feed, for certain industrial uses and for biodiesel production. Soybean oil prices were lower during 2015 which resulted in biodiesel producers using more soybean oil to produce biodiesel instead of corn oil.
We sold approximately 12% more pounds of corn oil during our 2015 fiscal year compared to the same period of 2014 primarily due to increased total production at the ethanol plant along with an increase in the amount of corn oil we separated from each pound of distiller grains during the 2015 period. The production process used during our 2015 fiscal year was able to extract more corn oil from the corn than during our 2014 fiscal year.
Management attributes the decline in corn oil prices with increased market corn oil supply which was not met by corresponding increases in corn oil demand. Management anticipates continued lower corn oil prices due to higher corn oil supplies and relatively lower corn oil demand. Without a significant increase in biodiesel production, corn oil demand may not increase significantly which could result in continued lower corn oil prices. Several ethanol producers who also produce corn oil are considering building biodiesel production facilities that will be adjacent to their ethanol plants. If this were to occur, it may result in an increase in corn oil demand which could benefit corn oil prices. In addition, if the biodiesel blenders' tax credit is renewed, it will likely lead to additional corn oil demand which could positively impact corn oil prices.
Cost of Goods Sold. Our cost of goods sold was significantly lower for our 2015 fiscal year compared to the same period of 2014 due to significantly lower market corn and natural gas costs. Our average cost per bushel of corn was approximately 15% less during our 2015 fiscal year compared to the same period of 2014. This decrease in our cost per bushel of corn was primarily related to lower market corn prices due to increased market corn supplies and relatively lower corn demand. Corn prices have remained steady following the end of our 2015 fiscal year due to a large corn crop which was harvested in the fall of 2015. Management anticipates that corn supplies will remain favorable during our 2016 fiscal year which should result in relatively stable corn prices and anticipated reduced demand due to the lower renewable volume obligations for corn-based ethanol released by the EPA in November 2015. These lower corn prices could impact the amount of corn which is planted during 2016 which could result in higher corn prices later in our 2016 fiscal year. However, since other commodity prices are lower, the lower corn prices may not significantly impact farmer planting decisions.
We consumed approximately 4% more bushels of corn during our 2015 fiscal year compared to 2014 due primarily to increased ethanol production. We were able to improve our corn conversion efficiency by 1% during our 2015 fiscal year compared to 2014 which allowed us to produce more ethanol per bushel of corn. Management anticipates consistent corn consumption during our 2015 fiscal year compared to our 2014 fiscal year provided that we can maintain positive operating margins that allow us to continue to operate the ethanol plant at capacity.
Our natural gas costs decreased by approximately 40% during our 2015 fiscal year compared to the same period of 2014 primarily due to significantly lower natural gas costs during our first and second quarters of 2015 as compared to the same period of 2014. The average price we paid per MMBtu of natural gas was approximately 40% lower during our 2015 fiscal year compared to the same period of 2014. Management attributes this decrease in natural gas prices with a more ample supply. In addition, during 2014 there was a long and cold winter and an explosion at a Canadian natural gas facility which reduced supply and increased demand for natural gas. Management anticipates that natural gas prices will decrease slightly throughout our 2016 fiscal year. However, if we experience another exceptionally cold and long winter during our 2016 fiscal year, management anticipates a slight increase in natural gas prices that could be as high as those we experienced during our 2014 fiscal year.
Our natural gas consumption during our 2015 fiscal year was approximately the same compared to our 2014 fiscal year. We were able to consume the same amount of natural gas although we produced more gallons of ethanol due to a 5% increase in production efficiency at the plant.
We experienced approximately $329,000 of combined realized and unrealized gains for our 2015 fiscal year related to our corn and natural gas derivative instruments which decreased our cost of goods sold. By comparison, we experienced approximately $4.6 million of combined realized and unrealized gains for our 2014 fiscal year related to our corn and natural gas derivative instruments which decreased our cost of goods sold. We recognize the gains or losses that result from the changes in
21
the value of our derivative instruments from corn and natural gas in cost of goods sold as the changes occur. As corn and natural gas prices fluctuate, the value of our derivative instruments are impacted, which affects our financial performance.
Operating Expenses. Our operating expenses were slightly lower during our 2015 fiscal year compared to the same period of 2014 primarily due to decreases in our administrative wages. We had more accrued bonuses for administrative personnel during our 2014 fiscal year due to our significantly higher net income during the 2014 period compared to the 2015 period. Management anticipates that our operating expenses will be comparable during our 2016 fiscal year to our 2015 fiscal year, however, the impact that our management bonuses have on operating expenses will depend on the amount of net income we generate during the 2016 fiscal year which is difficult to predict with any certainty at this time.
Other Income (Expense). Other income was significantly lower for our 2015 fiscal year compared to the same period of 2014 due to a decrease in our portion of the net income generated by our investments. Our investments are in companies in the ethanol industry. Favorable operating margins during our 2014 fiscal year in the ethanol industry resulted in significant amounts of net income generated by our investments as compared to 2015. We had less interest expense during our 2015 fiscal year compared to the same period of 2014 due to having less borrowings outstanding during the 2015 period. We pay our lender a fee calculated based on the unused portion of our revolving line of credit. When we reduce the amount available on this line of credit, it reduces the fee we pay. In addition, interest expense was offset by increased interest income generated on the cash we had throughout our entire 2015 fiscal year as compared to 2014.
Comparison of the Fiscal Years Ended October 31, 2014 and 2013
The following table shows the results of our operations and the percentage of revenues, cost of goods sold, operating expenses and other items to total revenues in our statement of operations for the fiscal years ended October 31, 2014 and 2013:
2014 | 2013 | ||||||||||
Income Statement Data | Amount | % | Amount | % | |||||||
Revenue | $ | 289,152,549 | 100.0 | $ | 350,721,175 | 100.0 | |||||
Cost of Goods Sold | 225,335,539 | 77.9 | 338,014,664 | 96.4 | |||||||
Gross Profit | 63,817,010 | 22.1 | 12,706,511 | 3.6 | |||||||
Operating Expenses | 3,569,152 | 1.2 | 2,550,236 | 0.7 | |||||||
Operating Income | 60,247,858 | 20.8 | 10,156,275 | 2.9 | |||||||
Other Income | 19,031,679 | 6.6 | 4,026,753 | 1.1 | |||||||
Net Income | $ | 79,279,537 | 27.4 | $ | 14,183,028 | 4.0 | |||||
Revenues. Our total revenue was significantly lower for our 2014 fiscal year compared to the same period of 2013, primarily due to decreased average prices for each of our products. In addition to the decrease in the average prices we received for our products, we produced less of our products during our 2014 fiscal year compared to the same period of 2013. For our 2014 fiscal year, ethanol sales accounted for approximately 81% of our total revenue, distiller grains sales accounted for approximately 16% of our total revenue, and corn oil sales accounted for approximately 3% of our total revenue. For our 2013 fiscal year, ethanol sales accounted for approximately 76% of our total revenue, distiller grains sales accounted for approximately 21% of our total revenue, and corn oil sales accounted for approximately 3% of our total revenue.
The average price we received per gallon of ethanol we sold was approximately 7% lower for our 2014 fiscal year compared to the same period of 2013. Management attributes this decrease in ethanol prices with decreased corn and gasoline prices which both impact the market price of ethanol. In addition, uncertainty existed throughout our 2014 fiscal year related to whether the EPA would reduce the ethanol use requirement in the Renewable Fuels Standard (RFS) for 2014. The EPA proposed reducing the amount of corn-based ethanol which was required to be used in 2014 to levels which were below the 2013 requirement. Management believes this uncertainty caused fuel blenders to reduce ethanol demand which negatively impacted ethanol prices. However, ethanol prices were supported during our 2014 fiscal year as a result of increased ethanol exports and domestic ethanol supply shortages which resulted from slower rail shipments, especially during our second quarter of 2014. Management attributes the increase in ethanol exports to the lower ethanol prices which made United States ethanol more cost competitive in the world market.
We sold approximately 3% fewer gallons of ethanol during our 2014 fiscal year, compared to the same period of 2013. This decrease in ethanol sales was mainly due to logistics issues which required us to reduce or cease operations when we were unable to transport ethanol from our plant, particularly during the end of our first quarter and during our second quarter of our
22
2014 fiscal year. These logistics issues were reduced during our third and fourth quarters of 2014 which allowed us to increase production.
During our 2014 fiscal year, we experienced combined realized and unrealized losses on our ethanol derivatives of approximately $4.0 million which decreased our revenue. By comparison, we experienced combined realized and unrealized losses on our ethanol derivative instruments of approximately $2.0 million during our 2013 fiscal year which decreased our revenue.
The average price per ton we received for our dried distillers grains was approximately 27% less for our 2014 fiscal year compared to the same period of 2013, and the average price per ton we received for our modified/wet distillers grains was approximately 41% less for our 2014 fiscal year compared to the same period of 2013. Management attributes these price decreases with significantly lower corn and soybean prices and increased corn and soybean supplies during the 2014 period.
Distiller grains prices were negatively impacted during our 2014 fiscal year as a result of Chinese trade policies which impacted both corn and distiller grains. The Chinese imposed a virtual ban on distiller grains imports from the United States and significantly reduced corn imports, by taking steps to terminate any imports of corn or distiller grains which contain a corn hybrid trait which is not approved in China. This Chinese trade policy hurt distiller grains prices as it virtually eliminated the largest export market for distiller grains and it also resulted in increased corn supplies in the United States which increased competition in the feed market.
We sold approximately 10% less total tons of distiller grains during our 2014 fiscal year compared to the same period of 2013 due to reduced production at the ethanol plant and increased efficiencies of converting corn into ethanol which leads to less co-products such as distiller grains. Since distiller grains are a co-product of the ethanol production process, when we reduce production of ethanol it has a corresponding impact on distiller grains production.
The average price we received for our corn oil was approximately 12% less during our 2014 fiscal year compared to the same period of 2013 due to an increase in corn oil supplies and relatively lower corn oil demand. We experienced decreased corn oil demand during our 2014 fiscal year as a result of lower biodiesel production. In addition, soybean oil prices were lower during 2014 which resulted in biodiesel producers using soybean oil to produce biodiesel instead of corn oil.
We sold approximately 17% less pounds of corn oil during our 2014 fiscal year compared to the same period of 2013 primarily due to decreased total production at the ethanol plant along with a decrease in the amount of corn oil we separated from each pound of distiller grains during the 2014 period. The corn we used during our 2014 fiscal year did not contain as much corn oil as the corn we used during our 2013 fiscal year. As a result, the amount of corn oil that was available to be removed from the distiller grains we produced was lower during our 2014 fiscal year compared to the same period of 2013.
Cost of Goods Sold. Our cost of goods sold was significantly lower for our 2014 fiscal year compared to the same period of 2013 due to significantly lower market corn prices and decreased corn consumption partially offset by increased natural gas costs. Our average cost per bushel of corn was approximately 37% less during our 2014 fiscal year compared to the same period of 2013. This decrease in our cost per bushel of corn was primarily related to lower market corn prices due to increased market corn supplies and relatively lower corn demand due to reduced corn exports to China and reduced ethanol production.
We consumed approximately 4% fewer bushels of corn during our 2014 fiscal year compared to 2013 due primarily to reduced ethanol production, partially offset by increased ethanol produced per bushel of corn during the 2014 period. We were able to improve our corn conversion efficiency by 1% during our 2014 fiscal year compared to 2013 which allowed us to produce more ethanol per bushel of corn.
Our natural gas costs increased by approximately 37% during our 2014 fiscal year compared to the same period of 2013 primarily due to significantly higher natural gas costs during our first and second quarters of 2014. The average price we paid per MMBtu of natural gas was approximately 46% greater during our 2014 fiscal year compared to the same period of 2013. Management attributes this increase in natural gas prices with a longer and colder winter and an explosion at a Canadian natural gas facility which reduced supply and increased demand for natural gas and in turn increased our natural gas costs during that time period. These higher prices continued after the end of the winter in 2014. Natural gas prices decreased during the summer months of 2014 as natural gas demand is typically lower and market natural gas supplies returned to more normal levels during the summer months of 2014 which also resulted in lower natural gas prices.
Our natural gas consumption during our 2014 fiscal year was approximately 6% lower compared to our 2013 fiscal year. Management attributes this decrease in our natural gas consumption with improved production efficiency at the plant and decreased total production during the 2014 period.
23
We experienced approximately $4.6 million of combined realized and unrealized gains for our 2014 fiscal year related to our corn and natural gas derivative instruments which decreased our cost of goods sold. By comparison, we experienced approximately $48,000 of combined realized and unrealized losses for our 2013 fiscal year related to our corn and natural gas derivative instruments which increased our cost of goods sold. We recognize the gains or losses that result from the changes in the value of our derivative instruments from corn and natural gas in cost of goods sold as the changes occur. As corn and natural gas prices fluctuate, the value of our derivative instruments are impacted, which affects our financial performance.
Operating Expenses. Our operating expenses were significantly higher during our 2014 fiscal year compared to the same period of 2013 primarily due to increases in our bonuses, dues and subscriptions, and an increase in our property taxes. We had more accrued bonuses for administrative personnel due to our significantly increased net income during the 2014 period compared to the 2013 period.
Other Income (Expense). Other income was significantly greater for our 2014 fiscal year compared to the same period of 2013 due to an increase in our portion of the net income generated by our investments. Our investments are in companies involved in the ethanol industry. Favorable operating margins during our 2014 fiscal year in the ethanol industry resulted in a significant increase in the net income generated by our investments. We had significantly less interest expense during our 2014 fiscal year compared to the same period of 2013 due to having less borrowing during the 2014 period. During our 2013 fiscal year we were making debt payments related to our membership unit repurchase which was completed during the first quarter of our 2013 fiscal year.
Changes in Financial Condition for the Fiscal Years Ended October 31, 2015 and 2014
Current Assets. We had approximately $21 million in cash and equivalents at October 31, 2015 compared to more than $47 million in cash and equivalents at October 31, 2014. During our 2014 fiscal year we were able to generate a significant amount of cash from operations that we used at the beginning of our 2015 fiscal year to pay a distribution to our members. In addition, at October 31, 2015 we had more than $13 million in marketable securities associated with short-term investments we purchased during our 2014 and 2015 fiscal years. This compares to approximately $8 million of marketable securities at October 31, 2014. We had less accounts receivable at October 31, 2015 compared to October 31, 2014 due to timing of train shipments and payments received from our marketer. The value of our inventory was higher at October 31, 2015 compared to October 31, 2014 due to more gallons of ethanol in ending inventory.
Property and Equipment. The net value of our property and equipment was higher at October 31, 2015 compared to October 31, 2014 due to approximately $11.0 million of capital expenditures which is offset by depreciation. Plant improvements during our 2015 fiscal year primarily included improvements to our syrup loadout facilities and a water treatment building that is expected to be completed during the second quarter of our 2016 fiscal year.
Other Assets. Our other assets were lower at October 31, 2015 compared to October 31, 2014 due mainly to an increase in the amount of cash received from our investments during the 2015 fiscal year which reduces the asset balance.
Current Liabilities. Our accounts payable balance was higher at October 31, 2015 compared to October 31, 2014 due primarily to an increase in our payables for construction activities at October 31, 2015. Our accrued expenses were lower at October 31, 2015 compared to October 31, 2014 due to lower levels of accrued bonuses for management.
Long-term Liabilities. Our deferred compensation was slightly higher at October 31, 2015 compared to October 31, 2014 due to higher amounts of the 2014 management bonus that has been deferred. We had less deferred revenue at October 31, 2015 compared to October 31, 2014 due to the net effect of continuing amortization of our county economic development grant revenue offset by decreased deferred revenue related to a contractual relationship.
Liquidity and Capital Resources
Based on financial forecasts performed by our management, we anticipate that we will have sufficient cash from our current credit facilities and cash from our operations to continue to operate the ethanol plant at capacity for the next 12 months and beyond. As of October 31, 2015, we had $10 million available pursuant to our revolving term loan. In addition, we had approximately $21 million in cash and equivalents and more than $13 million in short-term marketable securities at October 31, 2015. Following the end of our 2015 fiscal year, we issued a distribution to our members in the amount of $13,911,100 which used cash after the end of our 2015 fiscal year.
24
We do not anticipate securing any additional equity or debt financing for working capital or other purposes in the next 12 months. However, should we experience unfavorable operating conditions in the future, we may have to secure additional sources of capital.
We do not currently anticipate any significant purchases of property and equipment, that would require us to secure additional capital in the next 12 months. However, management continues to evaluate conditions in the ethanol industry and explore opportunities to improve the efficiency and profitability of our operations which may require capital expenditures.
The following table shows our cash flows for the fiscal years ended October 31, 2015 and 2014:
Fiscal Year Ended October 31 | |||||||
2015 | 2014 | ||||||
Net cash provided by operating activities | $ | 50,830,605 | $ | 79,230,916 | |||
Net cash (used in) investing activities | (16,323,193 | ) | (12,143,716 | ) | |||
Net cash (used in) financing activities | (60,867,949 | ) | (19,642,634 | ) | |||
Cash Flow From Operations
Our cash flows from operations for our 2015 fiscal year were lower compared to our 2014 fiscal year due primarily to less net income during the 2015 period. Due to record operating margins during 2014 we generated significantly more cash from our operations compared to our 2015 fiscal year. We also received significantly more cash from our investments during our 2015 fiscal year compared to 2014.
Cash Flow From Investing Activities
We used more cash for investing activities during our 2015 fiscal year compared to the same period of 2014 primarily due to increased capital expenditures. We purchased additional marketable securities with our excess cash during our 2015 fiscal year. Our capital expenditures during our 2015 fiscal year were primarily for plant improvements to the syrup load out system and the water treatment building. During our 2014 fiscal year, we used cash primarily for improvements to our syrup load out system, railroad expansion projects and the rebuild of our thermal oxidizer.
Cash Flow From Financing Activities.
We used significantly more cash for financing activities during our 2015 fiscal year primarily due to larger distributions paid to our members as compared to our 2014 fiscal year. Distributions paid during our 2015 fiscal year were based on the income generated during our 2014 fiscal year. During our 2014 fiscal year we used some cash for repayment on our long-term debt related to our membership unit repurchase during our 2013 fiscal year.
The following table shows our cash flows for the fiscal years ended October 31, 2014 and 2013:
Fiscal Year Ended October 31 | |||||||
2014 | 2013 | ||||||
Net cash provided by operating activities | $ | 79,230,916 | $ | 24,327,715 | |||
Net cash (used in) investing activities | (12,143,716 | ) | (4,867,493 | ) | |||
Net cash (used in) financing activities | (19,642,634 | ) | (19,460,222 | ) | |||
Cash Flow From Operations
Our cash flows from operations for our 2014 fiscal year were higher compared to our 2013 fiscal year due primarily to higher net income during the 2014 period. Due to improved operating margins, we generated significantly more cash from our operations compared to our 2013 fiscal year.
Cash Flow From Investing Activities
We used more cash for investing activities during our 2014 fiscal year compared to the same period of 2013 primarily due to the net effect of having less capital expenditures and more investments during the 2014 period. We purchased marketable
25
securities with our excess cash during our 2014 fiscal year and we made a small investment in a blending terminal during our 2014 fiscal year. Our capital expenditures during our 2014 fiscal year were primarily for plant improvements to the syrup load out system, railroad expansion projects and the rebuild of our thermal oxidizer. During our 2013 fiscal year, we used cash primarily for improvements to our grain handling system and final construction costs on a new corn storage bin.
Cash Flow From Financing Activities.
We used a comparable amount of cash for financing activities during our 2014 fiscal year and our 2013 fiscal year, however, we had significantly different uses for the cash during the two periods. During our 2014 fiscal year, we primarily used cash for distributions to our members. During our 2013 fiscal year we used cash for financing activities related to repurchasing membership units for $17 million, payments on our long-term debt related to our membership unit repurchase and a smaller distribution we paid to our members.
Short-Term and Long-Term Debt Sources
We have a $35 million credit facility with Farm Credit. The amount available for us to borrow reduces by $2.5 million semi-annually. In exchange for this credit facility, we executed a mortgage in favor of Farm Credit covering all of our real property and granted Farm Credit a security interest in all of our equipment and other assets. In the event we default on our loans with Farm Credit, Farm Credit may foreclose on our assets, including both our real property and our machinery and equipment. We increased the amount available to us pursuant to our Farm Credit loans during our 2013 fiscal year in order to complete a repurchase of membership units in exchange for $17 million that closed in December 2012. As of the end of our 2015 fiscal year we had $10 million available to draw from on our line of credit. During our 2015 fiscal year, we reduced the amount available to us pursuant to our line of credit in order to reduce the fees associated with the line of credit. In addition, following the end of our 2015 fiscal year, we executed an amendment to our credit agreements with Farm Credit which adjusted our loan covenants related to issuing distributions to our members and changed the terms of our revolving line of credit. Following the loan amendment, we can distribute up to 100% of our prior year's net income provided we remain in compliance with our loan covenants and we maintain working capital of at least $15 million following the distribution. Pursuant to the amendment, our distributions are not limited by our prior year's net income if we are in compliance with our loan covenants and we maintain working capital of at least $20 million following any distribution we make. In addition, following the effectiveness of the amendment, our $10 million revolving line of credit is available until its maturity date on February 1, 2020.
Variable Line of Credit
We have a long-term revolving line of credit. During our 2015 fiscal year, interest on this loan accrued at 3.15% above the One-Month London Interbank Offered Rate (LIBOR). The interest rate is subject to weekly adjustment. We may elect to enter into a fixed interest rate on this loan at various times throughout the term of the loan as provided in the loan agreements. Prior to the loan amendment discussed above, the maximum principal amount of this long-term revolving line of credit decreased by $2.5 million semi-annually starting on August 1, 2013 and continuing until February 1, 2019, with $5 million available pursuant to this long-term revolving line of credit until it matures on February 1, 2020. Pursuant to the loan amendment discussed above, we will have $10 million available pursuant to this loan until the long-term revolving line of credit matures on February 1, 2020. In the event any amount is outstanding on this loan in excess of the new credit limit after these periodic reductions, we agreed to repay principal on the loan until we reach the new credit limit. We agreed to pay an annual fee of 0.6% of the unused portion of this loan. As of October 31, 2015, we had $0 outstanding on this loan with an accrued interest rate of 3.35% per year. As of October 31, 2015, we had $10 million available to be drawn on this loan.
Administrative Agency Agreement
As part of the Farm Credit loan closing, we entered into an Administrative Agency Agreement with CoBank, ACP ("CoBank"). CoBank purchased a participation interest in the Farm Credit loans and was appointed the administrative agent for the purpose of servicing the loans. As a result, CoBank will act as the agent for Farm Credit with respect to our loans. We agreed to pay CoBank an annual fee of $5,000 as the agent for Farm Credit.
Covenants
Our credit agreements with Farm Credit are subject to numerous covenants requiring us to maintain various financial ratios. As of October 31, 2015, we were in compliance with all of our loan covenants with Farm Credit. Based on current management projections, we anticipate that we will be in compliance with our loan covenants for the next 12 months and beyond.
26
Grants and Government Programs
In December 2006, we received the first payment from our semi-annual economic development grants equal to the amount of the tax assessments imposed on our ethanol plant by Cerro Gordo County, the county in which our ethanol plant is located. Based on our 2009 assessment, the total amount of these grants is expected to be approximately $9 million, which will be paid semi-annually over a 10-year period with the final payment being made in 2019.
Contractual Cash Obligations
In addition to our long-term debt obligations, we have certain other contractual cash obligations and commitments. The following table provides information regarding our consolidated contractual obligations and approximate commitments as of October 31, 2015:
Payment Due By Period | ||||||||||||||||||||
Contractual Cash Obligations | Total | Less than One Year | One to Three Years | Three to Five Years | After Five Years | |||||||||||||||
Operating Lease Obligations | $ | 2,621,000 | $ | 1,502,000 | $ | 1,049,000 | $ | 70,000 | $ | — | ||||||||||
Purchase Obligations | 24,477,000 | 24,477,000 | — | — | — | |||||||||||||||
Total Contractual Cash Obligations | $ | 27,098,000 | $ | 25,979,000 | $ | 1,049,000 | $ | 70,000 | $ | — | ||||||||||
Critical Accounting Policies
Management uses estimates and assumptions in preparing our financial statements in accordance with U.S. generally accepted accounting principles. These estimates and assumptions affect the reported amounts of assets and liabilities, the disclosure of contingent assets and liabilities, and the reported revenues and expenses. Of the significant accounting policies described in the notes to our financial statements, we believe that the following are the most critical:
Revenue Recognition
Revenue from the sale of our products is recognized at the time title to the goods and all risks of ownership transfer to the customers. The time of transfer is defined in the specific sales agreement; however, it generally occurs upon shipment, loading of the goods or when the customer picks up the goods. Collectability of revenue is reasonably assured based on historical evidence of collectability between us and our customers. Interest income is recognized as earned.
Shipping costs incurred by us in the sale of ethanol and corn oil are not specifically identifiable and as a result, revenue from the sale of ethanol and corn oil are recorded based on the net selling price reported to us from our marketer. Shipping costs incurred by us in the sale of distiller grain products are included in cost of goods sold.
Investment in Commodities Contracts, Derivative Instruments and Hedging Activities
We evaluate contracts to determine whether the contracts are derivative instruments. Certain contracts that meet the definition of a derivative may be exempted from derivative accounting and treated as normal purchases or normal sales if documented as such. Normal purchases and normal sales are contracts that provide for the purchase or sale of something other than a financial instrument or derivative instrument that will be delivered in quantities expected to be used or sold over a reasonable period in the normal course of business.
We enter into short-term cash, option and futures contracts as a means of securing corn and natural gas for the ethanol plant and managing exposure to changes in commodity and energy prices. We occasionally also enter into derivative contracts to hedge our exposure to price risk as it relates to ethanol sales. As part of our risk management process, we use futures and option contracts through regulated commodity exchanges or through the over-the-counter market to manage our risk related to pricing of inventories. All of our derivatives, other than those excluded under the normal purchases and sales exclusion, are designated as non-hedge derivatives, with changes in fair value recognized in net income. Although the contracts are economic hedges of specified risks, they are not designated or accounted for as hedging instruments.
Realized and unrealized gains and losses related to derivative contracts related to corn and natural gas are included as a component of cost of goods sold and derivative contracts related to ethanol are included as a component of revenues in the
27
accompanying financial statements. The fair values of contracts are presented on the accompanying balance sheet as derivative instruments.
Investments
We have less than a 20% investment interest in four companies in related industries. These investments are being accounted for by the equity method of accounting under which our share of net income is recognized as income in our income statement and added to the investment account. Distributions or dividends received from the investments are treated as a reduction of the investment account. The investments are evaluated for indications of impairment on a regular basis, a loss would be recognized when the fair value is determined to be less than the carrying value.
Off-Balance Sheet Arrangements.
We currently have no off-balance sheet arrangements.
ITEM 7A. QUANTITATIVE AND QUALITATIVE DISCLOSURES ABOUT MARKET RISK.
We are exposed to the impact of market fluctuations associated with commodity prices as discussed below. We have no exposure to interest rate risk as we had no amount outstanding on our variable interest loan at the end of our 2015 fiscal year and we have no exposure to foreign currency risk as all of our business is conducted in U.S. Dollars. We use derivative financial instruments as part of an overall strategy to manage market risk. We use cash, futures and option contracts to hedge changes to the commodity prices of corn, natural gas and ethanol. We do not enter into these derivative financial instruments for trading or speculative purposes, nor do we designate these contracts as hedges for accounting purposes.
Commodity Price Risk
We seek to minimize the risks from fluctuations in the prices of raw material inputs, such as corn and natural gas, and finished products, such as ethanol and distiller grains, through the use of hedging instruments. In practice, as markets move, we actively manage our risk and adjust hedging strategies as appropriate. Although we believe our hedge positions accomplish an economic hedge against our future purchases and sales, management has chosen not to use hedge accounting, which would match the gain or loss on our hedge positions to the specific commodity purchase being hedged. We are using fair value accounting for our hedge positions, which means as the current market price of our hedge positions changes, the realized or unrealized gains and losses are immediately recognized in our cost of goods sold or as an offset to revenues. The immediate recognition of hedging gains and losses under fair value accounting can cause net income to be volatile from quarter to quarter due to the timing of the change in value of the derivative instruments relative to the cost and use of the commodity being hedged.
As of October 31, 2015, we had price protection in place for approximately 15% of our anticipated corn needs, approximately 18% of our natural gas needs and 0% of our ethanol sales for the next 12 months.
A sensitivity analysis has been prepared to estimate our exposure to ethanol, corn and natural gas price risk. Market risk related to these factors is estimated as the potential change in income resulting from a hypothetical 10% adverse change in the average cost of our corn and natural gas prices and average ethanol price as of October 31, 2015, net of the forward and future contracts used to hedge our market risk for corn and natural gas usage requirements. The volumes are based on our expected use and sale of these commodities for a one year period from October 31, 2015. The results of this analysis, which may differ from actual results, are as follows:
Estimated Volume Requirements for the next 12 months (net of forward and futures contracts) | Unit of Measure | Hypothetical Adverse Change in Price | Approximate Adverse Change to Income | ||||||||
Natural Gas | 2,465,000 | MMBTU | 10% | $ | 609,000 | ||||||
Ethanol | 118,000,000 | Gallons | 10% | 16,968,000 | |||||||
Corn | 34,169,000 | Bushels | 10% | 12,390,000 | |||||||
For comparison purposes, our sensitivity analysis for our 2014 fiscal year is set forth below.
28
Estimated Volume Requirements for the next 12 months (net of forward and futures contracts) | Unit of Measure | Hypothetical Adverse Change in Price | Approximate Adverse Change to Income | ||||||||
Natural Gas | 2,468,000 | MMBTU | 10% | $ | 993,000 | ||||||
Ethanol | 114,665,000 | Gallons | 10% | 18,851,000 | |||||||
Corn | 37,155,160 | Bushels | 10% | 16,304,000 | |||||||
Liability Risk
We participate, along with other plants in the industry, in a group captive insurance company (Captive). The Captive insures losses related to workman's compensation, commercial property and general liability. The Captive reinsures catastrophic losses for all participants, including the Company, in excess of predetermined amounts. Our premiums are accrued by a charge to income for the period to which the premium relates and is remitted by our insurer to the captive reinsurer. These premiums are structured such that we have made a prepaid collateral deposit estimated for losses related to the above coverage. The Captive insurer has estimated and collected an amount in excess of the estimated losses but less than the catastrophic loss limit insured by the Captive. We cannot be assessed over the amount in the collateral fund.
29
ITEM 8. FINANCIAL STATEMENTS AND SUPPLEMENTARY DATA
REPORT OF INDEPENDENT REGISTERED PUBLIC ACCOUNTING FIRM
To the Board of Directors and Members
Golden Grain Energy, LLC
We have audited the accompanying balance sheets of Golden Grain Energy, LLC as of October 31, 2015 and 2014, and the related statements of operations, changes in members’ equity, and cash flows for each of the years in the three year period ended October 31, 2015. These financial statements are the responsibility of the Company's management. Our responsibility is to express an opinion on these financial statements based on our audits.
We conducted our audits in accordance with the standards of the Public Company Accounting Oversight Board (United States). Those standards require that we plan and perform the audit to obtain reasonable assurance about whether the financial statements are free of material misstatement. The Company is not required to have, nor were we engaged to perform, an audit of its internal control over financial reporting. Our audits included consideration of internal control over financial reporting as a basis for designing audit procedures that are appropriate in the circumstances, but not for the purpose of expressing an opinion on the effectiveness of the Company’s internal control over financial reporting. Accordingly, we express no such opinion. An audit also includes examining, on a test basis, evidence supporting the amounts and disclosures in the financial statements, assessing the accounting principles used and significant estimates made by management, as well as evaluating the overall financial statement presentation. We believe that our audits provide a reasonable basis for our opinion.
In our opinion, the financial statements referred to above present fairly, in all material respects, the financial position of Golden Grain Energy, LLC as of October 31, 2015 and 2014, and the results of its operations and its cash flows for each of the years in the three year period ended October 31, 2015, in conformity with U.S. generally accepted accounting principles.

Des Moines, Iowa
December 21, 2015

30
GOLDEN GRAIN ENERGY, LLC
Balance Sheets
ASSETS | October 31, 2015 | October 31, 2014 | ||||||
Current Assets | ||||||||
Cash and equivalents | $ | 21,084,029 | $ | 47,444,566 | ||||
Marketable securities | 13,241,062 | 8,262,637 | ||||||
Accounts receivable | 2,717,592 | 7,586,542 | ||||||
Other receivables | 669,930 | 752,305 | ||||||
Derivative instruments | 879,332 | 385,815 | ||||||
Inventory | 6,866,505 | 4,860,052 | ||||||
Prepaid expenses and other | 1,578,458 | 987,640 | ||||||
Total current assets | 47,036,908 | 70,279,557 | ||||||
Property and Equipment | ||||||||
Land and land improvements | 12,516,479 | 11,666,479 | ||||||
Building and grounds | 25,761,752 | 25,761,752 | ||||||
Grain handling equipment | 15,178,214 | 13,519,305 | ||||||
Office equipment | 217,424 | 197,308 | ||||||
Plant and process equipment | 84,802,333 | 81,520,875 | ||||||
Construction in progress | 5,887,270 | 2,252,148 | ||||||
144,363,472 | 134,917,867 | |||||||
Less accumulated depreciation | 82,232,924 | 75,273,527 | ||||||
Net property and equipment | 62,130,548 | 59,644,340 | ||||||
Other Assets | ||||||||
Investments | 27,334,443 | 36,788,435 | ||||||
Other assets | 1,653,421 | 845,483 | ||||||
Total other assets | 28,987,864 | 37,633,918 | ||||||
Total Assets | $ | 138,155,320 | $ | 167,557,815 | ||||
Notes to Financial Statements are an integral part of this Statement.
31
GOLDEN GRAIN ENERGY, LLC
Balance Sheets
LIABILITIES AND MEMBERS' EQUITY | October 31, 2015 | October 31, 2014 | ||||||
Current Liabilities | ||||||||
Current portion long-term debt | $ | — | $ | 13,114 | ||||
Accounts payable | 6,324,850 | 5,575,194 | ||||||
Accrued expenses | 1,679,336 | 1,908,324 | ||||||
Other current liabilities | 110,392 | 295,340 | ||||||
Total current liabilities | 8,114,578 | 7,791,972 | ||||||
Long-term Liabilities | ||||||||
Deferred compensation | 278,798 | 235,421 | ||||||
Other long-term liabilities | 198,164 | 306,861 | ||||||
Total long-term liabilities | 476,962 | 542,282 | ||||||
Commitments and Contingencies | ||||||||
Members' Equity (19,873,000 units issued and outstanding) | 129,563,780 | 159,223,561 | ||||||
Total Liabilities and Members’ Equity | $ | 138,155,320 | $ | 167,557,815 | ||||
Notes to Financial Statements are an integral part of this Statement.
32
GOLDEN GRAIN ENERGY, LLC
Statements of Operations
Year Ended | Year Ended | Year Ended | |||||||||
October 31, 2015 | October 31, 2014 | October 31, 2013 | |||||||||
Revenues | $ | 221,149,134 | $ | 289,152,549 | $ | 350,721,175 | |||||
Cost of Goods Sold | 194,216,462 | 225,335,539 | 338,014,664 | ||||||||
Gross Profit | 26,932,672 | 63,817,010 | 12,706,511 | ||||||||
Operating Expenses | 3,407,954 | 3,569,152 | 2,550,236 | ||||||||
Operating Income | 23,524,718 | 60,247,858 | 10,156,275 | ||||||||
Other Income (Expense) | |||||||||||
Other income (expense) | 605,063 | 913,661 | (527,893 | ) | |||||||
Interest expense | (93,490 | ) | (196,236 | ) | (500,872 | ) | |||||
Equity in net income of investments | 7,910,228 | 18,314,254 | 5,055,518 | ||||||||
Total Other Income (Expense) | 8,421,801 | 19,031,679 | 4,026,753 | ||||||||
Net Income | $ | 31,946,519 | $ | 79,279,537 | $ | 14,183,028 | |||||
Basic & diluted net income per unit | $ | 1.61 | $ | 3.99 | $ | 0.69 | |||||
Weighted average units outstanding for the calculation of basic & diluted net income per unit | 19,873,000 | 19,881,333 | 20,645,833 | ||||||||
Distributions Per Unit | $ | 3.10 | $ | 0.90 | $ | 0.10 | |||||
Notes to Financial Statements are an integral part of this Statement.
33
GOLDEN GRAIN ENERGY, LLC
Statements of Cash Flows
Year Ended | Year Ended | Year Ended | |||||||||
October 31, 2015 | October 31, 2014 | October 31, 2013 | |||||||||
Cash Flows from Operating Activities | |||||||||||
Net income | $ | 31,946,519 | $ | 79,279,537 | $ | 14,183,028 | |||||
Adjustments to reconcile net income to net cash provided by operating activities: | |||||||||||
Depreciation and amortization | 8,130,043 | 9,610,066 | 9,610,490 | ||||||||
Unrealized (gain) loss on risk management & marketable securities | (621,942 | ) | 27,179 | (260,985 | ) | ||||||
Amortization of deferred revenue | (293,645 | ) | (452,054 | ) | (512,930 | ) | |||||
Change in accretion amounts of interest on grant receivable | (45,275 | ) | (58,167 | ) | (5,856 | ) | |||||
Distributions (earnings) in excess of earnings (distributions) from investments | 9,453,992 | (8,163,778 | ) | (4,457,139 | ) | ||||||
Deferred compensation expense | 169,391 | 38,299 | 15,531 | ||||||||
Change in assets and liabilities | |||||||||||
Accounts receivable | 4,868,950 | (3,288,622 | ) | 2,435,791 | |||||||
Inventory | (2,006,453 | ) | 2,114,262 | 2,919,644 | |||||||
Prepaid expenses and other | (769,429 | ) | 363,590 | 69,515 | |||||||
Accounts payable | 353,456 | (1,013,101 | ) | 208,664 | |||||||
Accrued expenses | (228,988 | ) | 773,705 | 189,853 | |||||||
Deferred compensation payable | (126,014 | ) | — | (67,891 | ) | ||||||
Net cash provided by operating activities | 50,830,605 | 79,230,916 | 24,327,715 | ||||||||
Cash Flows from Investing Activities | |||||||||||
Capital expenditures | (10,966,921 | ) | (3,578,716 | ) | (4,867,493 | ) | |||||
Purchase of marketable securities | (10,500,000 | ) | (28,000,000 | ) | — | ||||||
Proceeds from sale of marketable securities | 5,650,000 | 20,000,000 | — | ||||||||
Advances on note receivable | (506,272 | ) | (20,000 | ) | — | ||||||
Purchase of investments | — | (545,000 | ) | — | |||||||
Net cash (used in) investing activities | (16,323,193 | ) | (12,143,716 | ) | (4,867,493 | ) | |||||
Cash Flows from Financing Activities | |||||||||||
Increase (decrease) in outstanding checks in excess of bank balance | — | (563,531 | ) | 203,193 | |||||||
Proceeds from long-term debt | — | — | 17,000,000 | ||||||||
Payments for long-term debt | (13,114 | ) | (1,608,089 | ) | (18,155,995 | ) | |||||
Payments for debt issuance | — | — | (22,500 | ) | |||||||
Redemption of membership units | — | (50,000 | ) | (17,000,000 | ) | ||||||
Distributions to members | (61,606,300 | ) | (17,894,700 | ) | (1,988,300 | ) | |||||
Payment received on deferred contract | — | — | 251,328 | ||||||||
Payments received on grant receivable | 751,465 | 473,686 | 252,052 | ||||||||
Net cash (used in) financing activities | (60,867,949 | ) | (19,642,634 | ) | (19,460,222 | ) | |||||
Net Increase (Decrease) in Cash and Equivalents | (26,360,537 | ) | 47,444,566 | — | |||||||
Cash and Equivalents – Beginning of Period | 47,444,566 | — | — | ||||||||
Cash and Equivalents – End of Period | $ | 21,084,029 | $ | 47,444,566 | $ | — | |||||
Supplemental Cash Flow Information | |||||||||||
Interest paid net of capitalized interest (2015 $0; 2014 $0; 2013 $50,878) | $ | 134,177 | $ | 213,765 | $ | 556,855 | |||||
Supplemental Disclosure of Noncash Operating, Investing & Financing Activities | |||||||||||
Accounts Payable related to construction in process | $ | 396,200 | $ | — | $ | — | |||||
Notes to Financial Statements are an integral part of this Statement.
34
GOLDEN GRAIN ENERGY, LLC
Statements of Changes in Members' Equity
For the years ended October 31, 2015, 2014 and 2013
Balance - October 31, 2012 | $ | 102,693,996 | |
Redemption of 4,577,000 membership units | (17,000,000 | ) | |
Distribution for 19,883,000 Class A and Class B units, August 2013, $0.10 per unit | (1,988,300 | ) | |
Net Income | 14,183,028 | ||
Balance - October 31, 2013 | 97,888,724 | ||
Redemption of 10,000 membership units | (50,000 | ) | |
Distribution for 19,883,000 Class A and Class B units, March & May 2014, $0.90 per unit | (17,894,700 | ) | |
Net Income | 79,279,537 | ||
Balance - October 31, 2014 | 159,223,561 | ||
Distribution for 19,873,000 Class A and Class B units, Dec 2014 & June 2015, $3.10 per unit | (61,606,300 | ) | |
Net Income | 31,946,519 | ||
Balance - October 31, 2015 | $ | 129,563,780 | |
Notes to Financial Statements are an integral part of this Statement.
35
1. SUMMARY OF SIGNIFICANT ACCOUNTING POLICIES
Nature of Business
Golden Grain Energy, LLC (Golden Grain Energy) is approximately a 110 million gallon annual production ethanol plant near Mason City, Iowa. The Company sells its production of ethanol, distiller grains with solubles and corn oil primarily in the continental United States. The Company also holds several investments in various companies that focus on ethanol production, marketing and/or logistics.
Organization
Golden Grain Energy is organized as an Iowa limited liability company. The members' liability is limited as specified in Golden Grain Energy's operating agreement and pursuant to the Iowa Revised Uniform Limited Liability Company Act.
Accounting Estimates
Management uses estimates and assumptions in preparing these financial statements in accordance with generally accepted accounting principles. Those estimates and assumptions affect the reported amounts of assets and liabilities, the disclosure of contingent assets and liabilities, and the reported revenues and expenses. Actual results could differ from those estimates.
Cash and Equivalents
The Company's cash balances are maintained in bank depositories and periodically exceed federally insured limits during the period. The Company has not experienced any losses in connection with these balances. Also included in cash and equivalents are highly liquid investments that are readily convertible into known amounts of cash which are subject to an insignificant risk of change in value due to interest rate, quoted price or penalty on withdrawal and have a maturity of three months or less.
Marketable Securities
The Company determines the appropriate classification of its investments in debt and equity securities at the time of purchase and reevaluates such determinations at each balance sheet date. Debt securities are classified as held to maturity when the Company has the positive intent and ability to hold the securities to maturity. Held-to-maturity securities are recorded as either short term or long term on the Balance Sheet, based on contractual maturity date and are stated at amortized cost. Marketable securities that are bought and held principally for the purpose of selling them in the near term are classified as trading securities and are reported at fair value, with unrealized gains and losses recognized in earnings.
Marketable securities consist of certificates of deposits with original maturities of greater than three months and mutual funds. Certificates of deposit are considered held to maturity securities, which are measured at cost. Mutual funds are considered trading securities which are measured at fair value using prices obtained from pricing services. Any unrealized or realized gains and losses on the trading securities are recorded as part of other income (expense).
At October 31, 2015, marketable securities consisted of mutual funds invested in intermediate-term municipal and government bonds with an approximate cost and fair market value of $6,257,000 and $6,241,000, respectively, and certificates of deposit all with maturities of less than one year and an approximate value of $7,000,000. At October 31, 2014, marketable securities consisted of mutual funds invested in intermediate-term municipal and government bonds with an approximate cost and fair market value of $5,211,000 and $5,263,000, respectively, and certificates of deposit all with maturities of less than one year and an approximate value of $3,000,000. For the years ended October 31, 2015, 2014 and 2013, there was no other-than-temporary impairment recognized. For the years ended October 31, 2015, 2014 and 2013 the Company recorded interest, dividends, and net realized and unrealized gain and losses of approximately $128,000, $263,000 and none, respectively from these investments as part of other income (expense).
Receivables
Credit sales are made primarily to one customer and no collateral is required. The Company carries these accounts receivable at original invoice amount with no allowance for doubtful accounts due to the historical collection rates on these accounts.
Investments
The Company has less than a 20% investment interest in five companies in related industries. These investments are being accounted for by the equity method of accounting under which the Company's share of net income is recognized as income in the Company's income statement and added to the investment account. Distributions or dividends received from the investments are
36
treated as a reduction of the investment account. The investments are evaluated for indications of impairment on a regular basis. A loss would be recognized when the fair value is determined to be less than the carrying value.
The fiscal years of Lawrenceville Tank, LLC, Renewable Products Marketing Group, LLC (RPMG) and Guardian Energy Janesville, LLC end on September 30 and the fiscal years of Absolute Energy, LLC and Homeland Energy Solutions, LLC end on December 31. The Company consistently follows the practice of recognizing the net income based on the most recent reliable data. Therefore, the net income which is reported in the Company's income statement for the year ended October 31, 2015 for all companies is based on the investee's results for the twelve month period ended September 30, 2015.
Note Receivable
The Company has a note receivable from an unrelated party. The Company carries the note at original face value plus accrued interest which is equal to 6% as of October 31, 2015 and is compounded monthly. The note commenced in December 2014 with a face value of $500,000 and has a maturity of 5 years. Annual payments are to begin in September 2016. Balance of the note receivable, including accrued interest, as of October 31, 2015 and 2014 was approximately $526,000 and none, respectively.
Revenue and Cost Recognition
Revenue from the sale of the Company's products is recognized at the time title to the goods and all risks of ownership transfer to the customers. This generally occurs upon shipment, loading of the goods or when the customer picks up the goods. Collectability of revenue is reasonably assured based on historical evidence of collectability between the Company and its customer. Interest income is recognized as earned.
Shipping costs incurred by the Company in the sale of ethanol, distiller grains and corn oil are not specifically identifiable and as a result, revenue from the sale of ethanol, distiller grains and corn oil are recorded based on the net selling price reported to the Company from its marketer. Railcar lease costs incurred by the Company in the sale and shipment of distiller grain products are included in cost of goods sold.
Inventory
Inventories are generally valued at the lower of weighted average cost or market. In the valuation of inventories and purchase commitments, market is based on current replacement values except that it does not exceed net realizable values and is not less than net realizable values reduced by allowances for approximate normal profit margin.
Property & Equipment
Significant additions, betterments and costs to acquire land options are capitalized, while expenditures for maintenance and repairs are charged to operations when incurred. Property and equipment are stated at costs. The Company uses the straight-line method of computing depreciation over the estimated useful lives between 3 and 40 years.
The Company reviews its property and equipment for impairment whenever events indicate that the carrying amount of the asset group may not be recoverable. If circumstances require an asset group to be tested for possible impairment, the Company first compares undiscounted cash flows expected to be generated by an asset group to the carrying value of the asset group. If the carrying value of the asset group is not recoverable on an undiscounted cash flow basis, an impairment is recognized to the extent that the carrying value exceeds its fair value. Fair value is determined through various valuation techniques including discounted cash flow models, quoted market values and third-party independent appraisals, as considered necessary.
Income Taxes
The Company was formed under sections of the federal and state income tax laws which provide that, in lieu of corporate income taxes, the members separately account for their pro rata share of the Company’s items of income, deductions, losses and credits. As a result of this election, no income taxes have been recognized in the accompanying financial statements.
Investment in commodities contracts, derivative instruments and hedging activities
The Company evaluates its contracts to determine whether the contracts are derivative instruments. Certain contracts that meet the definition of a derivative may be exempted from derivative accounting and treated as normal purchases or normal sales if documented as such. Normal purchases and normal sales are contracts that provide for the purchase or sale of something other than a financial instrument or derivative instrument that will be delivered in quantities expected to be used or sold over a reasonable period in the normal course of business.
37
The Company enters into short-term cash, option and futures contracts as a means of securing corn and natural gas for the ethanol plant and managing exposure to changes in commodity and energy prices. The Company occasionally also enters into derivative contracts to hedge our exposure to price risk as it relates to ethanol sales. As part of its risk management process, the Company uses futures and option contracts through regulated commodity exchanges or through the over-the-counter market to manage its risk related to commodity prices. All of the Company's derivatives, other than those excluded under the normal purchases and sales exclusion, are designated as non-hedge derivatives, with changes in fair value recognized in net income. Although the contracts are economic hedges of specified risks, they are not designated or accounted for as hedging instruments.
Realized and unrealized gains and losses related to derivative contracts related to corn and natural gas are included as a component of cost of goods sold and derivative contracts related to ethanol are included as a component of revenues in the accompanying financial statements. The fair values of all contracts with the same counter party are presented net on the accompanying balance sheet as derivative instruments net of cash due from/to broker.
Net income per unit
Basic and diluted earnings per unit are computed using the weighted-average number of Class A and B units outstanding during the period.
Environmental liabilities
The Company's operations are subject to environmental laws and regulations adopted by various governmental authorities in the jurisdiction in which it operates. These laws require the Company to investigate and remediate the effects of the release or disposal of materials at its locations. Accordingly, the Company has adopted policies, practices and procedures in the areas of pollution control, occupational health and the production, handling, storage and use of hazardous materials to prevent material environmental or other damage, and to limit the financial liability which could result from such events. Environmental liabilities are recorded when the Company's liability is probable and the costs can be reasonably estimated. No expense or liability has been recorded as of October 31, 2015, 2014 or 2013 for environmental liabilities.
Incentive Compensation Plan
The Company has an incentive compensation plan for certain employees equal to 1% of net income. Awards pursuant to the incentive compensation plan are paid in cash after the Company's net income is determined for each fiscal year. Awards made pursuant to the plan are immediately vested and paid.
Fair Value
Financial instruments include cash and equivalents, certificates of deposit, marketable securities, receivables, accounts payable, accrued expenses, long-term debt and derivative instruments. The fair value of marketable securities and derivative financial instruments is based on quoted market prices (see Note 8). The fair value of the long-term debt is estimated based on level 3 inputs based on the current anticipated interest rate which management believes would currently be available to the Company for similar issues of debt, taking into account the current credit risk of the Company and the other market factors. The fair value of other current financial instruments is estimated to approximate carrying value due to the short-term nature of these instruments (Level 3).
Risks and Uncertainties
The Company has certain risks and uncertainties that it will experience during volatile market conditions, which can have a severe impact on operations. The Company's revenues are derived from the sale and distribution of ethanol and distiller grains to customers primarily located in the United States. Corn for the production process is supplied to the plant primarily from local agricultural producers and from purchases on the open market. For the 2015 fiscal year, ethanol sales accounted for approximately 80% of total revenue, distiller grains sales accounted for approximately 17% of total revenue and corn oil sales accounted for approximately 3% of total revenue while corn costs averaged approximately 77% of cost of goods sold.
The Company's operating and financial performance is largely driven by the prices at which ethanol is sold and the net expense of corn. The price of ethanol is influenced by factors such as supply and demand, weather, government policies and programs, and unleaded gasoline and the petroleum markets with ethanol selling, in general, for less than gasoline at the wholesale level. Excess ethanol supply in the market, in particular, puts downward pressure on the price of ethanol. The Company's largest cost of production is corn. The cost of corn is generally impacted by factors such as supply and demand, weather, government policies and programs. The Company's risk management program is used to protect against the price volatility of these commodities.
38
Reclassification
Certain items in the prior years balance sheet and cash flow statements for the years ended October 31, 2013 and 2014 have been reclassified to conform to the 2015 classifications. The changes do not affect net liabilities or net cash flow but were changed to agree with the classifications used in the October 31, 2015 financial statements.
2. INVENTORY
Inventory consisted of the following as of October 31, 2015 and October 31, 2014:
October 31, 2015 | October 31, 2014 | |||||||
Raw Materials | $ | 4,032,244 | $ | 3,150,725 | ||||
Work in Process | 1,208,661 | 1,193,582 | ||||||
Finished Goods | 1,625,600 | 515,745 | ||||||
Totals | $ | 6,866,505 | $ | 4,860,052 | ||||
3. BANK FINANCING
The Company has entered into a master loan agreement with Farm Credit Services of America (FLCA) which include revolving term loans with original maximum borrowings of $30,000,000 and $5,000,000 and mature on February 1, 2019 and February 1, 2020, respectively. Interest on the term loan is payable monthly at 3.15% above the one-month LIBOR (3.35% as of October 31, 2015). The borrowings are secured by substantially all the assets of the Company. The revolving term loan maximum borrowings are reduced by $2,500,000 on a semi-annual basis starting in August 2013. The agreement allows for additional reductions in the maximum borrowings at the Company's request.
In addition, the Company is subject to certain financial covenants including but not limited to minimum working capital and net worth requirements and limitations on distributions. Failure to comply with the protective loan covenants or maintain the required financial ratios may cause acceleration of the outstanding principal balances on the loans and/or imposition of fees or penalties. As of October 31, 2015, the Company had no outstanding borrowings and $10 million available to borrow under the credit agreement. As of October 31, 2014 the Company had no borrowings outstanding.
The Company had other notes payable of approximately $0 and $13,000 outstanding as of October 31, 2015 and October 31, 2014, respectively.
4. RELATED PARTY TRANSACTIONS
The Company purchased corn and materials from members of its Board of Directors or Risk Management Committee that own or manage elevators. The Company also purchased ingredients from RPMG. Purchases during the fiscal years ended October 31, 2015, 2014 and 2013 totaled approximately $78,605,000, $66,507,000 and $65,573,000, respectively. As of October 31, 2015 and 2014 the amount we owed to related parties was approximately $666,000 and $456,000, respectively (See Note 6).
Previously, the Company had a management services agreement with Homeland Energy Solutions, LLC to share the compensation costs associated with each management position covered under the agreement partially in an effort to reduce the costs of administrative overhead. This agreement was terminated on May 16, 2014. The Company recorded a reduction in expenses related to these shared costs during the fiscal years ended October 31, 2015, 2014 and 2013 of approximately $0, $118,000 and $169,000, respectively.
5. EMPLOYEE BENEFIT PLANS
The Company had a deferred phantom unit compensation plan for certain employees equal to 1% of net income for its fiscal years ended October 31, 2014 and 2013. Currently, the Company has a cash bonus compensation plan which is paid shortly after the fiscal year in which the cash bonus is earned. During the fiscal years ended October 31, 2015, 2014 and 2013 the Company recorded compensation expense related to the prior deferred phantom unit compensation plan of approximately $38,000, $38,000
39
and $16,000, respectively. As of October 31, 2015 and 2014, the Company had a liability of approximately $279,000 and $361,000 outstanding as deferred compensation, respectively and has approximately $112,000 to be recognized as future compensation expense which will continue to vest over an approximate 3 year period.
The Company has adopted a Simple IRA Adoption Agreement which provides retirement savings options for all eligible employees. Employees meeting certain eligibility requirements can participate in the plan. The Company makes a matching contribution based on the participants' eligible wages. The Company made matching contributions of approximately $95,000, $93,000 and $89,000 during the years ended October 31, 2015, 2014 and 2013, respectively
6. COMMITMENTS, CONTINGENCIES AND AGREEMENTS
Ethanol, Distiller Grains and Corn Oil marketing agreements and major customers
The Company has entered into marketing agreements with RPMG, a marketing company, for the exclusive rights to market, sell and distribute the entire ethanol, distiller grains and corn oil inventory produced by the Company. The marketing fees are presented net in revenues.
Approximate sales and marketing fees related to the agreements in place are as follows:
2015 | 2014 | 2013 | |||||||||
Sales ethanol, distiller grains & corn oil | $ | 221,610,000 | $ | 293,550,000 | $ | 353,289,000 | |||||
Marketing fees | 440,000 | 430,000 | 584,000 | ||||||||
As of | October 31, 2015 | October 31, 2014 | |||||||||
Amount due from RPMG | $ | 2,717,000 | $ | 7,587,000 | |||||||
40
7. RISK MANAGEMENT
The Company's activities expose it to a variety of market risks, including the effects of changes in commodity prices. These financial exposures are monitored and managed by the Company as an integral part of its overall risk-management program. The Company's risk management program focuses on the unpredictability of financial and commodities markets and seeks to reduce the potentially adverse effects that the volatility of these markets may have on its operating results.
To reduce price risk caused by market fluctuations, the Company generally follows a policy of using exchange traded futures contracts to reduce its net position of merchandisable agricultural commodity inventories and forward cash purchase and sales contracts and uses exchange traded futures contracts to reduce price risk. Exchange-traded futures contracts are valued at market price. Changes in market price of contracts related to corn and natural gas are recorded in cost of goods sold and changes in market prices of contracts related to sale of ethanol are recorded in revenues.
The following table represents the approximate amount of realized and unrealized gains (losses) and changes in fair value recognized in earnings on commodity contracts for periods ended October 31, 2015, 2014 and 2013 and the fair value of derivatives as of October 31, 2015 and 2014:
Income Statement Classification | Realized Gain (Loss) | Change in Unrealized Gain (Loss) | Total Gain (Loss) | |||||||||||
Derivatives not designated as hedging instruments: | ||||||||||||||
Commodity Contracts for the | Revenue | $ | 64,000 | $ | (85,000 | ) | $ | (21,000 | ) | |||||
fiscal year 2015 | Cost of Goods Sold | 346,000 | (17,000 | ) | 329,000 | |||||||||
Total | $ | 410,000 | $ | (102,000 | ) | $ | 308,000 | |||||||
Commodity Contracts for the | Revenue | $ | (2,736,000 | ) | $ | (1,232,000 | ) | $ | (3,968,000 | ) | ||||
fiscal year 2014 | Cost of Goods Sold | 3,108,000 | 1,518,000 | 4,626,000 | ||||||||||
Total | $ | 372,000 | $ | 286,000 | $ | 658,000 | ||||||||
Commodity Contracts for the | Revenue | $ | (3,388,000 | ) | $ | 1,405,000 | $ | (1,983,000 | ) | |||||
fiscal year 2013 | Cost of Goods Sold | 1,222,000 | (1,270,000 | ) | (48,000 | ) | ||||||||
Total | $ | (2,166,000 | ) | $ | 135,000 | $ | (2,031,000 | ) | ||||||
Balance Sheet Classification | October 31, 2015 | October 31, 2014 | ||||||||
Futures and option contracts | ||||||||||
In gain position | $ | 58,000 | $ | 648,000 | ||||||
In loss position | (237,000 | ) | (726,000 | ) | ||||||
Cash held by broker | 1,058,000 | 464,000 | ||||||||
Current Asset | $ | 879,000 | $ | 386,000 | ||||||
As of October 31, 2015, the Company had the following approximate outstanding purchase and sale commitments, of which approximately $17,174,000 were with related parties.
41
Commitments Through | Amount | |||||
Sale commitments | ||||||
Distiller grains - fixed price | November 2015 | $ | 2,496,000 | |||
Corn Oil - fixed price | November 2015 | 731,000 | ||||
Purchase commitments | ||||||
Corn - fixed price | October 2016 | $ | 7,162,000 | |||
Corn - basis contract | May 2016 | 16,312,000 | ||||
Natural gas - fixed price | March 2016 | 1,003,000 | ||||
As of October 31, 2015, the Company has fixed price futures and forward contracts in place for approximately 15% of anticipated corn needs and 18% of natural gas needs for the next 12 months with no open positions beyond that point.
8. FAIR VALUE MEASUREMENTS
Financial assets and liabilities carried at fair value are classified and disclosed in one of the following three categories:
Level 1: Valuations for assets and liabilities traded in active markets from readily available pricing sources for market transactions involving identical assets or liabilities.
Level 2: Valuations for assets and liabilities traded in less active dealer or broker markets. Valuations are obtained from third-party pricing services for identical or similar assets or liabilities.
Level 3: Valuations incorporate certain assumptions and projections in determining the fair value assigned to such assets or liabilities.
A description of the valuation methodologies used for instruments measured at fair value, including the general classification of such instruments pursuant to the valuation hierarchy, is set forth below.
Marketable Securities: The Company's short-term investments are classified within Level 1 and are comprised of short-term liquid investments (e.g. mutual funds), classified as trading securities, which are carried at fair value based on the quoted market prices.
Derivative financial instruments: Commodity futures and exchange-traded commodity options contracts are reported at fair value utilizing Level 1 inputs. For these contracts, the Company obtains fair value measurements from an independent pricing service. The fair value measurements consider observable data that may include dealer quotes and live trading levels from markets such as the CME and NYMEX. Crush swaps are bundled contracts or combined contracts that include a portion of corn, ethanol and natural gas rolled into a single trading instrument. These contracts are reported at fair value utilizing Level 2 inputs and are based on the various trading activity of the components of each segment of the bundled contract.
The following table summarizes financial assets and financial liabilities measured at the approximate fair value on a recurring basis, segregated by the level of the valuation inputs within the fair value hierarchy utilized to measure fair value:
42
Total | Level 1 | Level 2 | Level 3 | |||||||||||||
Marketable securities | ||||||||||||||||
Assets, October 31, 2015 | $ | 6,241,000 | $ | 6,241,000 | $ | — | $ | — | ||||||||
Assets, October 31, 2014 | 5,263,000 | 5,263,000 | — | — | ||||||||||||
Derivative financial instruments | ||||||||||||||||
October 31, 2015 | ||||||||||||||||
Assets | $ | 58,000 | $ | 33,000 | $ | 25,000 | $ | — | ||||||||
Liabilities | (237,000 | ) | (85,000 | ) | (152,000 | ) | — | |||||||||
October 31, 2014 | ||||||||||||||||
Assets | $ | 648,000 | $ | 447,000 | $ | 201,000 | $ | — | ||||||||
Liabilities | (726,000 | ) | (610,000 | ) | (116,000 | ) | — | |||||||||
9. INVESTMENTS
Condensed, combined unaudited financial information of the Company’s investment in Absolute Energy, Homeland Energy Solutions, Guardian Energy, Lawrenceville Tank and RPMG is as follows (in 000’s).
Balance Sheet | 9/30/2015 | 9/30/2014 | 9/30/2013 | |||||||||
Current Assets | $ | 285,879 | $ | 320,903 | $ | 241,993 | ||||||
Other Assets | 256,144 | 267,563 | 288,159 | |||||||||
Current Liabilities | 142,927 | 140,262 | 164,813 | |||||||||
Long-term Debt | 49,241 | 17,007 | 32,597 | |||||||||
Members’ Equity | 349,855 | 431,197 | 332,744 | |||||||||
Twelve Months Ended | ||||||||||||
Income Statement | 9/30/2015 | 9/30/2014 | 9/30/2013 | |||||||||
Revenue | $ | 784,304 | $ | 988,226 | $ | 1,140,309 | ||||||
Gross Profit | 112,252 | 220,216 | 68,152 | |||||||||
Net Income | 93,576 | 209,768 | 59,556 | |||||||||
The following table (in 000's) shows the condensed financial information of Guardian Energy, which represents greater than 10% of the Company's net income for the year ended October 31, 2015.
Guardian Energy Condensed Financial Information | ||||||||||||
Balance Sheet | 9/30/2015 | 9/30/2014 | 9/30/2013 | |||||||||
Current Assets | $ | 23,053 | $ | 68,726 | $ | 42,981 | ||||||
Other Assets | 47,653 | 56,576 | 65,556 | |||||||||
Current Liabilities | 7,918 | 22,193 | 18,958 | |||||||||
Long-term Debt | 49,000 | 16,788 | 24,080 | |||||||||
Members’ Equity | 13,788 | 86,321 | 65,499 | |||||||||
Twelve Months Ended | ||||||||||||
Income Statement | 9/30/2015 | 9/30/2014 | 9/30/2013 | |||||||||
Revenue | $ | 234,332 | $ | 307,980 | $ | 361,132 | ||||||
Gross Profit | 37,410 | 74,928 | 27,055 | |||||||||
Net Income | 22,467 | 70,822 | 22,762 | |||||||||
43
The following table (in 000's) shows the condensed financial information of Homeland Energy Solutions. The Company's equitable portion of assets of Homeland Energy Solutions is greater than than 10% of the Company's assets for the year ended October 31, 2015.
Homeland Energy Solutions Condensed Financial Information | ||||||||||||
Balance Sheet | 9/30/2015 | 9/30/2014 | 9/30/2013 | |||||||||
Current Assets | $ | 80,156 | $ | 72,353 | $ | 31,975 | ||||||
Other Assets | 109,910 | 111,560 | 119,869 | |||||||||
Current Liabilities | 36,118 | 35,472 | 36,790 | |||||||||
Long-term Debt | 241 | 203 | 102 | |||||||||
Members’ Equity | 153,707 | 148,238 | 114,952 | |||||||||
Twelve Months Ended | ||||||||||||
Income Statement | 9/30/2015 | 9/30/2014 | 9/30/2013 | |||||||||
Revenue | $ | 279,373 | $ | 344,439 | $ | 397,513 | ||||||
Gross Profit | 35,242 | 72,946 | 18,070 | |||||||||
Net Income | 32,078 | 68,743 | 15,674 | |||||||||
The Company recorded equity in net income of approximately $2,445,000 from Absolute Energy, $2,360,000 from Guardian Energy, $2,566,000 from Homeland Energy Solutions and $539,000 from our other investments for a total of approximately $7,910,000 for the fiscal year ended October 31, 2015. Income for the fiscal years ended October 31, 2014 and 2013 totaled approximately $18,314,000 and $5,056,000, respectively. The Company has undistributed net earnings of investees of approximately $13,931,000 and $23,342,000 as of October 31, 2015 and 2014, respectively.
10. MEMBERS’ EQUITY
The Company repurchased 10,000 of Class A units during 2014 for purchase price of $50,000 and 4,577,000 of Class A units during 2013 for a purchase price of $17.0 million. The total number of Class A and B units outstanding as of October 31, 2015 and 2014 was 19,873,000. Allocations of profits, losses and distributions as well as voting rights are identical for both Class A and B units except for in the case of disposition of properties in dissolution. In such case, Class B units have preferential treatment in the allocation of any remaining gain.
11. LEASE OBLIGATIONS
The Company has four leases for equipment with original terms of 5 to 10 years which extend through June 2020. The Company is obligated to pay costs of insurance, taxes, repairs and maintenance pursuant to the terms of the lease. Rent expense for operating leases for the year ending October 31, 2015, 2014 and 2013 was approximately $1,686,000, $1,913,000 and $1,732,000, respectively.
At October 31, 2015, the Company had the following approximate minimum rental commitments under non-cancelable operating leases.
2016 | $ | 1,502,000 | |
2017 | 799,000 | ||
2018 | 157,000 | ||
2019 | 93,000 | ||
2020 | 70,000 | ||
Total | $ | 2,621,000 | |
44
12. GROUP INSURANCE
The Company participates, along with other plants in the industry, in a group captive insurance company (Captive). The Captive insures losses related to workman's compensation, commercial property and general liability. The Captive reinsures catastrophic losses for all participants, including the Company, in excess of predetermined amounts. The Company's premiums are accrued by a charge to income for the period to which the premium relates and is remitted by the Company's insurer to the captive reinsurer. These premiums are structures such that the Company has made a prepaid collateral deposit estimated for losses related to the above coverage. The Captive insurer has estimated and collected an amount in excess of the estimated losses but less than the catastrophic loss limit insured by the Captive. The Company cannot be assessed over the amount in the collateral fund.
13. QUARTERLY FINANCIAL REPORTING (UNAUDITED)
Summary quarterly results are as follows:
First Quarter | Second Quarter | Third Quarter | Fourth Quarter | |||||||||||||
Year ended October 31, 2015 | ||||||||||||||||
Total revenues | $ | 61,048,123 | $ | 52,854,192 | $ | 52,082,545 | $ | 55,164,274 | ||||||||
Gross profit | 12,354,270 | 3,826,385 | 6,054,597 | 4,697,420 | ||||||||||||
Operating income | 11,298,282 | 3,130,968 | 5,314,680 | 3,780,788 | ||||||||||||
Net income | 14,902,633 | 3,967,686 | 7,356,150 | 5,720,050 | ||||||||||||
Basic & diluted earnings per unit | $ | 0.75 | $ | 0.20 | $ | 0.37 | $ | 0.29 | ||||||||
Year ended October 31, 2014 | ||||||||||||||||
Total revenues | $ | 72,987,525 | $ | 79,555,311 | $ | 70,787,145 | $ | 65,822,568 | ||||||||
Gross profit | 14,393,693 | 18,588,889 | 18,992,791 | 11,841,637 | ||||||||||||
Operating income | 13,608,951 | 17,601,368 | 17,967,160 | 11,070,379 | ||||||||||||
Net income | 18,475,033 | 22,777,709 | 21,925,756 | 16,101,039 | ||||||||||||
Basic & diluted earnings per unit | $ | 0.93 | $ | 1.15 | $ | 1.10 | $ | 0.81 | ||||||||
Year ended October 31, 2013 | ||||||||||||||||
Total revenues | $ | 85,408,162 | $ | 93,880,209 | $ | 84,597,520 | $ | 86,835,284 | ||||||||
Gross profit (loss) | (965,555 | ) | 2,134,266 | 5,527,465 | 6,010,335 | |||||||||||
Operating income (loss) | (1,736,938 | ) | 1,585,609 | 4,958,513 | 5,349,091 | |||||||||||
Net income (loss) | (1,763,757 | ) | 2,558,407 | 6,982,173 | 6,406,205 | |||||||||||
Basic & diluted earnings (loss) per unit | $ | (0.08 | ) | $ | 0.13 | $ | 0.35 | $ | 0.29 | |||||||
14. SUBSEQUENT EVENTS
On November 16, 2015 the board of directors declared a cash distribution of $0.70 per membership unit to the holders of Class A and Class B units of record at the close of business on November 16, 2015 for a total distribution of $13,911,100. The distribution will be recorded in the Company's first quarter financial statements for the 2016 fiscal year and was paid on December 10, 2015.
45
ITEM 9. CHANGES IN AND DISAGREEMENTS WITH ACCOUNTANTS ON ACCOUNTING AND FINANCIAL DISCLOSURE.
None.
ITEM 9A. CONTROLS AND PROCEDURES.
Disclosure Controls and Procedures
Our management, including our Executive Vice President (the principal executive officer), Curtis Strong, along with our Chief Financial Officer (the principal financial officer), Christine Marchand, have reviewed and evaluated the effectiveness of our disclosure controls and procedures (as defined in Rule 13a-15(e) and Rule 15d-15(e) under the Securities Exchange Act of 1934, as amended) as of October 31, 2015. Based on this review and evaluation, these officers have concluded that our disclosure controls and procedures are effective to ensure that information required to be disclosed in the reports that we file or submit under the Exchange Act is recorded, processed, summarized and reported within the time periods required by the forms and rules of the Securities and Exchange Commission; and to ensure that the information required to be disclosed by an issuer in the reports that it files or submits under the Exchange Act is accumulated and communicated to our management including our principal executive and principal financial officers, or persons performing similar functions, as appropriate to allow timely decisions regarding required disclosure.
Internal Control Over Financial Reporting
Inherent Limitations Over Internal Controls
Our internal control over financial reporting is designed to provide reasonable assurance regarding the reliability of financial reporting and the preparation of financial statements for external purposes in accordance with generally accepted accounting principles. Our internal control over financial reporting includes those policies and procedures that:
(i) pertain to the maintenance of records that, in reasonable detail, accurately and fairly reflect the transactions and dispositions of our assets;
(ii) provide reasonable assurance that transactions are recorded as necessary to permit preparation of financial statements in accordance with generally accepted accounting principles, and that our receipts and expenditures are being made only in accordance with authorizations of our management and directors; and
(iii) provide reasonable assurance regarding prevention or timely detection of unauthorized acquisition, use, or disposition of our assets that could have a material effect on the financial statements.
Management, including our Executive Vice President and Chief Financial Officer, does not expect that our internal controls will prevent or detect all errors and all fraud. A control system, no matter how well designed and operated, can provide only reasonable, not absolute, assurance that the objectives of the control system are met. Further, the design of a control system must reflect the fact that there are resource constraints, and the benefits of controls must be considered relative to their costs. Because of the inherent limitations in all control systems, no evaluation of internal controls can provide absolute assurance that all control issues and instances of fraud, if any, have been detected. Also, any evaluation of the effectiveness of controls in future periods are subject to the risk that those internal controls may become inadequate because of changes in business conditions, or that the degree of compliance with the policies or procedures may deteriorate.
Management's Annual Report on Internal Control Over Financial Reporting.
Our management is responsible for establishing and maintaining adequate internal control over financial reporting (as defined in Rule 13a-15(f) under the Securities Exchange Act of 1934, as amended). Management conducted an evaluation of the effectiveness of our internal control over financial reporting based on the criteria set forth in the 1992 Internal Control-Integrated Framework issued by the Committee of Sponsoring Organizations of the Treadway Commission ("COSO"). Based on this evaluation, management has concluded that our internal control over financial reporting was effective as of October 31, 2015.
This annual report does not include an attestation report of our registered public accounting firm regarding internal control over financial reporting. As we are a non-accelerated filer, management's report is not subject to attestation by our registered public accounting firm pursuant to Section 404(c) of the Sarbanes-Oxley Act of 2002 that permits us to provide only management's report in this annual report.
46
Changes in Internal Control Over Financial Reporting.
There were no changes in our internal control over financial reporting during the fourth quarter of our 2015 fiscal year which were identified in connection with management's evaluation required by paragraph (d) of rules 13a-15 and 15d-15 under the Exchange Act that have materially affected, or are reasonably likely to materially affect, our internal control over financial reporting.
ITEM 9B. OTHER INFORMATION
None.
47
PART III
ITEM 10. DIRECTORS, EXECUTIVE OFFICERS AND CORPORATE GOVERNANCE
The information required by this Item is incorporated by reference in the definitive proxy statement from our 2016 Annual Meeting of Members to be filed with the Securities and Exchange Commission within 120 days of our 2015 fiscal year end. This proxy statement is referred to in this report as the 2016 Proxy Statement.
ITEM 11. EXECUTIVE COMPENSATION.
The information required by this Item is incorporated by reference to the 2016 Proxy Statement.
ITEM 12. SECURITY OWNERSHIP OF CERTAIN BENEFICIAL OWNERS AND MANAGEMENT AND RELATED STOCKHOLDER MATTERS.
The information required by this Item is incorporated by reference to the 2016 Proxy Statement.
ITEM 13. CERTAIN RELATIONSHIPS AND RELATED TRANSACTIONS, AND DIRECTOR INDEPENDENCE
The information required by this Item is incorporated by reference to the 2016 Proxy Statement.
ITEM 14. PRINCIPAL ACCOUNTING FEES AND SERVICES.
The information required by this Item is incorporated by reference to the 2016 Proxy Statement.
PART IV
ITEM 15. EXHIBITS, FINANCIAL STATEMENT SCHEDULES.
Exhibits Filed as Part of this Report and Exhibits Incorporated by Reference.
The following exhibits and financial statements are filed as part of, or are incorporated by reference into, this report:
(1) | Financial Statements |
The financial statements appear beginning at page 31 of this report.
(2) | Financial Statement Schedules |
All supplemental schedules are omitted as the required information is inapplicable or the information is presented in the financial statements or related notes.
(3) | Exhibits |
48
Exhibit No. | Exhibit | Filed Herewith | Incorporated by Reference | ||
3.1 | Articles of Organization of the registrant. | Exhibit 3.1 to the registrant's registration statement on Form SB-2 (Commission File 333-101441). | |||
3.2 | Third Amended and Restated Operating Agreement of the registrant | Exhibit 3.2 to the registrant Form 10-K filed with the Commission on January 17, 2008. | |||
3.3 | First Amendment to the Third Amended and Restated Operating Agreement of Golden Grain Energy, LLC dated February 20, 2012. | Exhibit 3.1 to the registrants Form 10-Q filed with the Commission on March 15, 2012. | |||
3.4 | Second Amendment to the Third Amended and Restated Operating Agreement of Golden Grain energy, LLC dated February 25, 2013. | Exhibit 3.1 to the registrant's Form 10-Q filed with the Commission on March 15, 2013 | |||
4.1 | Form of Membership Unit Certificate. | Exhibit 4.2 to the registrant's registration statement on Form SB-2 (Commission File 333-101441). | |||
10.1 | Member Control Agreement dated April 11, 2006 between the registrant and Renewable Products Marketing Group, LLC. | Exhibit 10.1 to the registrant's Form 10-QSB filed with the Commission on June 14, 2006. | |||
10.2 | Management Services Agreement with Homeland Energy Solutions, LLC dated December 15, 2008. | Exhibit 10.11 to the registrant's Form 10-K filed with the Commission on January 29, 2009. | |||
10.3 | Management Phantom Unit and Bonus Plan dated December 19, 2008. | Exhibit 10.12 to the registrant's Form 10-K filed with the Commission on January 29, 2009. | |||
10.4 | Corn Oil Marketing Agreement between the registrant and Renewable Products Marketing Group, LLC dated January 27, 2009. + | Exhibit 10.1 to the registrant's Form 10-Q filed with the Commission on March 17, 2009. | |||
10.5 | Master Loan Agreement between the registrant, Farm Credit Services of America FLCA and Farm Credit Services of America, PCA dated July 21, 2010. | Exhibit 10.1 to the registrant's Form 10-Q filed with the Commission on September 14, 2010. | |||
10.6 | Real Estate Mortgage between the registrant, Farm Credit Services of America FLCA and Farm Credit Services of America, PCA dated July 21, 2010. | Exhibit 10.2 to the registrant's Form 10-Q filed with the Commission on September 14, 2010. | |||
10.7 | $25,000,000 Revolving Term Loan Supplement between the registrant, Farm Credit Services of America FLCA and Farm Credit Services of America, PCA dated July 21, 2010. | Exhibit 10.3 to the registrant's Form 10-Q filed with the Commission on September 14, 2010. | |||
10.8 | $5,000,000 Revolving Term Loan Supplement between the registrant, Farm Credit Services of America FLCA and Farm Credit Services of America, PCA dated July 21, 2010. | Exhibit 10.4 to the registrant's Form 10-Q filed with the Commission on September 14, 2010. | |||
10.9 | $5,000,000 Revolving Loan Supplement between the registrant, Farm Credit Services of America FLCA and Farm Credit Services of America, PCA dated July 21, 2010. | Exhibit 10.5 to the registrant's Form 10-Q filed with the Commission on September 14, 2010. | |||
10.10 | Member Fuel Ethanol Marketing Agreement between the registrant and RPMG, Inc. dated April 22, 2010. + | Exhibit 10.21 to the registrant's Form 10-K filed with the Commission on December 23, 2010. | |||
10.11 | Distillers Grains Marketing Agreement between the registrant and Renewable Products Marketing Group, Inc. dated December 10, 2010. + | Exhibit 10.22 to the registrant's Form 10-K filed with the Commission on December 23, 2010. | |||
10.12 | Amendment to the Master Loan Agreement between Farm Credit Services of America, FLCA, Farm Credit of America, PCA and Golden Grain Energy, LLC dated June 23, 2011. | Exhibit 10.1 to the registrant's Form 10-Q filed with the Commission on September 14, 2011. | |||
10.13 | Revolving Credit Supplement between Farm Credit of America, PCA and Golden Grain Energy, LLC dated June 23, 2011. | Exhibit 10.2 to the registrant's Form 10-Q filed with the Commission on September 14, 2011. | |||
49
10.14 | Revolving Term Loan Supplement between Farm Credit Services of America, FLCA and Golden Grain Energy, LLC dated June 23, 2011. | Exhibit 10.3 to the registrant's Form 10-Q filed with the Commission on September 14, 2011. | |||
10.15 | Third Amended Management Services Agreement between Homeland Energy Solutions, LLC and Golden Grain Energy, LLC dated December 15, 2011. | Exhibit 10.15 to the registrant's Form 10-K filed with the Commission on December 23, 2011. | |||
10.16 | Member Amended and Restated Ethanol Marketing Agreement between RPMG, Inc. and Golden Grain Energy, LLC dated August 27, 2012.+ | Exhibit 10.1 to the registrant's Form 10-Q filed with the Commission on September 13, 2012. | |||
10.17 | Membership Unit Repurchase Agreement dated December 12, 2012 between Golden Grain Energy, LLC and Steven Retterath. | Exhibit 10.1 to the registrant's Form 10-Q filed with the Commission on March 15, 2013. | |||
10.18 | Amendment to the Master Loan Agreement dated December 26, 2012 between Golden Grain Energy, LLC and Farm Credit Services of America, FLCA and Farm Credit Services of America, PCA. | Exhibit 10.2 to the registrant's Form 10-Q filed with the Commission on March 15, 2013. | |||
10.19 | Revolving Term Loan Supplement dated December 26, 2012 between Golden Grain Energy, LLC and Farm Credit Services of America, FLCA and Farm Credit Services of America, PCA. | Exhibit 10.3 to the registrant's Form 10-Q filed with the Commission on March 15, 2013. | |||
10.20 | $5,000,000 Revolving Term Loan Supplement dated December 26, 2012 between Golden Grain Energy, LLC and Farm Credit Services of America, FLCA and Farm Credit Services of America, PCA. | Exhibit 10.4 to the registrant's Form 10-Q filed with the Commission on March 15, 2013. | |||
10.21 | Termination Agreement dated May 16, 2014 between Golden Grain Energy, LLC and Homeland Energy Solutions, LLC. | Exhibit 99.1 to the registrant's Form 8-K filed with the Commission on May 16, 2014. | |||
10.22 | Revolving Term Loan Supplement between CoBank and Golden Grain Energy dated March 20, 2015. | Exhibit 10.1 to the registrant's Form 10-Q filed with the Commission on June 11, 2014. | |||
10.23 | Revolving Term Loan Supplement between CoBank and Golden Grain Energy dated March 20, 2015. | Exhibit 10.1 to the registrant's Form 10-Q filed with the Commission on June 11, 2015. | |||
14.1 | Code of Ethics of Golden Grain Energy, LLC, adopted January 14, 2004. | Exhibit 14.1 to the registrant's Form 10-KSB filed with the Commission on January 29, 2004. | |||
31.1 | Certificate Pursuant to 17 CFR 240.13a-14(a) | X | |||
31.2 | Certificate Pursuant to 17 CFR 240.13a-14(a) | X | |||
32.1 | Certificate Pursuant to 18 U.S.C. Section 1350 | X | |||
32.2 | Certificate Pursuant to 18 U.S.C. Section 1350 | X | |||
50
101 | The following financial information from Golden Grain Energy, LLC's Annual Report on Form 10-K for the fiscal year ended October 31, 2015, formatted in XBRL (eXtensible Business Reporting Language): (i) Balance Sheets as of October 31, 2015 and October 31, 2014, (ii) Statements of Operations for the fiscal years ended October 31, 2015, 2014 and 2013, (iii) Statements of Cash Flows for the fiscal years ended October 31, 2015, 2014 and 2013, (iv) Statements of Members' Equity for the fiscal years ended October 31, 2015, 2014 and 2013, and (v) the Notes to Consolidated Financial Statements.* | ||||
(+) Confidential treatment requested.
(*) Furnished herewith.
SIGNATURES
Pursuant to the requirements of Section 13 or 15(d) of the Securities Exchange Act of 1934, the registrant has duly caused this report to be signed on its behalf by the undersigned thereunto duly authorized.
GOLDEN GRAIN ENERGY, LLC | |||
Date: | December 21, 2015 | /s/ Curtis Strong | |
Curtis Strong | |||
Executive Vice-President | |||
(Principal Executive Officer) | |||
Date: | December 21, 2015 | /s/ Christine Marchand | |
Christine Marchand | |||
Chief Financial Officer | |||
(Principal Financial and Accounting Officer) | |||
51
Pursuant to the requirements of the Securities Exchange Act of 1934, this report has been signed below by the following persons on behalf of the registrant and in the capacities and on the dates indicated.
Date: | December 21, 2015 | /s/ Dave Sovereign | |
Dave Sovereign, Chairman and Director | |||
Date: | December 21, 2015 | /s/ Jim Boeding | |
Jim Boeding, Director | |||
Date: | December 21, 2015 | /s/ Stan Laures | |
Stan Laures, Director | |||
Date: | December 21, 2015 | /s/ Jerry Calease | |
Jerry Calease, Director | |||
Date: | December 21, 2015 | /s/ Marion Cagley | |
Marion Cagley, Director | |||
Date: | December 21, 2015 | /s/ Dave Reinhart | |
Dave Reinhart, Director | |||
Date: | December 21, 2015 | /s/ Leslie Hansen | |
Leslie Hansen, Director | |||
Date: | December 21, 2015 | /s/ Duane Lynch | |
Duane Lynch, Director | |||
Date: | December 21, 2015 | /s/ Steve Sukup | |
Steve Sukup, Vice Chairman and Director | |||
Date: | December 21, 2015 | /s/ Roger Shaffer | |
Roger Shaffer, Director | |||
52