Attached files
| file | filename |
|---|---|
| 8-K - 8-K - JPMORGAN CHINA REGION FUND, INC. | form8k-14976_jfc.htm |

JPMorgan China Region Fund, Inc. BenchmarkA Performance data (as at 30/11/15) 80 % MSCI Golden Dragon Index (Net) 20 % CSI 300 Index (Net) Investment objective 400 350 300 250 Share price Net asset value BenchmarkA Long term capital appreciation through investments primarily in equity securities of companies with substantial assets in, or revenues derived from, the People’s Republic of China, Hong Kong, Taiwan and Macau. 200 150 100 50 0 11/95 11/97 11/99 11/01 11/03 11/05 11/07 11/09 11/11 11/13 11/15 Fund statistics Fund manager Emerson Yip Listed New York Stock Exchange Net Assets (as at 30/11/15) USD 119.61m Launch date 16th July 1992 Dividends (Ex-dividend date) USD 0.2370 (9 December 2015) Actual LeverageB 1.2% Market capitalization breakdown (as at 30/11/15) (Large Cap > USD 2bn, Mid Cap USD 500m - USD 2bn, Small Cap > USD 500m) Cumulative performance (as at 30/11/15) % 1 mth 3 mths 2015 YTD 1 year 3 year 5 year 10 years Share price -1.5 8.4 -7.3 -2.1 23.5 7.5 132.7 Net asset value -1.3 4.8 4.3 1.0 27.1 13.4 112.4 BenchmarkA -2.7 2.9 -5.3 -1.5 22.2 17.1 115.1 Rolling 12 month performance (as at 30/11/15) % 2015/2014 2014/2013 2013/2012 2012/2011 2011/2010 Share price -2.1 3.3 22.1 12.9 -22.9 Net asset value 1.0 6.2 18.5 18.2 -24.5 BenchmarkA -1.5 9.6 13.2 16.8 -18.0 Past performance is no guarantee of future results. Investment returns and principal value will fluctuate and shares, when sold, may be worth more or less than original cost. Current performance may be lower or higher than the performance data quoted. All return data includes investment management fees, administrative and custodial charges, bank loan expenses and assumes the reinvestment of all distributions. Returns for periods less than one year are not annualized. Top 10 holdings (as at 30/11/15) 100 80 60 40 20 0 93.7 96.5 6.3 3.5 0.0 0.0 Holding Fund % BenchmarkA weight Tencent Holdings 6.1 5.1 Taiwan Semiconductor Manufacturing 5.3 5.2 China Construction Bank* 4.3 3.0 AIA Group 3.8 3.6 Ping An Insurance (Group) Company of China* 3.8 2.2 China Merchants Bank* 2.9 1.2 China Vanke Co* 2.1 0.5 CK Hutchison Holdings 1.9 1.8 Sino Biopharmaceutical 1.7 0.2 Hong Kong Exchanges & Clearing 1.6 1.5 Fund Bmark Fund Bmark Fund Bmark Large Cap 79 Stocks Mid Cap 14 Stocks Small Cap 0 Stocks Sub-Total 33.5 24.3 * Denotes China A-share holding Total number of stocks in the Fund’s portfolio: 93 Sector (as at 30/11/15) A On 01/03/01 the benchmark of the Fund was changed from 25% TWII, 20% BNPPCI, 50% MSCI HK, 5% HSBC to MSCI Golden Dragon Index (Total). On 13/04/12 the benchmark was changed to 80% MSCI Golden Dragon Index, 20% CSI 300 Index. On 01/10/13 the Fund’s benchmark was changed to a net, rather than gross, basis. Formerly JF China Region Fund, Inc., the Fund name was changed on 06/12/13. B Actual leverage represents the excess amount above shareholders’ funds of total assets less cash/cash equivalents, expressed as a percentage of shareholders’ funds. If the amount calculated is negative, this represents a net cash position. Fund % 34.5% Financials 22.4% Information Technology 9.5% Industrials 8.8% Consumer Discretionary 4.0% Health Care 3.3% Telecommunication Services 2.6% Utilities 2.3% Energy 1.4% Consumer Staples 1.1% Materials 10.1% Liquidity 100.0% Total Active % -5.6% 2.5% -0.3% 2.3% 1.9% -2.5% -2.3% -1.5% -1.9% -2.7% 10.1%

Fund information Share price USD 15.67 Portfolio (as at 30/11/15) NAV per share USD 18.55 Discount (-) / Premium Current -15.5% Shares in issue 6,447,637 Fund code Bloomberg JFC US ISIN US46614T1079 Sedol 2471392 Fund % 18.7% China - ‘A’ Shares 18.1% Hong Kong 17.5% China - Hong Kong ‘H’ 13.3% Taiwan 12.7% China - Hong Kong ‘P Chip’ 7.8% China - Hong Kong ‘Red Chip’ 1.5% China - Others 0.3% China - ‘B’ Shares 10.1% Net Liquidity 100.0% Total Active % -1.3% -0.4% -3.5% -7.7% 3.2% -2.1% 1.5% 0.2% 10.1% Portfolio review (as at 30/11/15) Greater China equities fell in lock-step as asset markets factored in a long-awaited Fed interest rate hike. The MSCI China Index dropped as the government continued its high profile crack-down on corruption in the securities industry and tightened regulations on OTC stock market leverage.The RMB’s long-awaited inclusion in the Special Drawing Rights (SDR) basket was a positive, but was more than outweighed by the ascent of the dollar on U.S. rate expectations. The MSCI Hong Kong Index fell given much of its constituent stocks are rate-sensitives, while Macau gaming revenues resumed disappointing expectations. The MSCI Taiwan Index retreated as news of Apple order cuts more than outweighed the growing possibility of Chinese investment in Taiwanese technology firms. Market outlook (as at 30/11/15) Assuming an orderly depreciation of the RMB against the dollar, we continue to find an interesting opportunity set within Greater China equities.The corporate earnings season has painted a picture of divergence, as a slowing global economy exposes stark differences between well- positioned firms and their competitors. Note that the MSCI China index was rebalanced at month-end and now includes a large proportion of overseas-listed Chinese companies, particularly in technology.The core strategies of the Fund remain unchanged: consumer services (including media and internet), healthcare and environmental protection. Further information Investment Adviser: JF International Management Inc. Website: www.jpmchinaregionfund.com Administration: Lucy Dina +44 (0)20 7742 3735

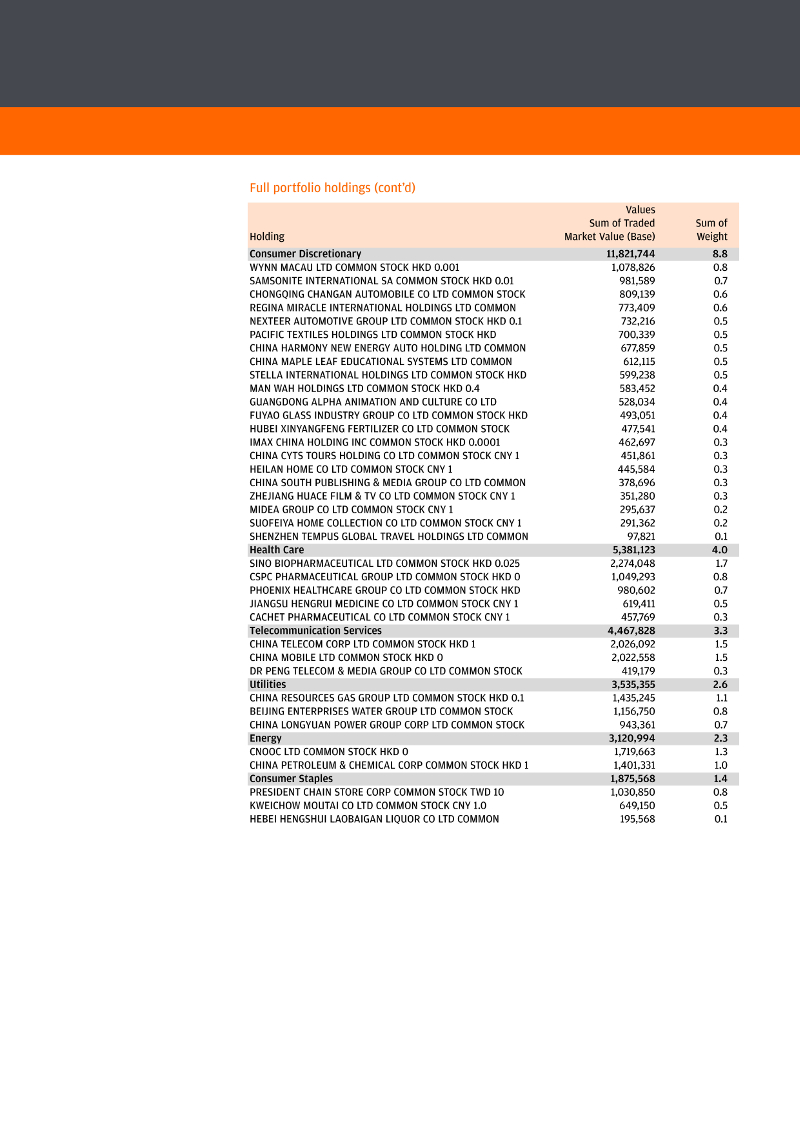
Financials 46,462,500 34.5 CHINA CONSTRUCTION BANK CORP COMMON STOCK HKD 1 5,765,525 4.3 AIA GROUP LTD COMMON STOCK HKD 0 5,174,932 3.8 PING AN INSURANCE GROUP CO OF CHINA LTD COMMON 5,133,433 3.8 CHINA VANKE CO LTD COMMON STOCK HKD 1 2,761,655 2.1 CHINA MERCHANTS BANK CO LTD COMMON STOCK HKD 1 2,731,784 2.0 HONG KONG EXCHANGES AND CLEARING LTD COMMON STOCK 2,197,668 1.6 CHEUNG KONG PROPERTY HOLDINGS LTD COMMON STOCK HKD 2,115,636 1.6 BOC HONG KONG HOLDINGS LTD COMMON STOCK HKD 0 1,972,670 1.5 INDUSTRIAL BANK CO LTD COMMON STOCK CNY 1 1,871,464 1.4 FUBON FINANCIAL HOLDING CO LTD COMMON STOCK TWD 10 1,820,827 1.4 HUATAI SECURITIES CO LTD COMMON STOCK CNY 1 1,723,840 1.3 E.SUN FINANCIAL HOLDING CO LTD COMMON STOCK TWD 10 1,523,524 1.1 SUN HUNG KAI PROPERTIES LTD COMMON STOCK HKD 0 1,327,461 1.0 PICC PROPERTY & CASUALTY CO LTD COMMON STOCK HKD 1 1,210,501 0.9 CHINA MERCHANTS BANK CO LTD COMMON STOCK CNY 1 1,198,930 0.9 HONGKONG LAND HOLDINGS LTD COMMON STOCK USD 0.1 1,142,865 0.8 NEW WORLD DEVELOPMENT CO LTD COMMON STOCK HKD 0 1,073,443 0.8 CHINA CITIC BANK CORP LTD COMMON STOCK HKD 1 1,070,907 0.8 DAH SING BANKING GROUP LTD COMMON STOCK HKD 0 996,111 0.7 POLY REAL ESTATE GROUP CO LTD COMMON STOCK CNY 1 971,914 0.7 CHINA FORTUNE LAND DEVELOPMENT CO LTD COMMON STOCK 911,237 0.7 CHINA TAIPING INSURANCE HOLDINGS CO LTD COMMON 813,724 0.6 SHANGHAI PUDONG DEVELOPMENT BANK CO LTD COMMON 704,830 0.5 CHINA MINSHENG BANKING CORP LTD COMMON STOCK HKD 1 247,620 0.2 Information Technology 30,108,737 22.4 TENCENT HOLDINGS LTD COMMON STOCK HKD 0.00002 8,254,859 6.1 TAIWAN SEMICONDUCTOR MANUFACTURING CO LTD COMMON 7,184,024 5.3 AAC TECHNOLOGIES HOLDINGS INC COMMON STOCK HKD 1,899,651 1.4 CATCHER TECHNOLOGY CO LTD COMMON STOCK TWD 10 1,829,667 1.4 ADVANCED SEMICONDUCTOR ENGINEERING INC COMMON 1,734,024 1.3 WANGSU SCIENCE & TECHNOLOGY CO LTD COMMON STOCK 1,585,258 1.2 HANGZHOU HIKVISION DIGITAL TECHNOLOGY CO LTD 1,499,294 1.1 LARGAN PRECISION CO LTD COMMON STOCK TWD 10 1,463,912 1.1 ALIBABA GROUP HOLDING LTD ADR USD 0.000025 950,104 0.7 SILICON MOTION TECHNOLOGY CORP ADR USD 0.01 772,030 0.6 VTECH HOLDINGS LTD COMMON STOCK HKD 0.05 727,394 0.5 CHIPBOND TECHNOLOGY CORP COMMON STOCK TWD 10 595,460 0.5 AISINO CORP COMMON STOCK CNY 1 388,061 0.3 HANGZHOU SHUNWANG TECHNOLOGY CO LTD COMMON STOCK 352,191 0.3 EAST MONEY INFORMATION CO LTD COMMON STOCK CNY 1 301,361 0.2 GUANGZHOU HAIGE COMMUNICATIONS GROUP INC CO COMMON 300,956 0.2 WONDERS INFORMATION CO LTD COMMON STOCK CNY 1 267,511 0.2 DELTA ELECTRONICS INC RIGHT TWD 2,980 0.0 Liquidity 13,534,145 10.1 Net Liquidity 13,534,145 10.1 Industrials 12,784,627 9.5 CK HUTCHISON HOLDINGS LTD COMMON STOCK HKD 1 2,610,232 1.9 CHINA EVERBRIGHT INTERNATIONAL LTD COMMON STOCK 1,624,699 1.2 CAR INC COMMON STOCK HKD 0.00001 1,472,106 1.1 SPRING AIRLINES CO LTD COMMON STOCK CNY 1 1,467,472 1.1 CHINA COMMUNICATIONS CONSTRUCTION CO LTD COMMON 1,095,523 0.8 CHINA CONCH VENTURE HOLDINGS LTD COMMON STOCK HKD 979,360 0.7 SHUN TAK HOLDINGS LTD COMMON STOCK HKD 0 864,173 0.7 CHINA MACHINERY ENGINEERING CORP COMMON STOCK HKD 551,306 0.4 HAN’S LASER TECHNOLOGY INDUSTRY GROUP CO LTD 441,544 0.3 AVIC AVIATION ENGINE CORP PLC COMMON STOCK CNY 1 434,761 0.3 SHENZHEN INOVANCE TECHNOLOGY CO LTD COMMON STOCK 429,538 0.3 ZHENGZHOU YUTONG BUS CO LTD COMMON STOCK CNY 1 328,155 0.3 BEIJING ORIGINWATER TECHNOLOGY CO LTD COMMON STOCK 325,227 0.3 XIAMEN C & D INC COMMON STOCK CNY 1 160,533 0.1 WYNN MACAU LTD COMMON STOCK HKD 0.001 1,078,826 0.8 SAMSONITE INTERNATIONAL SA COMMON STOCK HKD 0.01 981,589 0.7 CHONGQING CHANGAN AUTOMOBILE CO LTD COMMON STOCK 809,139 0.6 REGINA MIRACLE INTERNATIONAL HOLDINGS LTD COMMON 773,409 0.6 NEXTEER AUTOMOTIVE GROUP LTD COMMON STOCK HKD 0.1 732,216 0.5 PACIFIC TEXTILES HOLDINGS LTD COMMON STOCK HKD 700,339 0.5 CHINA HARMONY NEW ENERGY AUTO HOLDING LTD COMMON 677,859 0.5 CHINA MAPLE LEAF EDUCATIONAL SYSTEMS LTD COMMON 612,115 0.5 STELLA INTERNATIONAL HOLDINGS LTD COMMON STOCK HKD 599,238 0.5 MAN WAH HOLDINGS LTD COMMON STOCK HKD 0.4 583,452 0.4 GUANGDONG ALPHA ANIMATION AND CULTURE CO LTD 528,034 0.4 FUYAO GLASS INDUSTRY GROUP CO LTD COMMON STOCK HKD 493,051 0.4 HUBEI XINYANGFENG FERTILIZER CO LTD COMMON STOCK 477,541 0.4 IMAX CHINA HOLDING INC COMMON STOCK HKD 0.0001 462,697 0.3 CHINA CYTS TOURS HOLDING CO LTD COMMON STOCK CNY 1 451,861 0.3 HEILAN HOME CO LTD COMMON STOCK CNY 1 445,584 0.3 CHINA SOUTH PUBLISHING & MEDIA GROUP CO LTD COMMON 378,696 0.3 ZHEJIANG HUACE FILM & TV CO LTD COMMON STOCK CNY 1 351,280 0.3 MIDEA GROUP CO LTD COMMON STOCK CNY 1 295,637 0.2 SUOFEIYA HOME COLLECTION CO LTD COMMON STOCK CNY 1 291,362 0.2 SHENZHEN TEMPUS GLOBAL TRAVEL HOLDINGS LTD COMMON 97,821 0.1 Health Care 5,381,123 4.0 SINO BIOPHARMACEUTICAL LTD COMMON STOCK HKD 0.025 2,274,048 1.7 CSPC PHARMACEUTICAL GROUP LTD COMMON STOCK HKD 0 1,049,293 0.8 PHOENIX HEALTHCARE GROUP CO LTD COMMON STOCK HKD 980,602 0.7 JIANGSU HENGRUI MEDICINE CO LTD COMMON STOCK CNY 1 619,411 0.5 CACHET PHARMACEUTICAL CO LTD COMMON STOCK CNY 1 457,769 0.3 Telecommunication Services 4,467,828 3.3 CHINA TELECOM CORP LTD COMMON STOCK HKD 1 2,026,092 1.5 CHINA MOBILE LTD COMMON STOCK HKD 0 2,022,558 1.5 DR PENG TELECOM & MEDIA GROUP CO LTD COMMON STOCK 419,179 0.3 Utilities 3,535,355 2.6 CHINA RESOURCES GAS GROUP LTD COMMON STOCK HKD 0.1 1,435,245 1.1 BEIJING ENTERPRISES WATER GROUP LTD COMMON STOCK 1,156,750 0.8 CHINA LONGYUAN POWER GROUP CORP LTD COMMON STOCK 943,361 0.7 Energy 3,120,994 2.3 CNOOC LTD COMMON STOCK HKD 0 1,719,663 1.3 CHINA PETROLEUM & CHEMICAL CORP COMMON STOCK HKD 1 1,401,331 1.0 Consumer Staples 1,875,568 1.4 PRESIDENT CHAIN STORE CORP COMMON STOCK TWD 10 1,030,850 0.8 KWEICHOW MOUTAI CO LTD COMMON STOCK CNY 1.0 649,150 0.5 HEBEI HENGSHUI LAOBAIGAN LIQUOR CO LTD COMMON 195,568 0.1 SICHUAN TIANQI LITHIUM INDUSTRIES INC COMMON STOCK 1,102,391 0.8 JIANGSU KANGDE XIN COMPOSITE MATERIAL CO LTD 410,497 0.3 Grand Total 134,605,509 100.0
Source: J.P. Morgan, Reuters, Bloomberg Benchmark Source: MSCI. The MSCI data is comprised of a custom index calculated by MSCI for, and as requested by, JPMAM (UK). The MSCI data is for internal use only and may not be redistributed or used in connection with creating or offering any securities, financial products or indices. Neither MSCI nor any other third party involved in or related to compiling, computing or creating the MSCI data (the “MSCI Parties”) makes any express or implied warranties or representations with respect to such data (or the results to be obtained by the use thereof), and the MSCI Parties hereby expressly disclaim all warranties of originality, accuracy, completeness, merchantability or fitness for a particular purpose with respect to such data. Without limiting any of the foregoing, in no event shall any of the MSCI Parties have any liability for any direct, indirect, special, punitive, consequential or any other damages (including lost profits) even if notified of the possibility of such damages. All equity indices stated as ‘Net’ are calculated net of tax as per the standard published approach by the index vendor unless stated otherwise. This material should not be relied on as including sufficient information to support an investment decision. US recipients of this information that wish to receive further information or effect transactions in the Fund’s shares should contact JPM New York and not other brokers who may be listed in this report. This document contains information concerning the performance of JF Investment Companies. It does not constitute or contain, and may not be used for the purposes of or in connection with, any offer or invitation or solicitation by or on behalf of any of the investment companies described herein to subscribe for or to purchase securities by anyone in any jurisdiction in which such offer, invitation or solicitation is not authorised, or to any person to whom it is unlawful to make such offer, invitation or solicitation. There is no assurance that the Fund will achieve its investment objective. You should remember that past performance is not a guide to the future. The price of investments and the income from them may fall as well as rise and you may not get back the full amount invested. All performance assumes reinvestment of all dividends and capital gain distributions. Total return based on share price reflects changes in market value. Total return based on net asset value reflects changes in the Fund’s net asset value during each period. Shares of the Fund may trade above or below its net asset value. Current performance may be lower or higher than the performance data quoted. When a subscription involves a foreign exchange transaction, it may be subject to the fluctuations of currency values. Exchange rates may also cause the value of underlying overseas investments to go up or down. Investments in emerging markets may involve a higher element of risk due political and economic instability and underdeveloped markets and systems. Investments in smaller companies may involve a higher degree of risk as markets are usually more sensitive to price movements. Concentrating investments in the greater China region subjects the Fund to more volatility and greater risk of loss than geographically diverse funds. The views expressed herein are not to be taken as advice or a recommendation to buy or sell any investment.
