Attached files
| file | filename |
|---|---|
| 8-K - FORM 8-K - AIR PRODUCTS & CHEMICALS INC /DE/ | d100478d8k.htm |
| EX-99.2 - EX-99.2 - AIR PRODUCTS & CHEMICALS INC /DE/ | d100478dex992.htm |
 Moving forward
Separation of Materials Technologies Versum Materials – Form 10 Highlights December 2015 Create Shareholder Value Exhibit 99.1 |
 Moving forward
This presentation and materials Air Products and Versum have filed or will file
with the SEC contain, or will contain, certain statements
regarding business strategies, market potential, future financial performance, future action, results and other matters which are “forward-looking” statements within the meaning of the Securities Exchange Act of 1934, as amended
(the “Exchange Act”), and the Private Securities
Litigation Reform Act of 1995. The words “believe,” “expect,” “anticipate,” “project,” “estimate,” “budget,” “continue,” “could,” “intend,”
“may,” “plan,” “potential,” “predict,” “seek,” “should,” “will,” “would,” “objective,” “forecast,” “goal,” “guidance,” “outlook,”
“effort,” “target” and similar expressions, among others, generally identify forward-looking statements, which speak only as of the date the statements were made. Additionally,
forward-looking statements include, but are not limited
to: statements about business strategies and outlook for Versum, expectations as to Versum’s future sales, estimates regarding Versum’s capital requirements and needs for additional financing, estimates of Versum’s expenses, future revenues and profitability, and estimates of the size of the market for Versum’s products, and estimates of the success of other competing technologies that may become available. Actual
performance and financial results may differ materially from projections and
estimates expressed in the forward-looking statements because
of many factors not anticipated by management, including, without limitation, weakening of global or regional economic conditions; future financial and operating performance of major customers; unanticipated contract
terminations or customer cancellations of sales; the impact of competitive
products and pricing; unexpected changes in raw
material supply and markets; Versum’s failure to successfully develop and market new products and optimally manage product life cycles; Versum’s inability to protect and enforce its intellectual property rights; failure to appropriately manage
process safety and product stewardship issues; changes in laws and regulations
or political conditions; global economic and capital markets
conditions, such as inflation, interest and currency exchange rates; business or supply disruptions; security threats, such as acts of sabotage, terrorism or war, weather events and natural disaster; increased competition; changes in
relationships with our significant customers and suppliers; unanticipated
business disruptions; our ability to predict, identify and
interpret changes in consumer preferences and demand; uncertainty regarding the availability of financing to us in the future and the terms of such financing; disruptions in our information technology networks and systems; unexpected safety
or manufacturing issues; costs and outcomes of litigation or regulatory
investigations; the impact of management and organizational
changes, the success of cost reduction efforts; the timing, impact, and other uncertainties of future acquisitions or divestitures; significant fluctuations in interest rates and foreign currencies from that currently
anticipated; the impact of changes in environmental, and tax or
other legislation and regulations in jurisdictions in which Versum and its affiliates operate. Air Products and Versum disclaim any obligation or undertaking to disseminate any updates or revisions
to any forward-looking statements contained in this document
to reflect an change in assumptions, beliefs or expectations or
any change in events, conditions, or circumstances upon which any such forward-looking statements are based, except as required by applicable law. Versum Materials, LLC filed an initial Form 10 registration statement with the United States Securities and Exchange
Commission on December 18, 2015. The Form 10 is not yet effective and, as is
customary, will be updated to provide additional information
regarding capital structure, pro forma unaudited results and other matters as they become available. 2 Forward-looking statements |
 Moving forward
• Decision to separate is strategic: allows the industrial gases and materials businesses to leverage their respective critical competencies and enhance competitive position - Creates two leading, focused public companies - Enables shareholders to value industrial gases and materials businesses independently • Distribute all shares of Versum Materials to our shareholders, intended to be tax-free to Air Products U.S. shareholders • Targeted completion by Sept 2016, subject to typical regulatory approvals • Opportunity for both companies to further optimize cost structure and balance sheet post-separation 3 Air Products intends to separate our Materials Technologies business (Versum Materials*) through a tax-free spin-off * Versum Materials was formed to hold the Materials Technologies business and certain other former businesses and activities of Air Products |
 Moving forward
• Air Products expects to manage its balance sheet to maintain its current targeted A/A2 rating - Transaction is expected to create approximately $1.5 billion of additional capital deployment capacity for Air Products • Versum Materials will be well-capitalized consistent with target BB/Ba rating • Dividend from both companies in total is expected to equal that of Air Products at separation 4 Tailored capital structures with financial flexibility to drive value creation |
 Moving forward
5 Air Products – Industrial Gases Versum Materials Distinct Business Model – Separate Value Creation Strategies Business Orientation • Gases • Engineered solutions • Density-driven • Specialty Materials • Innovation solutions • Value-added Geography • Local business with global presence • Global business; integrated value chain Capital Intensity • High • Low R&D Spend • Low • High Portfolio Breadth • Narrow • Broad Value Focus • Distribution • End-use performance Tailored Capital Structure • Focus each company’s financial resources solely on core operations while retaining financial flexibility
• Investment grade, A/A2 rating required • Target BB/Ba rating Acquisition Criteria • Share/density enhancement in local markets • Product/technology enhancements Unique Investment Theses • One of the largest industrial gas companies globally • Organic growth driven by megatrends – energy, environment and emerging markets • Drive cash flow improvement through cost structure and productivity enhancements • Best-in-class Specialty Materials company with significant free cash flow generation • Organic growth driven by product innovation and end-use market penetration • Opportunity to drive growth through synergistic bolt-on acquisitions Management • Improves alignment of management and employees incentives with distinct growth and profitability
metrics • Allows management focus on unique opportunities and respective critical competencies
Enhanced visibility: enable shareholders to value the two businesses
independently Strategic rationale for separation
Creates two focused, best-in-class public companies with distinct
business models, capital requirements and growth
profiles |
 Target Credit Rating
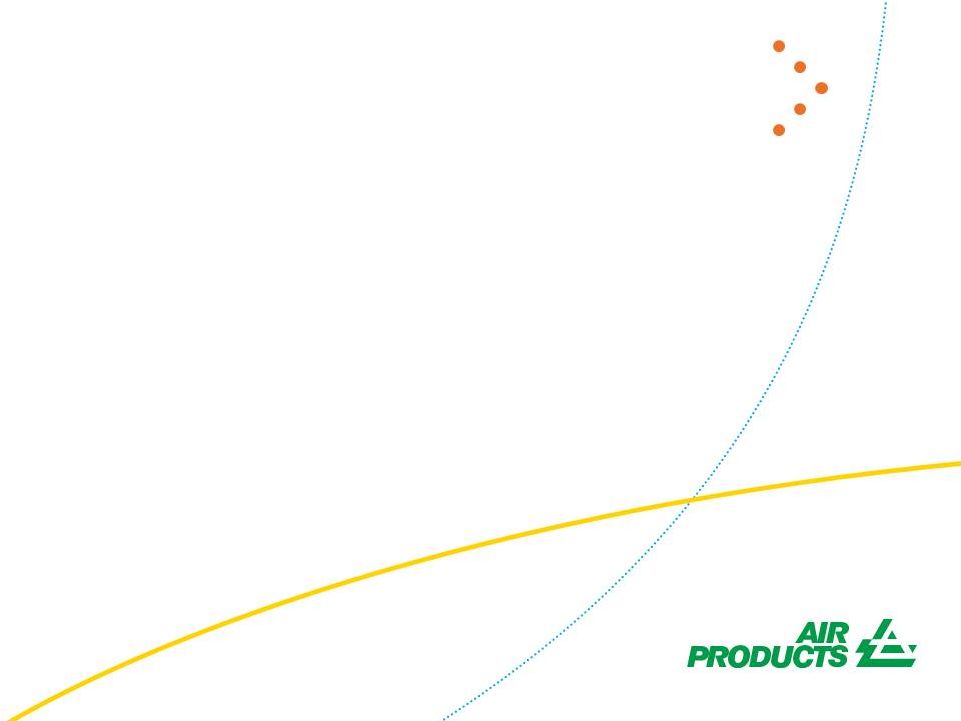
Sales Revenue by Geography Adjusted EBITDA / Margin* Operating Income / Margin* Creation of two companies with strong financial profiles 6 Current Air Products Materials Technologies Americas 48% Asia 28% Europe 24% $9,895 $2,975 30.1% $1,884 19.0% A/A2 • MT Segment - as reported within APD • *non-GAAP measures - see appendix for reconciliation. Americas 40% Asia 43% Europe 17% $2,087 $572 27.4% $477 22.8% BB/Ba Air Products, ex MT $7,808 $2,403 30.8% $1,407 18.0% A/A2 Americas 51% Asia 24% Europe 25% ($ millions, FY15) Moving forward |
 Versum Materials / Form 10 |
 Moving forward Versum Materials A portfolio of world class businesses 8 • Leading positions in attractive niche markets with favorable industry structures - #1 or #2 in majority of target markets • Sustainable competitive advantages from long-term customer relationships, technology & innovation leadership, and structural cost advantages with strategically located manufacturing assets • Secular growth trends supported by new product development & innovation pipeline • Critical mass with geographic, end-market and customer diversity • Management team with demonstrated ability to rapidly respond to changing market dynamics focused on delivering sustainable growth • Performance critical products that are a small portion of customers’
product costs
Solid growth
High margins
Low capital
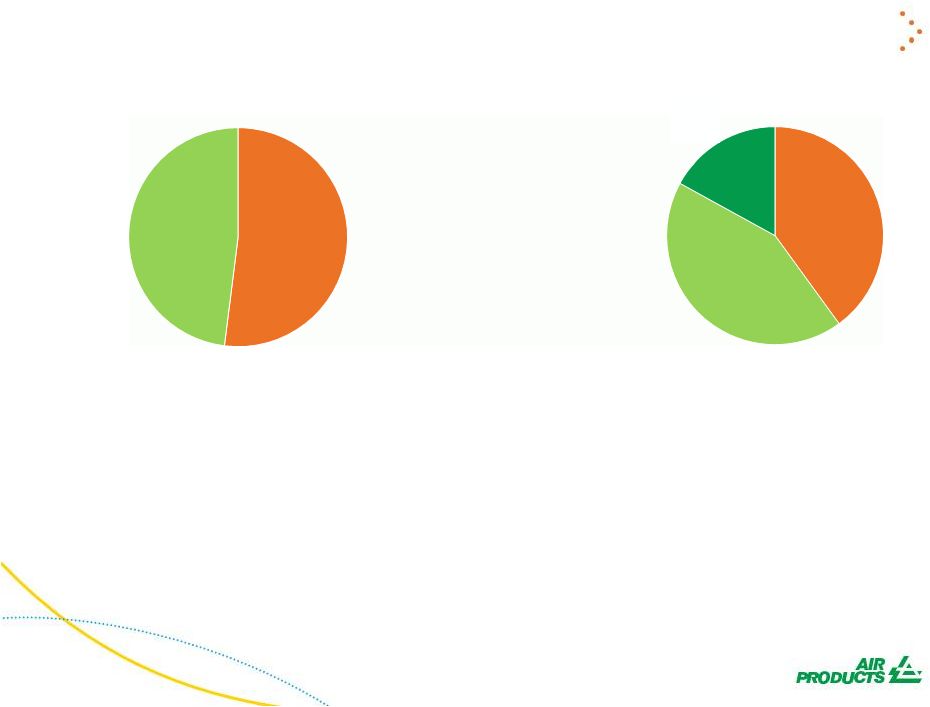
intensity Strong free cash flow Sales: $2,096 Adj EBITDA*:$534 Margin: 25.5% • FY15 Versum Carve-out – as reported in Form 10 • *non-GAAP measures - see appendix for reconciliation Sales by business segment and destination Electronic Materials 48% Performance Materials 52% Americas 40% Asia 43% Europe 17% |
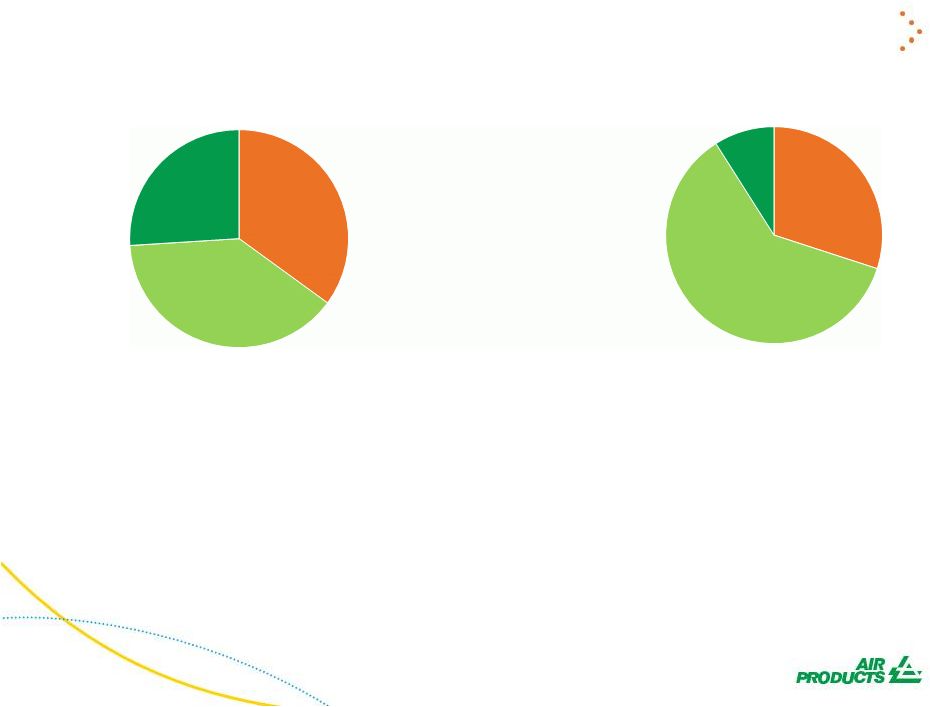 Moving forward Electronic Materials A portfolio of world class businesses 9 • Integrated provider of specialty materials for the high-growth electronics industry, primarily the semiconductor market • Customers - Top 3 are 45% of segment sales, Top 20 are 85% of segment sales • Almost 2000 employees, over 250 customers, 13 production facilities and 5 R&D facilities Americas 30% Asia 61% Europe 9% • FY15 Versum Carve-out – as reported in Form 10 • *non-GAAP measures - see appendix for reconciliation Sales: $1,009 Adj EBITDA*:$324 Margin: 32.1% Sales by business unit and destination Solid growth High margins Low capital intensity Strong free cash flow Delivery Systems 26% Advanced Materials 35% Process Materials 39% |
 Moving forward Performance Materials A portfolio of world class businesses 10 Americas 50% Asia 26% Europe 24% Specialty Additives 28% • FY15 Versum Carve-out – as reported in Form 10 • *non-GAAP measures - see appendix for reconciliation • Focused on the $10 billion high value additives end of the broader $150 billion materials space • Key End Markets – Coatings, construction, automotive, consumer goods, cleaners, adhesives & cosmetics • Diversified customer base - top twenty customers account for 40% of segment sales • About 1100 employees, over 800 customers, 11 production facilities and 7 R&D facilities Sales: $1,078 Adj EBITDA*:$242 Margin: 22.4% Sales by business unit and destination Solid growth High margins Low capital intensity Strong free cash flow Polyurethane Additives 32% Curing Agents 40% |
 Moving forward
“Materials Technologies Segment”
• As previously reported by Air Products with MT as a segment within Air Products, not
full financial statements
“Versum Audited Carve-out Financials”
• Full financial statements, provided in the “Financial Statements” section of the current
Form 10 draft
• Primary adjustments relative to MT Segment include; - Allocation of about $30 million of corporate expenses (Corporate segment)
• Depreciation within that allocation now treated as a cash cost ($8 million)
- Addition of non-core services to third parties adjacent to our operating sites ($9
million sales – Corporate segment) - GAAP restructuring and cost reduction charges – actions taken to restructure the organization and reposition the business - Assessment of tax expense for the standalone business - $75 million of environmental balance sheet liability for legacy chemicals sites
“Versum Unaudited Pro-forma Combined Financial
Statements” •
Will be provided in future Form 10 updates
• Expected adjustments relative to Versum Carve-out include; - Capitalization – New third party debt, financing costs and interest expense - Business separation agreements – Transition service agreements (TSA) for interim Versum support such as IT, tax, accounting, treasury and legal expenses
- Pension obligations – Likely to include certain limited assets and obligations associated with some employees - Income taxes – will reflect the pro-forma adjustments above 11 Three Financial Reports |
 Moving forward
• Versum Carve-out Form 10 Financials includes; - Allocation of about $30 million of corporate expenses (Corporate segment) • Depreciation within that allocation now treated as a cash cost ($8 million) - Addition of non-core services to third parties adjacent to our operating sites ($9 million sales – Corporate segment) • Materials Technologies Segment as reported in prior APD disclosure 12 Versum vs Materials Technologies *non-GAAP measures - see appendix for reconciliation FY15 Versum MT Delta Sales $ 2,096 $ 2,087 $ 9 Adj Operating Income* $ 447 $ 477 $ (30) Op Margin 21.3% 22.8% -150bp D&A $ 85 $ 93 $ (8) Adj EBITDA* $ 534 $ 572 $ (38) EBITDA Margin 25.5% 27.4% -190bp |
 Moving forward
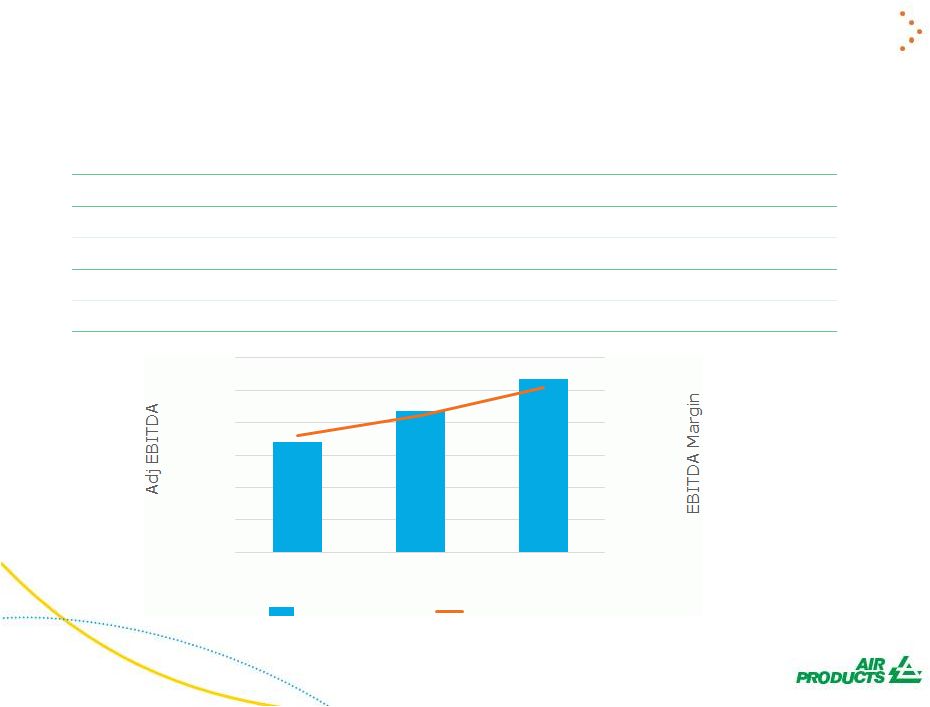
$339 $437 $534 18.1% 21.1% 25.5% 0.0% 5.0% 10.0% 15.0% 20.0% 25.0% 30.0% $- $100 $200 $300 $400 $500 $600 FY13 FY14 FY15 Adj EBITDA* EBITDA Margin Versum Carve-out - Form 10 FY15 improvement driven by improved pricing/mix, higher volumes and lower costs offsetting unfavorable currency 13 FY13 FY14 FY15 Sales $ 1,879 $ 2,075 $ 2,096 Adj Operating Income* $ 248 $ 349 $ 447 Op Margin 13.2% 16.8% 21.3% Adj EBITDA* $ 339 $ 437 $ 534 EBITDA Margin 18.1% 21.1% 25.5% • FY15 Versum Carve-out – as reported in Form 10 • *non-GAAP measures - see appendix for reconciliation |
 Moving forward Significant Cash Generation 14 Note • Adj EBITDA = FY15 Versum Carve-out, non-GAAP – see appendix for reconciliation • Est. Interest = assumes $2.5 billion debt at 6% • Est. Cash Taxes estimated at $85 million • Est. Maint Capex = 1.5% of sales, as disclosed in Form 10 • Est. Growth Capex = approx. $70 total capex average for last three years,
as shown in Form 10, minus Maint capex
($ million) Adj EBITDA $534 Est. Interest (150) Est. Cash Taxes (85) Est. Maint Capex (30) Est. Distributable Cash Flow $270 Est. Growth Capex (40) Est. Free Cash Flow (before divs) $230 |
 Moving forward
$171 $246 $324 20.0% 26.1% 32.1% 0.0% 5.0% 10.0% 15.0% 20.0% 25.0% 30.0% 35.0% $- $50 $100 $150 $200 $250 $300 $350 FY13 FY14 FY15 Adj EBITDA* EBITDA Margin Electronic Materials FY15 improvement driven by improved pricing/mix, higher volumes and lower costs offsetting unfavorable currency 15 EM FY13 FY14 FY15 Sales $ 853 $ 943 $ 1,009 Adj Operating Income* $ 106 $ 185 $ 266 Op Margin 12.5% 19.6% 26.3% Adj EBITDA* $ 171 $ 246 $ 324 EBITDA Margin 20.0% 26.1% 32.1% Total Assets $ 1,010 $ 990 $ 860 Ol / Assets 10.5% 18.7% 30.9% • FY15 Versum Carve-out – as reported in Form 10 • *non-GAAP measures - see appendix for reconciliation |
 Moving forward Performance Materials FY15 improvement driven by improved pricing/mix, lower costs and higher volumes offsetting unfavorable currency 16 • FY15 Versum Carve-out – as reported in Form 10 • *non-GAAP measures - see appendix for reconciliation $203 $224 $242 19.9% 20.0% 22.4% 0.0% 5.0% 10.0% 15.0% 20.0% 25.0% $- $50 $100 $150 $200 $250 $300 FY13 FY14 FY15 Adj EBITDA* EBITDA Margin PM FY13 FY14 FY15 Sales $ 1,017 $ 1,123 $ 1,078 Adj Operating Income* $ 176 $ 197 $ 214 Op Margin 17.3% 17.6% 19.8% Adj EBITDA* $ 203 $ 224 $ 242 EBITDA Margin 19.9% 20.0% 22.4% Total Assets $ 758 $ 769 $ 815 Ol / Assets 23.2% 25.7% 30.9% |
 Moving forward
• Corporate Segment - Administrative costs that have been allocated to us as an estimate of the costs associated with operating a public company, non-core operating activities such as remediation of historical environmental sites, foreign exchange gains and losses, certain services to third parties adjacent to our operating sites, and other income and expense that cannot be directly associated with business segments. Assets in the Corporate segment include cash and deferred tax assets. • Environmental – Legacy chemical sites - Sept 30, 2015 accrual of $75 million primarily for Pace, Piedmont, Paulsboro & Pasadena sites, potential range of exposure $74 - $87 million. • Pension – more detail available in future Form 10 updates, but we would expect that Air Products will maintain the defined benefit liabilities for both Air Products and Versum employees in most countries. We would expect Versum will offer a defined contribution pension plan in most countries. • R&D – about 3.3% of sales 17 Additional Items - #1 |
 Moving forward
• Capex - Averaged $70 million over last three years ($100 FY15, $59 FY14, $49 FY13). The FY15 increase was primarily due to spending for new production capacity for the Performance Materials segment. - For fiscal 2017, we expect capital spending to be lower due to the completion of these facilities. • Restructuring Charges - FY15 = $34.8. Severance and other benefits totaled $27.6 related to the
elimination of approx. 330 positions. Asset actions totaled $7.2 related
primarily to the exit of a product line.
- FY14 = $2.0 for severance and other benefits relating to the elimination
of certain positions.
- FY13 = $137.4 reflecting actions taken to better align our cost structure
with current market conditions, primarily in the Electronic Materials
segment.
• Distribution Ratio – Expected to be one share of Versum common stock for each share of APD • Air Products / Versum Relationship - Transition Services Agreements – more detail available in future Form 10 updates 18 Additional Items - #2 |
 Moving forward Leadership Seifollah Ghasemi Director and non-executive Chairman Guillermo Novo President and Chief Executive Officer and Director George Bitto Senior Vice President and Chief Financial Officer Patrick F. Loughlin Senior Vice President Operations and Supply Chain Michael W. Valente Senior Vice President Law and Human Resources, General Counsel, and Secretary 19 |
 Appendix Slides |
 Moving forward Appendix: Non GAAP Operating Income and EBITDA Metrics 21 $MM Current Air Materials Air Products, Products Technologies ex MT * FY13 FY14 FY15 Operating Income/Margin GAAP Measure Sales 9,894.9 2,087.1 7,807.8 1,879.0 2,075.3 2,096.4 Operating Income 1,699.1 476.7 1,222.4 110.2 346.9 412.1 Operating Margin 17.2% 22.8% 15.7% 5.9% 16.7% 19.7% Non GAAP Adjustments Business restructuring/cost reduction actions 207.7 0.0 0.0 137.4 2.0 34.8 Pension Settlement Loss 21.2 0.0 0.0 0.0 0.0 0.0 Gain on previously held equity interest (17.9) 0.0 0.0 0.0 0.0 0.0 Business Separation costs 7.5 0.0 0.0 0.0 0.0 0.0 Gain on land sales (33.6) 0.0 0.0 0.0 0.0 0.0 Total Non GAAP Adjustments 184.9 0.0 0.0 137.4 2.0 34.8 Non GAAP Measure Operating Income - Non GAAP 1,884.0 476.7 1,407.3 247.6 348.9 446.9 Operating Margin - Non GAAP 19.0% 22.8% 18.0% 13.2% 16.8% 21.3% Current Air Materials Air Products, Adjusted EBITDA Products Technologies ex MT FY13 FY14 FY15 FY13 FY14 FY15 FY13 FY14 FY15 Operating Income - Non GAAP 1,884.0 476.7 1,407.3 247.6 348.9 446.9 106.3 184.7 265.8 175.7 197.4 213.9 Add: Depreciation and amortization 936.4 92.8 843.6 88.8 86.0 84.5 62.2 59.3 57.5 26.1 26.1 26.4 Add Equity Affiliates' Income 154.5 2.2 152.3 2.8 2.5 2.2 2.0 1.7 1.0 0.8 0.8 1.2 Adjusted EBITDA 2,974.9 571.7 2,403.2 339.2 437.4 533.6 170.5 245.7 324.3 202.6 224.3 241.5 Sales 9,894.9 2,087.1 7,807.8 1,879.0 2,075.3 2,096.4 852.8 942.5 1,009.3 1,017.4 1,123.2 1,077.7 Adjusted EBITDA Margin 30.1% 27.4% 30.8% 18.1% 21.1% 25.5% 20.0% 26.1% 32.1% 19.9% 20.0% 22.4% * Air Products ex. MT does not necessarily reflect how Air Products historical results will be presented subsequent to the
separation Electronic Materials
Performance Materials FY15 Versum FY15 Versum |
 Moving forward
Thank you tell me more |