Attached files
| file | filename |
|---|---|
| EX-99.1 - EXHIBIT 99.1 - RITE AID CORP | v427077_ex99-1.htm |
| 8-K - FORM 8-K - RITE AID CORP | v427077_8k.htm |
Exhibit 99.2

December 17, 2015
Investors are urged to review Rite Aid’s SEC filings . Statements , estimates, targets, projections and other information included herein might be considered forward - looking . These statements and estimates are based upon various assumptions that may not prove to be correct . Such assumptions are inherently subject to significant uncertainties and contingencies, many of which are beyond the company’s control . No representation is made, and no assurance can be given, that such results can or will be attained . The risk factors associated with those uncertainties are described in Rite Aid’s most recent Form 10 - K, its Form 10 - Q’s and other filings with the SEC . Rite Aid assumes no obligation to update the information or the forward - looking statements contained herein, whether as a result of new information or otherwise . Also included herein are non - GAAP financial measures . The definition and purpose for using these measures are in Rite Aid’s Form 8 - K furnished to the SEC on the date hereof . Safe Harbor Statement
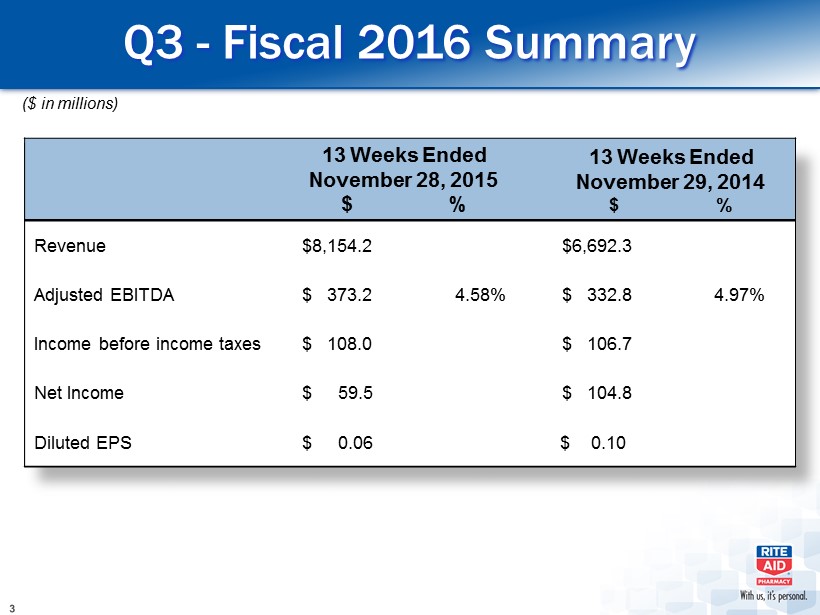
13 Weeks Ended November 28 , 2015 $ % 13 Weeks Ended November 29, 2014 $ % Revenue $8,154.2 $6,692.3 Adjusted EBITDA $ 373.2 4.58% $ 332.8 4.97% Income before income taxes $ 108.0 $ 106.7 Net Income $ 59.5 $ 104.8 Diluted EPS $ 0.06 $ 0.10 Q3 - Fiscal 2016 Summary ($ in millions)

Q3 - Fiscal 2016 Reconciliation of Net Income to Adjusted EBITDA ($ in thousands) Thirteen weeks ended November 28, 2015 Thirteen weeks ended November 29, 2014 Net income 59,543$ 104,846$ Adjustments: Interest expense 106,879 97,400 Income tax expense 48,468 1,871 Depreciation and amortization 136,434 104,614 LIFO charge 5,986 1,543 Lease termination and impairment charges 7,011 8,702 Loss on debt retirements, net - 18,512 Other 8,845 (4,719) Adjusted EBITDA 373,166$ 332,769$ Percent of revenues 4.58% 4.97%

13 Weeks Ended November 28 , 2015 $ % 13 Weeks Ended November 29, 2014 $ % Revenue $ 6,744.1 $ 6,692.3 Adjusted EBITDA Gross Profit $ 1,915.9 28.4% $ 1,916.1 28.6% Adjusted EBITDA SG&A $ 1,576.6 23.4% $ 1,583.3 23.7% Adjusted EBITDA $ 339.3 5.0% $ 332.8 5.0% Q3 - Fiscal 2016 Summary RETAIL PHARMACY SEGMENT ($ in millions)

Q3 Fiscal 2016 Summary RETAIL PHARMACY SEGMENT Retail Pharmacy Segment revenue increased $51.8 million or 0.8%, driven by a 0.3% increase in same store front end sales and a 0.2% increase in comparable script growth. Adjusted EBITDA Gross Profit was flat to prior year, with Adjusted EBITDA Gross Margin decreasing by 20 bps. This was driven by lower reimbursement rates, partially offset by an improvement in front end margin. Adjusted EBITDA SG&A improved by $6.7 million and 30 bps, due to good labor control and a decrease in advertising expense.

Reconciliation of Adjusted EBITDA Gross Profit RETAIL PHARMACY SEGMENT ($ in thousands) Thirteen Weeks Ended Thirteen Weeks Ended November 28, 2015 November 29, 2014 Revenues 6,744,143$ 6,692,333$ Gross Profit 1,921,886 1,923,313 Addback: LIFO charge 5,986 1,543 Customer loyalty card program revenue deferral (15,683) (12,656) Depreciation and amortization (COGS portion only) 3,491 3,763 Other 209 127 Adjusted EBITDA Gross Profit 1,915,889$ 1,916,090$ Adjusted EBITDA Gross Profit as a percent of revenue 28.41% 28.63%

Reconciliation of Adjusted EBITDA SG&A RETAIL PHARMACY SEGMENT ($ in thousands) Thirteen Weeks Ended Thirteen Weeks Ended November 28, 2015 November 29, 2014 Revenues 6,744,143$ 6,692,333$ Selling, general and administrative expenses 1,708,445 1,692,437 Less: Depreciation and amortization (SG&A portion only) 110,821 100,851 Stock based compensation expense 10,328 7,039 Acquisition charges 9,816 Other 846 1,226 Adjusted EBITDA SG&A 1,576,634$ 1,583,321$ Adjusted EBITDA SG&A as a percent of revenue 23.38% 23.66%

Pharmacy Services Segment Results ($ in millions) Thirteen Weeks Ended November 28, 2015 Revenues 1,501$ Cost of Revenues 1,420 Gross Profit 81 Selling General and Administrative Expense (69) Addback: Depreciation & Amortization 22 Adjusted EBITDA - Pharmacy Services Segment 34$
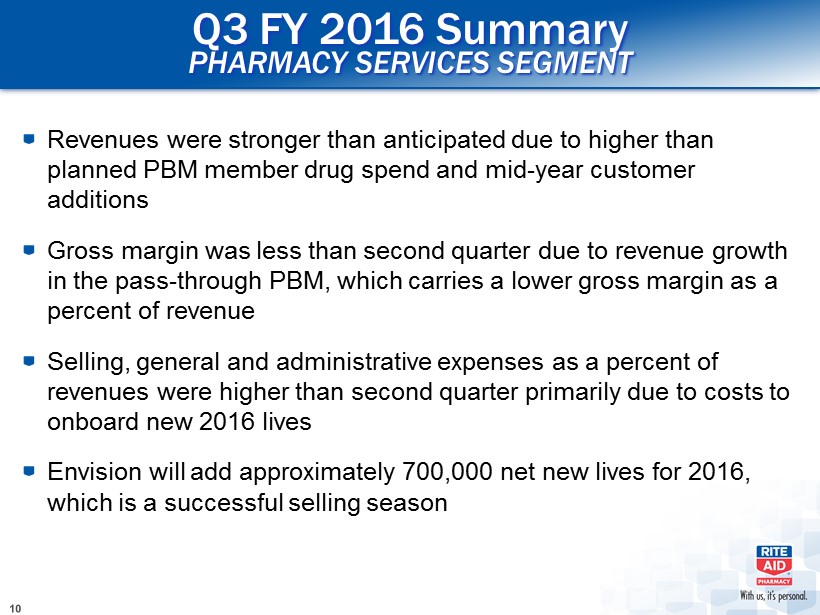
Q3 FY 2016 Summary PHARMACY SERVICES SEGMENT Revenues were stronger than anticipated due to higher than planned PBM member drug spend and mid - year customer additions Gross margin was less than second quarter due to revenue growth in the pass - through PBM, which carries a lower gross margin as a percent of revenue Selling, general and administrative expenses as a percent of revenues were higher than second quarter primarily due to costs to onboard new 2016 lives Envision will add approximately 700,000 net new lives for 2016, which is a successful selling season
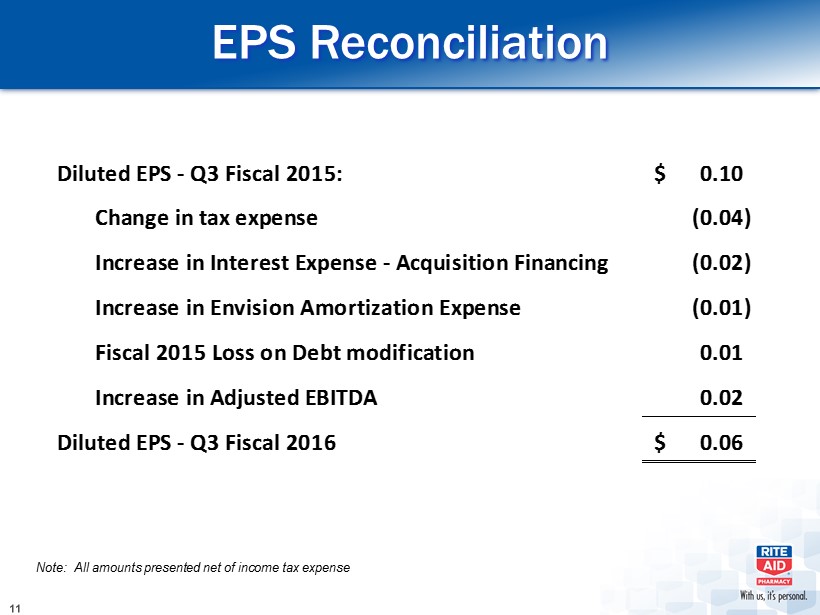
EPS Reconciliation Diluted EPS - Q3 Fiscal 2015: 0.10$ Change in tax expense (0.04) Increase in Interest Expense - Acquisition Financing (0.02) Increase in Envision Amortization Expense (0.01) Fiscal 2015 Loss on Debt modification 0.01 Increase in Adjusted EBITDA 0.02 Diluted EPS - Q3 Fiscal 2016 0.06$ Note: All amounts presented net of income tax expense

FRONT END SALES RX SALES SCRIPT COUNT 0.0% 2.5% 0.0% 1.6% 2.7% 1.4% 1.1% 0.3% 0.4% - 0.3% - 0.2% - 0.7% 0.0% 1.1% 1.6% 2.0% 0.6% 0.3% 0.3% 1.1% 2.0% 2.9% 3.8% 2.4% - 0.7% - 2.7% - 3.1% - 3.8% 1.7% 3.5% 3.5% 4.6% 5.6% 7.2% 5.7% 3.9% 2.8% 1.2% Q1 Q2 Q3 Q4 Q1 Q2 Q3 Q4 Q1 Q2 Q3 Q4 Q1 Q2 Q3 Q4 Q1 Q2 Q3 Comparable Store Sales Growth FY 12 FY 13 FY 14 FY 15 FY 16 0.4% 0.1% 0.5% 2.4% 3.0% 4.0% 3.6% 3.0% - 0.1% 0.0% 0.7% - 1.8% 2.3% 3.7% 4.5% 3.5% 1.6% 0.2% 0.2%
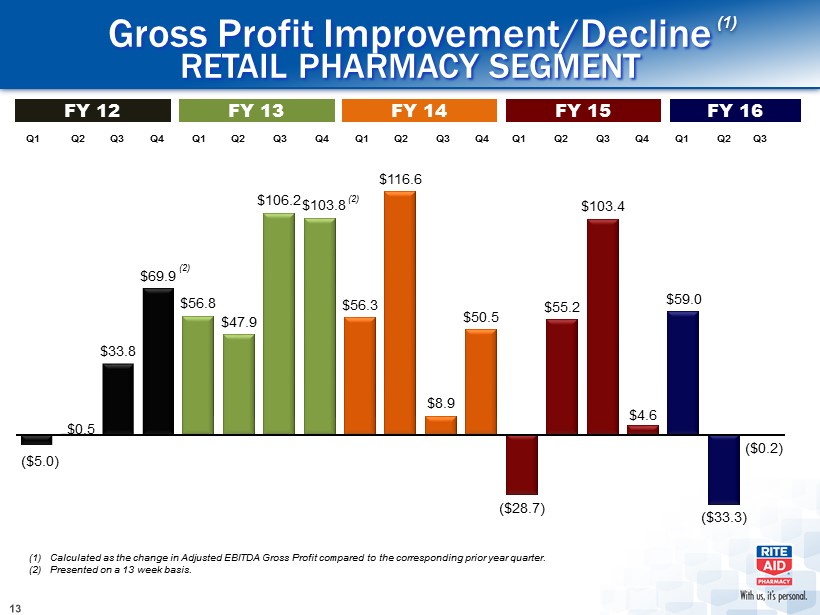
Gross Profit Improvement/Decline RETAIL PHARMACY SEGMENT ($5.0) $0.5 $33.8 $69.9 $56.8 $47.9 $106.2 $103.8 $56.3 $116.6 $8.9 $50.5 ($28.7) $55.2 $103.4 $4.6 $59.0 ($33.3) ($0.2) (1) (1) Calculated as the change in Adjusted EBITDA Gross Profit compared to the corresponding prior year quarter. (2) Presented on a 13 week basis. (2) (2) Q1 Q2 Q3 Q4 Q1 Q2 Q3 Q4 Q1 Q2 Q3 Q4 Q1 Q2 Q3 Q4 Q1 Q2 Q3 FY 12 FY 13 FY 14 FY 15 FY 16
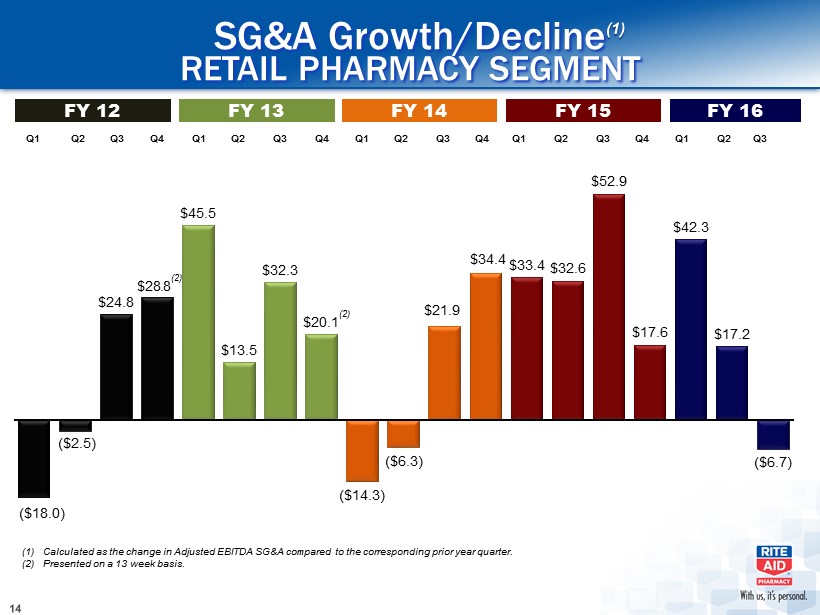
SG&A Growth/Decline RETAIL PHARMACY SEGMENT ($18.0) ($2.5) $24.8 $28.8 $45.5 $13.5 $32.3 $20.1 ($14.3) ($6.3) $21.9 $34.4 $33.4 $32.6 $52.9 $17.6 $42.3 $17.2 ($6.7) (2) (2) (1) Calculated as the change in Adjusted EBITDA SG&A compared to the corresponding prior year quarter. (2) Presented on a 13 week basis. Q1 Q2 Q3 Q4 Q1 Q2 Q3 Q4 Q1 Q2 Q3 Q4 Q1 Q2 Q3 Q4 Q1 Q2 Q3 FY 12 FY 13 FY 14 FY 15 FY 16

FIFO Inventory Comparison RETAIL PHARMACY SEGMENT Q3 FY 2015 FY 2015 YEAR END Q3 FY 2016 $4,021 $3,881 $3,881

Wellness Store Renovations Comp results for Wellness stores continue to exceed the chain average Front - end sales growth outperformance of 328 bps in Q3 of Fiscal 2016 Script count growth outperformance of 142 bps in Q3 of Fiscal 2016 0 274 797 1,215 1,634 1,948 FY 2011 FY 2012 FY 2013 FY 2014 FY 2015 FY 2016 Q3 Remodeled Stores Since 2010
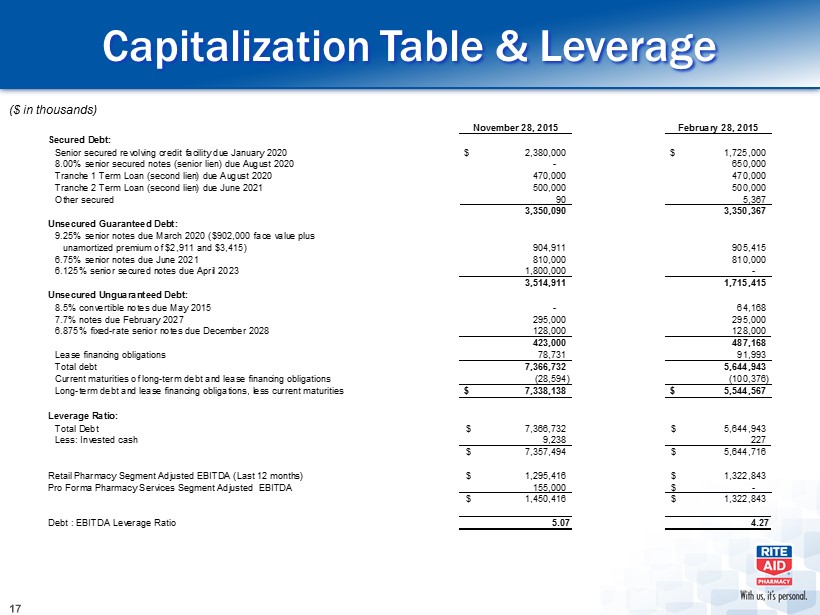
Capitalization Table & Leverage November 28, 2015 February 28, 2015 Secured Debt: Senior secured revolving credit facility due January 2020 2,380,000$ 1,725,000$ 8.00% senior secured notes (senior lien) due August 2020 - 650,000 Tranche 1 Term Loan (second lien) due August 2020 470,000 470,000 Tranche 2 Term Loan (second lien) due June 2021 500,000 500,000 Other secured 90 5,367 3,350,090 3,350,367 Unsecured Guaranteed Debt: 9.25% senior notes due March 2020 ($902,000 face value plus unamortized premium of $2,911 and $3,415) 904,911 905,415 6.75% senior notes due June 2021 810,000 810,000 6.125% senior secured notes due April 2023 1,800,000 - 3,514,911 1,715,415 Unsecured Unguaranteed Debt: 8.5% convertible notes due May 2015 - 64,168 7.7% notes due February 2027 295,000 295,000 6.875% fixed-rate senior notes due December 2028 128,000 128,000 423,000 487,168 Lease financing obligations 78,731 91,993 Total debt 7,366,732 5,644,943 Current maturities of long-term debt and lease financing obligations (28,594) (100,376) Long-term debt and lease financing obligations, less current maturities 7,338,138$ 5,544,567$ Leverage Ratio: Total Debt 7,366,732$ 5,644,943$ Less: Invested cash 9,238 227 7,357,494$ 5,644,716$ Retail Pharmacy Segment Adjusted EBITDA (Last 12 months) 1,295,416$ 1,322,843$ Pro Forma Pharmacy Services Segment Adjusted EBITDA 155,000 -$ 1,450,416$ 1,322,843$ Debt : EBITDA Leverage Ratio 5.07 4.27 ($ in thousands)

Debt Maturity Profile Maturity table as of Nov. 28, 2015 Note: Maturities reflect calendar year. $2,380 $1,320 $1,800 $295 $128 $470 $500 $905 $810 -$500 $500 $1,500 $2,500 $3,500 $4,500 $5,500 2014 2015 2016 2017 2018 2019 2020 2021 2022 2023 . . . . . . 2027 2028 ($ in millions) Second Lien ABL Funded ABL Unfunded Commitment Senior Unsecured Notes Senior Unsecured (Guaranteed) Notes Becomes callable in Mar. 2016 at 104.625
