Attached files
| file | filename |
|---|---|
| 8-K - 8-K - InvenTrust Properties Corp. | d84677d8k.htm |
Exhibit 99.1
|
|
Annual Stockholders Meeting
Presentation
December 15, 2015
Exhibit 99.1
|
|
Disclaimer
Forward-Looking Statements in this presentation, which are not historical facts, are forward-looking statements within the meaning of the Private Securities Litigation Reform Act of 1995. Forward-looking statements are statements that are not historical, including statements regarding management’s intentions, beliefs, expectations, plans or predictions of the future and are typically identified by words such as “may,” “could,” “expect,” “intend,” “plan,” “seek,” “anticipate,” “believe,” “estimate,” “predict,” “potential,” “continue,” “likely,” “will,” “would” and variations of these terms and similar expressions, or the negative of these terms or similar expressions. Such forward-looking statements are necessarily based upon estimates and assumptions that, while considered reasonable by us and our management, are inherently uncertain. Factors that may cause actual results to differ materially from current expectations include, among others, our ability to execute on our strategy, our ability to return value to our stockholders and the availability of cash flow from operating activities to fund distributions. For further discussion of factors that could materially affect the outcome of our forward-looking statements and our future results and financial condition, see the Risk Factors included in InvenTrust’s Properties Corp.’s (“InvenTrust”) most recent Annual Report on Form 10-K, as updated by any subsequent Quarterly Report on Form 10-Q, in each case as filed with the Securities and Exchange Commission. InvenTrust intends that such forward-looking statements be subject to the safe harbors created by Section 27A of the Securities Act of 1933, as amended, and Section 21E of the Securities Exchange Act of 1934, as amended, except as may be required by applicable law. We caution you not to place undue reliance on any forward-looking statements, which are made as of the date of this presentation. We undertake no obligation to update publicly any of these forward-looking statements to reflect actual results, new information or future events, changes in assumptions or changes in other factors affecting forward-looking statements, except to the extent required by applicable laws. If we update one or more forward-looking statements, no inference should be drawn that we will make additional updates with respect to those or other forward-looking statements.
This presentation includes certain non-GAAP financial measures. These non-GAAP financial measures are not measures of financial performance in accordance with GAAP and may exclude items that are significant in understanding and assessing our financial results. Therefore, these measures should not be considered in isolation or as an alternative to GAAP measures. You should be aware that our presentation of these measures may not be comparable to similarly-titled measures used by other companies. For reconciliations to GAAP measures, see the Appendix to this presentation and our most recent Quarterly Report on Form 10-Q filed with the SEC
1
|
|
Multi-Tenant Retail Strategy
|
|
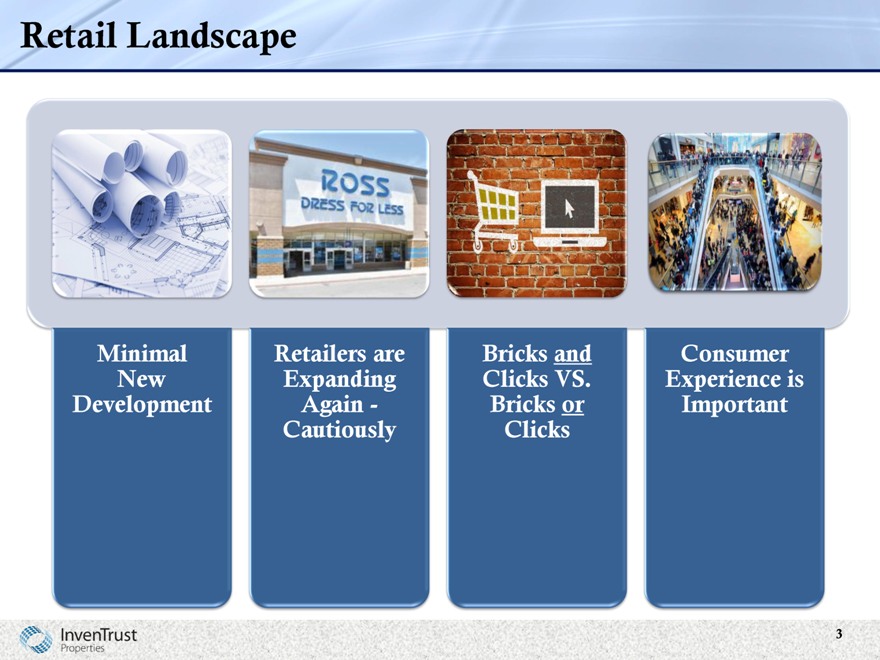
Retail Landscape
Minimal New Development
Retailers are Expanding Again—Cautiously
Bricks and Clicks VS. Bricks or Clicks
Consumer Experience is Important
3
|
|
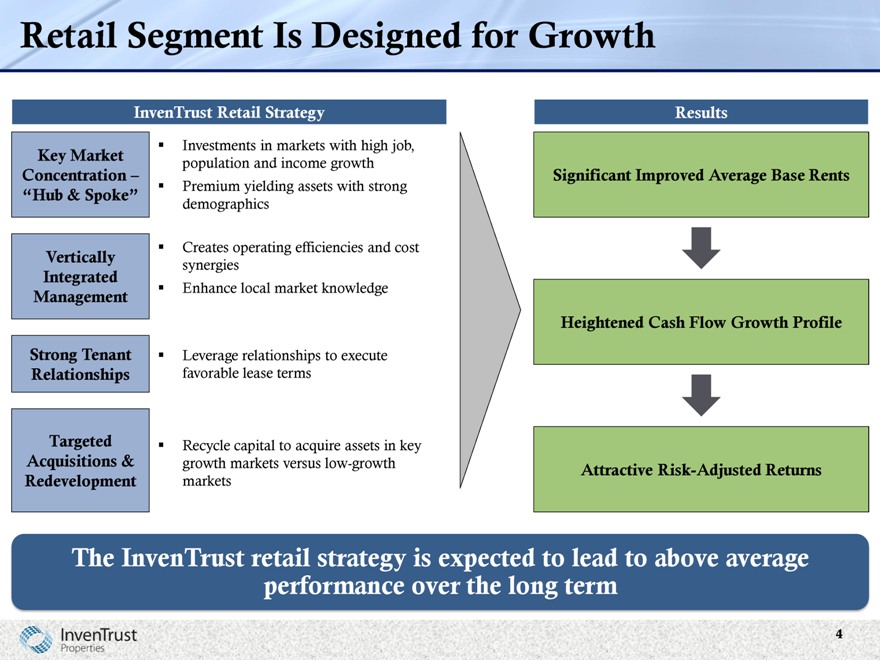
Retail Segment Is Designed for Growth
Key Market Concentration –
“Hub & Spoke”
Vertically Integrated Management
Strong Tenant Relationships
Targeted Acquisitions & Redevelopment
InvenTrust Retail Strategy
Investments in markets with high job, population and income growth Premium yielding assets with strong demographics
Creates operating efficiencies and cost synergies Enhance local market knowledge
Leverage relationships to execute favorable lease terms
Recycle capital to acquire assets in key growth markets versus low-growth markets
Results
Significant Improved Average Base Rents
Heightened Cash Flow Growth Profile
Attractive Risk-Adjusted Returns
The InvenTrust retail strategy is expected to lead to above average performance over the long term
| 4 |
|
|
|
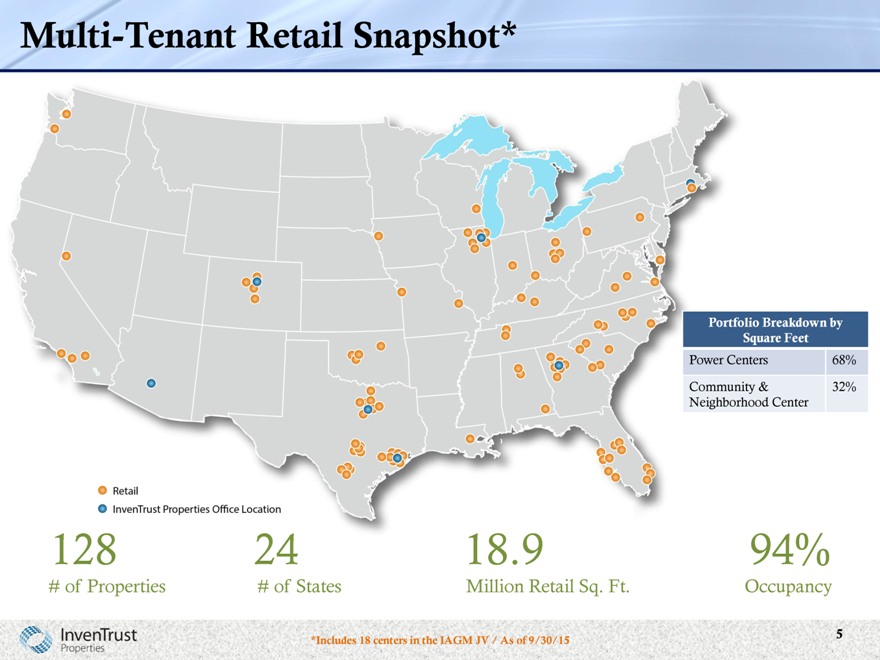
Multi-Tenant Retail Snapshot*
Portfolio Breakdown by
Square Feet
Power Centers 68%
Community & 32%
Neighborhood
Center
128 24 18.9 94%
# of Properties # of States Million Retail Sq. Ft. Occupancy
*Includes 18 centers in the IAGM JV / As of 9/30/15
5
|
|
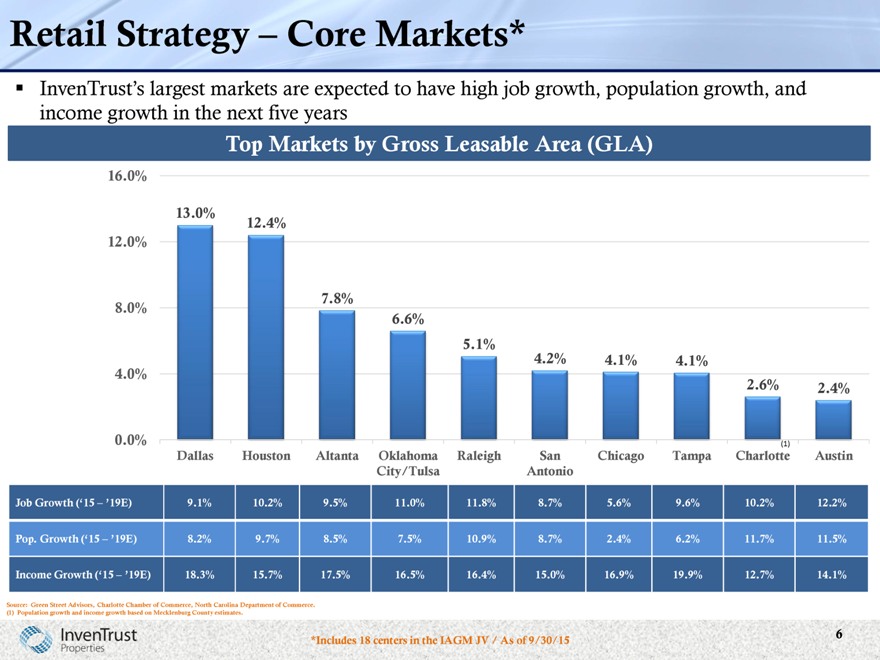
Retail Strategy – Core Markets*
InvenTrust’s largest markets are expected to have high job growth, population growth, and income growth in the next five years
Top Markets by Gross Leasable Area (GLA)
16.0%
13.0%
12.4%
12.0%
7.8%
8.0%
6.6%
5.1%
4.2% 4.1% 4.1%
4.0%
2.6% 2.4%
0.0% (1)
Dallas Houston Altanta Oklahoma Raleigh San Chicago Tampa Charlotte Austin
City/Tulsa Antonio
Job Growth (‘15 – ’19E) 9.1% 10.2% 9.5% 11.0% 11.8% 8.7% 5.6% 9.6% 10.2% 12.2%
Pop. Growth (‘15 – ’19E) 8.2% 9.7% 8.5% 7.5% 10.9% 8.7% 2.4% 6.2% 11.7% 11.5%
Income Growth (‘15 –
18.3% 15.7% 17.5% 16.5% 16.4% 15.0% 16.9% 19.9% 12.7% 14.1%
’19E)
Source: Green Street Advisors, Charlotte Chamber of Commerce, North Carolina Department of Commerce. (1) Population growth and income growth based on Mecklenburg County estimates.
*Includes 18 centers in the IAGM JV / As of 9/30/15
6
|
|
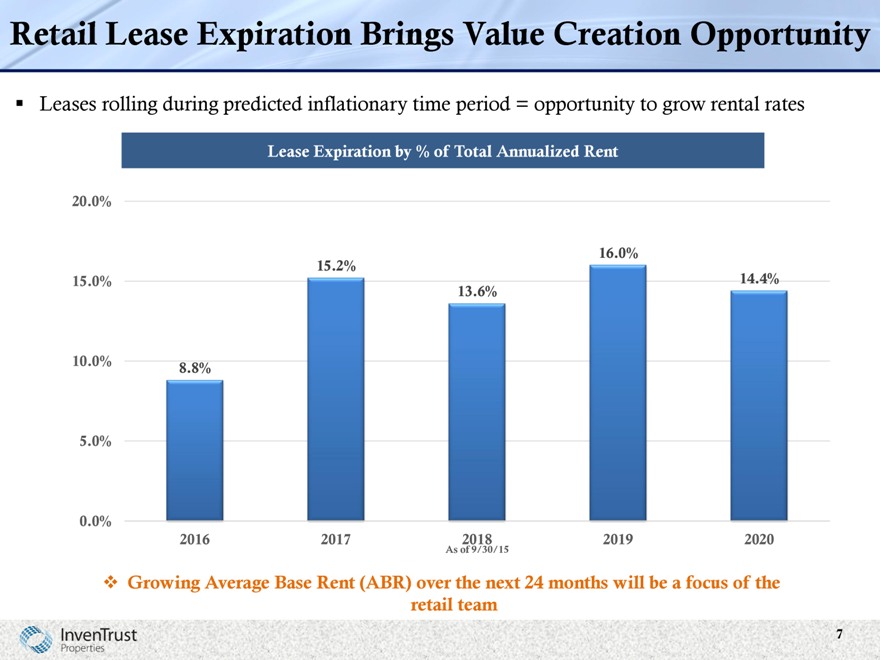
Retail Lease Expiration Brings Value Creation Opportunity
Leases rolling during predicted inflationary time period = opportunity to grow rental rates
Lease Expiration by % of Total Annualized Rent
20.0%
16.0%
15.2%
15.0% 14.4%
13.6%
10.0% 8.8%
5.0%
0.0%
2016 2017 2018 2019 2020
As of 9/30/15
Growing Average Base Rent (ABR) over the next 24 months will be a focus of the retail team
7
|
|
Focus on Deep Tenant Relationships
InvenTrust’s scale and locations in growing vibrant markets promotes favorable relationships with top local and national tenants
8
|
|
University House Platform Strategy
|
|
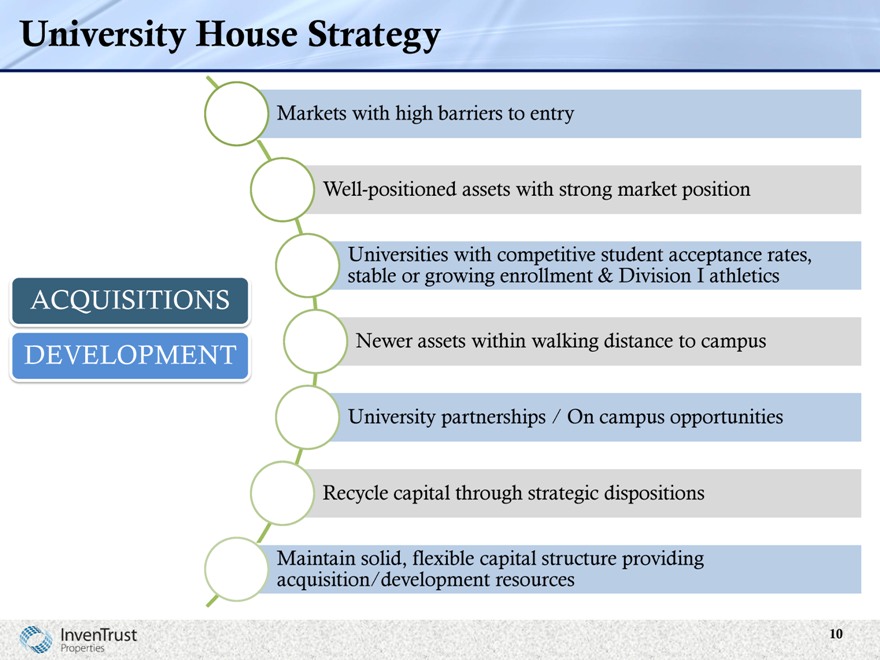
University House Strategy
Markets with high barriers to entry
Well-positioned assets with strong market position
Universities with competitive student acceptance rates, stable or growing enrollment & Division I athletics
Newer assets within walking distance to campus University partnerships / On campus opportunities Recycle capital through strategic dispositions
Maintain solid, flexible capital structure providing acquisition/development resources
ACQUISITIONS
DEVELOPMENT
10
|
|
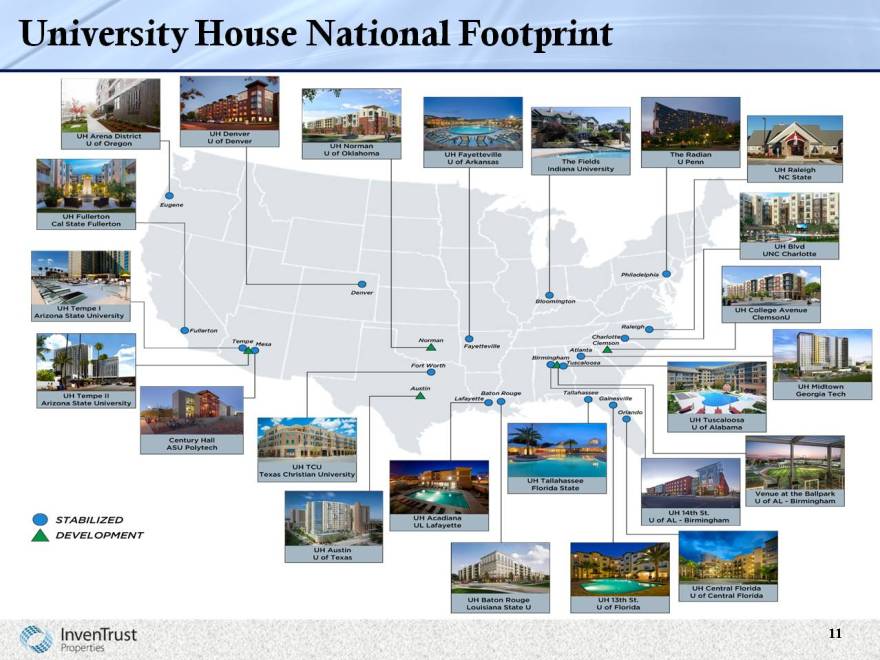
University House National Footprint*
11
|
|
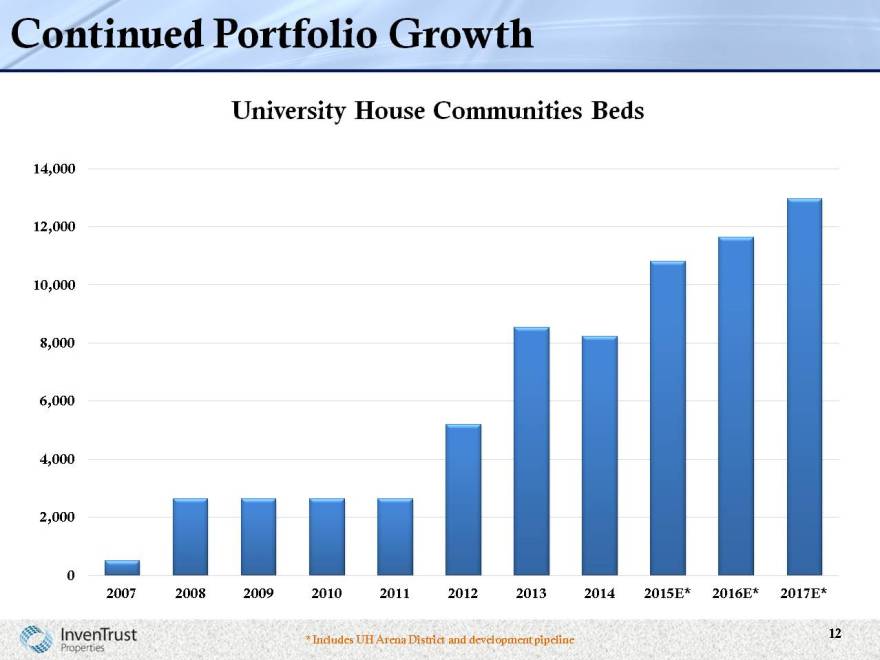
Continued Portfolio Growth
University House Communities Beds
14,000
12,000
10,000
8,000
6,000
4,000
2,000
0
2007 2008 2009 2010 2011 2012 2013 2014 2015* 2016* 2017*
* Includes UH Arena District and development pipeline
12
|
|
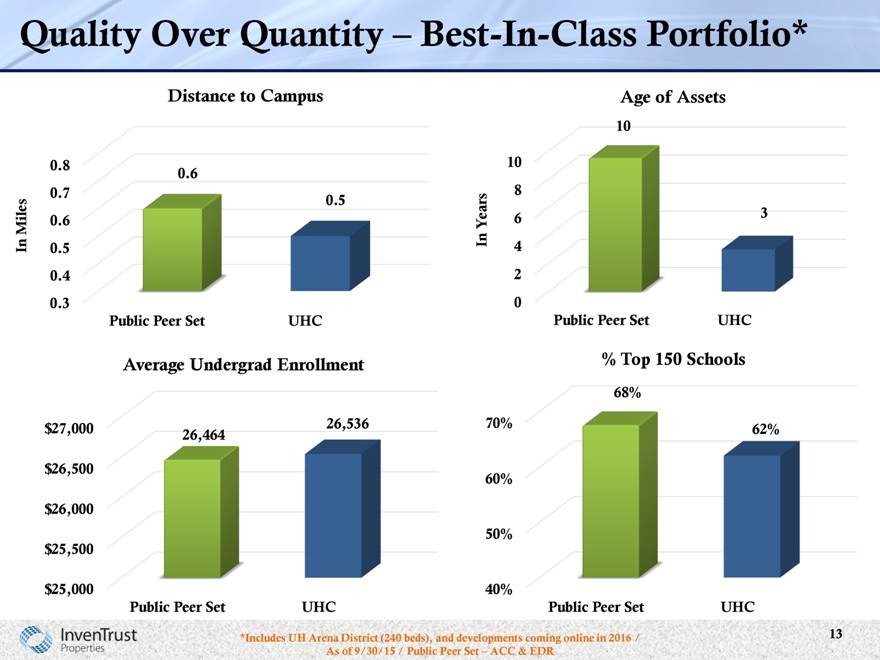
Quality Over Quantity – Best-In-Class Portfolio*
Distance to Campus Age of Assets
10
0.8 10
0.6
0.7 8
0.5
Miles 0.6 Years 6 3
In 0.5 In 4
0.4 2
0.3 0
Public Peer Set UHC Public Peer Set UHC
Average Undergrad Enrollment % Top 150 Schools
68%
$ 27,000 26,536 70% 62%
26,464
$ 26,500
60%
$ 26,000
50%
$ 25,500
$ 25,000 40%
Public Peer Set UHC
Public Peer Set UHC
*Includes UH Arena District (240 beds), and developments coming online in
2016 / As of 9/30/15 / Public Peer Set – ACC & EDR
13
|
|
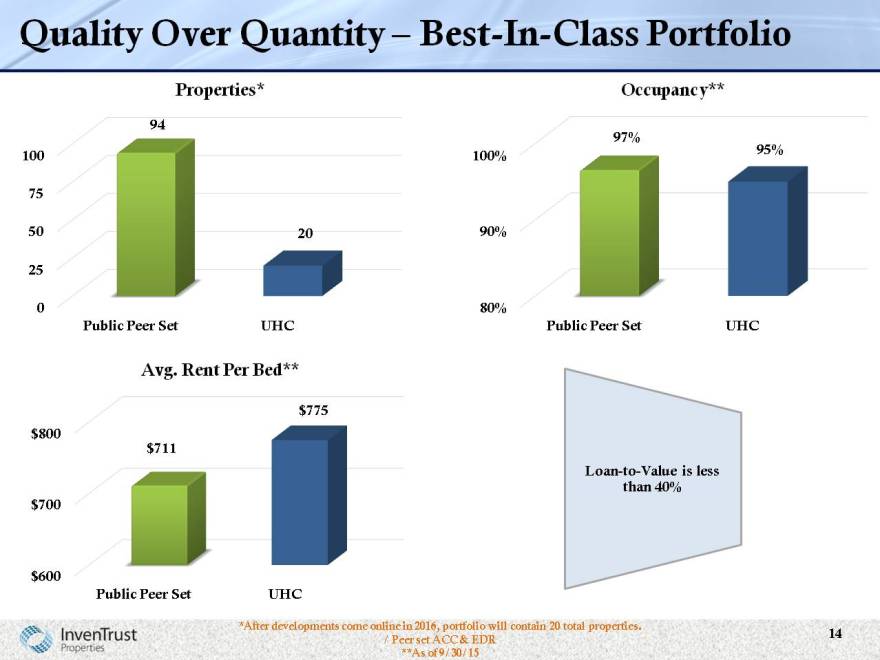
Quality Over Quantity – Best-In-Class Portfolio
Properties* Occupancy**
94
97%
100 100% 95%
75
50 20 90%
25
0 80%
Public Peer Set UHC Public Peer Set UHC
Avg. Rent Per Bed**
$ 775
$ 800
$ 711
Loan-to-Value is less
than 40%
$ 700
$ 600
Public Peer Set UHC
*After developments come online in 2016, portfolio will contain 20 total properties. 14
**As of 9/30/15
|
|
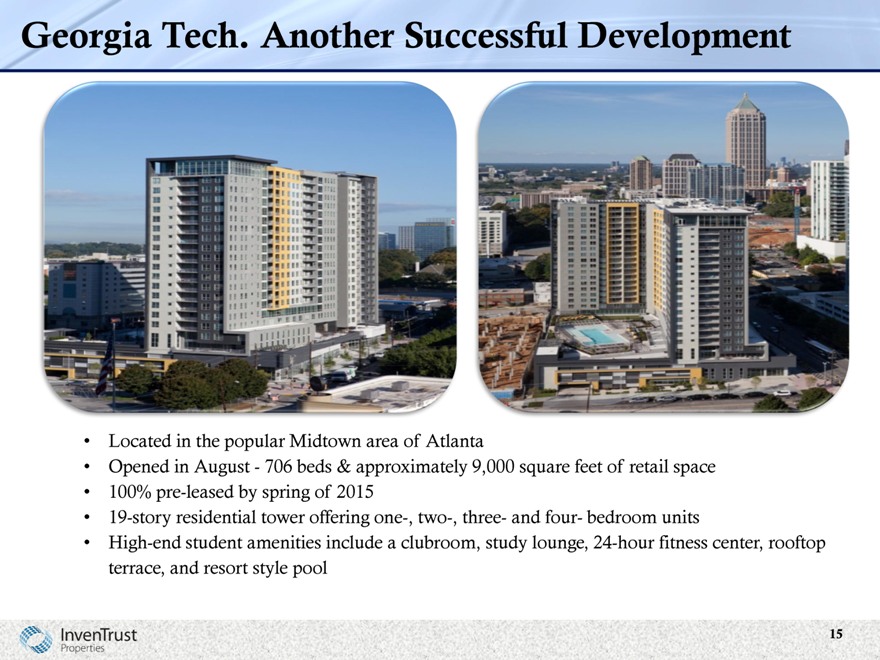
Georgia Tech. Another Successful Development
Located in the popular Midtown area of Atlanta
Opened in August—706 beds & approximately 9,000 square feet of retail space
100% pre-leased by spring of 2015
19-story residential tower offering one-, two-, three- and four- bedroom units
High-end student amenities include a clubroom, study lounge, 24-hour fitness center, rooftop terrace, and resort style pool
15
|
|
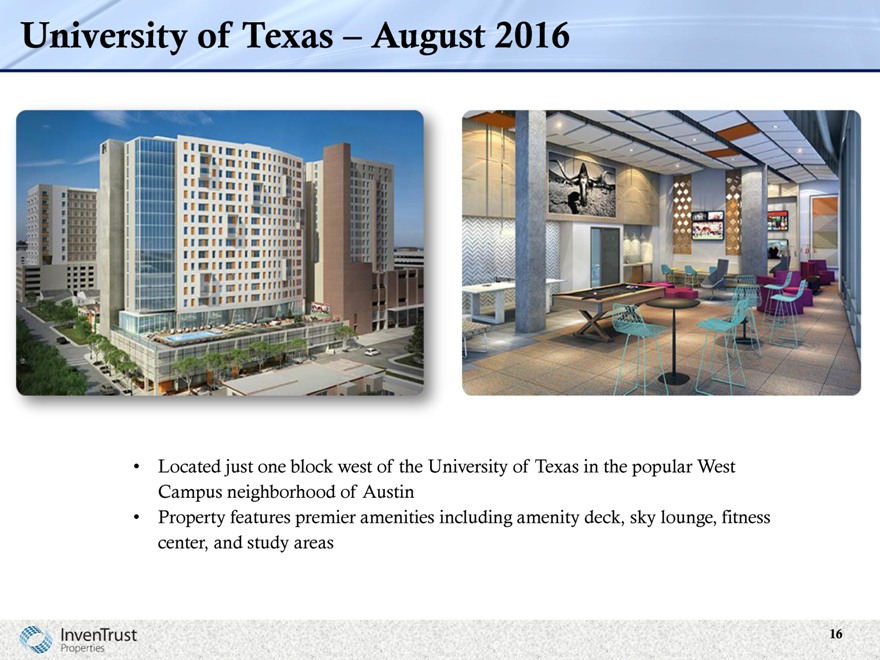
University of Texas – August 2016
Located just one block west of the University of Texas in the popular West Campus neighborhood of Austin
Property features premier amenities including amenity deck, sky lounge, fitness center, and study areas
16
|
|
Capital Allocation Strategies, Balance Sheet Management & Financial Results
|
|
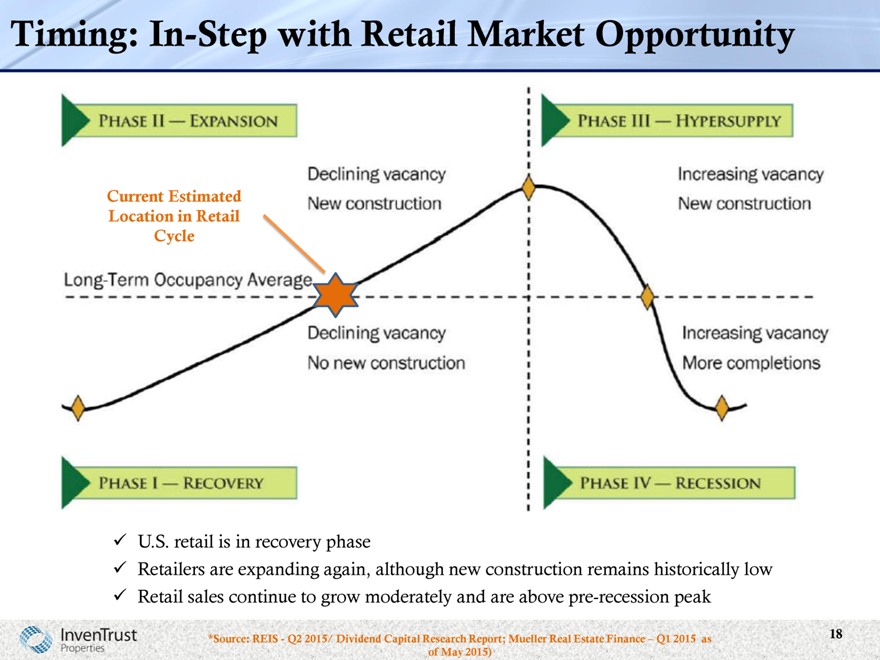
Timing: In-Step with Retail Market Opportunity
Current Estimated Location in Retail Cycle
U.S. retail is in recovery phase
Retailers are expanding again, although new construction remains historically low
Retail sales continue to grow moderately and are above pre-recession peak
*Source: REIS—Q2 2015/ Dividend Capital Research Report; Mueller Real Estate Finance – Q1 2015 as of May 2015)
18
|
|
Multi-Tenant Retail Acquisition Strategies
Open-Air Centers—grocery-anchored centers, necessity-based community centers and power centers
Location, Location, Location
Properties with strong demographics
Job & wage growth Population growth High education rate
Focus on key retail markets
With current competitive environment, we are being strategic and creative when sourcing deals
Investment opportunities exist—retailers continue to place a premium on retail space at premier properties in key locations
19
|
|
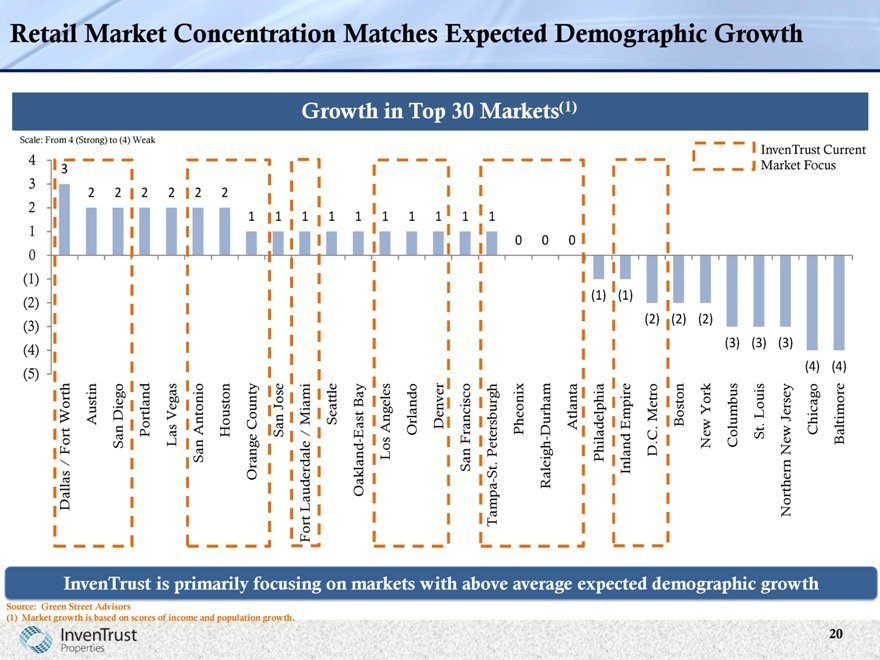
Retail Market Concentration Matches Expected Demographic Growth
(5) (4) (3) (2) (1) 0 1 2 3 4 Scale:
Dallas / Fo rt W orth 3 From
4
Austin 2 (Strong)
San D iego 2
to
P ortlan d 2 (4)
L a s Vegas 2 Weak
San A ntonio 2
H o u ston 2
Orange County 1
Sa n J ose 1
Fort Lauderdale / M iami 1
Seattle 1
Oakland -Ea st Bay 1 Growth
Los A ngeles 1 in
O rlando 1 Top
D enver 1
San F ra ncisco 1 30
Tampa -St. Petersbu rgh 1
Ph eonix 0
Raleigh -Durham 0 Markets
A tlan ta 0 (1)
Philad elphia (1)
Inland Empire (1)
D .C . M etro (2)
Bo sto n (2)
New York (2)
C olum bus (3)
St. Louis (3)
Northern New Jersey (3)
C hica go (4) Focus Market InvenTrust
Baltim ore (4) Current
InvenTrust is primarily focusing on markets with above average expected demographic growth
Source: Green Street Advisors
(1) Market growth is based on scores of income and population growth.
20
|
|
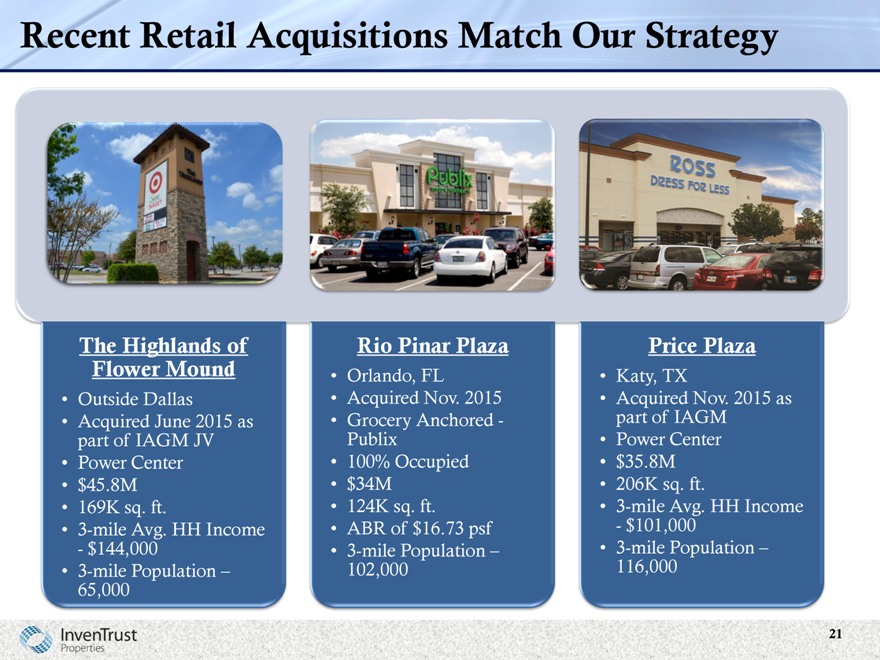
Recent Retail Acquisitions Match Our Strategy
The Highlands of Flower Mound
Outside Dallas
Acquired June 2015 as part of IAGM JV
Power Center
$45.8M
169K sq. ft.
3-mile Avg. HH Income—$144,000
3-mile Population – 65,000
Rio Pinar Plaza
Orlando, FL
Acquired Nov. 2015
Grocery Anchored—Publix
100% Occupied
$34M
124K sq. ft.
ABR of $16.73 psf
3-mile Population – 102,000
Price Plaza
Katy, TX
Acquired Nov. 2015 as part of IAGM
Power Center
$35.8M
206K sq. ft.
3-mile Avg. HH Income—$101,000
3-mile Population – 116,000
21
|
|
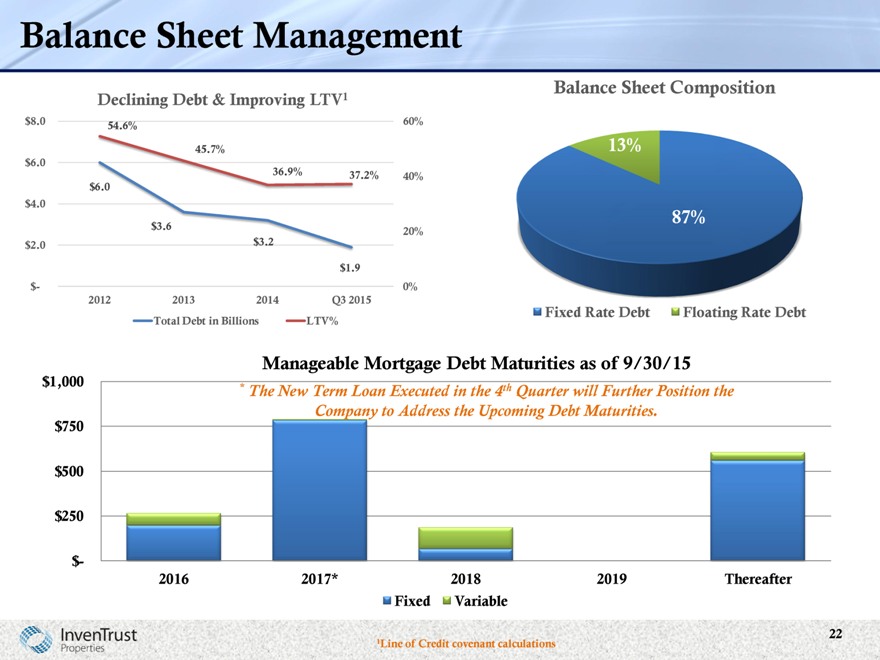
Balance Sheet Management
Declining Debt & Improving LTV1
$8.0 60%
54.6%
45.7%
$6.0
36.9% 37.2% 40%
$6.0
$4.0
$3.6
20%
$2.0 $3.2
$1.9
$- 0%
2012 2013 2014 Q3 2015
Total Debt in Billions LTV%
Balance Sheet Composition
13%
87%
Fixed Rate Debt Floating Rate Debt
Manageable Mortgage Debt Maturities as of 9/30/15
$1,000 * th
The New Term Loan Executed in the 4 Quarter will Further
Position the Company to Address the Upcoming Debt Maturities.
$750
$500
$250
$-
2016 2017* 2018 2019 Thereafter
Fixed Variable
1Line of Credit covenant calculations
22
|
|
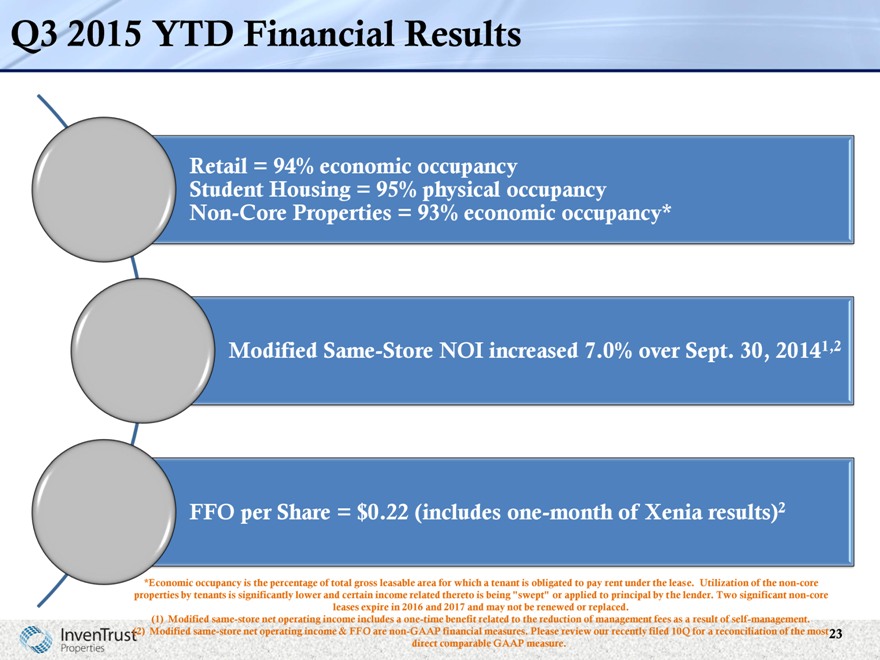
Q3 2015 YTD Financial Results
Retail = 94% economic occupancy
Student Housing = 95% physical occupancy Non-Core Properties = 93% economic occupancy*
Modified Same-Store NOI increased 7.0% over Sept. 30, 20141,2
FFO per Share = $0.22 (includes one-month of Xenia results)2
*Economic occupancy is the percentage of total gross leasable area for which a tenant is obligated to pay rent under the lease. Utilization of the non-core properties by tenants is significantly lower and certain income related thereto is being “swept” or applied to principal by the lender. Two significant non-core leases expire in 2016 and 2017 and may not be renewed or replaced.
(1) Modified same-store net operating income includes a one-time benefit related to the reduction of management fees as a result of self-management. (2) Modified same-store net operating income & FFO are non-GAAP financial measures. Please review our recently filed 10Q for a reconciliation of the most direct comparable GAAP measure.
23
|
|
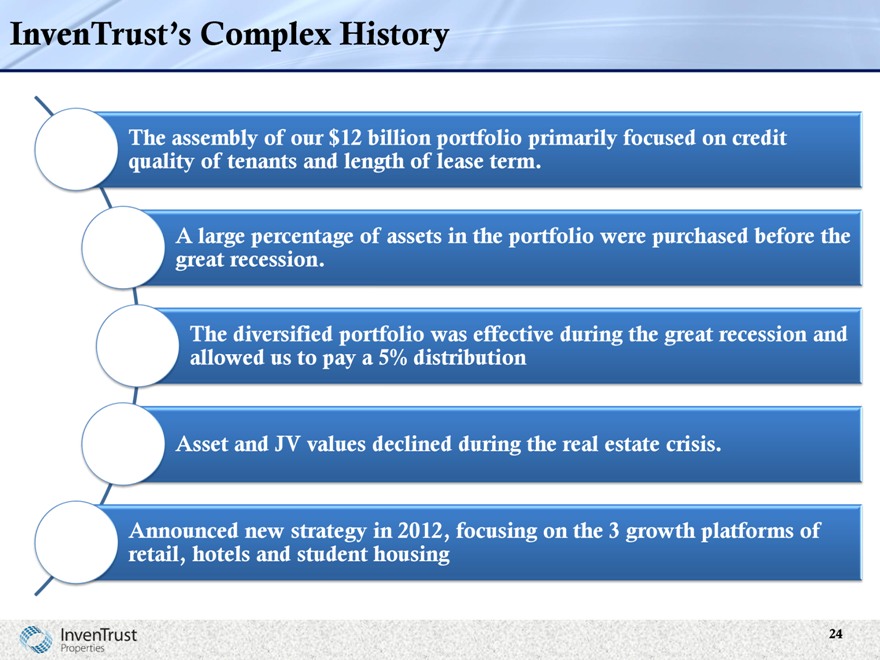
InvenTrust’s Complex History
The assembly of our $12 billion portfolio primarily focused on credit quality of tenants and length of lease term.
A large percentage of assets in the portfolio were purchased before the great recession.
The diversified portfolio was effective during the great recession and allowed us to pay a 5% distribution
Asset and JV values declined during the real estate crisis.
Announced new strategy in 2012, focusing on the 3 growth platforms of retail, hotels and student housing
24
|
|
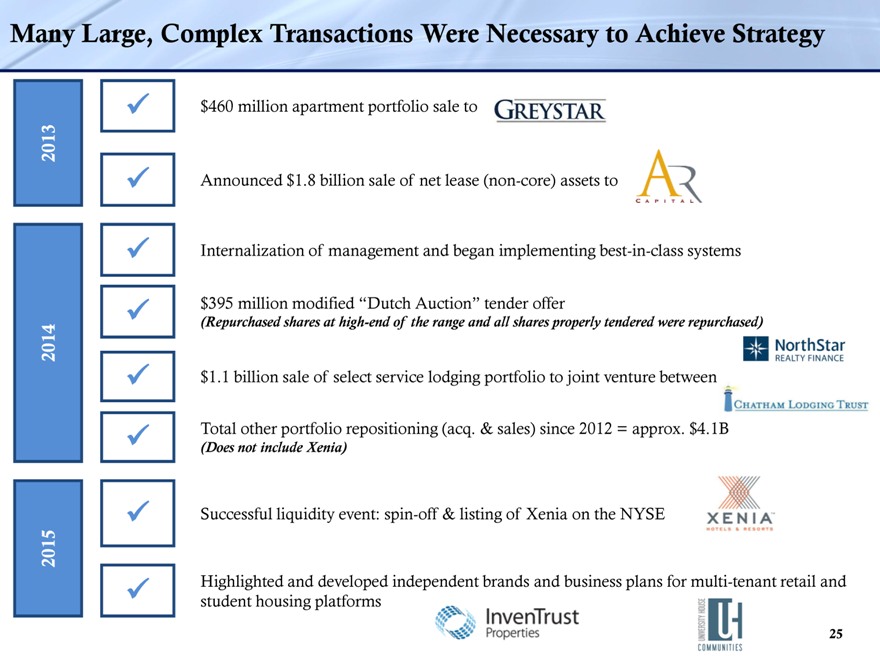
Many Large, Complex Transactions Were Necessary to Achieve Strategy
2015 2014 2013
$460 million apartment portfolio sale to
Announced $1.8 billion sale of net lease (non-core) assets to
Internalization of management and began implementing best-in-class systems
$395 million modified “Dutch Auction” tender offer
(Repurchased shares at high-end of the range and all shares properly tendered were repurchased)
$1.1 billion sale of select service lodging portfolio to joint venture between
Total other portfolio repositioning (acq. & sales) since 2012 = approx. $4.1B
(Does not include Xenia)
Successful liquidity event: spin-off & listing of Xenia on the NYSE
Highlighted and developed independent brands and business plans for multi-tenant retail and student housing platforms
25
|
|
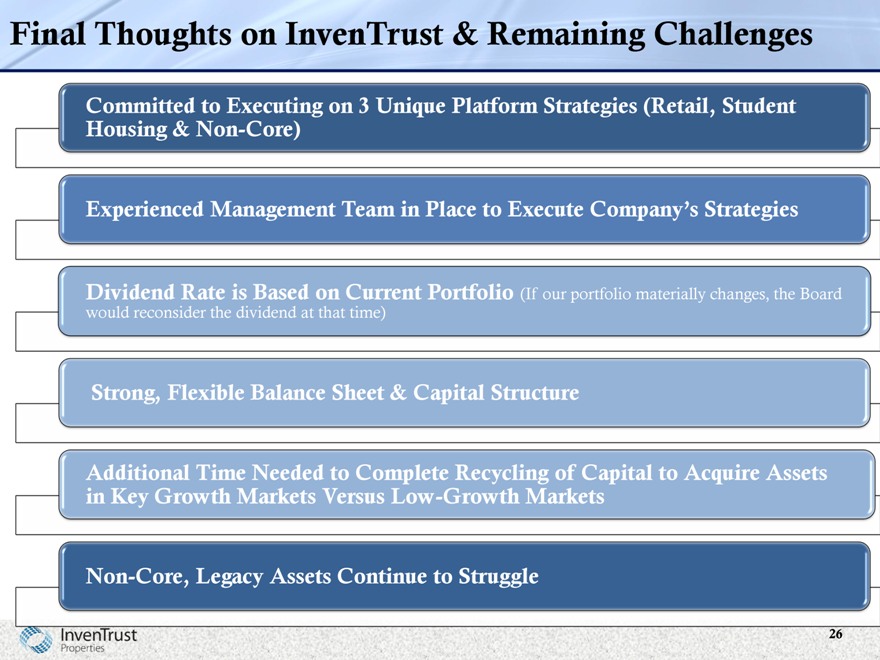
Final Thoughts on InvenTrust & Remaining Challenges
Committed to Executing on 3 Unique Platform Strategies (Retail, Student Housing & Non-Core)
Experienced Management Team in Place to Execute Company’s
Strategies
Dividend Rate is Based on Current Portfolio (If our portfolio materially changes,
the Board would reconsider the dividend at that time)
Strong, Flexible Balance Sheet & Capital Structure
Additional Time Needed to Complete Recycling of Capital to Acquire Assets in Key Growth Markets Versus Low-Growth Markets
Non-Core, Legacy Assets Continue to Struggle
26
|
|

Q&A
|
|

Appendix
|
|
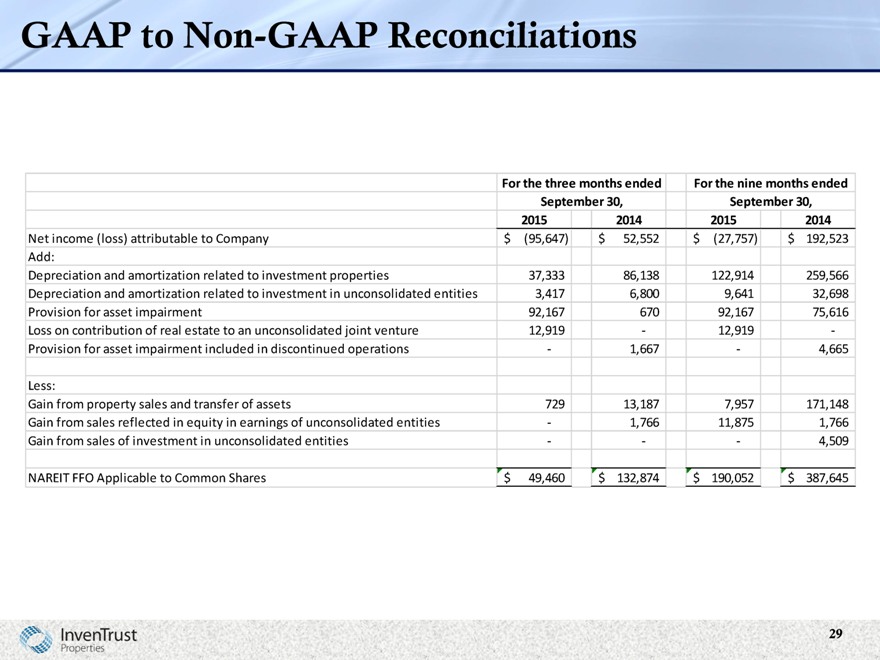
GAAP to Non-GAAP Reconciliations
For the three months ended For the nine months ended
September 30, September 30,
2015 2014 2015 2014
Net income (loss) attributable to Company $ (95,647) $ 52,552 $ (27,757) $ 192,523
Add:
Depreciation and amortization related to investment properties 37,333 86,138 122,914 259,566
Depreciation and amortization related to investment in unconsolidated entities 3,417 6,800 9,641 32,698
Provision for asset impairment 92,167 670 92,167 75,616
Loss on contribution of real estate to an unconsolidated joint venture 12,919 — 12,919 -
Provision for asset impairment included in discontinued operations — 1,667 — 4,665
Less:
Gain from property sales and transfer of assets 729 13,187 7,957 171,148
Gain from sales reflected in equity in earnings of unconsolidated entities — 1,766 11,875 1,766
Gain from sales of investment in unconsolidated entities — — — 4,509
NAREIT FFO Applicable to Common Shares $ 49,460 $ 132,874 $ 190,052 $ 387,645
29