Attached files
| file | filename |
|---|---|
| 8-K - 8-K - O-I Glass, Inc. /DE/ | a15-24752_18k.htm |
Exhibit 99.1
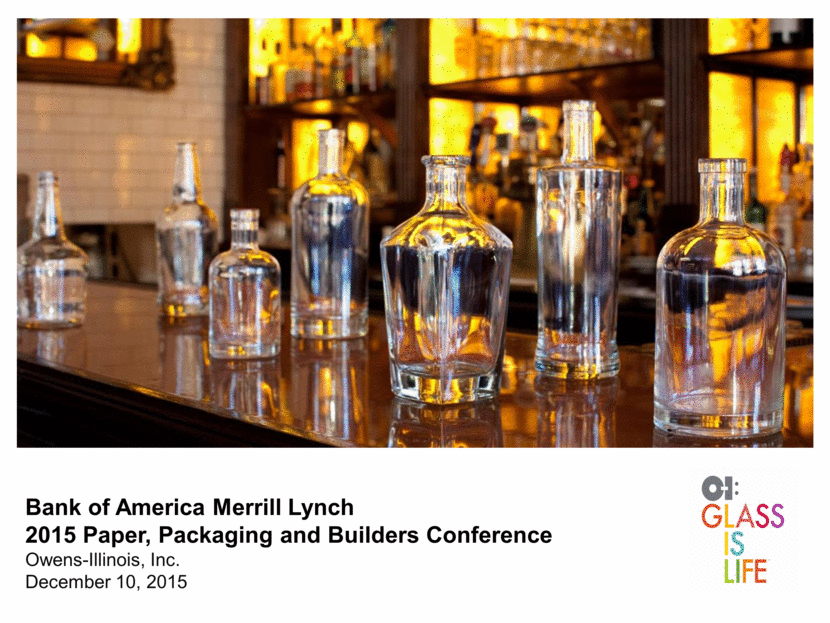
Bank of America Merrill Lynch 2015 Paper, Packaging and Builders Conference Owens-Illinois, Inc. December 10, 2015
Safe harbor comments Regulation G The information presented here regarding adjusted net earnings and adjusted EPS relates to net earnings from continuing operations attributable to the Company exclusive of items management considers not representative of ongoing operations and does not conform to U.S. generally accepted accounting principles (GAAP). In addition, the information presented here regarding EBITDA is not a defined term under GAAP. Non-GAAP measures should not be construed as an alternative to the reported results determined in accordance with GAAP. Management has included this non-GAAP information to assist in understanding the comparability of results of ongoing operations. Further, the information presented here regarding free cash flow does not conform to GAAP. Management defines free cash flow as cash provided by continuing operating activities less capital spending (both as determined in accordance with GAAP) and has included this non-GAAP information to assist in understanding the comparability of cash flows. Management uses non-GAAP information principally for internal reporting, forecasting, budgeting and calculating compensation payments. Management believes that the non-GAAP presentation allows the board of directors, management, investors and analysts to better understand the Company’s financial performance in relationship to core operating results and the business outlook. Forward Looking Statements This document contains "forward-looking" statements within the meaning of Section 21E of the Securities Exchange Act of 1934 and Section 27A of the Securities Act of 1933. Forward-looking statements reflect the Company's current expectations and projections about future events at the time, and thus involve uncertainty and risk. The words "believe," "expect," "anticipate," "will," "could," "would," "should," "may," "plan," "estimate," "intend," "predict," "potential," "continue," and the negatives of these words and other similar expressions generally identify forward looking statements. It is possible the Company's future financial performance may differ from expectations due to a variety of factors including, but not limited to the following: (1) the Company's ability to integrate the Vitro Business in a timely and cost effective manner, to maintain on existing terms the permits, licenses and other approvals required for the Vitro Business to operate as currently operated, and to realize the expected synergies from the Vitro Acquisition, (2) risks related to the impact of integration of the Vitro Acquisition on earnings and cash flow, (3) risks associated with the significant transaction costs and additional indebtedness that the Company expects to incur in financing the Vitro Acquisition, (4) the Company's ability to realize expected growth opportunities and cost savings from the Vitro Acquisition, (5) foreign currency fluctuations relative to the U.S. dollar, specifically the Euro, Brazilian real, Mexican peso, Colombian peso and Australian dollar, (6) changes in capital availability or cost, including interest rate fluctuations and the ability of the Company to refinance debt at favorable terms, (7) the general political, economic and competitive conditions in markets and countries where the Company has operations, including uncertainties related to economic and social conditions, disruptions in capital markets, disruptions in the supply chain, competitive pricing pressures, inflation or deflation, and changes in tax rates and laws, (8) consumer preferences for alternative forms of packaging, (9) cost and availability of raw materials, labor, energy and transportation, (10) the Company's ability to manage its cost structure, including its success in implementing restructuring plans and achieving cost savings, (11) consolidation among competitors and customers, (12) the ability of the Company to acquire businesses and expand plants, integrate operations of acquired businesses and achieve expected synergies, (13) unanticipated expenditures with respect to environmental, safety and health laws, (14) the Company's ability to further develop its sales, marketing and product development capabilities, and (15) the timing and occurrence of events which are beyond the control of the Company, including any expropriation of the Company's operations, floods and other natural disasters, events related to asbestos-related claims, and the other risk factors discussed in the Company's Annual Report on Form 10-K for the year ended December 31, 2014 and any subsequently filed Quarterly Report on Form 10-Q. It is not possible to foresee or identify all such factors. Any forward-looking statements in this document are based on certain assumptions and analyses made by the Company in light of its experience and perception of historical trends, current conditions, expected future developments, and other factors it believes are appropriate in the circumstances. Forward-looking statements are not a guarantee of future performance and actual results or developments may differ materially from expectations. While the Company continually reviews trends and uncertainties affecting the Company's results of operations and financial condition, the Company does not assume any obligation to update or supplement any particular forward-looking statements contained in this document. Presentation Note Unless otherwise noted, the information presented in this presentation reflects continuing operations only. 1
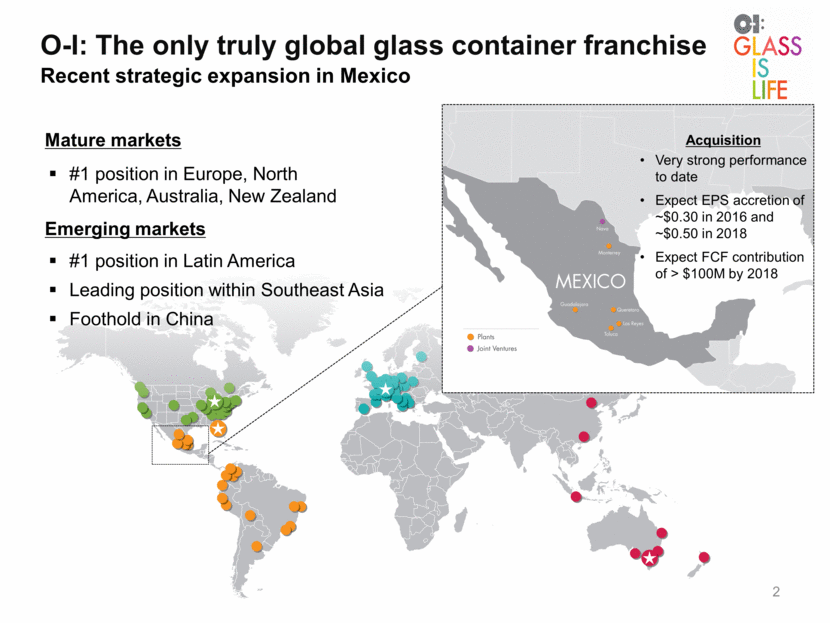
2 O-I: The only truly global glass container franchise Recent strategic expansion in Mexico #1 position in Europe, North America, Australia, New Zealand Mature markets Emerging markets #1 position in Latin America Leading position within Southeast Asia Foothold in China Acquisition Very strong performance to date Expect EPS accretion of ~$0.30 in 2016 and ~$0.50 in 2018 Expect FCF contribution of > $100M by 2018
Diversified portfolio provides opportunity Trends are supportive of glass 3 Glass continues to be relevant in rigid packaging Premiumization trends favor glass Returnable glass containers are most economic package in emerging and growing economies Growing focus on healthier lifestyles and organic foods well served by glass packaging Globally, glass container market continues to grow O-I volume O-I positioning Beer 38% Focus on faster growing craft, premium, returnables and North America mid-tier imports Wine 23% Capitalize on best footprint in Europe; Leverage NA O-I Packaging Solutions Food 15% Harness premiumization trends NAB 14% Returnables in emerging mkts; Premium products in NA and EU Spirits 10% Growth of craft products Total 100% Focus on flexibility benefits all categories; Focus on premium
Partnering with blue chip companies 4 Long history of collaboration Business under long-term contract Limited geographical overlap ABI packaging benefits glass Premium products and innovation Returnables in emerging mkts ABI to divest MillerCoors ABI and SABMiller each < 5% of O-I sales ABI acquisition of SABM
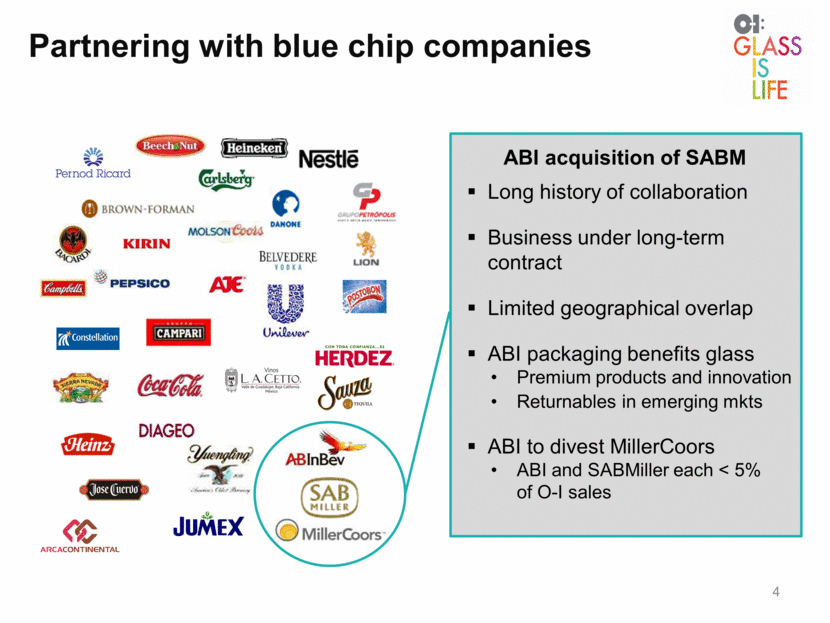
Craft spirits Single vineyard wine Craft and imported beer Specialty juices Iced coffee and teas Craft soda Still and sparkling water Premium and specialty foods Private brands for premium products Emerging trends provide opportunity for glass packaging 5
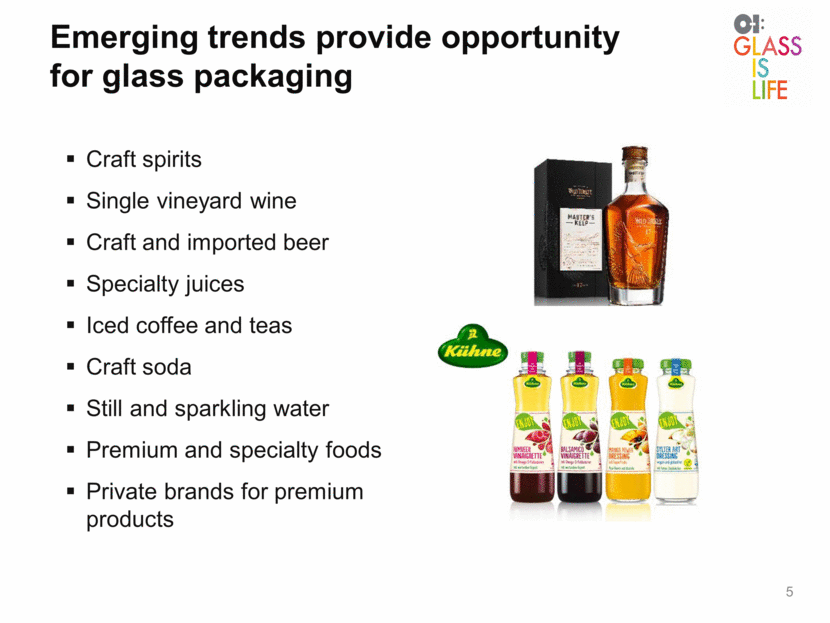
Consistent end-market demand trends 6 Europe Stable end markets Exports outperform domestic demand Selective growth opportunities Asia Pacific Overall demand stabilization in mature markets, with uptick in wine exports Mid single-digit growth in China & SEA North America Growth in wine, spirits, premium food and non-alcoholic beverages Strategic participation in fast growing mid-tier imported and craft beer Latin America Returnables: strategic packaging choice Attractive growth in Mexico and Andean region; uncertainty in Brazil Source: Euromonitor and Company estimates
Executing on our strategy 7 Demonstrating stability Reducing asset disruptions Stabilizing supply chain in all four regions Recent actions Strengthened asset advancement program Added Mexico to footprint Established new strategy and integration organization Completed redesign of global leadership team
8 Higher adj. EPS and FCF expected in 2016 Operational tailwinds more than offset non-operational headwinds 1Q16 adjusted EPS likely to be modestly higher than PY in constant currency Tailwinds: Operational Accretive investments (O-I Mexico, JV with CBI) Improved business performance End to end supply chain Discretionary spending controls, driven by enterprise priorities Modest increase in demand Headwinds: Non-operational External: Strong USD impact of $0.20 - $0.25, primarily in 1H16 vs. PY Forward libor curve implies higher interest rates Internal: Higher effective tax rate (~27%); corporate expense of ~$90M
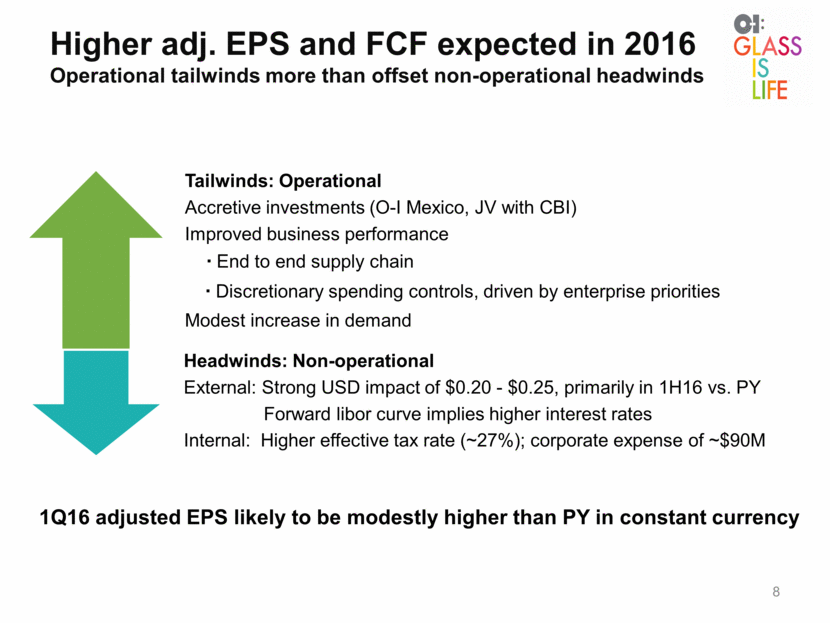
Capital structure Deleveraging is a key priority 9 Managing debt structure Early repayment of 7.375% notes due in 2016 Acquisition-related debt at ~4.2% blended rate Capital allocation priorities Continue to invest in organic growth Deleverage Expected and temporary uptick in leverage ratio Covenant allows for 4.5x for four quarters following acquisition Target ~3 times net debt to EBITDA by 2018
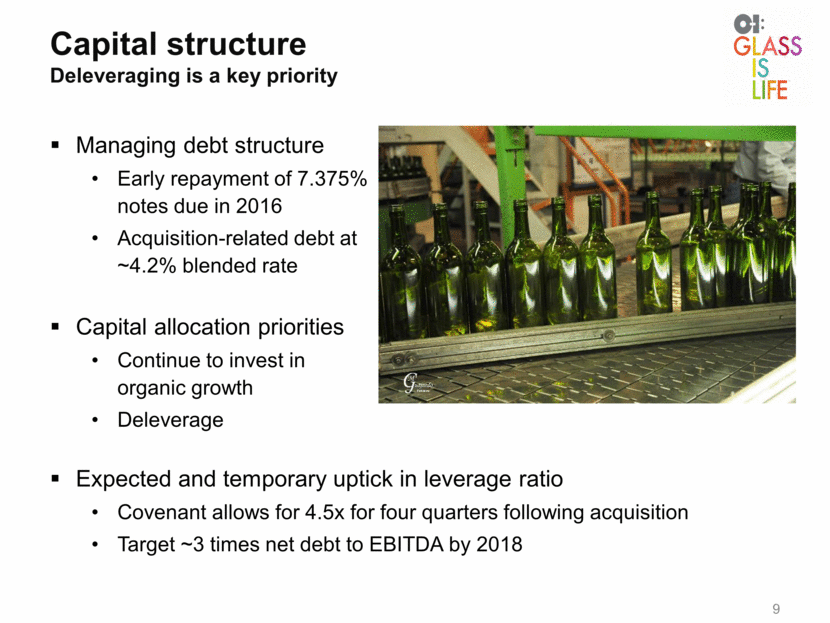
Enhancing shareholder value 10 Competitive Advantage Stable End Markets Global presence Unparalleled expertise Steady glass demand Consumer preference for glass Strategic Imperatives Consistent Financial Performance Balanced Capital Allocation End to end supply chain performance Successful integration of acquisitions New business development & brand-building innovation Long-term investments in R&D and technology Adjusted earnings Free cash flow Return on invested capital Prudently invest in the business Deleverage Return value to shareholders Long-term Shareholder Value
Appendix 11
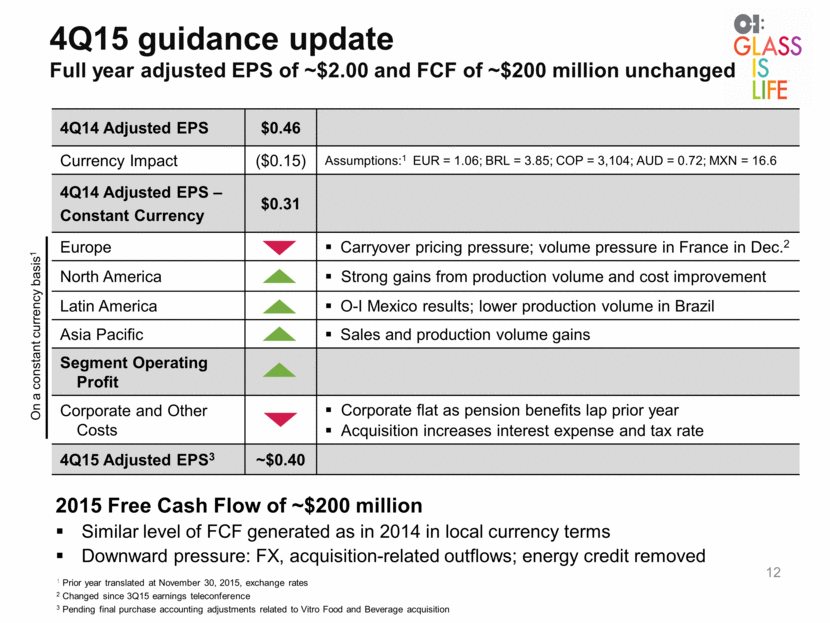
4Q15 guidance update Full year adjusted EPS of ~$2.00 and FCF of ~$200 million unchanged 12 4Q14 Adjusted EPS $0.46 Currency Impact ($0.15) Assumptions:1 EUR = 1.06; BRL = 3.85; COP = 3,104; AUD = 0.72; MXN = 16.6 4Q14 Adjusted EPS – Constant Currency $0.31 Europe Carryover pricing pressure; volume pressure in France in Dec.2 North America Strong gains from production volume and cost improvement Latin America O-I Mexico results; lower production volume in Brazil Asia Pacific Sales and production volume gains Segment Operating Profit Corporate and Other Costs Corporate flat as pension benefits lap prior year Acquisition increases interest expense and tax rate 4Q15 Adjusted EPS3 ~$0.40 1 Prior year translated at November 30, 2015, exchange rates 2 Changed since 3Q15 earnings teleconference 3 Pending final purchase accounting adjustments related to Vitro Food and Beverage acquisition On a constant currency basis1 2015 Free Cash Flow of ~$200 million Similar level of FCF generated as in 2014 in local currency terms Downward pressure: FX, acquisition-related outflows; energy credit removed
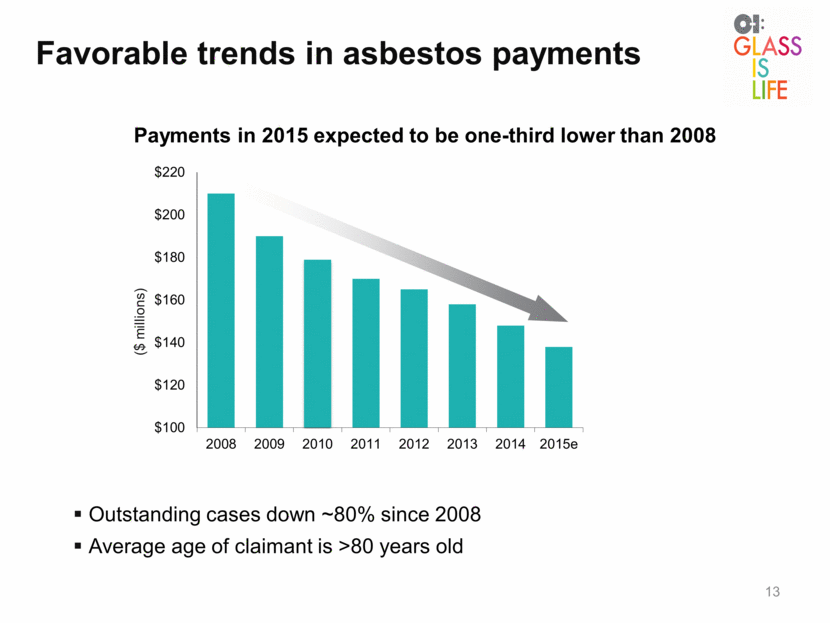
Favorable trends in asbestos payments Outstanding cases down ~80% since 2008 Average age of claimant is >80 years old Payments in 2015 expected to be one-third lower than 2008 13 $100 $120 $140 $160 $180 $200 $220 2008 2009 2010 2011 2012 2013 2014 2015e ($ millions)
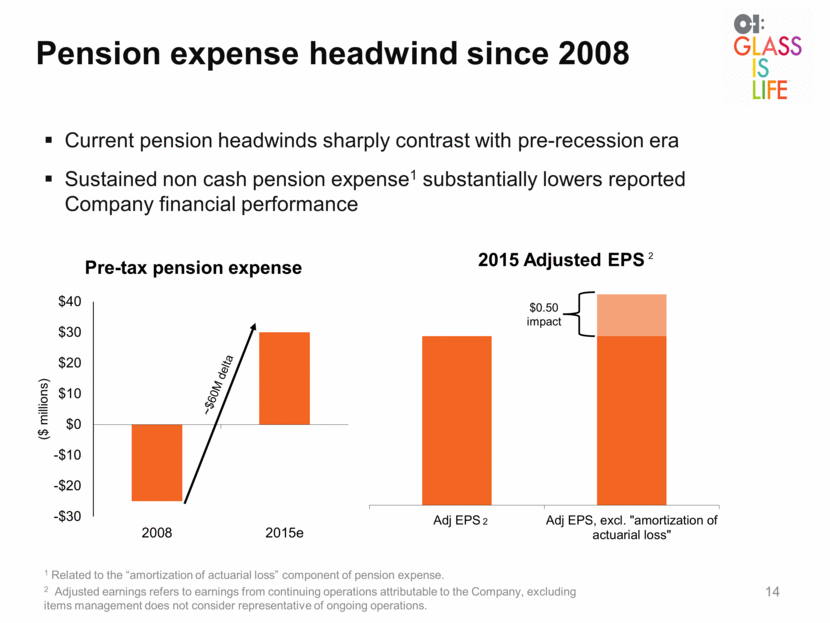
Pension expense headwind since 2008 Current pension headwinds sharply contrast with pre-recession era Sustained non cash pension expense1 substantially lowers reported Company financial performance 1 Related to the “amortization of actuarial loss” component of pension expense. 2 Adjusted earnings refers to earnings from continuing operations attributable to the Company, excluding items management does not consider representative of ongoing operations. ~$60M delta $0.50 impact 14 2 2 Adj EPS Adj EPS, excl. "amortization of actuarial loss" 2015 Adjusted EPS
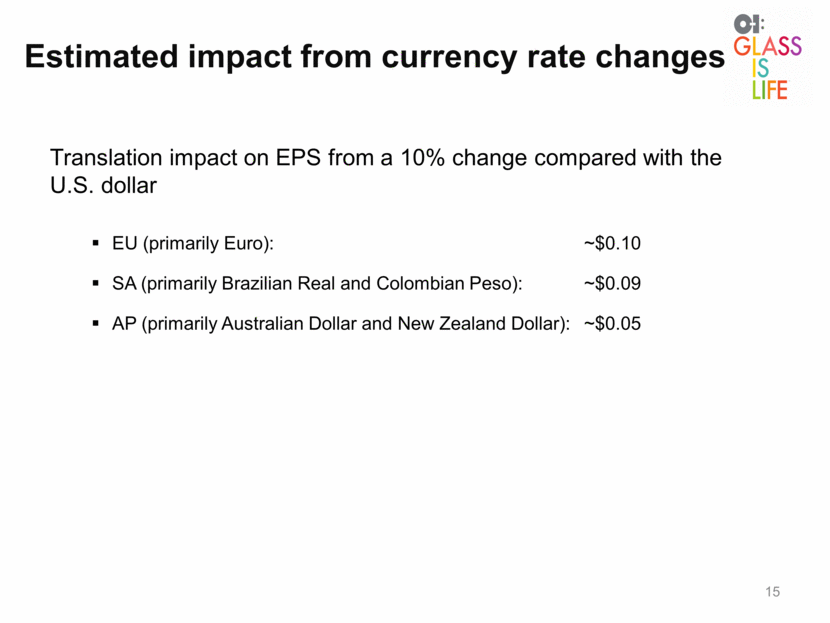
Estimated impact from currency rate changes 15 Translation impact on EPS from a 10% change compared with the U.S. dollar EU (primarily Euro): ~$0.10 SA (primarily Brazilian Real and Colombian Peso): ~$0.09 AP (primarily Australian Dollar and New Zealand Dollar): ~$0.05
