Attached files
| file | filename |
|---|---|
| 8-K - FORM 8-K - KBS Real Estate Investment Trust, Inc. | kbsri8k.htm |

KBS REIT I Valuation & Portfolio Update December 10, 2015 1 Exhibit 99.1

Forward-Looking Statements The information contained herein should be read in conjunction with, and is qualified by, the information in KBS Real Estate Investment Trust’s (“KBS REIT I”) Annual Report on Form 10-K for the year ended December 31, 2014, filed with the Securities and Commission Exchange (the “SEC”) on March 10, 2015, and in KBS REIT I’s Quarterly Report on Form 10-Q for the period ended September 30, 2015, filed with the SEC on November 12, 2015, including the “Risk Factors” contained in such filings. For a full description of the limitations, methodologies and assumptions used to value KBS REIT I’s assets and liabilities in connection with the calculation of KBS REIT I’s estimated value per share, see KBS REIT I’s Current Report on Form 8-K, filed with the SEC on December 10, 2015. Forward-Looking Statements Certain statements contained herein may be deemed to be forward-looking statements within the meaning of the Federal Private Securities Litigation Reform Act of 1995. KBS REIT I intends that such forward-looking statements be subject to the safe harbors created by Section 27A of the Securities Act of 1933, as amended, and Section 21E of the Securities Exchange Act of 1934, as amended. These statements include statements regarding the intent, belief or current expectations of KBS REIT I and members of its management team, as well as the assumptions on which such statements are based, and generally are identified by the use of words such as “may,” “will,” “seeks,” “anticipates,” “believes,” “estimates,” “expects,” “plans,” “intends,” “should” or similar expressions. Further, forward-looking statements speak only as of the date they are made, and KBS REIT I undertakes no obligation to update or revise forward-looking statements to reflect changed assumptions, the occurrence of unanticipated events or changes to future operating results over time, unless required by law. Actual results may differ materially from those contemplated by such forward- looking statements. The appraisal methodology for KBS REIT I’s appraised real estate properties assumes the properties realize the projected net operating income and expected exit cap rates and that investors would be willing to invest in such properties at yields equal to the expected discount rates. Though the valuation estimates used in calculating the estimated value per share are Duff & Phelps’ and/or KBS REIT I’s and KBS Capital Advisors LLC’s (“the Advisor”) best estimates, KBS REIT I can give no assurance in this regard. Forward-looking statements also depend on factors such as: future economic, competitive and market conditions; KBS REIT I’s ability to maintain occupancy levels and lease rates at its real estate properties; the borrowers under KBS REIT I’s loan investments continuing to make required payments under the loan documents; KBS REIT I’s ability to sell real estate properties at the times and at the prices it expects; the ability of certain borrowers to maintain occupancy levels and lease rates at the properties securing KBS REIT I’s real estate-related investments; KBS REIT I’s ability to successfully negotiate modifications, extensions or refinancings of its debt obligations; the ability of KBS REIT I to make strategic asset sales to make required amortization payments and principal payments on its debt obligations and to fund its short and long-term liquidity needs; KBS REIT I’s ability to successfully operate and sell the GKK properties given current economic conditions and the concentration of the GKK properties in the financial services sector; the significant debt obligations KBS REIT I has assumed with respect to the GKK properties; the Advisor’s limited experience operating and selling bank branch properties; and other risks identified in Part I, Item IA of KBS REIT I’s Annual Report on Form 10-K for the year ended December 31, 2014 and in Part II, Item IA of KBS REIT I’s Quarterly Report on Form 10-Q for the period ended September 30, 2015, each as filed with the SEC. Actual events may cause the value and returns on KBS REIT I’s investments to be less than that used for purposes of KBS REIT I’s estimated value per share. 2

• KBS REIT I followed the IPA Valuation Guidelines, which included independent third-party appraisals of 12 of its historical real estate properties and 350 GKK properties. Property values for properties held, and not under contract to sell, as of December 8, 2015 are equal to their appraised values as of September 30, 2015, and property values for properties sold from October 1, 2015 to December 8, 2015, or under contract to sell as of December 8, 2015, are equal to the contractual sales prices less actual or estimated disposition costs and fees. • Real estate-related investments, cash, other assets, mortgage debt and other liabilities were valued by the Advisor, similar to prior valuations. The estimated values of the real estate-related investments and mortgage debt are equal to the GAAP fair values as disclosed in the footnotes to KBS REIT I’s 10-Q for the period ended September 30, 2015. • The estimated value per share as of December 8, 2015 is based on the estimated value of the REIT’s assets less the estimated value of the REIT’s liabilities divided by the number of shares outstanding, as of September 30, 2015, with the exception of an adjustment to KBS REIT I’s net asset value (“NAV”) to give effect to the special distribution of $0.25 per share to stockholders of record as of the close of business on December 1, 2015. • Duff & Phelps primarily used a 10-year discounted cash flow (“DCF”) valuation method for the appraised historical properties, and direct capitalization, DCF and present value of cash flow valuation methods for the appraised GKK properties. • KBS REIT I currently expects to update the estimated value per share no later than December 2016. It expects to utilize an independent valuation firm or the Advisor for such valuation. Valuation Information 3 Third Party Valuation

Valuation Summary Estimated Value of Portfolio 12/8/151 12/9/142 Assets: $1.383 Billion3 $1.625 Billion4 GKK Properties $637.6 Million (46%) $730.8 Million (45%) 378 Assets 394 Assets Historical Real Estate $551.4 Million (40%) $683.2 Million (42%)5 13 Assets 15 Assets5 Historical Real Estate-Related $24.5 Million (2%) $25.3 Million (2%) Investments 4 Assets 4 Assets Other Assets6 $169.7 Million (12%) $185.8 Million (11%) Liabilities: $600.2 Million $773.9 Million Mortgage and other debt: $547.1 Million $726.0 Million Other Liabilities7: $53.1 Million $47.9 Million Net Equity at Estimated Value: $783.0 Million $851.2 Million Distributions Paid December 7, 2015 ($46.7 Million) Net Equity at Estimated Value After Distribution $736.3 Million 4 1Based on data as of September 30, 2015. 2 Based on data as of September 30, 2014. 3Includes properties held as of September 30, 2015, some of which were sold or transferred prior to December 8, 2015. 4Includes properties held for sale and non-sale disposition as of September 30, 2014, some of which were sold or transferred prior to December 9, 2014. 5Includes unconsolidated joint venture participation and Tribeca. 6Includes cash and cash equivalents, restricted cash, rents and other receivables, deposits and prepaid expenses as applicable. 7Includes accounts payable, accrued liabilities, security deposits, contingent liabilities and prepaid rent.

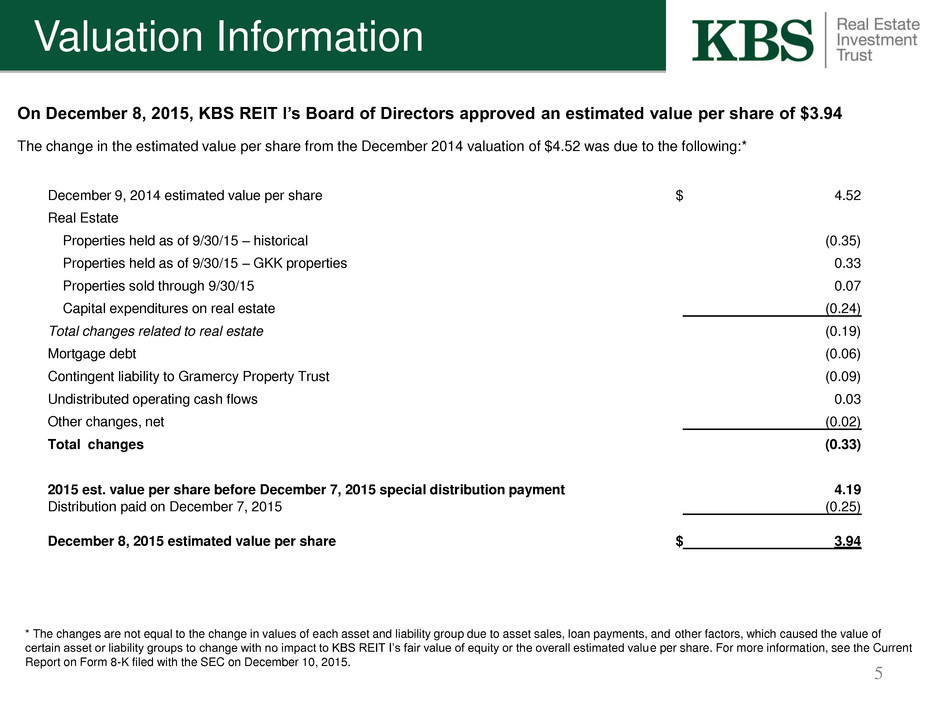
On December 8, 2015, KBS REIT I’s Board of Directors approved an estimated value per share of $3.94 The change in the estimated value per share from the December 2014 valuation of $4.52 was due to the following:* Valuation Information 5 * The changes are not equal to the change in values of each asset and liability group due to asset sales, loan payments, and other factors, which caused the value of certain asset or liability groups to change with no impact to KBS REIT I’s fair value of equity or the overall estimated value per share. For more information, see the Current Report on Form 8-K filed with the SEC on December 10, 2015. December 9, 2014 estimated value per share $ 4.52 Real Estate Properties held as of 9/30/15 – historical (0.35) Properties held as of 9/30/15 – GKK properties 0.33 Properties sold through 9/30/15 0.07 Capital expenditures on real estate (0.24) Total changes related to real estate (0.19) Mortgage debt (0.06) Contingent liability to Gramercy Property Trust (0.09) Undistributed operating cash flows 0.03 Other changes, net (0.02) Total changes (0.33) 2015 est. value per share before December 7, 2015 special distribution payment 4.19 Distribution paid on December 7, 2015 (0.25) December 8, 2015 estimated value per share $ 3.94

Overview Offering Price: $10.00 Valuation History: – November 20091 $7.17 – December 20102 $7.32 – March 20123 $5.16 – December 20124 $5.18 – December 20135 $4.45 after $0.395/share cash distribution paid 12/5/13 – December 20146 $4.52 – December 20157 $3.94 after $0.25/share cash distribution paid 12/7/15 Distribution History (Record Dates) – 7/18/06 – 6/30/09 (36 Payments): $0.70/share on an annualized basis – 7/1/09 – 2/28/12 (32 Payments): $0.525/share on an annualized basis – 11/8/13 (1 Payment): $0.395/share as a one-time distribution paid 12/5/13, as a return of capital – 9/30/14 – 9/30/15 (5 Payments): $0.10/share on an annualized basis (quarterly distributions)8 – 12/1/15 (1 Payment): $0.25/share as a one-time distribution paid 12/7/15 6 1 Data as of 9/30/09. See KBS REIT I’s Current Report on Form 8-K filed with the SEC on November 23, 2009. 2 Data as of 9/30/10. See KBS REIT I’s Current Report on Form 8-K filed with the SEC on December 10, 2010. 3 Data as of 12/31/11. See KBS REIT I’s Current Report on Form 8-K filed with the SEC on March 26, 2012. 4 Data as of 9/30/12. See KBS REIT I’s Current Report on Form 8-K filed with the SEC on December 19, 2012. 5 Data as of 9/30/13, with the exception of real estate appraised as of November 30, 2013. See KBS REIT I’s Current Report on Form 8-K filed with the SEC on December 19, 2013. 6 Data as of 9/30/14. See KBS REIT I’s Current Report on Form 8-K filed with the SEC on December 11, 2014. 7 Data as of 9/30/15. See KBS REIT I’s Current Report on Form 8-K filed with the SEC on December 10, 2015. 8 Distributions paid from September 2014 through September 2015 have been funded with cash flow from operations.

Real Estate Impairments & Updates Woodfield Preserve • Value declined $30.8 million from prior year NAV due to the following: – Lower projections for operating cash flows driven by lower market rents and higher leasing costs – A current lack of investor interest in the Chicago suburbs and this submarket in particular, which led to an increase in the assumed exit capitalization rate and discount rate – Market rents were $14.75 PSF at acquisition and were projected to grow 4.3% per year to $19-$20 PSF in 2015. Rents declined rapidly to $11-$12 PSF during the recession and currently holding steady at $13.50 PSF. – Two significant blocks of space to become available include in two different buildings in the market in the next 12-18 months for a total of 1.2 million SF. Plaza in Clayton • Value declined $8.3 million from prior year NAV due to the following: – Increase in both exit capitalization rate and discount rate due to overall rent roll, which is largely driven by one tenant occupying 61% of the building and will be expiring on December 31, 2022. – Another 9% of the building expires in 2022 and 13% of the building expires in 2020, therefore 83% of the building will expire within a 20-month period. Tysons Dulles • Value declined $6.1 million from prior year NAV due to the following: – Revised projections for lower operating cash flows driven by longer lease-up periods and a continuation of the current elevated leasing costs and concessions. – While the market has seen slight rent growth, the leasing costs and concessions have not declined as quickly as previously expected. – Operating cash flows were also revised for higher capital improvement costs, as building upgrades and deferred maintenance items are needed to position the property competitively and to attract additional tenants. 7

Significant Real Estate Value Changes GKK Properties 8 Sterling Bank The total Sterling Bank portfolio value increased by $6.0 million, which was a 26% increase over the prior year appraised value. This increase included four properties sold since December 2014 with aggregate net sales proceeds of $8.8 million compared to the prior year aggregate appraised value of $7.0 million. BBD2 The total BBD2 portfolio value increased by $58.1 million, which was a 22% increase over the prior year appraised value due to the following: • Properties sold subsequent to September 30, 2015 ($20.7 million increase in value) – valuation based on net sales proceeds: – Waltham increased $19.8 million or 63% over the prior year appraised value (sold in October 2015). – South Orange increased $133,000 or 27% over the prior year appraised value (sold in October 2015). – Nine other properties sold increased $0.8 million or 23% over the prior year appraised value (sold in November 2015). • Properties under contract to sell with hard deposits ($4.4 million increase to NAV) – valuation based on estimated net sales proceeds: – 12 properties are currently under contract to sell with estimated net sales proceeds higher than the prior year appraised value by an aggregate of $4.4 million or approximately 28%. • Other properties ($33.0 million increase to NAV, as appraised by Duff & Phelps): – The remaining 113 properties in the portfolio increased by $33.0 million or approximately 15% over the prior year appraised value.

National Industrial Portfolio 9 In December 2011, KBS REIT I transferred its interest in the National Industrial Portfolio to the lender in a deed-in-lieu of foreclosure. KBS REIT I was able to negotiate, in exchange, a back-end promote interest in the new owner of the National Industrial Portfolio, which would be paid out once the equity interests achieved certain returns. Thus, the promote interest value would be based largely on the real estate value. In the December 2014 estimated value per share, the promote interest was valued at $27.3 million based on business plan cash flows, which were run through the joint venture waterfall calculation and KBS REIT I’s resulting promote payment was then present valued. The business plan cash flows assumed the National Industrial Portfolio would be stabilized and then sold. In the December 2015 estimated value per share, the promote interest was written down to $0. This was a result of two broker opinions of value (BOVs), which indicated the current unstabilized value of the National Industrial Portfolio when combined with the actual and projected operating cash flows, would not be sufficient for the KBS REIT I promote interest to be paid out. A similar conclusion was also reached using updated business plan cash flows in a scenario where the real estate properties were stabilized and then sold. The decrease in promote interest value from December 2014 to December 2015 was attributable to a decline in the estimated value of the National Industrial Portfolio, which was primarily a result of an increase in assumed capitalization rates to sell the portfolio and an increase in assumed capital expenditures and time to stabilize the portfolio.

Disposition History 10 Real Estate Properties Sold Since December 2014 Valuation Historical Properties Acq. Date Purchase Price Cost Basis 1 Sale Date Net Sale Price 2 Sabal VI 03/05/07 16,318,435$ 18,876,955$ 03/31/15 13,150,000$ Royal Ridge 06/21/07 33,382,665 37,185,666 03/31/15 27,794,309 Total Historical Properties 49,701,100$ 56,062,621$ 40,944,309$ GKK Properties (by Loan Pool) 3 Acq. Date 4 Purchase Price 5 Cost Basis 1 Sale Date Net Sale Price 2 101 Independence 09/01/11 71,343,812$ 92,920,020$ 05/01/15 106,761,824$ BBD2 (12 properties) 09/01/11 23,894,799 28,508,839 Various 58,826,653 Beaver Valley 09/01/11 49,198,873 58,097,741 03/31/15 61,597,995 FSI (4 properties) 09/01/11 4,077,559 5,542,786 Various 3,730,500 RBC Centura (3 properties) 09/01/11 5,724,072 5,923,562 Various 4,042,500 Citizen's JV (1 property) 09/01/11 864,988 864,988 04/20/15 642,500 Sterling Bank (4 properties) 09/01/11 6,291,836 6,763,204 Various 9,062,600 Total GKK Properties 161,395,939$ 198,621,140$ 244,664,572$ Grand Total 211,097,039$ 254,683,761$ 285,608,881$ 1 Includes acquisition price, acquisition costs, capital expenditures and leasing commissions. 5 The value shown represents the estimated fair value upon transfer to KBS REIT I based upon KBS REIT I's purchase price allocation in accordance with GAAP. 4 The date represents the date of the Collateral Transfer and Settlement Agreement related to the GKK properties which were collateral for a mezzanine loan previously provided by KBS REIT I. 3 Includes 15 properties sold subsequent to 09/30/15 with purchase price, cost basis and net sale price of $29.5 million, $34.6 million and $66.8 million, respectively. 2 Gross sale price less concessions and credits.

11 Loan Payable Maturities December 2014 $ 57,150,887 December 2015 $ 36,939,134 December 2016 $ 21,079,419 December 2017 $ 11,598,346 as of September 30, 20151 Loan Payable Maturities by Year (All $ in thousands) as of September 30, 2014 Estimated defeasance and prepayment costs for GKK mortgage debt held: December 2015 $ 31,241,974 December 2016 $ 19,360,062 December 2017 $ 10,273,644 1 Estimates exclude the $15.1 million of defeasance costs paid from September 30, 2014 to December 8, 2015, and $2.0 million of estimated future defeasance costs related to a property under sale contract as of December 8, 2015, which defeasance costs have already been reflected in the December 8, 2015 estimated value per share.

Stockholder Performance 12 KBS REIT I is providing this estimated value per share to assist broker-dealers that participated in its initial public offering in meeting their customer account statement reporting obligations. The valuation was performed in accordance with the provisions of and also to comply with the IPA Valuation Guidelines. As with any valuation methodology, the methodologies used are based upon a number of estimates and assumptions that may not be accurate or complete. Different parties with different assumptions and estimates could derive a different estimated value per share of KBS REIT I’s common stock, and this difference could be significant. The estimated value per share is not audited and does not represent the fair value of KBS REIT I’s assets or liabilities according to GAAP. KBS REIT I can give no assurance that: • a stockholder would be able to resell his or her shares at this estimated value per share; • a stockholder would ultimately realize distributions per share equal to the estimated value per share upon liquidation of KBS REIT I’s assets and settlement of its liabilities or a sale of KBS REIT I; • KBS REIT I’s shares of common stock would trade at the estimated value per share on a national securities exchange; • another independent third-party appraiser or third-party valuation firm would agree with KBS REIT I’s estimated value per share; or • the methodology used to calculate KBS REIT I’s estimated value per share would be acceptable to FINRA or for compliance with ERISA reporting requirements. Further, the estimated value per share as of December 8, 2015 is based on the estimated value of KBS REIT I’s assets less the estimated value of KBS REIT I’s liabilities divided by the number of shares outstanding, all as of September 30, 2015, with the exception of an adjustment to KBS REIT I’s net asset value to give effect to the December 7, 2015 payment of a special distribution of $0.25 per share to stockholders of record as of the close of business on December 1, 2015. The value of KBS REIT I’s shares will fluctuate over time in response to developments related to individual assets in KBS REIT I’s portfolio and the management of those assets and in response to the real estate and finance markets. The estimated value per share does not reflect a discount for the fact that KBS REIT I is externally managed, nor does it reflect a real estate portfolio premium/discount versus the sum of the individual property values. The estimated value per share also does not take into account debt defeasance costs KBS REIT I may incur in connection with prepayments on its notes payable, debt prepayment penalties or swap breakage fees that could apply upon the prepayment of certain of KBS REIT I’s debt obligations or termination of related swap agreements prior to expiration, the impact of restrictions on the assumption of debt, or disposition costs and fees for real estate properties that are not under contract to sell. KBS REIT I has generally incurred disposition costs and fees related to the sale of the Company’s historical real estate properties since inception of 1.7% to 5.7% of the gross sales price less concessions and credits, with the weighted average being 2.7%. KBS REIT I has generally incurred disposition costs and fees related to the sale of the GKK properties since inception of 1.5% to 8.5% of the gross sales price less concessions and credits, with the weighted average being 2.3%. If both these ranges of disposition costs and fees were applied to KBS REIT I’s real estate properties, which do not include these costs and fees in the appraised values, the resulting impact on the estimated value per share would be a decrease of $0.09 to $0.41 per share. KBS REIT I currently expects to utilize the Advisor and/or an independent valuation firm to update the estimated value per share no later than December 2016.

Stockholder Performance 13 $3.94 $4.27 $8.21 Hypothetical Performance of Early and Late Investors Assumes all distributions have been taken in cash, stockholder has held shares since the dates below and no share redemptions1 Estimated Value Per Share As of December 8, 2015 Cumulative Cash Distributions Paid through December 8, 2015 Sum of Estimated Value Per Share as of December 8, 2015 and Cumulative Cash Distributions Paid through December 8, 2015 Late Investor: Invested at Close of Public Offering (May 31, 2008) Early Investor: Invested at Escrow Break (July 5, 2006) $3.94 $2.93 $6.87 1Does not reflect the hypothetical performance of investments by stockholders that participated in the dividend reinvestment plan. The hypothetical performance of investments by stockholders that participated in the dividend reinvestment plan would be lower per share than that shown above.

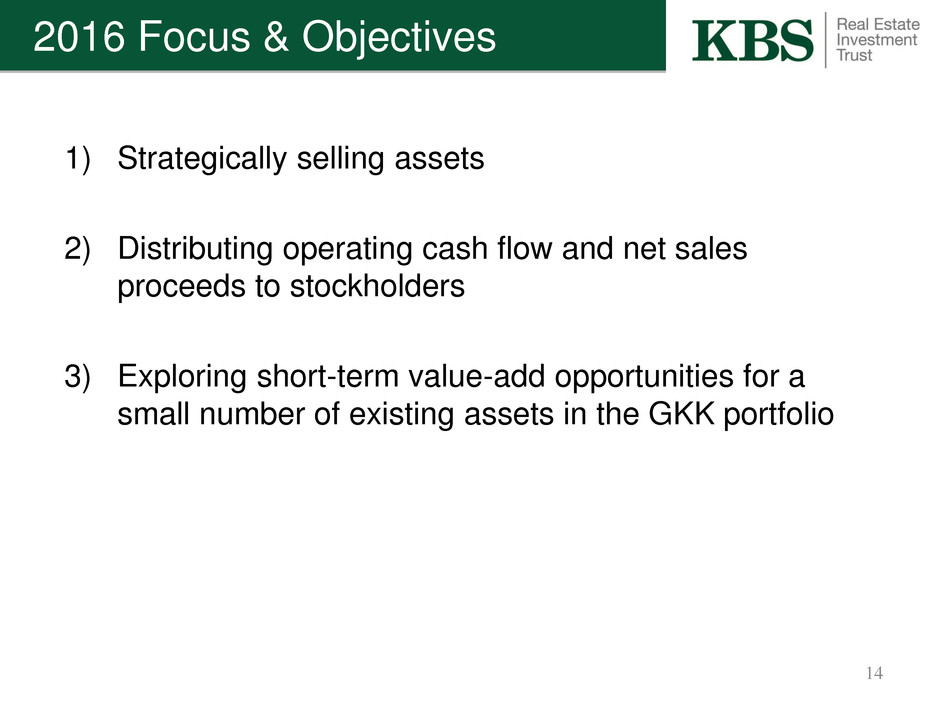
2016 Focus & Objectives 1) Strategically selling assets 2) Distributing operating cash flow and net sales proceeds to stockholders 3) Exploring short-term value-add opportunities for a small number of existing assets in the GKK portfolio 14

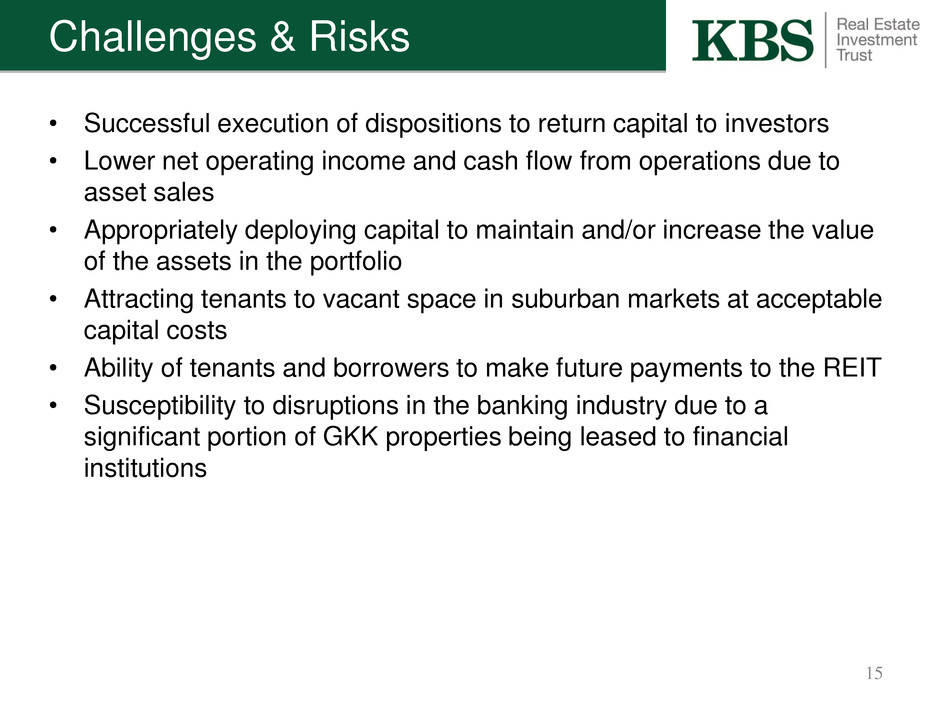
Challenges & Risks • Successful execution of dispositions to return capital to investors • Lower net operating income and cash flow from operations due to asset sales • Appropriately deploying capital to maintain and/or increase the value of the assets in the portfolio • Attracting tenants to vacant space in suburban markets at acceptable capital costs • Ability of tenants and borrowers to make future payments to the REIT • Susceptibility to disruptions in the banking industry due to a significant portion of GKK properties being leased to financial institutions 15

Thank you! KBS Capital Markets Group Member FINRA & SIPC 800 Newport Center Dr., Suite 700 Newport Beach, CA 92660 (866) 527-4264 16
