Attached files
| file | filename |
|---|---|
| 8-K - 8-K - PAR PACIFIC HOLDINGS, INC. | a201512088-kinvestorpresen.htm |

Investor Presentation December 2015

2 Forward-Looking Statements / Disclaimers The information contained in this presentation has been prepared to assist you in making your own evaluation of the company and does not purport to contain all of the information you may consider important. Any estimates or projections with respect to future performance have been provided to assist you in your evaluation but should not be relied upon as an accurate representation of future results. Certain statements, estimates and financial information contained in this presentation constitute forward-‐looking statements. Such forward- looking statements involve known and unknown risks and uncertainties that could cause actual events or results to differ materially from the results implied or expressed in such forward-‐looking statements. While presented with numerical specificity, certain forward-looking statements are based (1) upon assumptions that are inherently subject to significant business, economic, regulatory, environmental, seasonal and competitive uncertainties, contingencies and risks including, without limitation, our ability to maintain adequate liquidity, realize the potential benefit of our net operating loss tax carryforwards, obtain sufficient debt and equity financings, capital costs, well production performance, operating costs, commodity pricing, differentials or crack spreads, realize the potential benefits of our supply and offtake agreements, assumptions inherent in a sum-of-the-parts valuation, realize the benefit of our investment in Laramie Energy Company, assumptions related to our investment in Laramie Energy Company, the potential uplift of an MLP, our ability to meet environmental and regulatory requirements without additional capital expenditures, and our ability to complete the refinery turnaround and increase throughput and profitability, our ability to evaluate and pursue strategic and growth opportunities, our estimates of 2016 on-island sales volume, our estimates related to fourth quarter and full-year 2015 Adjusted EBITDA and certain other financial measures, and other known and unknown risks (all of which are difficult to predict and many of which are beyond the company's control) some of which are further discussed in the company’s periodic and other filings with the SEC and (2) upon assumptions with respect to future business decisions that are subject to change. There can be no assurance that the results implied or expressed in such forward-looking statements or the underlying assumptions will be realized and that actual results of operations or future events will not be materially different from the results implied or expressed in such forward-looking statements. Under no circumstances should the inclusion of the forward-looking statements be regarded as a representation, undertaking, warranty or prediction by the company or any other person with respect to the accuracy thereof or the accuracy of the underlying assumptions, or that the company will achieve or is likely to achieve any particular results. The forward-looking statements are made as of the date hereof and the company disclaims any intent or obligation to update publicly or to revise any of the forward-looking statements, whether as a result of new information, future events or otherwise, except as may be required by applicable law. Recipients are cautioned that forward-looking statements are not guarantees of future performance and, accordingly, recipients are expressly cautioned not to put undue reliance on forward-looking statements due to the inherent uncertainty therein. This presentation contains non-GAAP financial measures, such as PV-10, Adjusted EBITDA and cash flows, including certain key statistics and estimates on slide twenty one. Please see the Appendix for the definitions and reconciliations of the non-GAAP financial measures that are based on reconcilable historical information.

Company Overview

4 Largest and Most Complex(1) Refiner in Niche Hawaii Market Crude capacity of 94,000 barrels per day 50% distillate yield configuration Flexibility to utilize a wide range of crude blends Our Business Platforms Integrated Network of Logistics Assets 5.4 million barrels of storage capacity with 27 miles of pipelines 2 barges delivering products to 8 refined product terminals and ocean vessels Difficult to replicate system of assets Distributor and Marketer of Refined Products Recent Mid Pac acquisition significantly expanded distribution network Gasoline and diesel distributed through 128 serviced locations across Hawaii Wholesale and bulk provider on the islands Competitive Natural Gas Producer Below $1.2MM wells delivering average 1.8 BCFE EURs More than 2,000 economic drilling locations Attractive 80+ well partnership with Wexpro In te gr at ed R efi n er an d Ma rk et e r ____________________ (1) As measured by Nelson Complexity rating. U p st re am

5 9/25/2013: Restart of Kapolei Refinery. Renamed Hawaii Independent Energy 9/1/2012: Delta Petroleum emerged from Chapter 11. Company is renamed Par Petroleum Piceance Energy dba Laramie Energy joint venture initiated Company Timeline 2012 Emerging as Par 2013 Building the Foundation 2014 Transitioning to Profitability 2015 Positioned for Growth 5/15/2015: HIE Retail amendment to $30MM term loan 12/31/2012: Closed acquisition of SEACOR Energy. Renamed Texadian Energy 6/17/2013: Agreed to purchase Kapolei Refinery from Tesoro 2/20/2015: Texadian amendment of $100MM ABL facility 8/14/2014: Successfully completed $102MM common stock rights offering 7/22/2014: Moved from OTCQB Marketplace to NYSE MKT: PARR Strategic Transactions Financial Transactions 11/14/2013: HIE Retail entered into a credit agreement: $30MM term loan and $5MM revolver 4/1/2015: Closed acquisition of Mid Pac Petroleum $200MM PIPE, supply & exchange agreements, and $125MM ABL facility Mid Pac entered into a credit agreement: $50MM term loan and $5MM revolver 6/1/2015: Closed new supply & offtake agreement, including $125MM deferred payment capacity and $250MM inventory facility 9/22/2015: Laramie Energy entered into a joint venture with Wexpro Company for an 80 well drilling program

6 Growth Opportunity Framework Tier 1 • Refining • Marketing • Midstream & downstream logistics Tier 2 • E&P with Laramie tie-in • Upstream logistics • Gathering systems • Gas processing • Chemical / process businesses Tier 3 • E&P w/o Laramie tie-in • Oilfield services • Power generation • Non-oil logistics Strategic Factors Existing Competencies NOL Refining System Integration MLP Qualifying Hawaii Laramie Target acquisitions that generate risk adjusted returns on capital and are accretive to sum of the parts valuation

Business Platform Overview
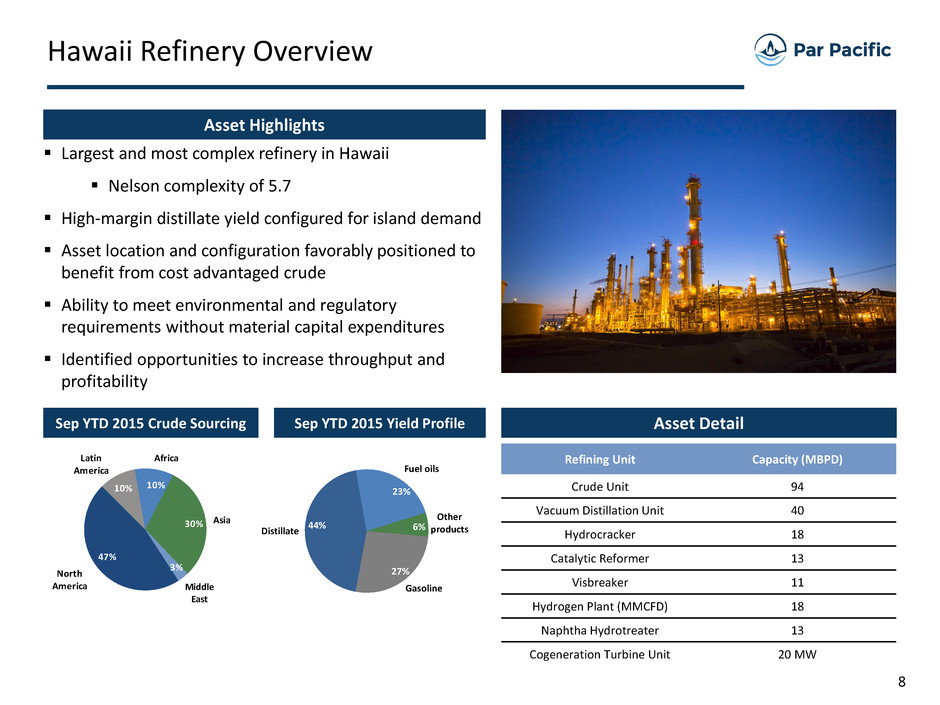
8 North America Latin America Africa Asia Middle East 30% 47% 3% 10% 10% Refining Unit Capacity (MBPD) Crude Unit 94 Vacuum Distillation Unit 40 Hydrocracker 18 Catalytic Reformer 13 Visbreaker 11 Hydrogen Plant (MMCFD) 18 Naphtha Hydrotreater 13 Cogeneration Turbine Unit 20 MW Hawaii Refinery Overview Asset Highlights Largest and most complex refinery in Hawaii Nelson complexity of 5.7 High-margin distillate yield configured for island demand Asset location and configuration favorably positioned to benefit from cost advantaged crude Ability to meet environmental and regulatory requirements without material capital expenditures Identified opportunities to increase throughput and profitability Asset DetailSep YTD 2015 Crude Sourcing Sep YTD 2015 Yield Profile Gasoline Distillat Fuel oils Other products44% 23% 6% 27%
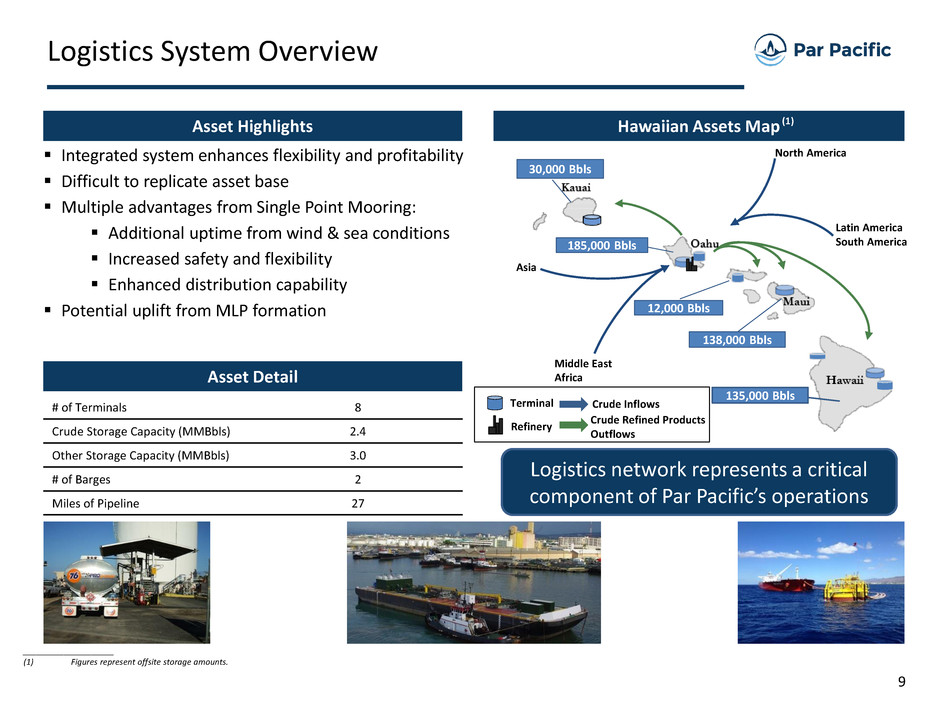
9 30,000 Bbls 185,000 Bbls 138,000 Bbls 135,000 Bbls 12,000 Bbls Hawaiian Assets MapAsset Highlights Logistics System Overview Integrated system enhances flexibility and profitability Difficult to replicate asset base Multiple advantages from Single Point Mooring: Additional uptime from wind & sea conditions Increased safety and flexibility Enhanced distribution capability Potential uplift from MLP formation Latin America South America North America Middle East Africa Asia Logistics network represents a critical component of Par Pacific’s operations Asset Detail # of Terminals 8 Crude Storage Capacity (MMBbls) 2.4 Other Storage Capacity (MMBbls) 3.0 # of Barges 2 Miles of Pipeline 27 ____________________ (1) Figures represent offsite storage amounts. (1) Refinery Terminal Crude Inflows Crude Refined Products Outflows
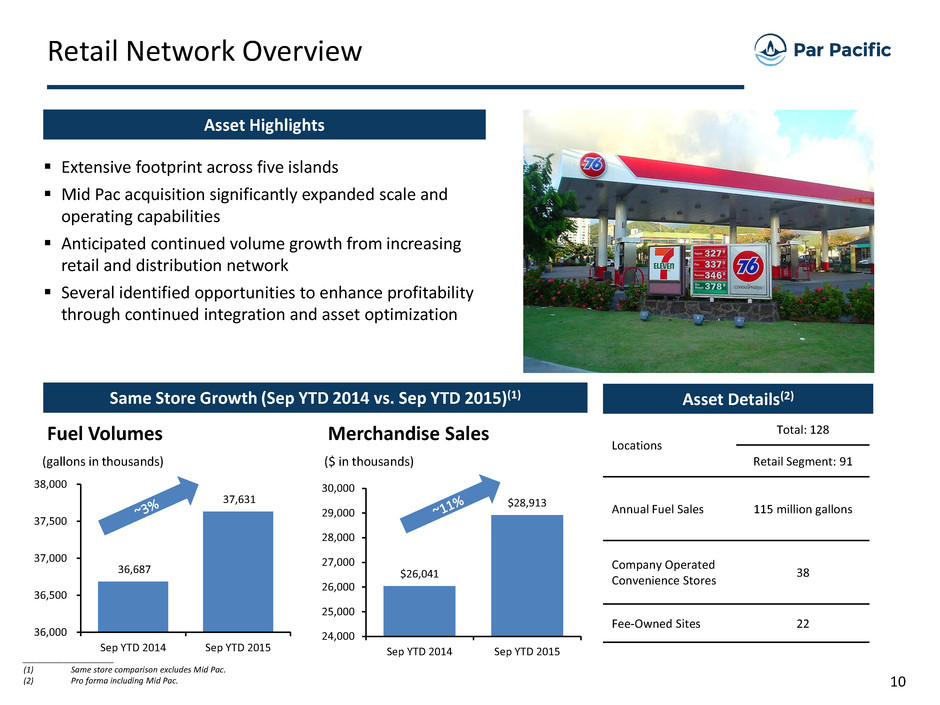
10 $26,041 $28,913 24,000 25,000 26,000 27,000 28,000 29,000 30,000 Sep YTD 2014 Sep YTD 2015 36,687 37,631 36,000 36,500 37,000 37,500 38,000 Sep YTD 2014 Sep YTD 2015 Same Store Growth (Sep YTD 2014 vs. Sep YTD 2015)(1) Retail Network Overview Asset Highlights Extensive footprint across five islands Mid Pac acquisition significantly expanded scale and operating capabilities Anticipated continued volume growth from increasing retail and distribution network Several identified opportunities to enhance profitability through continued integration and asset optimization Fuel Volumes Merchandise Sales ____________________ (1) Same store comparison excludes Mid Pac. (2) Pro forma including Mid Pac. (gallons in thousands) Asset Details(2) Locations Total: 128 Retail Segment: 91 Annual Fuel Sales 115 million gallons Company Operated Convenience Stores 38 Fee-Owned Sites 22 ($ in thousands)
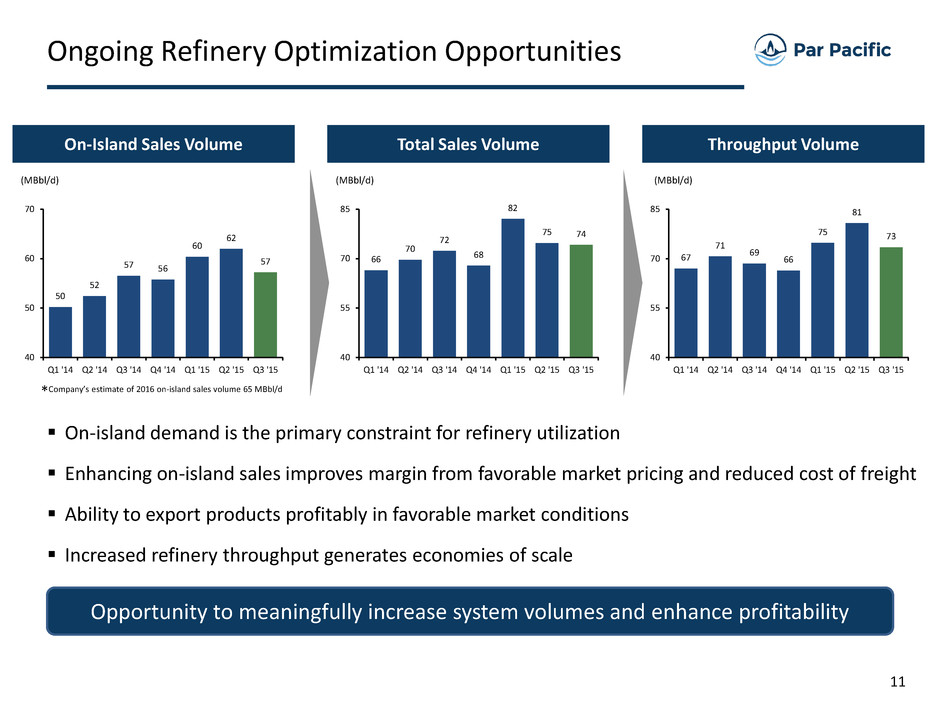
11 Ongoing Refinery Optimization Opportunities Opportunity to meaningfully increase system volumes and enhance profitability Total Sales VolumeOn-Island Sales Volume Throughput Volume On-island demand is the primary constraint for refinery utilization Enhancing on-island sales improves margin from favorable market pricing and reduced cost of freight Ability to export products profitably in favorable market conditions Increased refinery throughput generates economies of scale (MBbl/d) (MBbl/d) (MBbl/d) 67 71 69 66 75 81 73 40 55 70 85 Q1 '14 Q2 '14 Q3 '14 Q4 '14 Q1 '15 Q2 '15 Q3 '15 50 52 57 56 60 62 57 40 50 60 70 Q1 '14 Q2 '14 Q3 '14 Q4 '14 Q1 '15 Q2 '15 Q3 '15 66 70 72 68 82 75 74 40 55 70 85 Q1 '14 Q2 '14 Q3 '14 Q4 '14 Q1 '15 Q2 '15 Q3 '15 *Company’s estimate of 2016 on-island sales volume 65 MBbl/d

12 Well Positioned to Benefit from Commodity Flows Crude slate and sourcing flexibility provide a competitive advantage Located at the crossroads of changing crude flows from West to East Crude sourcing network provides ability to change crude slate based on regional differentials ____________________ Note: Highlighted countries represent supply regions for Par Pacific’s refinery. Waterborne Access Mid-Pacific Trends Increased supply of cost advantaged crude leads to sustainable competitive advantages Improving economic conditions drives demand growth Product Flows

13 -2 0 2 4 6 8 10 $12 3Q13 4Q13 1Q14 2Q14 3Q14 4Q14 1Q15 2Q15 3Q15 Historical Crack Spread and Differential Mid Pacific Crude Blend 4-1-2-1 Mid Pacific Crack Spread 80% Singapore, 20% San Francisco ____________________ (1) Company calculation based on a rolling three-year average for the 4-1-2-1 Mid Pacific Crack Spread plus Mid Pacific Crude Blend (Five-year average of Mid Pacific Crack Spread is $8.44). Mid Pacific Crude Differential is calculated as follows: Weighted average differentials, excluding shipping costs, of a blend of crudes with an API of 31.98 and sulphur wt% of 0.65% that is indicative of our typical crude mix quality. Mid Pacific 4.1.2.1 Crack Spread is calculated as follows: Singapore Daily: computed by taking 1 part gasoline (RON 92), 2 parts middle distillates (Sing Jet & Sing Gasoil), and 1 part fuel oil (Sing 180) as created from a barrel of Brent Crude. San Francisco Daily: computed by taking 1 part gasoline (SF Reg Unl), 2 parts middle distillates (SF Jet 54 & SF ULSD), and 1 part fuel oil (SF 180 Waterborne) as created from a barrel of Brent Crude. Daily: computed using a weighted average of 80% Singapore and 20% San Francisco. Month (CMA): computed using all available pricing days for each marker. Quarter/Year: computed using calendar day weighted CMAs for each marker. Purchased Refinery Combined Mid Cycle(1) $8.57

14 Leader in Niche Hawaiian Market Air Travel(2) ____________________ (1) Source: DBEDT; EIA, including military demand per Par Pacific estimates, assuming Par Pacific throughput at 75MBD. (2) Source: Number of visitors per DBEDT. Refined Product Demand(1) Par Refinery Yield Sep YTD 20152014 Shortage of available distillate capacity in Hawaii Ability to reconfigure yield based on product demand Air travel projected to continue to grow Fuel oil utilized for ~70% of electricity generation (In Thousands) Hawaii Petroleum Use(1) Petroleum- Fired Coal-Fired Other Renewables 69% 17% 14% Electricity Production Commercial Aviation Marine Transport Military Use Other 28% 28% 27% 6% 8% 3% Ground Transportation 7,500 7,750 8,000 8,250 8,500 8,750 9,000 2013 2014 2015E 2016E 2017E 2018E MBbl/d 60 59 72 50 0 8 16 24 32 40 48 56 64 72 80 Other Products Distillate Total Production Total Demand Gasoline Distillate Fuel oils Other products44% 23% 6% 27% Distillates Gasoline Fuel oils Other products 38% 25% 33% 4%
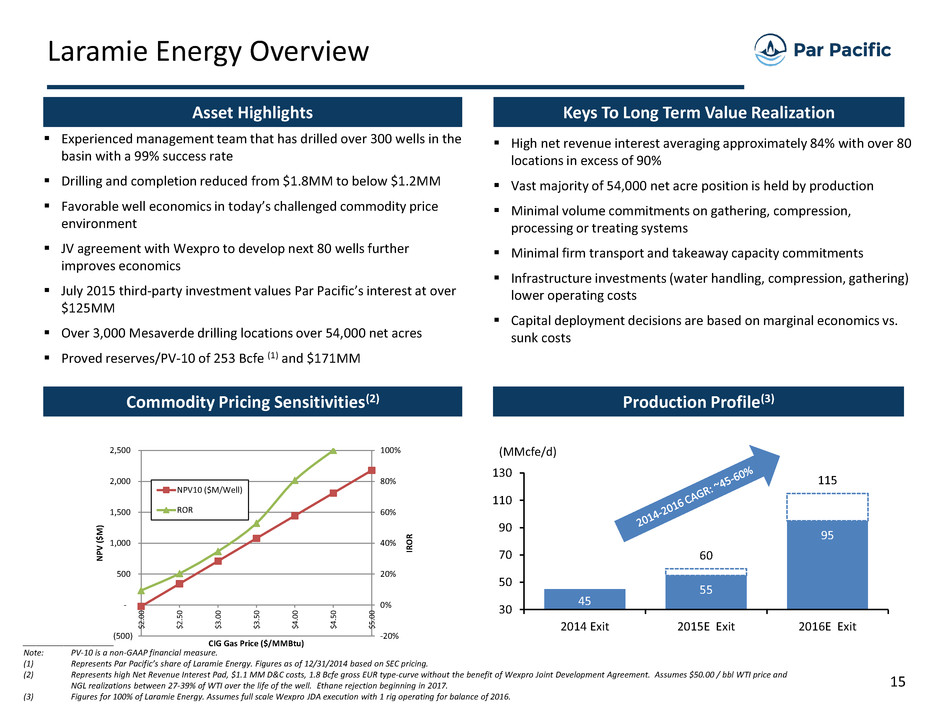
15 -20% 0% 20% 40% 60% 80% 100% (500) - 500 1,000 1,500 2,000 2,500 $2.0 0 $2 .5 0 $3.0 0 $3.5 0 $4.0 0 $4.5 0 $5.0 0 IRO R NPV ($ M ) CIG Gas Price ($/MMBtu) 28-10 Pad 100%WI 92.97%NRI NPV10 ($M/Well) ROR Experienced management team that has drilled over 300 wells in the basin with a 99% success rate Drilling and completion reduced from $1.8MM to below $1.2MM Favorable well economics in today’s challenged commodity price environment JV agreement with Wexpro to develop next 80 wells further improves economics July 2015 third-party investment values Par Pacific’s interest at over $125MM Over 3,000 Mesaverde drilling locations over 54,000 net acres Proved reserves/PV-10 of 253 Bcfe (1) and $171MM Asset Highlights Laramie Energy Overview Commodity Pricing Sensitivities(2) Production Profile(3) Keys To Long Term Value Realization ____________________ Note: PV-10 is a non-GAAP financial measure. (1) Represents Par Pacific’s share of Laramie Energy. Figures as of 12/31/2014 based on SEC pricing. (2) Represents high Net Revenue Interest Pad, $1.1 MM D&C costs, 1.8 Bcfe gross EUR type-curve without the benefit of Wexpro Joint Development Agreement. Assumes $50.00 / bbl WTI price and NGL realizations between 27-39% of WTI over the life of the well. Ethane rejection beginning in 2017. (3) Figures for 100% of Laramie Energy. Assumes full scale Wexpro JDA execution with 1 rig operating for balance of 2016. (MMcfe/d) 45 55 95 60 115 30 50 70 90 110 130 2014 Exit 2015E Exit 2016E Exit High net revenue interest averaging approximately 84% with over 80 locations in excess of 90% Vast majority of 54,000 net acre position is held by production Minimal volume commitments on gathering, compression, processing or treating systems Minimal firm transport and takeaway capacity commitments Infrastructure investments (water handling, compression, gathering) lower operating costs Capital deployment decisions are based on marginal economics vs. sunk costs

16 ($ in millions) Drilling & Completion (D&C) Capital Trends Historical D&C AFE (2010 - 2015) March 2015 D&C AFE (4) September 2015 D&C AFE Pre-Water Facility Post-Water Facility High-End Low-End High-End Low-End Drill & Case $0.75 $0.75 $0.54 $0.45 $0.53 $0.48 Complete 1.05 0.85 0.76 0.76 0.69 0.64 Total $1.80 $1.60 $1.30 $1.21 $1.22 $1.12 Frac Water Volumes ( bbls / stage) 12,500 12,500 17,500 17,500 Continue to run 1 rig program under the Wexpro JDA for balance of 2016 Complete significant portion of Drilled but Uncompleted (“DUC”) inventory Deliver reduced Drill & Complete costs & LOEs through water handling infrastructure investment 2016 Plan Summary (1) Laramie Energy 2016 Development Program Deep Inventory of High Return Wells (3) ____________________ (1) Assumes full scale Wexpro JDA execution with 1 rig operating for balance of 2016. (2) Assumes 21 well pad with full allocation of infrastructure, facilities and mobilization costs. (3) Assumes $3.00 / MMBTU CIG price, $50 / BBL WTI and range of 25-35% of WTI for NGL realizations. Also based on 1.8 BCFE type curve and approximately $1.15 MM D&C costs per well. (4) Drilling and completion economics as estimated and presented by management during Q1 2015. (2)Driving down the D&C Cost Profile (2) Reduce capital requirements per well by 8% from prior estimates while simultaneously increasing water volumes 40% Sandless fracs are large driver in reduced costs and delivering encouraging results 55 437 497 840 359 988 0 400 800 1,200 1,600 2,000 2,400 2,800 3,200 0 20 400 600 800 1,000 1,200 1,400 1,600 30% - 35% 25% - 30% 20% - 25% 15% - 20% 10% - 15% 0% - 10% Cu m ul ati ve Lo catio ns Lo ca tio ns Rate of Return Range ($ in millions) 2015 & 2016 Capital Plan Summary 2015E Total Low High D&C 47.0$ 42.3$ 52.3$ I frastructure 16.5 8.2 8.2 Other 0.9 0.0 0.0 Total Capex 64.5$ 50.5$ 60.5$ Drilled (Uncomplete) @9/30/2015 60 2016E

Financial Overview
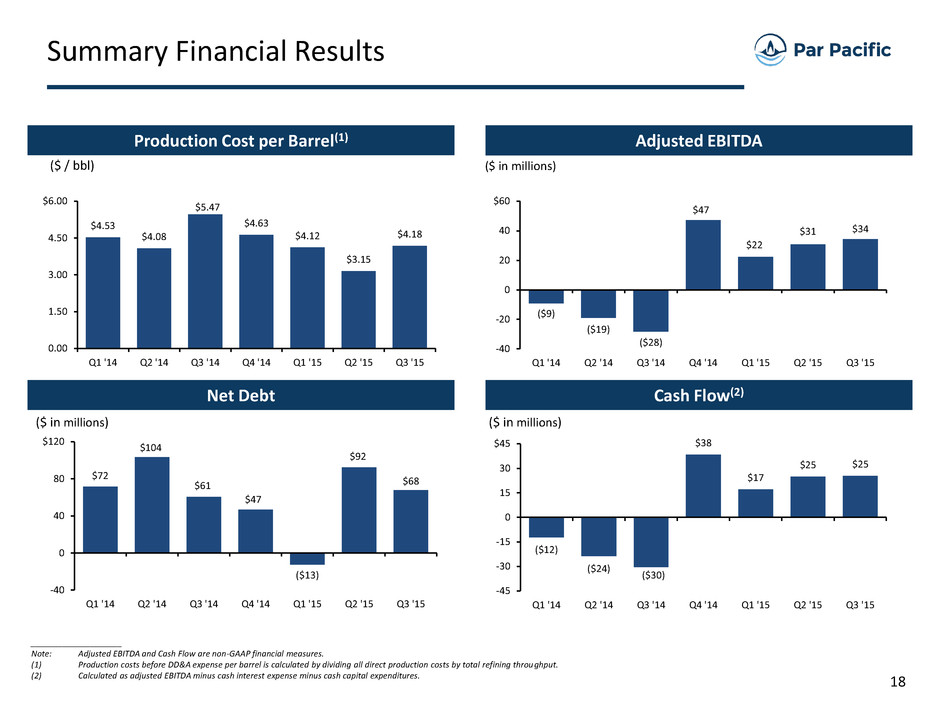
18 Adjusted EBITDA Net Debt Production Cost per Barrel(1) ($ in millions) ($ in millions) ____________________ Note: Adjusted EBITDA and Cash Flow are non-GAAP financial measures. (1) Production costs before DD&A expense per barrel is calculated by dividing all direct production costs by total refining throughput. (2) Calculated as adjusted EBITDA minus cash interest expense minus cash capital expenditures. Summary Financial Results Cash Flow(2) ($ / bbl) ($ in millions) $72 $104 $61 $47 ($13) $92 $68 -40 0 40 80 $120 Q1 '14 Q2 '14 Q3 '14 Q4 '14 Q1 '15 Q2 '15 Q3 '15 ($9) ($19) ($28) $47 $22 $31 $34 -40 -20 0 20 40 $60 Q1 '14 Q2 '14 Q3 '14 Q4 '14 Q1 '15 Q2 '15 Q3 '15 ($12) ($24) ($30) $38 $17 $25 $25 -45 -30 -15 0 15 30 $45 Q1 '14 Q2 '14 Q3 '14 Q4 '14 Q1 '15 Q2 '15 Q3 '15 $4.53 $4.08 $5.47 $4.63 $4.12 $3.15 $4.18 0.00 1.50 3.00 4.50 $6.00 Q1 '14 Q2 '14 Q3 '14 Q4 '14 Q1 '15 Q2 '15 Q3 '15

19 Capitalization and Maturity Profile ($ in millions) Capitalization Maturity Profile $39 $55 $2 $8 $8 $8 $100 0 50 100 150 2015 2016 2017 2018 2019 2020 Thereafter Par Term Loan HIE Retail Term Loan Mid Pac Term Loan Texadian Trade Credit (undrawn) Mid Pac Revolver (undrawn) $68 $148 $31 $5 $48 As of ($ in millions) 11/27/2015 Cash & Cash Equivalents $176 Debt: Par Term Loan 94 HIE Retail Term Loan 28 Texadian Trade Credit 0 Mid Pac Term Loan 48 Mid Pac Revolver 0 Total Debt $170 Equity: Book Value of Equity $404 Total Shareholders Equity $404 Total Capitalization $574 Credit Statistics: Total Debt / Capitalization 30% Total Debt / Sep YTD EBITDA Annualized 1.5x Total Net Debt / Capitalization (1%) Total Net Debt / Sep YTD EBITDA Annualized (0.1x)

20 Net Operating Loss Carryforward Differentiated Asset Relative to Peers Potential to Enhance Cash Flow with Growth Provides a Competitive Advantage for Growth Opportunities $1.4 billion NOL generates potentially significant value for Par Selected Benefits Illustrative Value to Par ($ in millions) 8.0% 10.0% 12.0% $25 $98 $84 $73 $50 $197 $168 $146 $75 $256 $226 $201 Discount Rate A nn ua l P re -T ax E ar ni ng s (1) ____________________ (1) Assumes $1.4 billion NOL and 35% tax rate.

21 Par Pacific Summary Refining – Largest & most complex refinery in Hawaii with distillate focused yield Distribution – Integrated and difficult to replicate asset base, resulting in stable consistent value Retail – Competitive position within a strong niche market, delivering robust on-island sales volumes and margins North American Logistics – Opportunistic crude purchase capabilities of lower priced crudes Laramie – low cost gas producer with deep inventory of drilling locations and minimal contractual obligations Key Highlights Enterprise ValueKey Statistics ____________________ (1) Includes annualized Mid Pac contribution to the Refining and Retail Adjusted EBITDA margin at a run rate based on 2015 Q2-Q3 results (2) Excluding pro forma impact, Adjusted EBITDA for our Refinery Segment would be $120MM and $99MM for LTM Oct’15 and FY15, respectively, and Adjusted EBITDA for our Retail segment would be $33MM and $31MM, respectively. (3) Represents Par Pacific’s share of Laramie Energy as of 9/30/15. (4) Represents Par Pacific’s share of Laramie Energy. Calculated as 32.4% of midpoint 2015E and 2016E exit production. (5) Represents Par Pacific’s share of Laramie Energy. Figures as of 12/31/2014 based on SEC pricing. (6) 41,379,812 shares of common stock outstanding. (7) Net debt pro forma reflects addition of proceeds from our registered direct offering dated November 25, 2015 to financials from the quarterly period ended September 30, 2015. NOL Gross Balance $1,400 Net Operating Loss (NOL) Carryforwards Investment Book Value (3) 2015E Production (MMcfe/d) (4) 2016E Production (MMcfe/d) (4) Estimated Proven Reserves (Bcfe) (5) 35 253 Laramie Energy (PPH investment share) $126 18 ($ in millions, except per share data) LTM EST. Oct'15 FY'15 Refining and Distribution (1)(2) $121 $100 Retail (1)(2) 38 35 Corporate & Others (21) (25) Total Adjusted EBITDA $139 Pro Forma Adjusted EBITDA $105 ↔ $115 Share Price Shares O tstanding (6) Market Capitalization Debt Cash Net Debt (7) (6) Total Enterprise Value As of COB 11/27/2015 $24.95 $1,032 $1,026 41 170 (176)

22 • Flexible Capital Structure • Conservative Access to Liquidity • Profitability Throughout Cycles • Utilize Capital Markets Opportunistically Conservative Capital Structure Minimal near-term maturities enhances flexibility Low financial leverage positions Par Pacific for future growth opportunities Efficient Commodity Financing Substantially reduces working capital requirements Commodity financing enhances crude sourcing optionality Favorable terms increase financial flexibility Well Capitalized Demonstrated capability to access public and private capital markets Maintain access to comfortable levels of liquidity to support operations Profitability Throughout Cycles Utilize hedging to minimize impact of commodity price fluctuations Continued operations optimization focusing on reliability, yields, energy use, and sustainable costs to enhance profitability NOL enhances cash flow from operations Financial Strategy

23 Constructive Market Environment Experienced Management Team and Board Significant Financial Flexibility Identified Growth Opportunities High Quality Asset Base in Niche Market Summary
24 Contact Information Par Pacific Holdings, Inc. (NYSE MKT: PARR) 800 Gessner Road, Suite 875 Houston, TX 77024 (281) 899-4800 www.parpacific.com Christine Thorp Director, Investor Relations cthorp@parpacific.com (832) 916-3396

Appendix

26 Laramie Energy Asset Overview ____________________ Source: Drilling Info. (2)

27 Facility Borrower Amount Outstanding (9/30/2015) Undrawn Amount Amortization Maturity Interest Rate Term Loan (1) Par $93.9 NA NA 7/11/2018 10.00% (12.00% PIK) HIE Retail Term Loan Retail 27.9 NA 7-Year 3/31/2022 L + 2.00% Texadian Credit Texadian 0.0 100.0 NA 2/19/2016 L + 2.75% Mid Pac Term Loan Mid Pac 47.9 0.0 12-Year 4/1/2022 L + 2.50% Mid Pac Revolver Mid Pac 0.0 5.0 NA 4/1/2018 L + 3.75% Capitalization Detail ____________________ Note: Excludes $36MM related to J Aron Supply and Offtake Financing Agreement facility (1) Required to repay $39MM advance on March 31, 2016. ($ in millions)
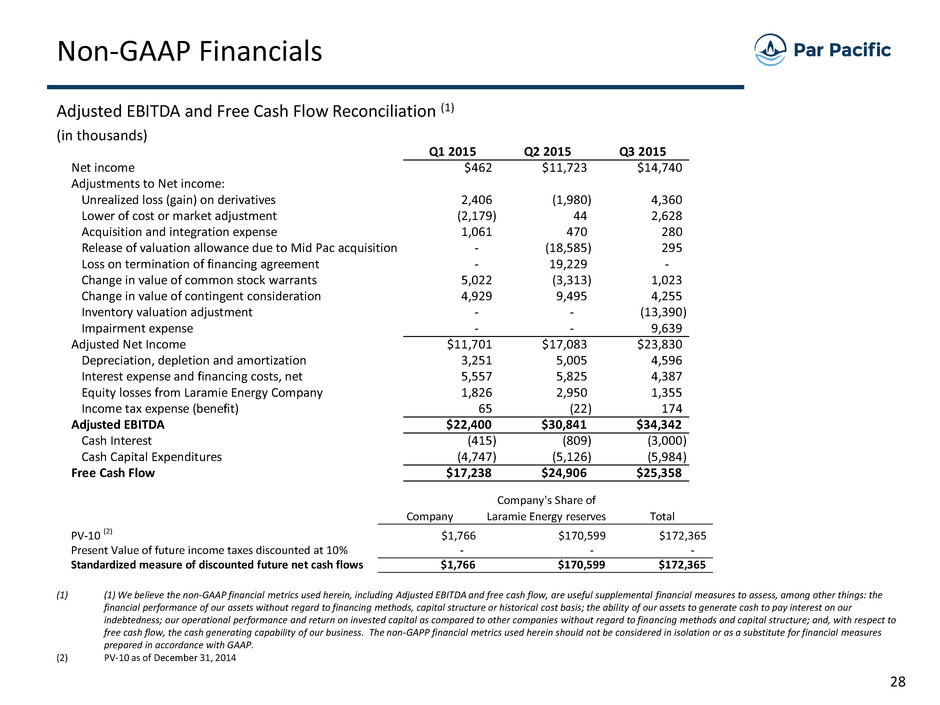
28 Non-GAAP Financials Adjusted EBITDA and Free Cash Flow Reconciliation (1) (in thousands) (1) (1) We believe the non-GAAP financial metrics used herein, including Adjusted EBITDA and free cash flow, are useful supplemental financial measures to assess, among other things: the financial performance of our assets without regard to financing methods, capital structure or historical cost basis; the ability of our assets to generate cash to pay interest on our indebtedness; our operational performance and return on invested capital as compared to other companies without regard to financing methods and capital structure; and, with respect to free cash flow, the cash generating capability of our business. The non-GAPP financial metrics used herein should not be considered in isolation or as a substitute for financial measures prepared in accordance with GAAP. (2) PV-10 as of December 31, 2014 Q1 2015 Q2 2015 Q3 2015 Net income $462 $11,723 $14,740 Adjustments to Net income: Unrealized loss (gain) on derivatives 2,406 (1,980) 4,360 Lower of cost or market adjustment (2,179) 44 2,628 Acquisition and integration expense 1,061 470 280 Release of valuation allowance due to Mid Pac acquisition - (18,585) 295 Loss on termination of financing agreement - 19,229 - Change in value of common stock warrants 5,022 (3,313) 1,023 Change in value of contingent consideration 4,929 9,495 4,255 Inventory valuation adjustment - - (13,390) Impairment expense - - 9,639 Adjusted Net Income $11,701 $17,083 $23,830 Depreciation, depletion and amortization 3,251 5,005 4,596 Interest expense and financing costs, net 5,557 5,825 4,387 Equity losses from Laramie Energy Company 1,826 2,950 1,355 Income tax expense (benefit) 65 (22) 174 Adjusted EBITDA $22,400 $30,841 $34,342 Cash Interest (415) (809) (3,000) Cash Capital Expenditures (4,747) (5,126) (5,984) Free Cash Flow $17,238 $24,906 $25,358 Company Company's Share of Lara ie Energy reserves Total PV-10 (2) $1,766 $170,599 $172,365 resent Value of future income taxes discounted at 10% - - - Standardized measure of discount d future n t cash flows $1,766 $170,599 $172,365

29 Non-GAAP Financials Adjusted EBITDA Reconciliation (1) We do not forecast certain amounts that are driven by changes in market prices, such as gains (losses on derivatives and Inventory valuation estimates). (2) We have reconciled Adjusted EBITDA to Operating income for the LTM October 2015 and Full Year 2015 Estimate because certain estimates are only performed on a quarterly basis. LTM EST. Oct'15 FY'15 Total Adjusted EBITDA $139 $105 ↔ $115 Plus: Unrealized loss on derivatives (1) (6) - ↔ - Inventory valuation adjustment (1) 2 - ↔ - Lower of cost or market adjustment (1) (3) - ↔ - Depreciation, depletion and amortization expense (18) (17) ↔ (19) Impairment expense (10) (10) ↔ (10) Acquisition and integration expense (8) - ↔ (2) Total Operating income (2) $96 $78 $84 Pro Forma Adjusted EBITDA
