Attached files
| file | filename |
|---|---|
| 8-K - 8-K - Fox Chase Bancorp Inc | a15-24728_18k.htm |
| EX-99.1 - EX-99.1 - Fox Chase Bancorp Inc | a15-24728_1ex99d1.htm |
Exhibit 99.2
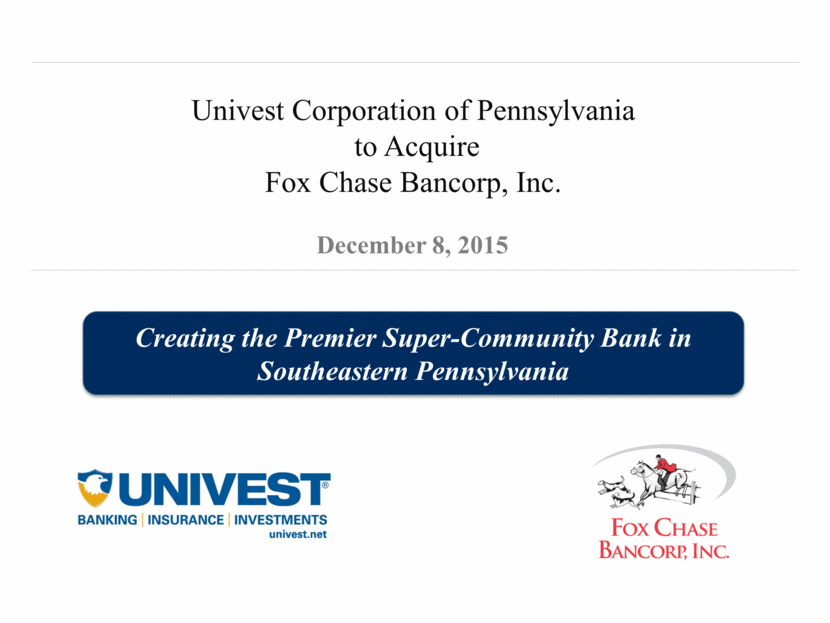
December 8, 2015 Univest Corporation of Pennsylvania to Acquire Fox Chase Bancorp, Inc. Creating the Premier Super-Community Bank in Southeastern Pennsylvania
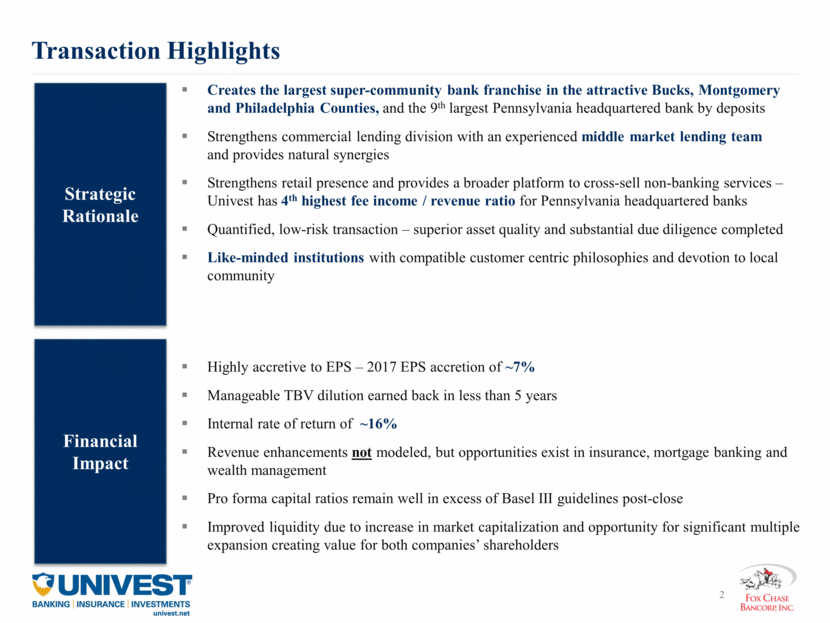
Transaction Highlights Creates the largest super-community bank franchise in the attractive Bucks, Montgomery and Philadelphia Counties, and the 9th largest Pennsylvania headquartered bank by deposits Strengthens commercial lending division with an experienced middle market lending team and provides natural synergies Strengthens retail presence and provides a broader platform to cross-sell non-banking services – Univest has 4th highest fee income / revenue ratio for Pennsylvania headquartered banks Quantified, low-risk transaction – superior asset quality and substantial due diligence completed Like-minded institutions with compatible customer centric philosophies and devotion to local community Strategic Rationale Financial Impact Highly accretive to EPS – 2017 EPS accretion of ~7% Manageable TBV dilution earned back in less than 5 years Internal rate of return of ~16% Revenue enhancements not modeled, but opportunities exist in insurance, mortgage banking and wealth management Pro forma capital ratios remain well in excess of Basel III guidelines post-close Improved liquidity due to increase in market capitalization and opportunity for significant multiple expansion creating value for both companies’ shareholders
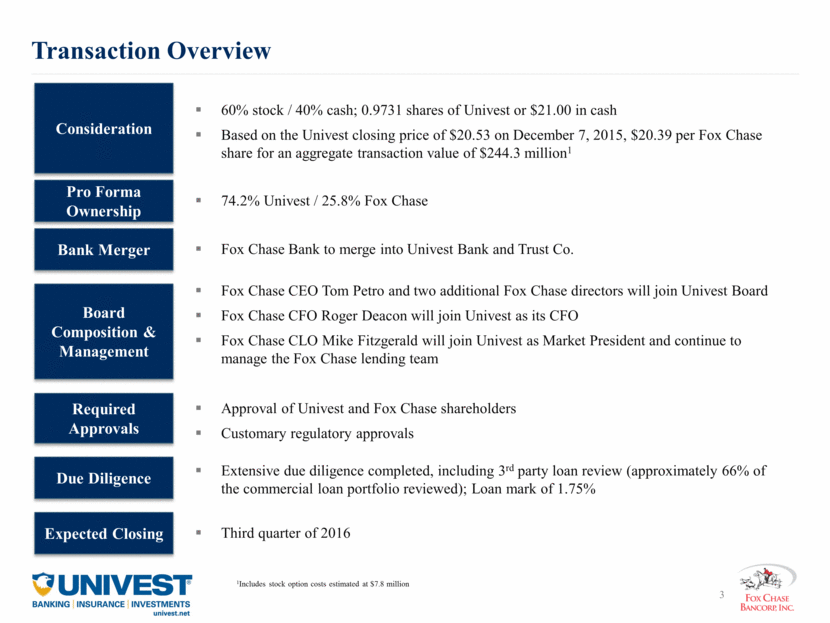
Transaction Overview 60% stock / 40% cash; 0.9731 shares of Univest or $21.00 in cash Based on the Univest closing price of $20.53 on December 7, 2015, $20.39 per Fox Chase share for an aggregate transaction value of $244.3 million1 Consideration Pro Forma Ownership 74.2% Univest / 25.8% Fox Chase Bank Merger Fox Chase Bank to merge into Univest Bank and Trust Co. Board Composition & Management Fox Chase CEO Tom Petro and two additional Fox Chase directors will join Univest Board Fox Chase CFO Roger Deacon will join Univest as its CFO Fox Chase CLO Mike Fitzgerald will join Univest as Market President and continue to manage the Fox Chase lending team Required Approvals Approval of Univest and Fox Chase shareholders Customary regulatory approvals Expected Closing Third quarter of 2016 Due Diligence Extensive due diligence completed, including 3rd party loan review (approximately 66% of the commercial loan portfolio reviewed); Loan mark of 1.75% 1Includes stock option costs estimated at $7.8 million
Overview of Univest Corporation of Pennsylvania Historical Financial Highlights Company Overview Current Market Data Source: SNL Financial 1 Univest’s Reserves/Loans and Reserves/NPLs include the impact of purchase accounting adjustments related to the Valley Green transaction 2 Based on analysts' EPS estimates for 2016 and 2017 of $1.68 and $1.84, respectively $2.9 billion asset institution headquartered in Souderton, Pennsylvania Bank founded in 1876 Provide full range of banking, insurance and wealth management services 4th highest fee income / operating revenue ratio in Pennsylvania $3 billion in assets under management Proven acquiror having integrated 5 transactions in the last 5 years Years MRQ 12/31/2013 12/31/2014 9/30/2015 Balance Sheet Highlights Total Assets ($000) 2,191,559 2,235,321 2,851,568 Total Net Loans ($000) 1,519,257 1,609,265 2,088,338 Total Deposits ($000) 1,844,498 1,861,341 2,372,865 Loans / Deposits (%) 83.6 87.4 88.4 TCE / TA (%) 10.3 9.7 8.8 Performance Measures Net Income ($000) 21,189 22,231 7,528 ROAA (%) 0.95 1.01 1.07 ROAE (%) 7.53 7.74 8.43 ROATCE (%) 9.85 10.86 13.31 Net Interest Margin (%) 3.81 3.87 3.92 Efficiency Ratio (%) 65.8 67.6 66.3 Noninterest Inc. / Op. Rev (%) 37.5 39.7 34.9 Asset Quality (%) NPAs / Assets (%) 1.5 1.1 0.9 Texas Ratio (%) 13.6 10.5 10.5 Reserves / Loans (%) 1 1.59 1.27 0.89 Reserves / NPLs (%) 1 78.56 90.60 72.66 NCOs / Avg Loans (%) 0.77 0.47 0.31 Per Share Information TBVPS ($) 13.53 12.96 12.26 EPS ($) 1.28 1.37 0.39 Market Capitalization: $400 MM P/ TBV: 167% P/ 2016 Est. EPS2: 12.2x P/ 2017 Est. EPS2: 11.2x Dividend Yield: 3.9%

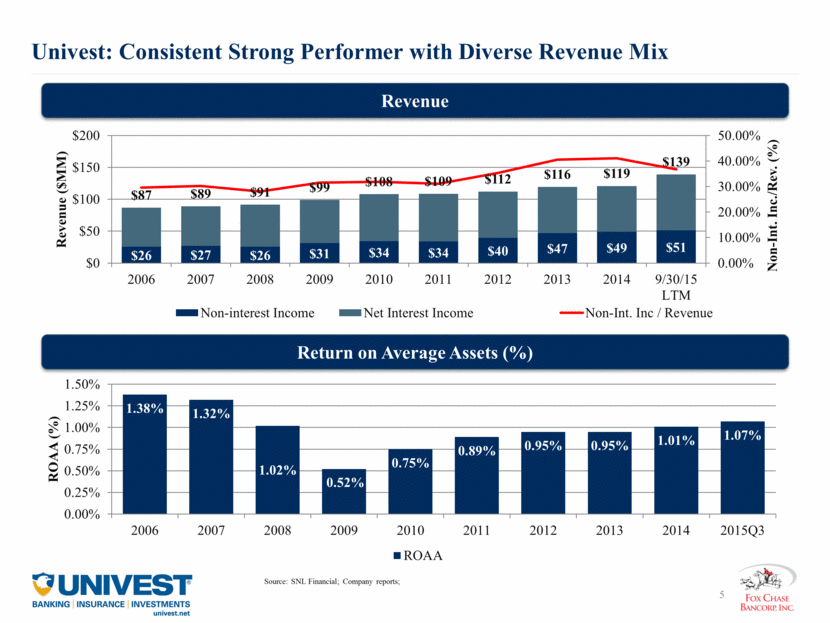
Univest: Consistent Strong Performer with Diverse Revenue Mix Revenue Return on Average Assets (%) Source: SNL Financial; Company reports; $26 $27 $26 $31 $34 $34 $40 $47 $49 $51 $87 $89 $91 $99 $108 $109 $112 $116 $119 $139 0.00% 10.00% 20.00% 30.00% 40.00% 50.00% $0 $50 $100 $150 $200 2006 2007 2008 2009 2010 2011 2012 2013 2014 9/30/15 LTM Non - Int. Inc./Rev. (%) Revenue ($MM) Non-interest Income Net Interest Income Non-Int. Inc / Revenue 1.38% 1.32% 1.02% 0.52% 0.75% 0.89% 0.95% 0.95% 1.01% 1.07% 0.00% 0.25% 0.50% 0.75% 1.00% 1.25% 1.50% 2006 2007 2008 2009 2010 2011 2012 2013 2014 2015Q3 ROAA (%) ROAA
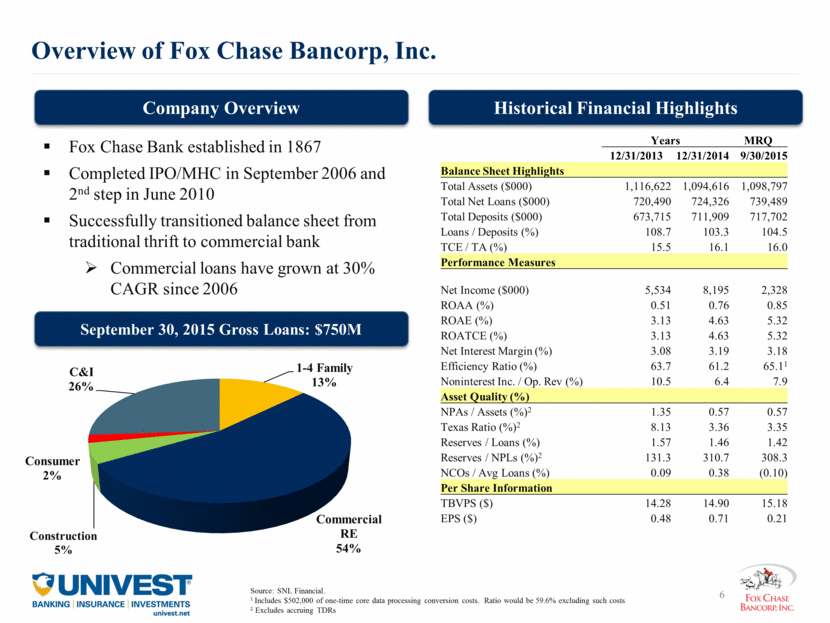
Overview of Fox Chase Bancorp, Inc. Historical Financial Highlights Years MRQ 12/31/2013 12/31/2014 9/30/2015 Balance Sheet Highlights Total Assets ($000) 1,116,622 1,094,616 1,098,797 Total Net Loans ($000) 720,490 724,326 739,489 Total Deposits ($000) 673,715 711,909 717,702 Loans / Deposits (%) 108.7 103.3 104.5 TCE / TA (%) 15.5 16.1 16.0 Performance Measures Net Income ($000) 5,534 8,195 2,328 ROAA (%) 0.51 0.76 0.85 ROAE (%) 3.13 4.63 5.32 ROATCE (%) 3.13 4.63 5.32 Net Interest Margin (%) 3.08 3.19 3.18 Efficiency Ratio (%) 63.7 61.2 65.11 Noninterest Inc. / Op. Rev (%) 10.5 6.4 7.9 Asset Quality (%) NPAs / Assets (%)2 1.35 0.57 0.57 Texas Ratio (%)2 8.13 3.36 3.35 Reserves / Loans (%) 1.57 1.46 1.42 Reserves / NPLs (%)2 131.3 310.7 308.3 NCOs / Avg Loans (%) 0.09 0.38 (0.10) Per Share Information TBVPS ($) 14.28 14.90 15.18 EPS ($) 0.48 0.71 0.21 Company Overview September 30, 2015 Gross Loans: $750M Source: SNL Financial. 1 Includes $502,000 of one-time core data processing conversion costs. Ratio would be 59.6% excluding such costs 2 Excludes accruing TDRs Fox Chase Bank established in 1867 Completed IPO/MHC in September 2006 and 2nd step in June 2010 Successfully transitioned balance sheet from traditional thrift to commercial bank Commercial loans have grown at 30% CAGR since 2006 1 - 4 Family 13% Commercial RE 54% Construction 5% Consumer 2% C&I 26%
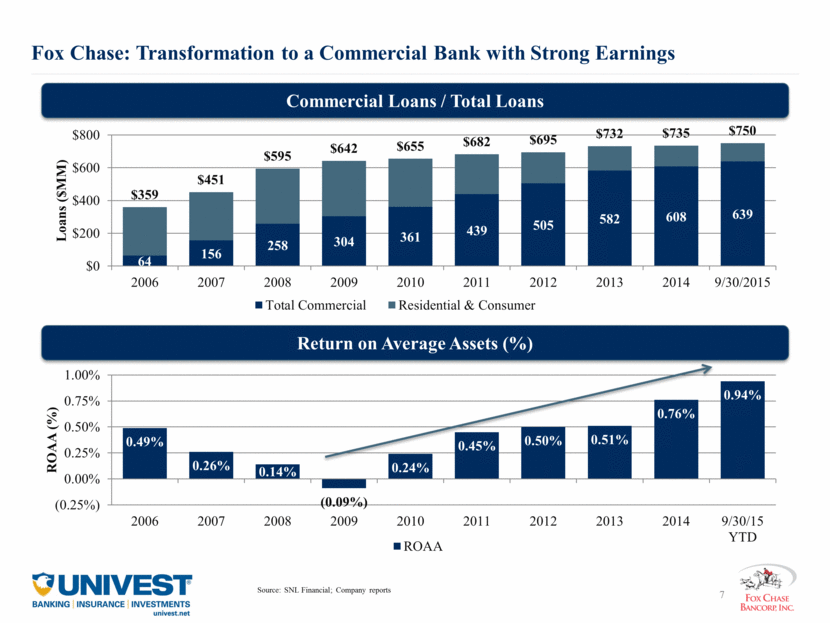
Fox Chase: Transformation to a Commercial Bank with Strong Earnings Commercial Loans / Total Loans Return on Average Assets (%) Source: SNL Financial; Company reports 64 156 258 304 361 439 505 582 608 639 $359 $451 $595 $642 $655 $682 $695 $732 $735 $750 $0 $200 $400 $600 $800 2006 2007 2008 2009 2010 2011 2012 2013 2014 9/30/2015 Loans ($MM) Total Commercial Residential & Consumer 0.49% 0.26% 0.14% (0.09%) 0.24% 0.45% 0.50% 0.51% 0.76% 0.94% (0.25%) 0.00% 0.25% 0.50% 0.75% 1.00% 2006 2007 2008 2009 2010 2011 2012 2013 2014 9/30/15 YTD ROAA (%) ROAA
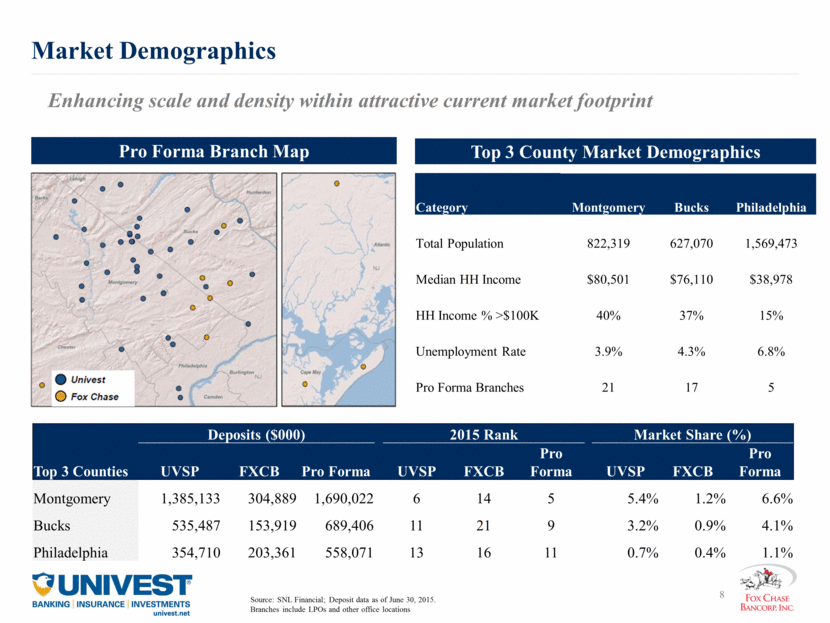
Market Demographics Enhancing scale and density within attractive current market footprint Pro Forma Branch Map Top 3 County Market Demographics Deposits ($000) 2015 Rank Market Share (%) Top 3 Counties UVSP FXCB Pro Forma UVSP FXCB Pro Forma UVSP FXCB Pro Forma Montgomery 1,385,133 304,889 1,690,022 6 14 5 5.4% 1.2% 6.6% Bucks 535,487 153,919 689,406 11 21 9 3.2% 0.9% 4.1% Philadelphia 354,710 203,361 558,071 13 16 11 0.7% 0.4% 1.1% Category Montgomery Bucks Philadelphia Total Population 822,319 627,070 1,569,473 Median HH Income $80,501 $76,110 $38,978 HH Income % >$100K 40% 37% 15% Unemployment Rate 3.9% 4.3% 6.8% Pro Forma Branches 21 17 5 Source: SNL Financial; Deposit data as of June 30, 2015. Branches include LPOs and other office locations
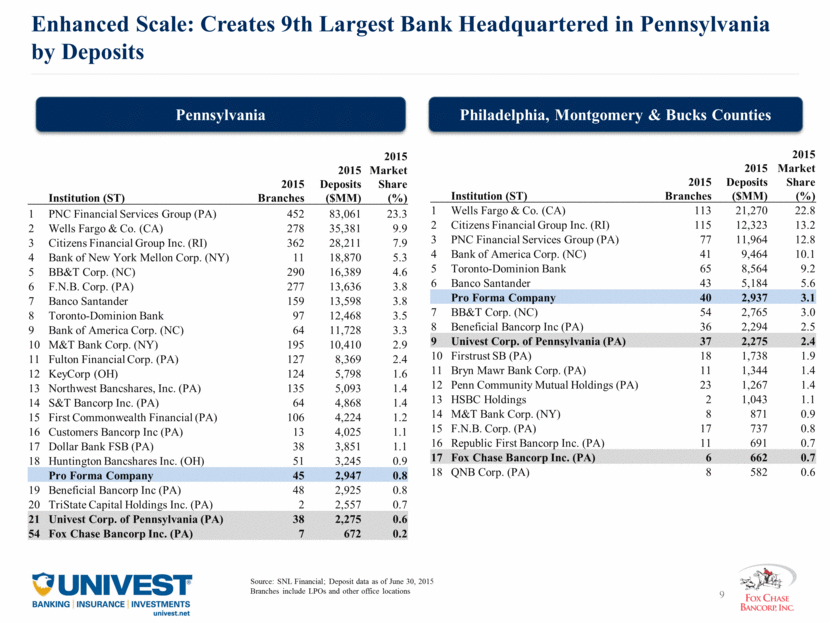
Enhanced Scale: Creates 9th Largest Bank Headquartered in Pennsylvania by Deposits Source: SNL Financial; Deposit data as of June 30, 2015 Branches include LPOs and other office locations Pennsylvania Philadelphia, Montgomery & Bucks Counties Institution (ST) 2015 Branches 2015 Deposits ($MM) 2015 Market Share (%) 1 PNC Financial Services Group (PA) 452 83,061 23.3 2 Wells Fargo & Co. (CA) 278 35,381 9.9 3 Citizens Financial Group Inc. (RI) 362 28,211 7.9 4 Bank of New York Mellon Corp. (NY) 11 18,870 5.3 5 BB&T Corp. (NC) 290 16,389 4.6 6 F.N.B. Corp. (PA) 277 13,636 3.8 7 Banco Santander 159 13,598 3.8 8 Toronto-Dominion Bank 97 12,468 3.5 9 Bank of America Corp. (NC) 64 11,728 3.3 10 M&T Bank Corp. (NY) 195 10,410 2.9 11 Fulton Financial Corp. (PA) 127 8,369 2.4 12 KeyCorp (OH) 124 5,798 1.6 13 Northwest Bancshares, Inc. (PA) 135 5,093 1.4 14 S&T Bancorp Inc. (PA) 64 4,868 1.4 15 First Commonwealth Financial (PA) 106 4,224 1.2 16 Customers Bancorp Inc (PA) 13 4,025 1.1 17 Dollar Bank FSB (PA) 38 3,851 1.1 18 Huntington Bancshares Inc. (OH) 51 3,245 0.9 Pro Forma Company 45 2,947 0.8 19 Beneficial Bancorp Inc (PA) 48 2,925 0.8 20 TriState Capital Holdings Inc. (PA) 2 2,557 0.7 21 Univest Corp. of Pennsylvania (PA) 38 2,275 0.6 54 Fox Chase Bancorp Inc. (PA) 7 672 0.2 Institution (ST) 2015 Branches 2015 Deposits ($MM) 2015 Market Share (%) 1 Wells Fargo & Co. (CA) 113 21,270 22.8 2 Citizens Financial Group Inc. (RI) 115 12,323 13.2 3 PNC Financial Services Group (PA) 77 11,964 12.8 4 Bank of America Corp. (NC) 41 9,464 10.1 5 Toronto-Dominion Bank 65 8,564 9.2 6 Banco Santander 43 5,184 5.6 Pro Forma Company 40 2,937 3.1 7 BB&T Corp. (NC) 54 2,765 3.0 8 Beneficial Bancorp Inc (PA) 36 2,294 2.5 9 Univest Corp. of Pennsylvania (PA) 37 2,275 2.4 10 Firstrust SB (PA) 18 1,738 1.9 11 Bryn Mawr Bank Corp. (PA) 11 1,344 1.4 12 Penn Community Mutual Holdings (PA) 23 1,267 1.4 13 HSBC Holdings 2 1,043 1.1 14 M&T Bank Corp. (NY) 8 871 0.9 15 F.N.B. Corp. (PA) 17 737 0.8 16 Republic First Bancorp Inc. (PA) 11 691 0.7 17 Fox Chase Bancorp Inc. (PA) 6 662 0.7 18 QNB Corp. (PA) 8 582 0.6
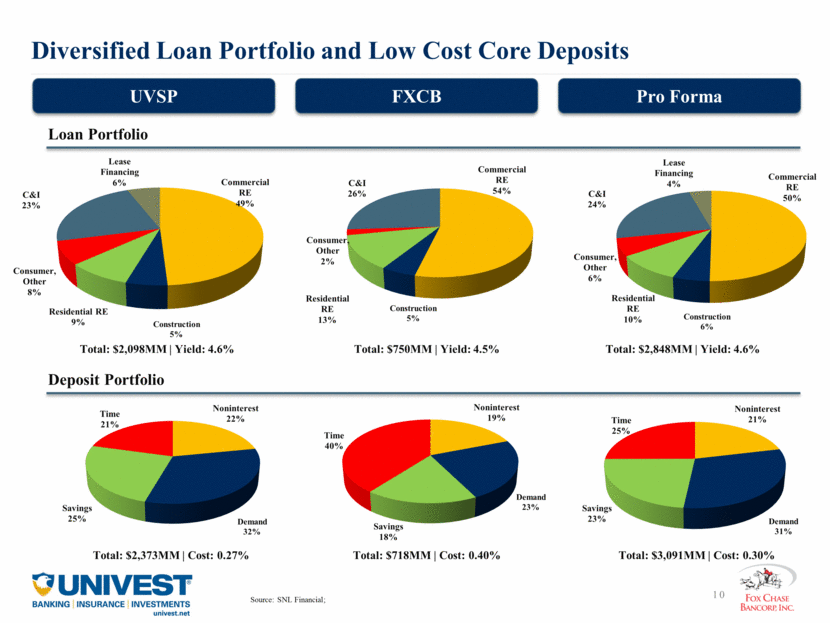
Diversified Loan Portfolio and Low Cost Core Deposits UVSP FXCB Pro Forma Loan Portfolio Deposit Portfolio Total: $2,098MM Yield: 4.6% Total: $750MM Yield: 4.5% Total: $2,848MM Yield: 4.6% Total: $2,373MM Cost: 0.27% Total: $718MM Cost: 0.40% Total: $3,091MM Cost: 0.30% Source: SNL Financial; Noninterest 22% Demand 32% Savings 25% Time 21% Noninterest 19% Demand 23% Savings 18% Time 40% Noninterest 21% Demand 31% Savings 23% Time 25% Commercial RE 49% Construction 5% Residential RE 9% Consumer, Other 8% C&I 23% Lease Financing 6% Commercial RE 54% Construction 5% Residential RE 13% Consumer, Other 2% C&I 26% Commercial RE 50% Construction 6% Residential RE 10% Consumer, Other 6% C&I 24% Lease Financing 4%
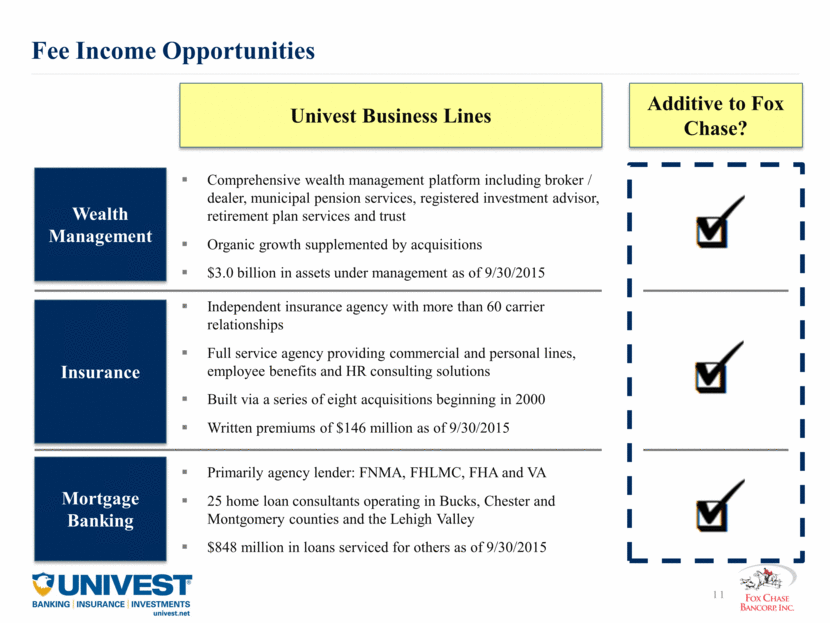
Fee Income Opportunities Comprehensive wealth management platform including broker / dealer, municipal pension services, registered investment advisor, retirement plan services and trust Organic growth supplemented by acquisitions $3.0 billion in assets under management as of 9/30/2015 Wealth Management Insurance Independent insurance agency with more than 60 carrier relationships Full service agency providing commercial and personal lines, employee benefits and HR consulting solutions Built via a series of eight acquisitions beginning in 2000 Written premiums of $146 million as of 9/30/2015 Mortgage Banking Primarily agency lender: FNMA, FHLMC, FHA and VA 25 home loan consultants operating in Bucks, Chester and Montgomery counties and the Lehigh Valley $848 million in loans serviced for others as of 9/30/2015 Univest Business Lines Additive to Fox Chase?
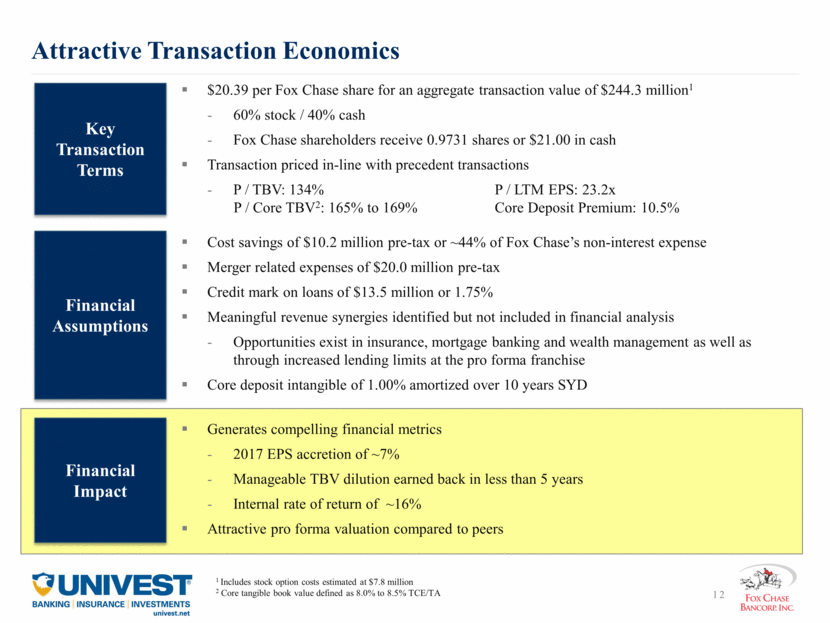
Attractive Transaction Economics $20.39 per Fox Chase share for an aggregate transaction value of $244.3 million1 60% stock / 40% cash Fox Chase shareholders receive 0.9731 shares or $21.00 in cash Transaction priced in-line with precedent transactions P / TBV: 134% P / LTM EPS: 23.2x P / Core TBV2: 165% to 169% Core Deposit Premium: 10.5% Key Transaction Terms Financial Assumptions Cost savings of $10.2 million pre-tax or ~44% of Fox Chase’s non-interest expense Merger related expenses of $20.0 million pre-tax Credit mark on loans of $13.5 million or 1.75% Meaningful revenue synergies identified but not included in financial analysis Opportunities exist in insurance, mortgage banking and wealth management as well as through increased lending limits at the pro forma franchise Core deposit intangible of 1.00% amortized over 10 years SYD Financial Impact Generates compelling financial metrics 2017 EPS accretion of ~7% Manageable TBV dilution earned back in less than 5 years Internal rate of return of ~16% Attractive pro forma valuation compared to peers 1 Includes stock option costs estimated at $7.8 million 2 Core tangible book value defined as 8.0% to 8.5% TCE/TA
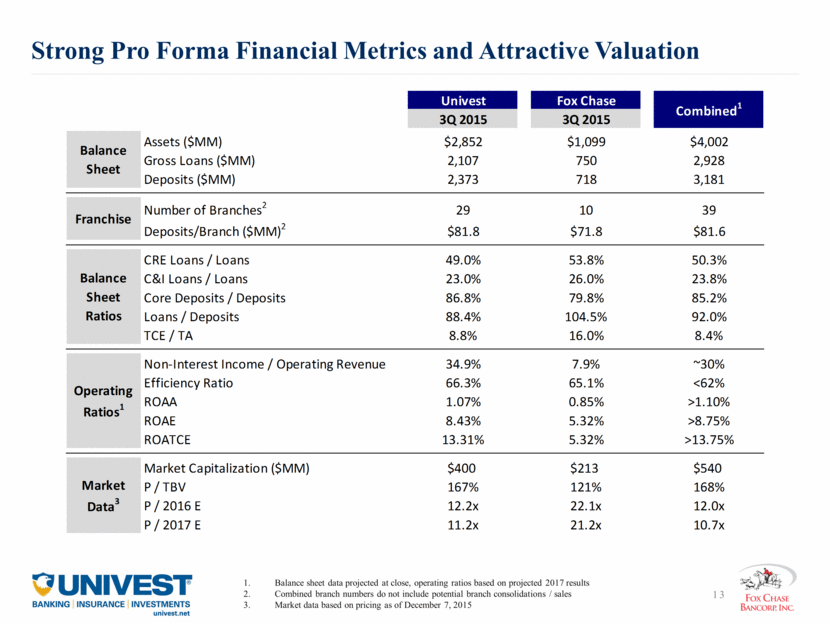
Strong Pro Forma Financial Metrics and Attractive Valuation Balance sheet data projected at close, operating ratios based on projected 2017 results Combined branch numbers do not include potential branch consolidations / sales Market data based on pricing as of December 7, 2015 Univest Fox Chase 3Q 2015 3Q 2015 Assets ($MM) $2,852 $1,099 $4,002 Gross Loans ($MM) 2,107 750 2,928 Deposits ($MM) 2,373 718 3,181 Number of Branches 2 29 10 39 Deposits/Branch ($MM) 2 $81.8 $71.8 $81.6 CRE Loans / Loans 49.0% 53.8% 50.3% C&I Loans / Loans 23.0% 26.0% 23.8% Core Deposits / Deposits 86.8% 79.8% 85.2% Loans / Deposits 88.4% 104.5% 92.0% TCE / TA 8.8% 16.0% 8.4% Non-Interest Income / Operating Revenue 34.9% 7.9% ~30% Efficiency Ratio 66.3% 65.1% <62% ROAA 1.07% 0.85% >1.10% ROAE 8.43% 5.32% >8.75% ROATCE 13.31% 5.32% >13.75% Market Capitalization ($MM) $400 $213 $540 P / TBV 167% 121% 168% P / 2016 E 12.2x 22.1x 12.0x P / 2017 E 11.2x 21.2x 10.7x Market Data 3 Combined 1 Balance Sheet Franchise Balance Sheet Ratios Operating Ratios 1
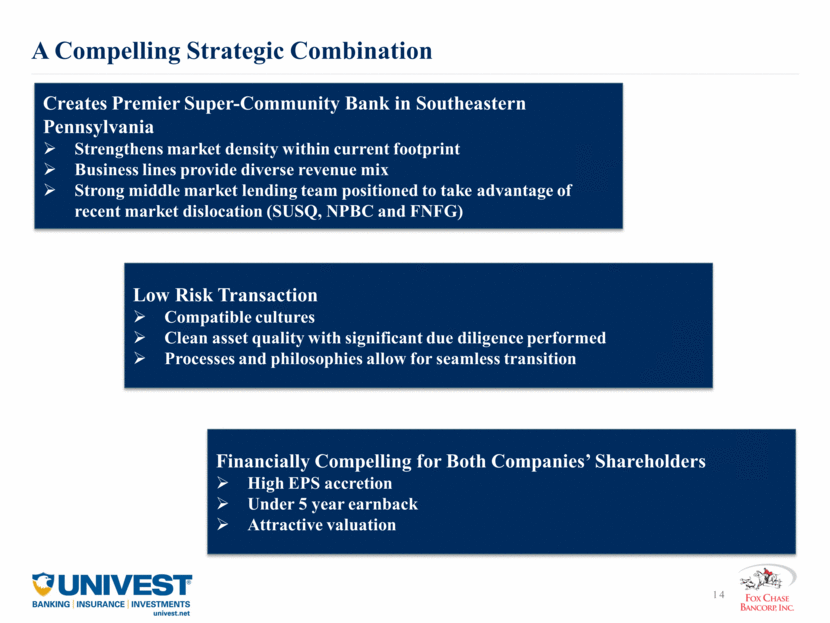
A Compelling Strategic Combination Creates Premier Super-Community Bank in Southeastern Pennsylvania Strengthens market density within current footprint Business lines provide diverse revenue mix Strong middle market lending team positioned to take advantage of recent market dislocation (SUSQ, NPBC and FNFG) Low Risk Transaction Compatible cultures Clean asset quality with significant due diligence performed Processes and philosophies allow for seamless transition Financially Compelling for Both Companies’ Shareholders High EPS accretion Under 5 year earnback Attractive valuation
Forward-Looking Statements This presentation contains forward-looking statements within the meaning of the Private Securities Litigation Reform Act of 1995. These statements include, but are not limited to, expectations or predictions of future financial, business performance or conditions relating to Univest and Fox Chase, or other effects of the proposed merger of Univest and Fox Chase. Forward looking statements are typically identified by words such as “believe,” “expect,” “anticipate,” “intend,” “target,” “estimate,” “continue,” “positions,” “prospects or “potential,” by future conditional verbs such as “will,” “would,” “should,” “could” or “may,” or by variations of such words or by similar expressions. These forward looking statements are subject to numerous assumptions, risks and uncertainties, which change over time. Forward looking statements are made only as of the date of this presentation, and neither Univest or Fox Chase undertakes any obligation to update any forward looking statements contained in this presentation to reflect events or conditions after the date hereof. Actual results may differ materially from current projections. In addition to factors previously disclosed in the reports filed by Univest and Fox Chase with the U.S. Securities and Exchange Commission (the “SEC”) and those identified elsewhere in this document, the following factors, among others, could cause actual results to differ materially from forward looking statements or historical performance: the ability to obtain regulatory approvals and satisfy other closing conditions to the merger, including approval by shareholders of Univest and Fox Chase; the timing of closing the merger; difficulties and delays in integrating the business or fully realizing cost savings and other benefits; changes in asset quality and credit risk; the inability to sustain revenue and earnings growth; changes in interest rates and capital markets; inflation; customer acceptance of products and services; customer borrowing, repayment, investment and deposit practices; competitive conditions; economic conditions; the impact, extent and timing of technological changes; and other actions of the Federal Reserve Board and other legislative and regulatory actions and reforms. Important Additional Information and Where to Find It Univest intends to file with the SEC a Registration Statement on Form S-4 relating to the proposed merger, which will include a prospectus for the offer and sale of Univest common stock as well as a joint proxy statement of Fox Chase and Univest for the solicitation of proxies from their shareholders for use at the meetings at which the merger will be considered. This communication does not constitute an offer to sell or the solicitation of an offer to buy any securities or a solicitation of any vote or approval. SHAREHOLDERS OF UNIVEST AND FOX CHASE ARE URGED TO READ THE REGISTRATION STATEMENT AND THE JOINT PROXY STATEMENT-PROSPECTUS REGARDING THE MERGER WHEN IT BECOMES AVAILABLE, AND ANY OTHER RELEVANT DOCUMENTS FILED WITH THE SEC, AS WELL AS ANY AMENDMENTS OR SUPPLEMENTS TO THOSE DOCUMENTS, BECAUSE THEY WILL CONTAIN IMPORTANT INFORMATION. A free copy of the joint proxy statement-prospectus, as well as other filings containing information about Univest and Fox Chase, may be obtained at the SEC's website at http://www.sec.gov. In addition, copies of the joint proxy statement -prospectus can also be obtained free of charge by directing a request to Univest Corporation of Pennsylvania, Univest Plaza, 14 North Main Street, P.O. Box 64197, Souderton, PA 18964, attention: Karen E. Tejkl, Secretary, telephone 215-721-8397; or to Fox Chase Bancorp, Inc., 4390 Davisville Road, Hatboro, Pennsylvania 19040, attention: Roger Deacon, telephone 215-775-1435. Univest, Fox Chase, and certain of their directors and executive officers may, under the rules of the SEC, be deemed to be "participants" in the solicitation of proxies from Univest’s and Fox Chase’s shareholders in connection with the merger. Information concerning the interests of the persons who may be considered "participants" in the solicitation will be set forth in the proxy statement-prospectus relating to the merger. Information concerning Univest’s directors and executive officers, including their ownership of Univest common stock, is also set forth in its proxy statement previously filed with the SEC on March 19, 2015. Information concerning Fox Chase’s directors and executive officers, including their ownership of Fox Chase common stock, is also set forth in its proxy statement previously filed with the SEC on April 10, 2015. Shareholders may obtain additional information regarding interest of such participants by reading the registration statement and the joint proxy statement/prospectus when they become available.
