Attached files
| file | filename |
|---|---|
| 8-K - 8-K - REGIONS FINANCIAL CORP | rf-20151208x8xk.htm |

® ® Goldman Sachs U.S. Financial Services Conference December 9, 2015 David Turner, CFO Exhibit 99.1
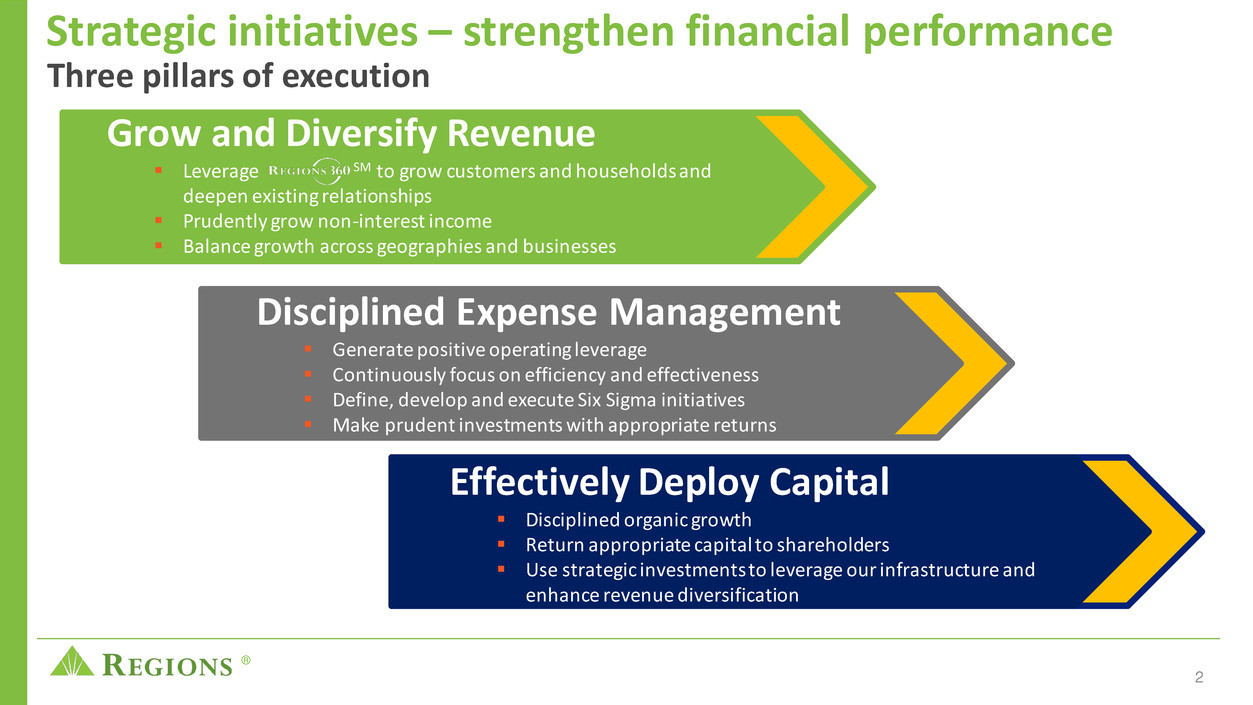
® Strategic initiatives – strengthen financial performance 2 Effectively Deploy Capital Disciplined organic growth Return appropriate capital to shareholders Use strategic investments to leverage our infrastructure and enhance revenue diversification Disciplined Expense Management Generate positive operating leverage Continuously focus on efficiency and effectiveness Define, develop and execute Six Sigma initiatives Make prudent investments with appropriate returns Three pillars of execution Grow and Diversify Revenue Leverage SM to grow customers and households and deepen existing relationships Prudently grow non-interest income Balance growth across geographies and businesses

® Total Revenue 3 63% 37% Net Interest Income Non Interest Income Grow and Diversify Revenue Total Revenue(1) Mix – 2015 YTD $3.9B (1) Adjusted non-GAAP; see appendix for reconciliation

® Favorable asset sensitivity position Positioned to win in any rate environment 4 Loan Mix(1) 59% 41% Variable Fixed (1) As of 3Q15 Naturally asset-sensitive balance sheet Primarily core deposit funded 59% of loans have variable rates Asset sensitive under a range of deposit stress scenarios Net interest income increases even in a flat rate environment, commensurate with loan growth
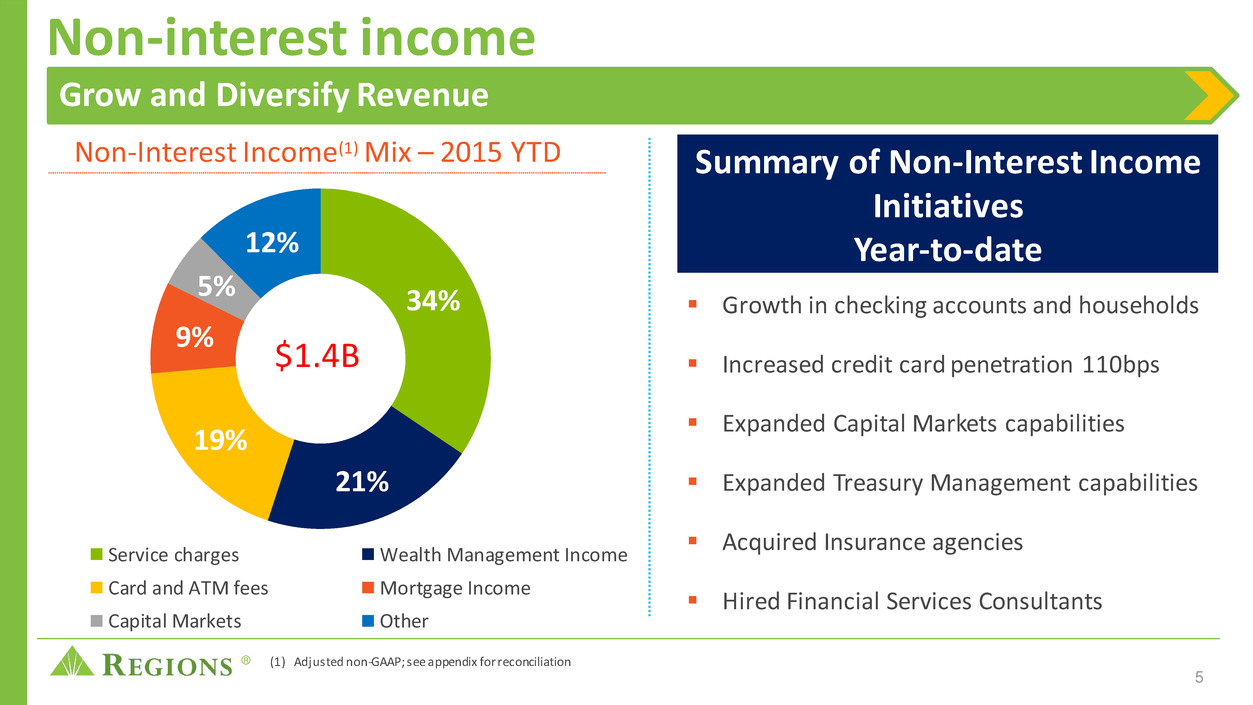
® Non-interest income 5 34% 21% 19% 9% 5% 12% Service charges Wealth Management Income Card and ATM fees Mortgage Income Capital Markets Other $1.4B Non-Interest Income(1) Mix – 2015 YTD (1) Adjusted non-GAAP; see appendix for reconciliation Grow and Diversify Revenue Summary of Non-Interest Income Initiatives Year-to-date Growth in checking accounts and households Increased credit card penetration 110bps Expanded Capital Markets capabilities Expanded Treasury Management capabilities Acquired Insurance agencies Hired Financial Services Consultants
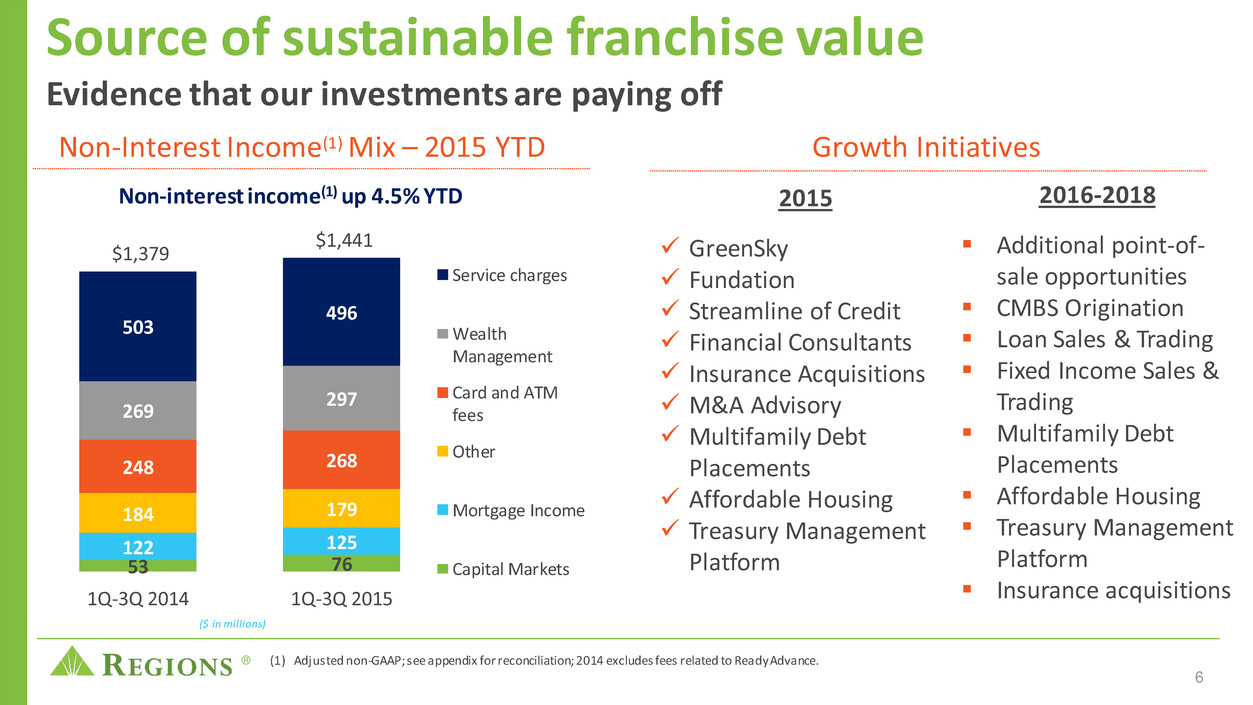
® Source of sustainable franchise value Evidence that our investments are paying off 6 Non-Interest Income(1) Mix – 2015 YTD 2015 GreenSky Fundation Streamline of Credit Financial Consultants Insurance Acquisitions M&A Advisory Multifamily Debt Placements Affordable Housing Treasury Management Platform 2016-2018 Additional point-of- sale opportunities CMBS Origination Loan Sales & Trading Fixed Income Sales & Trading Multifamily Debt Placements Affordable Housing Treasury Management Platform Insurance acquisitions Growth Initiatives Non-interest income(1) up 4.5% YTD 53 76 122 125 184 179 248 268 269 297 503 496 $1,379 $1,441 1Q-3Q 2014 1Q-3Q 2015 Service charges Wealth Management Card and ATM fees Other Mortgage Income Capital Markets ($ in millions) (1) Adjusted non-GAAP; see appendix for reconciliation; 2014 excludes fees related to Ready Advance.

® $3,666 $3,532 $3,471 $3,432 $3,358 $2,593 2010 2011 2012 2013 2014 2015 YTD Expenses 7 (1) Adjusted non-GAAP; see appendix for reconciliation Full Year Expenses(1) Disciplined Expense Management 54% 10% 9% 4% 3% 3% 3% 14% Salaries and Benefits Occupancy FF&E Outside Services Professional & Legal FDIC Marketing Other Total Expense(1) Mix - 2015 YTD ($ in millions)

® 8 2016 35-45% Elimination of core expenses of $300 million over the next 3 years Represents ~9% of 2015 adjusted expense base Restructuring Core Expense Base Disciplined Expense Management

® 9 Disciplined Expense Management Committed to improve efficiencies Hiring restrictions for non-customer facing positions started Oct 2015 Streamlining and automating processes to reduce personnel needs Partially through staffing reductions and through attrition Evaluate staffing models, spans and layers throughout the Company Ensure incentives align to the execution of this plan Leverage technology to reduce dependency on labor 60-65% Operational Efficiencies Branch reconfiguration and continued consolidations: 100-150 branches Targeted reduction in total occupancy of 1 million square feet or ~10% 10 - 15% Branch and Real Estate Optimization Reduce third-party spend Curtail discretionary expenditures 25 - 30% Third-Party, Discretionary and Other
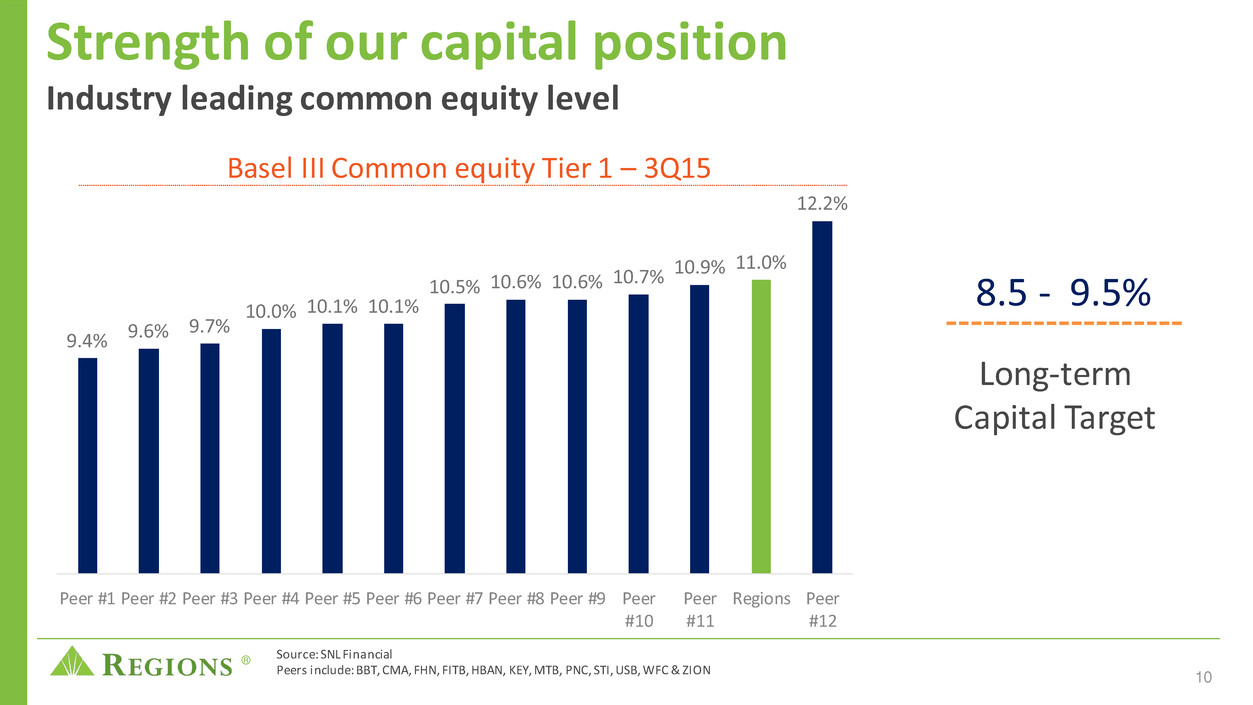
® Strength of our capital position Industry leading common equity level 10 9.4% 9.6% 9.7% 10.0% 10.1% 10.1% 10.5% 10.6% 10.6% 10.7% 10.9% 11.0% 12.2% Peer #1 Peer #2 Peer #3 Peer #4 Peer #5 Peer #6 Peer #7 Peer #8 Peer #9 Peer #10 Peer #11 Regions Peer #12 Source: SNL Financial Peers include: BBT, CMA, FHN, FITB, HBAN, KEY, MTB, PNC, STI, USB, WFC & ZION Basel III Common equity Tier 1 – 3Q15 Long-term Capital Target 8.5 - 9.5%

® 11 Capital Priorities Effectively Deploy Capital Strategic InvestmentsDividends Share RepurchasesOrganic Growth
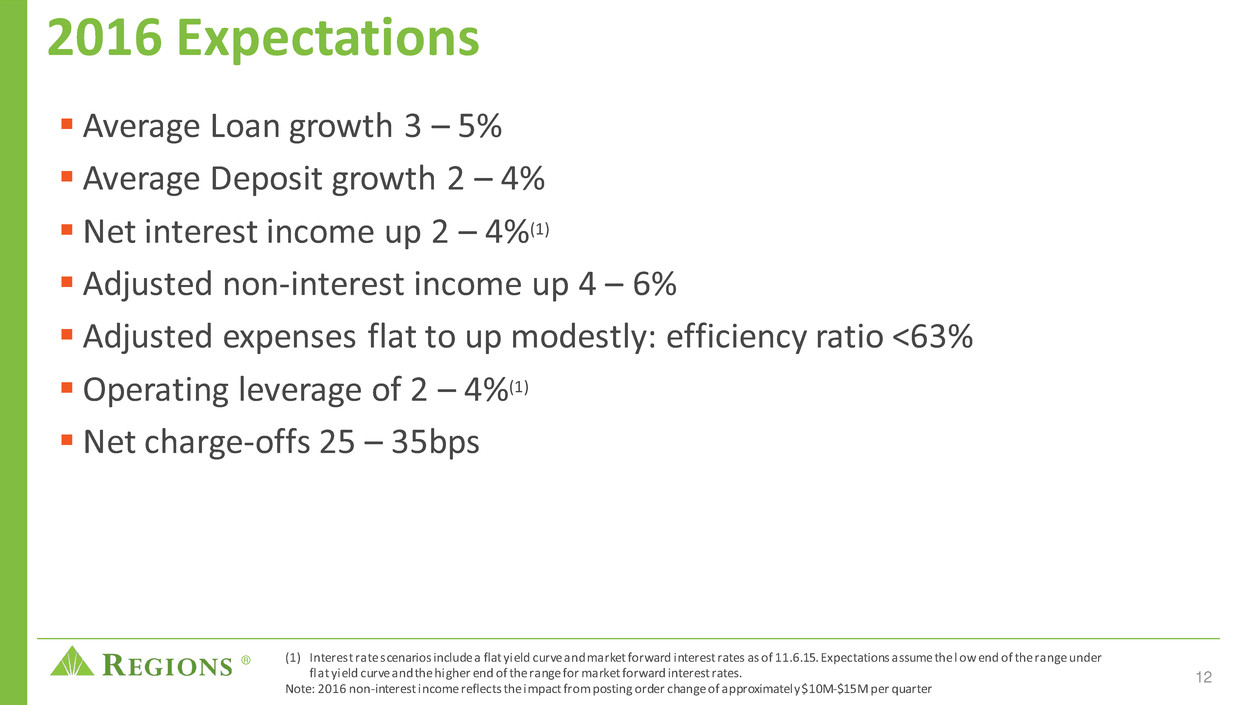
® 2016 Expectations Average Loan growth 3 – 5% Average Deposit growth 2 – 4% Net interest income up 2 – 4%(1) Adjusted non-interest income up 4 – 6% Adjusted expenses flat to up modestly: efficiency ratio <63% Operating leverage of 2 – 4%(1) Net charge-offs 25 – 35bps 12 (1) Interest rate scenarios include a flat yield curve and market forward interest rates as of 11.6.15. Expectations assume the l ow end of the range under flat yield curve and the higher end of the range for market forward interest rates. Note: 2016 non-interest income reflects the impact from posting order change of approximately $10M-$15M per quarter

® Why Regions? – Building sustainable franchise value 13 Effectively Deploy Capital Grow and Diversify Revenue Disciplined Expense Management Adjusted EPS growth of 12-15% (CAGR) Adjusted efficiency ratio of <60% Adjusted ROATCE 12-14% Three pillars of execution Long-term expected results How we will deliver Leverage our strengths Team Culture Execution Markets Investing in growth initiatives Expense eliminations Grow earnings Leverage capital Return capital

® Appendix 14

® Non–GAAP Reconciliation: Non-Interest Expense, Non-Interest Income and Revenue Non-interest expense (GAAP) is presented excluding certain adjustments to arrive at adjusted non -interest expense (non-GAAP). Non-interest income (GAAP) is presented excluding certain adjustments to arrive at adjusted non-interest income (non- GAAP). Net interest income and non-interest income are added together to arrive at total revenue. Regions believes that the exclusion of these adjustments provides a meaningful base for period-to-period comparisons, which management believes will assist investors in analyzing the operating results of the Company and predicting future performance. These non -GAAP financial measures are also used by management to assess the performance of Regions’ business. It is possible that the activities related to the adjustments may recur; however, management does not consider the activities related to the adjustme nts to be indications of ongoing operations. Regions believes that presentation of these non-GAAP financial measures will permit investors to assess the performance of the Company on the same basis as that applied by management. Nine Months Ended September 30 Change Nine Months Ended September 30, 2015 vs. 2014 2015 2014 Amount Percent Non-interest expense from continuing operations (GAAP) $ 2,734 $ 2,463 $ 271 11.0% Significant items: Professional, legal and regulatory expenses (48) 7 (55) NM Branch consolidation, property and equipment charges (50) (6) (44) NM Gain on sale of TDRs held for sale, net - 35 (35) -100.0% Loss on early extinguishment of debt (43) - (43) NM Adjusted non-interest expense (non-GAAP) $ 2,593 $ 2,499 $ 94 3.8% Non-interest income from continuing operations (GAAP) $ 1,557 $ 1,429 $ 128 9.0% Significant items: Securities gains, net (18) (15) (3) 20.0% Ready advance fees - (25) 25 -100.0% Insurance proceeds (90) - (90) NM Leveraged lease termination gains, net (8) (10) 2 -20.0% Adjusted non-interest income (non-GAAP) A $ 1,441 $ 1,379 $ 62 4.5% Net interest income (GAAP) B 2,471 2,460 11 0.4% Adjusted total revenue (non-GAAP) A+B $ 3,912 $ 3,839 $ 73 1.9% NM - Not Meaningful ($ in millions) 15

® Non–GAAP Reconciliation: Non-Interest Expense Non-interest expense (GAAP) is presented excluding certain adjustments to arrive at adjusted non-interest expense (non-GAAP). Regions believes that the exclusion of these adjustments provides a meaningful base for period-to-period comparisons, which management believes will assist investors in analyzing the operating results of the Company and predicting future performance. These non-GAAP financial measures are also used by management to assess the performance of Regions’ business. It is possible that the activities related to the adjustments may recur; however, management does not consider the activities related to the adjustments to be indications of ongoing operations. Regions believes that presentation of these non-GAAP financial measures will permit investors to assess the performance of the Company on the same basis as that applied by management. Nine Months Ended Year Ended December 31 Sept 30 2010 2011 2012 2013 2014 2015 Non-interest expense from continuing operations (GAAP) $ 3,859 $ 3,862 $ 3,526 $ 3,556 $ 3,432 $ 2,734 Significant items: Professional, legal and regulatory expenses (75) - - (58) (93) (48) Branch consolidation, property and equipment charges (8) (75) - (5) (16) (50) Gain on sale of TDRs held for sale, net - - - - 35 - Loss on early extinguishment of debt (108) - (11) (61) - (43) Goodwill impairment - (253) - - - - Securities impairment, net (2) (2) (2) - - - REIT investment early termination costs - - (42) - - - Adjusted non-interest expense (non-GAAP) $ 3,666 $ 3,532 $ 3,471 $ 3,432 $ 3,358 $ 2,593 ($ in millions) 16
® 17 Forward-looking statements This presentation may include forward-looking statements, as defined in the Private Securities Litigation Reform Act of 1995, wh ich reflect Regions’ current views with respect to future events and financial performance. Forward-looking statements are not based on historical information, but rather are related to future operations, strategies, fin ancial results or other developments. Forward-looking statements are based on management’s expectations as well as certain assumptions and estimates made by, and information available to, management at the time the statements are made. Those statements are based on general assumptions and are subject to various risks, uncertainties and other factors that may cause actual results to differ materially from the views, beliefs and projections expressed in such statements. These risks, uncertainties and other factors include, but are not l imited to, those described below: • Current and future economic and market conditions in the United States generally or in the communities we serve, including th e effects of declines in property values, unemployment rates and potential reductions of economic growth, which may adversely affect our lending and other businesses and our financial results and conditions. • Possible changes in trade, monetary and fiscal policies of, and other activities undertaken by, governments, agencies, centra l banks and similar organizations, which could have a material adverse effect on our earnings. • The effects of a possible downgrade in the U.S. government’s sovereign credit rating or outlook, which could result in risks to us and general economic conditions that we are not able to predict. • Possible changes in market interest rates or capital markets could adversely affect our revenue and expense, the value of assets and obligations, and the availability and cost of capital and liquidity. • Any impairment of our goodwill or other intangibles, or any adjustment of valuation allowances on our deferred tax assets due to adverse changes in the economic environment, declining operations of the reporting unit, or other factors. • Possible changes in the creditworthiness of customers and the possible impairment of the collectability of loans. • Changes in the speed of loan prepayments, loan origination and sale volumes, charge -offs, loan loss provisions or actual loan losses where our allowance for loan losses may not be adequate to cover our eventual losses. • Possible acceleration of prepayments on mortgage-backed securities due to low interest rates, and the related acceleration of premium amortization on those securities. • Our ability to effectively compete with other financial services companies, some of whom possess greater financial resources than we do and are subject to different regulatory standards than we are. • Loss of customer checking and savings account deposits as customers pursue other, higher-yield investments, which could increase our funding costs. • Our inability to develop and gain acceptance from current and prospective customers for new products and services in a timely manner could have a negative impact on our revenue. • Changes in laws and regulations affecting our businesses, such as the Dodd-Frank Act and other legislation and regulations relating to bank products and services, as well as changes in the enforcement and interpretation of such laws and regulations by applicable governmental and self-regulatory agencies, which could require us to change certain business practices, increase compliance risk, reduce our revenue, impose additional costs on us, or otherwise negatively affect our businesses. • Our ability to obtain no regulatory objection (as part of the comprehensive capital analysis and review ("CCAR") process or o therwise) to take certain capital actions, including paying dividends and any plans to increase common stock dividends, repurchase common stock under current or future programs, or redeem preferred stock or other regulato ry capital instruments, may impact our ability to return capital to stockholders and market perceptions of us. • Our ability to comply with applicable capital and liquidity requirements (including the finalized Basel III capital standards), including our ability to generate capital internally or raise capital on favorable terms, and if we fail to meet requirements, our financial condition could be negatively impacted. • The costs, including possibly incurring fines, penalties, or other negative effects (including reputational harm) of any adve rse judicial, administrative, or arbitral rulings or proceedings, regulatory enforcement actions, or other legal actions to which we or any of our subsidiaries are a party, and which may adversely affect our results.

® 18 • Our ability to manage fluctuations in the value of assets and liabilities and off -balance sheet exposure so as to maintain sufficient capital and liquidity to support our business. • Possible changes in consumer and business spending and saving habits and the related effect on our ability to increase assets and to attract deposits, which could adversely affect our net income. • Any inaccurate or incomplete information provided to us by our customers or counterparties. • Inability of our framework to manage risks associated with our business such as credit risk and operational risk, including t hird-party vendors and other service providers, which could, among other things, result in a breach of operating or security systems as a result of a cyber attack or similar act. • The inability of our internal disclosure controls and procedures to prevent, detect or mitigate any material errors or fraudu lent acts. • The effects of geopolitical instability, including wars, conflicts and terrorist attacks and the potential impact, directly o r indirectly on our businesses. • The effects of man-made and natural disasters, including fires, floods, droughts, tornadoes, hurricanes, and environmental damage, which may negatively affect our operations and/or our loan portfolios and increase our cost of conducting business. • Our inability to keep pace with technological changes could result in losing business to competitors. • Our ability to identify and address cyber-security risks such as data security breaches, "denial of service" attacks, "hacking" and identity theft, a failure of which could disrupt our business and result in the disclosure of and/or misuse or misappropriation of confidential or proprietary information; increased costs; losses; or adverse effects to our reputation. • Possible downgrades in our credit ratings or outlook could increase the costs of funding from capital markets. • The effects of problems encountered by other financial institutions that adversely affect us or the banking industry generally could require us to change certain business practices, reduce our revenue, impose additional costs on us, or otherwise negatively affect our businesses. • The effects of the failure of any component of our business infrastructure provided by a third party could disrupt our busine sses; result in the disclosure of and/or misuse of confidential information or proprietary information; increase our costs; negatively affect our reputation; and cause losses. • Our ability to receive dividends from our subsidiaries could affect our l iquidity and ability to pay dividends to stockholders. • Changes in accounting policies or procedures as may be required by the Financial Accounting Standards Board or other regulato ry agencies could materially affect how we report our financial results. • The effects of any damage to our reputation resulting from developments related to any of the items identified above. Forward-looking statements continued The foregoing list of factors is not exhaustive. For discussion of these and other factors that may cause actual results to d iffer from expectations, look under the captions “Forward-Looking Statements” and “Risk Factors" of Regions' Annual Report on Form 10-K for the year ended December 31, 2014, as fi led with the Securities and Exchange Commission. The words “anticipates,” “intends,” “plans,” “seeks,” “believes,” “estimates,” “expects,” “targets,” “projects,” “outlook,” “ forecast,” “will,” “may,” “could,” “should,” “can,” and similar expressions often signify forward -looking statements. You should not place undue reliance on any forward-looking statements, which speak only as of the date made. We assume no obliga tion to update or revise any forward-looking statements that are made from time to time.

® ®
