Attached files
| file | filename |
|---|---|
| 8-K - 8-K - BOB EVANS FARMS INC | d11040d8k.htm |
 Investor
Presentation (revised 12.4.15)
Mark Hood, Chief Administrative and Chief Financial Officer
Scott Taggart, VP, Investor Relations
1 Exhibit 99.1 |
 SAFE
HARBOR STATEMENT 2
Under the Private Securities Litigation Reform Act of 1995
Certain statements in this presentation that are not historical facts are
forward-looking statements. Forward-looking statements involve various important assumptions, risks and uncertainties. Actual results may differ materially from those predicted by the forward-looking
statements because of various factors and possible events, including,
without limitation: Our inability to improve our operational and marketing
execution and performance, including a failure to achieve and maintain positive same-store sales; The actual results of pending, future or threatened litigation or governmental investigations and the costs and effects of negative publicity;
Changing and adverse business conditions, including higher energy and
commodity costs, including but not limited to protein costs for beef,
pork (sows and other pork products) and chicken;
Overall economic conditions that may affect consumer spending, either nationwide or in
one or more of the Company’s major markets; Competition in the
restaurant and food products industries, including the ability to recruit, train, and retain qualified employees; Ability to control restaurant and plant operating costs, which are impacted by the availability and cost of food, labor, workers compensation,
group health care, fuel and utilities such as gas, electricity and
water; The effects of our increase of indebtedness and associated
restrictions on our financial and operating flexibility; The availability
and cost of suitable sites for new restaurant development and our ability to identify those sites; Adverse weather conditions in locations where we operate our restaurants impacting sales and customer travel;
Consumer acceptance of changes in menu offerings, atmosphere and/or service procedures,
as well as the price of menu and food product offerings;
Consumer acceptance of our restaurant concepts in existing and new geographic areas, and Consumer behavior based on negative publicity or concerns over nutritional or safety aspects of our food or products.
We also bear the risk of incorrectly analyzing these risks or developing strategies to address them that prove to be unsuccessful. Certain risks, uncertainties and assumptions are discussed under the heading “Risk Factors” in Item 1A of our Annual Report on Form 10-K for the fiscal year ended April 24, 2015. We note these factors for investors as contemplated by the Private Securities Litigation Reform Act of 1995. It is impossible to predict or identify all such risk factors. Consequently, you should not consider any such list to be a complete set of all potential risks and uncertainties. Forward-looking statements speak only as of the date on which they are made, and we undertake no obligation to update any forward-looking statement to reflect circumstances or events that occur after the date on which the statement is made to reflect unanticipated events. Any further disclosures in our filings with the Securities and Exchange Commission, as well as press releases and other communications, should also be consulted. All subsequent written and oral forward-looking statements attributable to us or any person acting on behalf of the company are qualified by the cautionary statements in this section. |
  COMPANY FACT SHEET
FISCAL 2016 Q2 NASDAQ: BOBE NEW RESTAURANTS FY’15 7 FY’16E 1 547 Restaurants 18 States as of 10/23/15 194 56 14 19 1 50 30 36 8 1 7 28 24 3 16 7 4 49 AVERAGE UNIT VOLUME $1.72 million (FY’ 15) Bob Evans Farms, Inc. is comprised of two key business segments: Bob Evans Restaurants and BEF Foods. Bob Evans
Restaurants operates 547 full-service restaurants located in 18 states with
a heavy concentration in the Midwest. BEF Foods produces
and distributes refrigerated side dishes, pork sausage and a variety of refrigerated and frozen convenience food items through retail and food service channels. . Bob Evans Farms Investor Relations www.bobevans.com 8111 Smith’s Mill Road New Albany, Ohio 43054 3 Bob Evans/Owens Bob Evans Growth Markets Bob Evans FOUR KEY LINES OF BUSINESS Sausage, Refrigerated Sides, Frozen and Food Service Sold at 30,000+ retail locations in 50 states and Canada |
 4 BOB EVANS RESTAURANTS BEF FOODS, INC. |
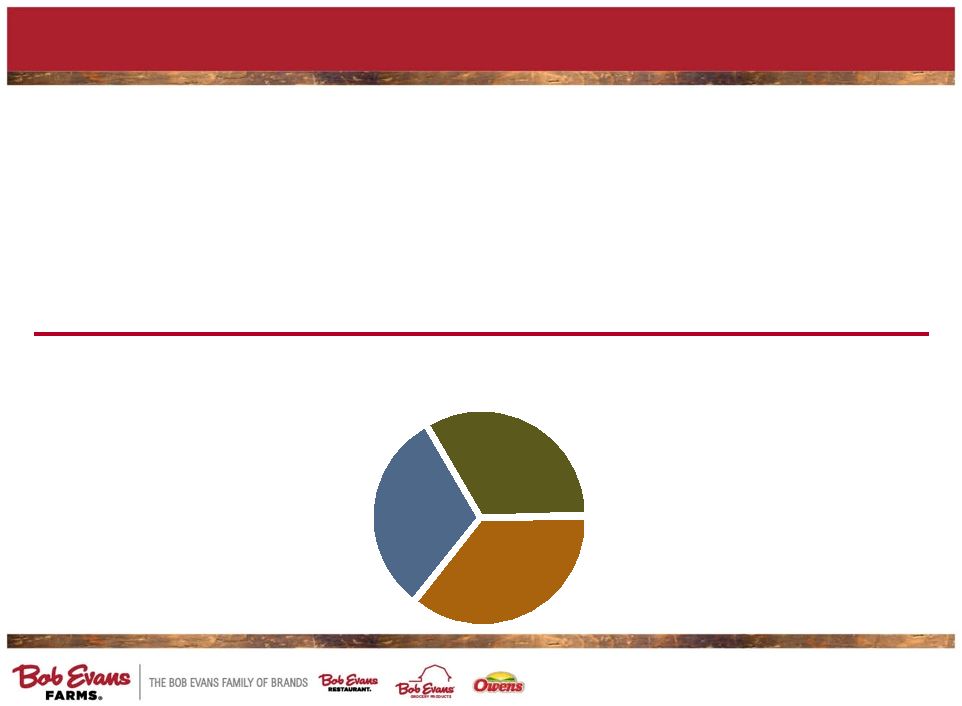
 BUSINESS
SEGMENTS (FY 2015) 5 28% 72% |
 BOB
EVANS’ TURNAROUND PLAN: 4 PRIORITIES 6
1. Improve the brand experience for our restaurant guests and grocery customers 2. Profitably increase sales in our restaurants, and increase points of distribution of our consumer food products 3. Reduce costs, particularly at the corporate level 4. Allocate capital efficiently |
 • 176% increase in non-GAAP operating income • Refrigerated side-dish volume up 14.2%, sausage up 15.1% • Foodservice volume down 26.8%, in-line with plan, as that volume is replaced with higher-margin branded-retail growth • 50%+ national market share of refrigerated dinner side dishes maintained during the quarter, side dishes represent more than 50% of total pounds sold, an historic high • Recovering lost sausage share through prudent trade spending focused in core markets • ERP implemented throughout plant network • Positioned well for a strong holiday selling season • 2016 non-GAAP diluted EPS guidance of $1.85 to $2.00 • Saed Mohseni named president and CEO • Identified nearly $5 million of additional cost savings, bringing expected fiscal 2016 savings to nearly $20 million, equating to an annual run rate of approximately $28 million. • Company repurchased $44.4 million (1.0 million shares) during Q2 2016; Board approved $100 million increase in share repurchase authorization to $250 million; $131.9 million purchased fiscal year 2016 through November 30, 2015 • Board approved a 9.7% increase in the quarterly dividend to $0.34 per share. • 34% decline in non-GAAP operating income • Same-store sales declined 3.2% due primarily to a decline in non- discounted transactions, partially offset by increased average check of discounted transactions; new menu and products introduced to improve sales trend • Investing in labor to support guest experience in FY’16; however focused on opportunities for achieving overall labor savings over the long-term • Continued menu innovation and food quality improvements planned throughout remainder of year • New restaurant technology platform to facilitate better food and labor mgt, enhance guest experience, and enable guest loyalty program • New analytics/tools to further improve discounting on a market- and restaurant level to improve discounting ROI 2Q 2016 UPDATE: NON-GAAP (1) DILUTED EPS $0.41 VS $0.36 LY Please refer to pages 38-40 for a reconciliation of non-GAAP to GAAP items.
7 1 |
 SUMMARY
OF PERFORMANCE DRIVERS: FISCAL 2016 GUIDANCE 8
Current share repurchase authorization: up to $250 million ($132 million purchased through November 30, 2015) 1Q (actual) 2Q (actual) 3Q 4Q Full Year sss% 2016 (guidance) -0.3% -3.2% negative low-single digits negative low-single digits -2.5% to -1.0% sss% 2015 (actual) -2.0% 0.0% 3.8% 2.1% 0.9% sow costs (per hundredweight) 2016 (guidance) $38.75 $53.31 $57 $60 $53 sow costs (per hundredweight) 2015 (actual) $87.87 $78.82 $67.79 $43.02 $69.41 Guidance Metric FY ‘16 Consolidated net sales approximately $1.35 billion Bob Evans Restaurants same-store sales -2.5% to -1.0 percent Bob Evans Restaurants commodity pricing approximately 3.5% (including eggs) BEF Foods net sales $380 to $390 million Capital expenditures $78 to $82 million ERP implementation (included in S,G&A) $2.0 to $2.5 million Depreciation and amortization $81 to $84 million Net interest expense $11 to $12 million Tax rate 27.5% to 28.5% Diluted weighted-average share count 21.8 million shares Non-GAAP earnings per diluted share $1.85 to $2.00 |
 DIVIDEND
HISTORY ($ per share) $0.54
$0.56 $0.60 $0.68 $0.78 $0.95 $1.075 $1.205 $1.24 $1.30 FY 2007 FY 2008 FY 2009 FY 2010 FY 2011 FY 2012 FY 2013 FY 2014 FY 2015 FY 2016E 9 Current quarterly dividend rate of $0.34 per share equates to $1.36 annually |
 10 ($ millions) Capital Expenditures SHARE REPURCHASE/CAPEX/DIVIDEND HISTORY Share Repurchases $69 $155 $5 $21 $19 $70 $63 $225 $0 $20 $19 $18 $21 $24 $28 $30 $32 $29 $45 $64 $65 $41 $39 $81 $118 $191 $75 $0 $50 $100 $150 $200 $250 2007 2008 2009 2010 2011 2012 2013 2014 2015 FY2016 Guidance Capital Expenditures: FY2016E: $78-$82M Share Repurchases: Current authorization up to $250M ($132M purchased through Nov. 30, 2015). Dividends |
 547
restaurants in 18 states as of 10/23/15
Full-service family restaurants featuring a
wide variety of menu items for both on-and-off premises dining
11 |
 Net Sales (FY 2015) $970 million Average Annual
Unit Sales (FY 2015) $1.72 million BOB EVANS RESTAURANTS: OVERVIEW ALL THREE DAYPARTS SERVED (2Q FY 2016) Breakfast
(6am-11am) Lunch (11am-4pm) Dinner
(4pm-10pm) 12 33% 36% 31% Avg. Dine-In Guest Check/Per Guest (2Q FY 2016)
$18.54/$9.55 Average Carryout Check (2Q FY 2016)
$14.51 |
 Click to
edit Master title style BOB EVANS RESTAURANTS: IMMEDIATE
PRIORITIES 13
Create relevant new product news
Broasted ® Chicken Tenders launch Three-Course Dinner relaunch Continued development of Best in Class breakfast Daily Farmhouse Specials test Coffee flavor extension Spend marketing funds more efficiently and effectively Reallocate funds from broadcast to local/digital media Focus on controlling labor, and providing great food and great service Flex hours with transaction trends Deliver best-in-class service and dining experience Broasted ® is a registered trademark of The Broaster Company, LLC. |
 BOB EVANS RESTAURANTS: FY’16 NEW PRODUCT NEWS Launch of “Best-in-Class Breakfast” Three-Course Dinner relaunch Premium Broasted Chicken and Tenders Customizable “Pick Two” meal offers “10 under $6” values $4 appetizers New beverages 14 |
 BOB EVANS RESTAURANTS: BEST-IN-CLASS BREAKFAST Recent breakfast actions: Launch of improved hotcakes and omelets Launch of seasonal toppings on Brioche, Hotcakes, Waffles and Crepes Launch of upgraded breakfast entrees including fresh sausage, fresh cracked eggs, fresh potatoes, fresh baked biscuits, not-from-concentrate orange juice, and better butter blend 15 |
 BOB EVANS RESTAURANTS: BEST-IN-CLASS BREAKFAST MARKETING FOCUSED ON INGREDIENT UPGRADES 16 |
 BOB EVANS RESTAURANTS: BEST-IN-CLASS BREAKFAST RATINGS INCREASED SIGNIFICANTLY IN TEST KEY RATINGS SUMMARY – PRE/POST TEST (test conducted May 2015)
% Excellent Post Pre 17 |
 BOB EVANS RESTAURANTS: NEW PRODUCT NEWS AT LUNCH AND DINNER TOO 18 3-Course Dinners Broasted Chicken Tenders |
 BOB EVANS RESTAURANTS: HOLIDAY MERCHANDISING 19 |
 BOB
EVANS RESTAURANTS: MOVING FROM TELEVISION TO DIGITAL
MEDIA 5 Mile
Radius • Reach qualified consumers • Align consumer mindset with various message to
drive conversion
• Trackable ROI • Cost efficient • Mass reach vehicle (households) • Aligns best with Brand Message • High reach in market but lacks cost efficiency due to minimal targeting capability DIGITAL MEDIA TRADITIONAL TV 20 |
 BOB EVANS RESTAURANTS: FY’16 HOLIDAY MARKETING FOCUSED ON DIGITAL MEDIA Approach: Rollout Broasted TV as foundation to support
product news • Media Markets: 11 Markets / 65% of sales • TV Impressions: 117MM Approach: Turn around declining dinner day-part across all markets with
hyper-targeted digital as foundation •
Media Markets: Entire System / 100% of sales
• Digital Media Impressions : 134MM FY’15 HOLIDAY FY’16 HOLIDAY 1. Identify Consumer 2. Show Targeted Ad 3. Drive Consumer to Site 4. Retarget with Offer 21 |
 Click to
edit Master title style 22
BOB EVANS RESTAURANTS:
ELEVATING THE GUEST EXPERIENCE
Improving restaurant service Menu redesign and optimization Brand repositioning influencing the look and feel of the restaurant Lobby Retail Uniforms Plateware Bakery, Off-premises Music & Lighting |
 TWO BRANDS distinct geographic strengths 23 |
 BEF
FOODS: OVERVIEW 24
FOUR KEY LINES OF BUSINESS
Refrigerated Side Dishes, Sausage, Frozen and Food Service
Sold at 30,000+ retail locations in 50 states, the District of Columbia
and Canada sausage mix (% of total sales): 42% Net Sales (FY’15) $379 million *Note: Insourced sales data reflects sales to Bob Evans Restaurants. Side Dishes Other Frozen Retail Sausage 11% 35% 36% FY 2010 Sales Mix (pounds) FY 2010 Sales Mix (pounds) 9% 9% Side Dishes Other Frozen Retail Sausage 11% 35% 36% FY 2010 Sales Mix (pounds) 9% 9% Food Service (2% insourced*) Side Dishes Other 4% Frozen 4% Food Service (6% insourced*) Retail Sausage 19% 24% 49% FY 2016 Q2 TTM Sales Mix (pounds) FY 2016 Q2 TTM Sales Mix (pounds) Side Dishes Other 4% Frozen 4% Food Service (6% insourced*) Retail Sausage 19% 24% 49% FY 2016 Q2 TTM Sales Mix (pounds) sausage mix (% of total sales): 28% |
 BEF
FOODS: NORMALIZED MARGIN RANGE 25
BEF Food’s Normalized Operating
Margin Range is ~ 15% to 18%
* Margin Driven by Four Key Factors: 1. Favorable sales mix shift toward higher-margin, higher-growth refrigerated side-dish products (currently 50%+ market share, 50%+ of pounds sold) 2. Successful past and ongoing plant efficiency initiatives, including recent plant network consolidation 3. Favorable channel shift from lower-margin foodservice to higher- margin branded retail 4. Ongoing brand investments * Excludes 100-200bps of shared service costs not currently allocated |
 BEF
FOODS: THE BIG PICTURE TODAY AND TOMORROW
National refrigerated sides category leader #1 regional breakfast sausage brand focused on heavy users in our core markets Providing unique differentiated products to Bob Evans Restaurants Cost competitive manufacturing structure (LEAN) Leveraging co- packers to meet seasonal demand spikes Leverage dominant position in refrigerated sides/seize double-digit growth opportunities Breakfast sausage return to profitability Opportunistically replace foodservice sales with branded retail sales Improved plant performance (LEAN) Continued ERP implementation Expansion of refrigerated side-dish facility (Lima, Ohio) FY’16 26 FY’16 & Beyond |
 BEF
FOODS: BUSINESS STRATEGY Refrigerates Side Dishes –
Aggressively grow Breakfast Sausage - Maintain Frozen - Maintain Food Service – Be selective Growing Bob Evans from a strong regional food brand to a national food brand leveraging the dominant refrigerated sides position, while protecting the #1 breakfast sausage position (1) in the core 27 (1) Source: IRI Bob Evans Core MULO*, 52 weeks ending 11/1/15 |
 BEF
FOODS: RETAIL PRODUCT CATEGORIES 28
Refrigerated side dishes
Refrigerated side dishes
Breakfast sausage Breakfast sausage Frozen Frozen |
 BEF
FOODS: SIDES UNIQUELY DELIVER A QUALITY EATING EXPERIENCE
• RESTAURANT QUALITY AT HOME “I LOVE THE FACT THAT
I CAN PRETTY MUCH GET THE SAME
THING IN THE STORE AS I GET IN THE
RESTAURANT” • CONSISTENT TASTE AND QUALITY “THE QUALITY
AND TASTE IS ALWAYS THERE....HAVE
NEVER BEEN LET DOWN BY THIS
PRODUCT LINE” • CONVENIENT YET SATISFYING “I LIKE THE EASE OF
PREPARATION. IN A RUSH, I KNOW THAT I
CAN STILL SERVE A SATISFYING SIDE
DISH” • QUALITY TASTE “IT DOESN'T
TASTE CHEAP”
Repeat % Rate – Refrigerated Side Dishes 1 29 Source: IRI Panel; 52 weeks ending 11-1-15; Total US MULO; % of Buyers, 2x+
Buyers 65.0% 48.0% 50.1% 50.8% 43.1% Bob Evans Hormel Private Label Simply Diners Resers (1) |
 $7.25 $2.29 $2.58 $2.36 $1.95 Bob Evans Hormel Private Label Simply Diners Resers Dinner Sides Dollar Velocity BEF FOODS: SIDES ON-SHELF PERFORMANCE (1) Selling 3X Faster than next closest competitor • #1 Dinner Sides Brand • 50%+ Share of Dinner Sides Category 2Q’16 • Mashed Potatoes item is #1 Dinner Side • Macaroni & Cheese item is #2 Dinner Side • Side Dishes sell 3x faster than any competitor Source: IRI; 52 weeks ending 11-1-15; Total US MULO; Dollar Share, Avg Weekly $/MM ACV.
47% 14% 12% 10% 9% 8% Dollar Share ($552MM) Bob Evans Hormel Private Label Simply Diners Resers All Other (1) 30 |
 31 BEF FOODS: PARTNERSHIP WITH SANDRA LEE DRIVES NATIONAL BRAND AWARENESS Partnership received national media coverage Positive consumer response to date Message focuses on mealtime solutions for busy families Expands brand awareness beyond core markets Partnership announcement post on Bob Evans social media On-line recipe club at www.bobevans.com |
 32 Appendix |
 33 2016 BOB EVANS RESTAURANTS’ PRIORITIES Achieve profitable same-store sales growth through improved guest experience and reduced discounting Drive improved food costs through a new balanced daypart marketing strategy, menu development, and product innovation Better manage labor costs with an approach customized to each restaurant’s sales performance Installation of a new restaurant technology package, including a new POS system and kitchen technology to drive improved food costs, labor efficiency, and customer engagement Continued evaluation of restaurant performance to drive future closure and development decisions. As previously announced, 20 underperforming locations closed in fiscal year 2016 |
 34 SECOND-QUARTER FISCAL 2016: SAME STORE SALES SUMMARY Second-quarter Fiscal 2016 SSS% Day Part Performance – Total Chain Day Part On-Premise Off-Premise Total Breakfast (1.2)% 7.6% (0.4)% Lunch (3.4)% (1.1)% (3.1)% Dinner (7.6)% (0.7)% (6.2)% Total (3.9)% 0.9% (3.2)% Second-quarter Fiscal 2016 SSS% Day Part Performance – Restaurants offering Broasted Chicken Day Part On-Premise Off-Premise Total Breakfast (1.9)% 6.3% (1.0)% Lunch (4.1)% (0.7)% (3.6)% Dinner (6.7)% 1.0% (4.9)% Total (4.3)% 1.5% (3.3)% Second-quarter Fiscal 2016 SSS% Day Part Performance – Restaurants without Broasted Chicken Day Part On-Premise Off-Premise Total Breakfast (0.4)% 9.9% 0.4% Lunch (2.3)% (2.1)% (2.3)% Dinner (9.0)% (5.0)% (8.4)% Total (3.4%) (0.4)% (3.1)% |
 2016
BEF FOODS’ PRIORITIES 35
Drive double-digit growth of refrigerated side-dish products with
marketing investments and expanded points of distribution
Begin $20+ million expansion of Lima, Ohio, refrigerated side-dish
plant to meet strong consumer demand
Strategically employ trade spending to protect and selectively grow
core sausage markets
Successfully implement new ERP system across plant network to
drive continued efficiency gains and profitable sales growth
New product launches, most notably a line of natural side dishes
|
 HISTORICAL AND FORECASTED SOW COST PRICING – (cost/hundredweight) 36 Fiscal Year Q1 Q2 Q3 Q4 Average 2016E $38.75actual $53.31actual $55 $62 $52 2015 $87.87 $78.82 $67.79 $43.02 $69.41 2014 $63.24 $77.33 $72.36 $78.47 $73.23 2013 $54.19 $43.22 $58.73 $59.07 $53.87 2012 $57.06 $67.82 $60.56 $60.41 $61.58 2011 $59.52 $60.47 $51.16 $59.05 $57.17 10 year historical average sow cost: $51.43 |
 Hillsdale, MI 2016 and beyond 4 Facilities, Limited co-packing relationships Asset Actions: FY2011: Bidwell and Galva fresh sausage operations closed FY2012: Bidwell and Hillsdale transportation centers closed; Springfield distribution center sold FY2013: Consolidated transportation operations; Kettle Creations (Lima) acquired; FY2014: Bidwell, Springfield, Richardson plant, office, and transportation center closed; SWH sold; Sulphur Springs and Lima expanded FY2016: Lima expansion to meet continued strong consumer demand for refrigerated sides. Fresh sausage Fresh sausage Ready-to-eat Side dishes BEF FOODS INC. NETWORK OPTIMIZATION 37 Xenia, OH Sulphur Springs, TX Lima, OH 2007 Galva, IL Bidwell, OH Richardson, TX Xenia, OH Sulphur Springs, TX SWH Fullerton, CA Hillsdale, MI Lima, OH 9 Facilities, 2 co-packers 50% Vertical Integration Springfield, OH Ready-to-eat Fresh sausage Sausage/Ready- to-eat/ Dist. Ctr. Fresh sausage Copacker Copacker Fresh sausage/ Ready-to-eat Fresh sausage Mimi’s Café prep kitchen Fresh sausage/ Ready-to-eat |
 38 GAAP TO NON-GAAP RECONCILIATION: 2Q FISCAL 2016 (in thousands, except per share amounts) Basic EPS Diluted EPS Three Months Ended Three Months Ended Three Months Ended October 23, 2015 October 24, 2014 October 23, 2015 October 24, 2014 October 23, 2015 October 24, 2014 Operating Income (Loss) as Reported Bob Evans Restaurants $ 13,323 $ 20,627 BEF Foods 13,997 6,356 Corporate and Other (15,886) (17,971) Operating Income 11,434 9,012 Net interest expense 2,883 2,203 Income Before Income Taxes 8,551 6,809 Provision for income taxes 2,120 770 Net Income as reported 6,431 6,039 $ 0.29 $ 0.26 $ 0.29 $ 0.25 Adjustments Bob Evans Restaurants Severance/Restructuring 318 — Activism, Strategic Initiatives and Other — 137 318 137 BEF Foods Loss on Sale of Assets 3,606 — — Activism, Strategic Initiatives and Other — 17 17, 00 0 3,606 17 Corporate and Other Activism, Strategic Initiatives and Other — 3,725 — 3,725 Total adjustments Severance/Restructuring 318 — Loss on Sale of Assets 3,606 — Activism, Strategic Initiatives and Other — 3,879 3,924 3,879 Non-GAAP operating income (loss) Bob Evans Restaurants 13,641 20,764 BEF Foods 17,603 6,373 Corporate and Other (15,886) (14,246) Total non-GAAP operating income 15,358 12,891 Adjustments to net interest expense (480) 458 Non-GAAP net interest expense 2,403 2,661 Non-GAAP Income Before Taxes 12,955 10,230 Adjustments to income tax provision 1,636 835 Non-GAAP Provision for Income Taxes 3,756 1,605 Non-GAAP Net Income $ 9,199 $ 8,625 $ 0.42 $ 0.37 $ 0.41 $ 0.36 Weighted Average Shares Outstanding 22,115 23,509 22,233 23,735 |
 39 GAAP TO NON-GAAP RECONCILIATION: 2Q FISCAL 2016 (in thousands) Three Months Ended Consolidated Results Bob Evans Restaurants October 23, 2015 % of Sales October 24, 2014 % of Sales October 23, 2015 % of Sales October 24, 2014 % of Sales Operating income as reported Net Sales $ 325,021 333,279 230,741 $ 241,151 Cost of sales 102,709 31.6 % 116,012 34.8 % 61,725 26.8 % 64,165 26.6 % Operating wage and fringe benefit expenses 104,403 32.1 % 105,613 31.7 % 93,460 40.4 % 94,834 39.3 % Other operating expenses 56,181 17.3 % 54,195 16.3 % 42,984 18.6 % 42,290 17.5 % Selling, general and administrative expenses 29,902 9.2 % 28,972 8.7 % 5,433 2.4 % 5,572 2.3 % Depreciation and amortization expense 20,107 6.2 % 19,475 5.8 % 13,531 5.9 % 13,663 5.7 % Impairments 285 0.1 % — — % 285 0.1 % — — % Total as reported 11,434 3.5 % 9,012 2.7 % 13,323 5.8 % 20,627 8.6 % Adjustments Net Sales — — — — Cost of sales — — — — Operating wage and fringe benefit expenses — (15) — (15) Other operating expenses — (115) — (115) Selling, general and administrative expenses (3,924) (3,749) (318 (7) Depreciation and amortization expense — — — — Impairments — — — — Total Adjustments 3,924 3,879 318 137 Non-GAAP operating income Net Sales 325,021 333,279 230,741 241,151 Cost of sales 102,709 31.6 % 116,012 34.8 % 61,725 26.8 % 64,165 26.6 % Operating wage and fringe benefit expenses 104,403 32.1 % 105,598 31.7 % 93,460 40.4 % 94,819 39.3 % Other operating expenses 56,181 17.3 % 54,080 16.2 % 42,984 18.6 % 42,175 17.5 % Selling, general and administrative expenses 25,978 8.0 % 25,223 7.6 % 5,115 2.3 % 5,565 2.3 % Depreciation and amortization expense 20,107 6.2 % 19,475 5.8 % 13,531 5.9 % 13,663 5.7 % Impairments 285 0.1 % — — % 285 0.1 % — — % Total non-GAAP operating income $ 15,358 4.7 % 12,891 3.9 % 13,641 5.9 % $ 20,764 8.6 % |
 40 GAAP TO NON-GAAP RECONCILIATION: 2Q FISCAL 2016 (in thousands) Three Months Ended BEF Foods Corporate and Other October 23, 2015 % of Sales October 24, 2014 % of Sales October 23, 2015 October 24, 2014 Operating income (loss) as reported Net Sales $ 94,280 $ 92,128 $ — $ — Cost of sales 40,984 43.5 % 51,847 56.3 % — — Operating wage and fringe benefit expenses 10,943 11.7 % 10,779 11.7 % — — Other operating expenses 13,197 14.0 % 11,905 12.9 % — — Selling, general and administrative expenses 10,964 11.6 % 6,918 7.5 % 13,505 16,482 Depreciation and amortization expense 4,195 4.4 % 4,323 4.7 % 2,381 1,489 Impairments — — % — — % — — Total as Reported 13,997 14.8 % 6,356 6.9 % (15,886 (17,971) Adjustments Net Sales — — — — Cost of sales — — — — Operating wage and fringe benefit expenses — — — — Other operating expenses — — — — Selling, general and administrative expenses (3,606) (17 — (3,725) Depreciation and amortization expense — — — — Impairments — — — — Total adjustments 3,606 17 — 3,725 Non-GAAP operating income (loss) Net Sales 94,280 92,128 — — Cost of sales 40,984 43.5 % 51,847 56.3 % — — Operating wage and fringe benefit expenses 10,943 11.7 % 10,779 11.7 % — — Other operating expenses 13,197 14.0 % 11,905 12.9 % — — Selling, general and administrative expenses 7,358 7.7 % 6,901 7.5 % 13,505 12,757 Depreciation and amortization expense 4,195 4.4 % 4,323 4.7 % 2,381 1,489 Impairments — — % — — % — — Total non-GAAP operating income (loss) $ 17,603 18.7 % $ 6,373 6.9 % $ (15,886 $ (14,246) |
 HISTORICAL SEGMENT AND “CORPORATE AND OTHER” DATA: 1Q FISCAL 2015
41 Q1 FY15 New* Old New* Old New Old Operating income as reported Net sales 240,151 240,151 86,190 86,190 - - Cost of sales
63,211 26.3% 63,211 26.3% 50,957 59.1% 50,252 58.3% - - Operating wages
94,840 39.5% 94,639 39.4% 9,589 11.1% 9,589 11.1% - - Other operating
42,505 17.7% 42,505 17.7% 11,209 13.0% 7,003 8.1% - - S,G&A 8,855 3.7% 22,482 9.4% 7,114 8.3% 16,365 19.0% 16,447 - Depreciation and amortization
14,236 5.9% 15,341 6.4% 4,276 5.0% 4,632 5.4% 1,461 - Impairments 1,577 0.7% 258 0.1% - 0.0% - 0.0% - - Operating income
14,927 6.2% 1,715 0.7% 3,045 3.5% (1,651) -1.9% (17,908) - Adjustments Operating wages (14) (14) - - - - Other operating
(149) (149) - - - - S,G&A (91) (3,381) (666) (1,230) (2,535) - Impairments (1,577) (258) - - - - Total Adjustments
1,831 3,802 666 1,230 2,535 Non-GAAP Operating Income Net sales 240,151 240,151 86,190 86,190 - - Cost of sales
63,211 26.3% 63,211 26.3% 50,957 59.1% 50,252 58.3% - - Operating wages
94,826 39.5% 94,625 39.4% 9,589 11.1% 9,589 11.1% - - Other operating
42,356 17.7% 42,356 17.6% 11,209 13.0% 7,003 8.1% - - S,G&A 8,764 3.6% 19,101 8.0% 6,448 7.5% 15,135 17.6% 13,912 - Depreciation and amortization
14,236 5.9% 15,341 6.4% 4,276 5.0% 4,632 5.4% 1,461 - Impairments - 0.0% - 0.0% - 0.0% - 0.0% - - Total non-GAAP operating income
16,758 7.0% 5,517 2.3% 3,711 4.3% (421) -0.5% (15,373) - *Reflects reclassification of:
$1.3 million of impairment charges from S,G&A to Impairments for Bob Evans
Restaurants $0.2 million of restaurant wages from S,G&A to
Operating wages for Bob Evans Restaurants $4.3 million of shipping
and handling costs from S,G&A to Other operating expenses for BEF Foods $0.7 million of freight charges from Other operating expenses to Cost of sales for BEF Foods
$0.6 million of marketing costs from S,G&A to Other operating expenses for
BEF Foods All reclassifications made to conform prior year
financials with current presentation Bob Evans
Restaurants Corporate and Other
BEF Foods |
 HISTORICAL SEGMENT AND “CORPORATE AND OTHER” DATA: 2Q FISCAL
2015 42 Q2 FY15 New* Old New* Old New Old Operating income as reported Net sales 241,151 241,151 92,128 92,128 - - Cost of sales
64,165 26.6% 64,165 26.6% 51,847 56.3% 51,847 56.3% - - Operating wages
94,834 39.3% 92,006 38.2% 10,779 11.7% 10,779 11.7% - - Other operating
42,290 17.5% 42,702 17.7% 11,905 12.9% 7,271 7.9% - - S,G&A 5,572 2.3% 20,777 8.6% 6,919 7.5% 15,245 16.5% 16,482 - Depreciation and amortization
13,663 5.7% 14,789 6.1% 4,323 4.7% 4,686 5.1% 1,489 - Impairments - 0.0% - 0.0% - 0.0% - 0.0% - - Operating income
20,627 8.6% 6,712 2.8% 6,355 6.9% 2,300 2.5% (17,971) - Adjustments Operating wages (15) (15) - - - - Other operating
(115) (115) - - - - S,G&A (7) (2,803) (17) (946) (3,725) - Total Adjustments
137 2,933 17 946 3,725 - Non-GAAP Operating Income
Net sales 241,151 241,151 92,128 92,128 - - Cost of sales
64,165 26.6% 64,165 26.6% 51,847 56.3% 51,847 56.3% - - Operating wages
94,819 39.3% 91,991 38.1% 10,779 11.7% 10,779 11.7% - - Other operating
42,175 17.5% 42,587 17.7% 11,905 12.9% 7,271 7.9% - - S,G&A 5,565 2.3% 17,974 7.5% 6,902 7.5% 14,299 15.5% 12,757 - Depreciation and amortization
13,663 5.7% 14,789 6.1% 4,323 4.7% 4,686 5.1% 1,489 - Impairments - 0.0% - 0.0% - 0.0% - 0.0% - - Total non-GAAP operating income
20,764 8.6% 9,645 4.0% 6,372 6.9% 3,246 3.5% (14,246) - *Reflects reclassification of:
$2.8 million of restaurant wages from S,G&A to Operating wages for Bob
Evans Restaurants $0.4 million of legal costs from Other operating
expenses to S,G&A for Bob Evans Restaurants $4.0 million of
shipping and handling costs from S,G&A to Other operating expenses for BEF Foods $0.7 million of marketing costs from S,G&A to Other operating expenses for BEF Foods
All reclassifications made to conform prior year financials with current
presentation Bob Evans Restaurants
BEF Foods Corporate and Other |
 HISTORICAL SEGMENT AND “CORPORATE AND OTHER” DATA: 3Q FISCAL
2015 43 Q3 FY15 New* Old New* Old New Old Operating income as reported Net sales 250,389 250,389 106,788 106,788 - - Cost of sales
69,134 27.6% 69,134 27.6% 55,410 51.9% 55,410 51.9% - - Operating wages
98,317 39.3% 98,317 39.3% 10,799 10.1% 10,799 10.1% - - Other operating
41,882 16.7% 41,882 16.7% 12,922 12.1% 7,214 6.8% - - S,G&A 10,589 4.2% 27,348 10.9% 8,021 7.5% 18,997 17.8% 20,356 - Depreciation and amortization
14,642 5.8% 15,693 6.3% 4,362 4.1% 4,710 4.4% 1,399 - Impairments 1,672 0.7% - 0.0% - 0.0% - 0.0% - - Operating income
14,153 5.7% (1,985) -0.8% 15,274 14.3% 9,658 9.0% (21,755) - Adjustments Operating wages - (230) - - - - Other operating
(378) (378) - - - - S,G&A (571) (7,521) (189) (1,933) (7,252) - Impairments (1,672) - - - - - Total Adjustments
2,621 8,129 189 1,933 7,252 - Non-GAAP Operating Income
Net sales 250,389 250,389 106,788 106,788 - - Cost of sales
69,134 27.6% 69,134 27.6% 55,410 51.9% 55,410 51.9% - - Operating wages
98,317 39.3% 98,087 39.1% 10,799 10.1% 10,799 10.1% - - Other operating
41,504 16.6% 41,504 16.6% 12,922 12.1% 7,214 6.8% - - S,G&A 10,018 4.0% 19,827 7.9% 7,832 7.3% 17,064 15.9% 13,104 - Depreciation and amortization
14,642 5.8% 15,693 6.3% 4,362 4.1% 4,710 4.4% 1,399 - Impairments - 0.0% - 0.0% - 0.0% - 0.0% - - Total non-GAAP operating income
16,774 6.7% 6,144 2.5% 15,463 14.5% 11,591 10.9% (14,503) - *Reflects reclassification:
$1.7 million of impairment charges from S,G&A to Impairments for Bob Evans
Restaurants $4.3 million of shipping and handling costs from
S,G&A to Other operating expenses for BEF Foods $1.4 million
of marketing costs from S,G&A to Other operating expenses for BEF Foods All reclassifications made to conform prior year financials with current presentation
Bob Evans Restaurants
BEF Foods Corporate and Other |
 HISTORICAL SEGMENT AND “CORPORATE AND OTHER” DATA: 4Q FISCAL 2015
44 Q4 FY15 New* Old New* Old New Old Operating income as reported Net sales 238,187 238,187 94,206 94,206 - - Cost of sales
62,167 26.1% 62,167 26.1% 40,853 43.4% 40,853 43.4% - - Operating wages
93,882 39.4% 93,882 39.4% 10,499 11.1% 10,499 11.1% - - Other operating
42,341 17.8% 42,341 17.8% 12,937 13.7% 7,558 8.0% - - S,G&A 15,719 6.6% 30,882 13.0% 7,659 8.2% 20,651 21.9% 19,564 - Depreciation and amortization
14,696 6.2% 15,709 6.6% 4,180 4.4% 4,514 4.8% 1,347 - Impairments 2,851 1.2% 2,400 1.0% 2,761 2.9% - 0.0% - - Operating income
6,531 2.7% (9,194) -3.9% 15,317 16.3% 10,131 10.8% (20,911) - Adjustments Operating wages (11) (11) - - - - Other operating
(66) (66) - - - - S,G&A (7,191) (10,457) (153) (3,876) (3,777) - Impairments (2,851) (2,400) (2,761) - - - Total Adjustments
10,119 12,934 2,914 3,876 3,777 - Non-GAAP Operating Income
Net sales 238,187 238,187 94,206 94,206 - - Cost of sales
62,167 26.1% 62,167 26.1% 40,853 43.4% 40,853 43.4% - - Operating wages
93,871 39.4% 93,871 39.4% 10,499 11.1% 10,499 11.1% - - Other operating
42,275 17.7% 42,275 17.7% 12,937 13.7% 7,558 8.0% - - S,G&A 8,528 3.6% 20,425 8.6% 7,506 8.0% 16,775 17.8% 15,787 - Depreciation and amortization
14,696 6.2% 15,709 6.6% 4,180 4.4% 4,514 4.8% 1,347 - Impairments - 0.0% - 0.0% - 0.0% - 0.0% - - Total non-GAAP operating income
16,650 7.0% 3,740 1.6% 18,231 19.4% 14,007 14.9% (17,134) - *Reflects reclassification of:
$0.5 million of impairment charges from S,G&A to Impairments for Bob Evans
Restaurants $4.4 million of shipping and handling costs from
S,G&A to Other operating expenses for BEF Foods $2.8 million
of impairment charges from S,G&A to Impairments for BEF Foods
$1.0 million of marketing costs from S,G&A to Other operating expenses for
BEF Foods All reclassifications made to conform prior year
financials with current presentation Bob Evans Restaurants
BEF Foods
Corporate and Other |
 HISTORICAL SEGMENT AND “CORPORATE AND OTHER” DATA: FISCAL
2014 45 FY14 New* Old New* Old New Old Operating income as reported Net sales 956,579 956,579 371,973 371,973 - - Cost of sales
244,871 25.6% 244,871 25.6% 206,906 55.6% 206,082 55.4% - - Operating wages
365,698 38.2% 365,698 38.2% 40,609 10.9% 40,609 10.9% - - Other operating
164,901 17.3% 164,901 17.3% 54,003 14.6% 31,926 8.6% - - S,G&A 26,626 2.8% 80,723 8.4% 30,506 8.2% 68,781 18.5% 65,001 - Depreciation and amortization
60,446 6.3% 63,872 6.7% 14,514 3.9% 15,584 4.2% 4,496 - Impairments 13,850 1.4% 9,380 1.0% 3,000 0.8% 3,000 0.8% - - Operating income
80,187 8.4% 27,134 2.8% 22,435 6.0% 5,991 1.6% (69,497) - Adjustments Operating wages - - 49 49 - - Other operating
- - 107 107 - - S,G&A 567 (5,971) (4,125) (4,074) (2,017) - Depreciation and amortization
51 51 - - - - Impairments (13,850) (9,380) (3,000) (3,000) - - Total Adjustments
13,232 15,300 6,969 6,918 2,017 - Non-GAAP Operating Income
Net sales 956,579 956,579 371,973 371,973 - - Cost of sales
244,871 25.6% 244,871 25.6% 206,906 55.6% 206,082 55.4% - - Operating wages
365,698 38.2% 365,698 38.2% 40,658 10.9% 40,658 10.9% - - Other operating
164,901 17.3% 164,901 17.3% 54,110 14.6% 32,033 8.6% - - S,G&A 27,193 2.8% 74,752 7.8% 26,381 7.1% 64,707 17.4% 62,984 - Depreciation and amortization
60,497 6.3% 63,923 6.7% 14,514 3.9% 15,584 4.2% 4,496 - Impairments - 0.0% - 0.0% - 0.0% - 0.0% - - Total non-GAAP operating income
93,419 9.8% 42,434 4.4% 29,404 7.9% 12,909 3.5% (67,480) - *Reflects reclassification:
$4.4 million of impairment charges from S,G&A to Impairments for Bob Evans
Restaurants $18.6 million of shipping and handling costs from
S,G&A to Other operating expenses for BEF Foods $4.3 million
of marketing costs from S,G&A to Other operating expenses for BEF Foods $0.8 million of freight charges from Other operating expenses to Cost of sales for BEF Foods
All reclassifications made to conform prior year financials with current
presentation Bob Evans Restaurants
BEF Foods Corporate and Other |