Attached files
| file | filename |
|---|---|
| 8-K - FORM 8-K - VIAD CORP | v426366_8k.htm |
Exhibit 99

1 Investor Presentation December 2015

2 FORWARD - LOOKING STATEMENTS As provided by the safe harbor provision under the Private Securities Litigation Reform Act of 1995 , Viad cautions readers that, in addition to historical information contained herein, this press release includes certain information, assumptions and discussions that may constitute forward - looking statements . These forward - looking statements are not historical facts, but reflect current estimates, projections, expectations, or trends concerning future growth, operating cash flows, availability of short - term borrowings, consumer demand, new or renewal business, investment policies, productivity improvements, ongoing cost reduction efforts, efficiency, competitiveness, legal expenses, tax rates and other tax matters, foreign exchange rates, and the realization of restructuring cost savings . Actual results could differ materially from those discussed in the forward - looking statements . Viad’s businesses can be affected by a host of risks and uncertainties . Among other things, natural disasters, gains and losses of customers, consumer demand patterns, labor relations, purchasing decisions related to customer demand for exhibition and event services, existing and new competition, industry alliances, consolidation and growth patterns within the industries in which Viad competes, acquisitions, capital allocations, adverse developments in liabilities associated with discontinued operations and any deterioration in the economy, may individually or in combination impact future results . In addition to factors mentioned elsewhere, economic, competitive, governmental, technological, capital marketplace and other factors, including terrorist activities or war, a pandemic health crisis and international conditions, could affect the forward - looking statements in this press release . Additional information concerning business and other risk factors that could cause actual results to materially differ from those in the forward - looking statements can be found in Viad’s annual and quarterly reports filed with the Securities and Exchange Commission . Information about Viad Corp obtained from sources other than the company may be out - of - date or incorrect . Please rely only on company press releases, SEC filings and other information provided by the company, keeping in mind that forward - looking statements speak only as of the date made . Viad undertakes no obligation to update any forward - looking statements, including prior forward - looking statements, to reflect events or circumstances arising after the date as of which the forward - looking statements were made .

3 Introduction to Viad 4 - 7 Marketing & Events Group 8 - 15 Travel & Recreation Group 16 - 25 Summary 26 - 29 Appendix 30 - 44

4 Introduction to Viad

5 INTRODUCTION TO VIAD Viad is a SmallCap 600 company with two business groups and a clear strategy for growth and shareholder value 89% 11% M&E T&R REVENUE $1.1B ADJUSTED SEGMENT EBITDA 1 $91.3M 60% 40% MARKETING & EVENTS 2014 1 A reconciliation of this non - GAAP measure to segment operating income can be found in the Appendix. TRAVEL & RECREATION

6 THOROUGH REVIEW OF STRATEGIC OPTIONS 1 • Announced review of strategic options to enhance shareholder value (including possible separation of M&E and T&R businesses and increasing dividends or share repurchases), working with JP Morgan • Announced repurchase authorization of 1M shares (613k shares repurchased for $14.9M through 6/30/15) • Paid special dividends totaling $4.00 per share as optimal mechanism to allocate capital at that time POSITIVE CORPORATE GOVERNANCE CHANGES 1 • Added 3 independent Board members with industry expertise: M. Pederson (Aug 2011); E. Mace (Nov 2012); A. Benett (Jul 2013) • Average Board tenure reduced from 8.7 to 5.1 years (since 2012) • Eliminated Poison Pill (Feb 2013) • Adopted No Hedging, No Pledging Policy (Feb 2013) • Separated Chairman and CEO roles; elected independent Chairman (Dec 2014) • New CEO, Steve Moster, appointed (Dec 2014 ) • Exec Comp Changes: • CEO LTI award increased to 100% performance - based and other executive officers increased from 50/50 to 70/30; • New LTI goals based on EBITDA, ROIC and TSR; • H olding requirements for vested restricted stock; • E liminated tax gross - ups on perks, legacy payments; • P hase out of excise tax gross - ups and modified single - trigger provisions in change - in - control arrangements 1 Representative list of actions taken; not comprehensive DEC 2012 NOV 2013 / FEB 2014 • Announced conclusion of review and go - forward strategy to enhance shareholder value 1987 Greyhound Lines, Inc. bus operations LONG HISTORY OF STRATEGIC DIVESTITURES 1 Over the last 30 years, Viad has spun - off or sold more than 20 lines of business, including : 1992 The FINOVA Group 1993 Motor Coach Industries 1996 The Dial Corp. 1997 Premier Cruise Lines 1999 Restaura dining service operations 1999 Dobbs Int’l Services airline food service FOCUSED ON SHAREHOLDER VALUE 2004 MoneyGram International • Executing against growth strategy with 5 acquisitions since July 2014 PRESENT APR 2014

7 $211M 1 A reconciliation of this non - GAAP measure to Income from Continuing Operations can be found in the A ppendix. 2 Capex as a % of revenue was ~2% for GES and ~7% for T&R (excluding the Glacier Skywalk) from 2010 - 14. 3 Net of proceeds from divestitures of non - strategic assets totaling $29.7M. 4 Includes $81.3M of Special Dividends paid out in connection with Viad’s Strategic Review. 0.09 0.48 0.99 1.15 1.75 2010 2011 2012 2013 2014 Viad’s strong earnings growth and cash generation allow for reinvestment in the business and return of capital to shareholders Income Before Other Items Per Share 1 $137M 2.3% 2.3% $97M 0.8% 0.8% $112M 0.6% 0.6% $34M 3.2% 3.3% ($84M) 28.9% 40.6% Net Cash/(Debt) Debt - to - Capital Debt - to - Equity Cash Generated from Operations $288M Reinvestment in Business $131.8M Capex 2 $155.9M Acquisitions 3 $132M Returned to Shareholders $109.7M Dividends 4 $22.0M Repurchases 2010 - 2014 STRONG EARNINGS GROWTH AND CASH GENERATION
8 Marketing & Events Group Global Experience Specialists (GES)

9 GLOBAL REACH LIVE EVENTS FULL - SERVICE PROVIDER Drive Expansion Improve Margins Differentiate Addition of adjacent services creates a unique, integrated offering to deepen client relationships, expand client base and increase share of total event spend Establish GES as the Preferred Global , Full - Service Provider for Live Events Growth of core business and penetration into new event segments extends industry leadership and leverages capabilities Customer consolidation and continued global expansion creates increasing demand for global capabilities GES GROWTH STRATEGY

10 GLOBAL LEADER IN EXHIBITIONS MARKET WITH OPPORTUNITY FOR GROWTH GLOBAL REACH ESTABLISHED POSITION 1 IN KEY GLOBAL MARKETS RECOGNIZED ABILITY TO SERVICE BROADER GEOGRAPHIES 30% 55% 45% US UK Canada 1 GES Official Services Contracting market share (internal estimates) BROAD CUSTOMER SET IN MULTIPLE REGIONS 3 of the top 5 global organizers use GES in multiple regions global organizers are already working with GES 14 of the top 25 Countries GES Serves GES facilities Leveraging global capabilities and large customer base to drive growth in new services and other live event segments

11 SIGNIFICANT OPPORTUNITY IN UNDER - PENETRATED LIVE EVENT SEGMENTS Consumer Events Industry leaders already select GES in every Live Event segment 67% GES REVENUE MIX (2015 EST.) 23% 6 % 4 % Exhibitions Congresses / Conferences Corporate Events

12 NEW SERVICES FACILITATE PENETRATION AND INCREASE COMPETITIVENESS GES has made significant progress creating the most comprehensive suite of services for the live events industry • Enhances differentiation and overall competitiveness • Facilitates growth in under - penetrated segments (Congresses / Conferences, Corporate Events and Consumer Events) • Forms basis for data platform Completed 4 strategic acquisitions during Sept - Nov 2014 GES REVENUE MIX (2015 EST.) 3% 3% 1% 93% Core Services Registration & Data Audio - Visual Event Accommodation Core Services: Contracting Services Design & Build Creative / Strategic New Services: Audio Visual Registration & Data Event Accommodation KEY SERVICES REQUIRED BY CLIENTS

13 STRATEGIC ACQUISITIONS BRING LEADING TECHNOLOGY, SYNERGY, AND OPPORTUNITY In - house provider of AV Services to top 4 UK venues Event registration for over 600 events in 42 countries Majority of the top 100 US shows use onPEAK 1 for event accommodations The strategic fit of GES acquisitions brings immediate and long - term value Best - in - Class Position Defensible Platform Scalable Offering 1 Travel Planners, also acquired by Viad, was merged into onPeak.
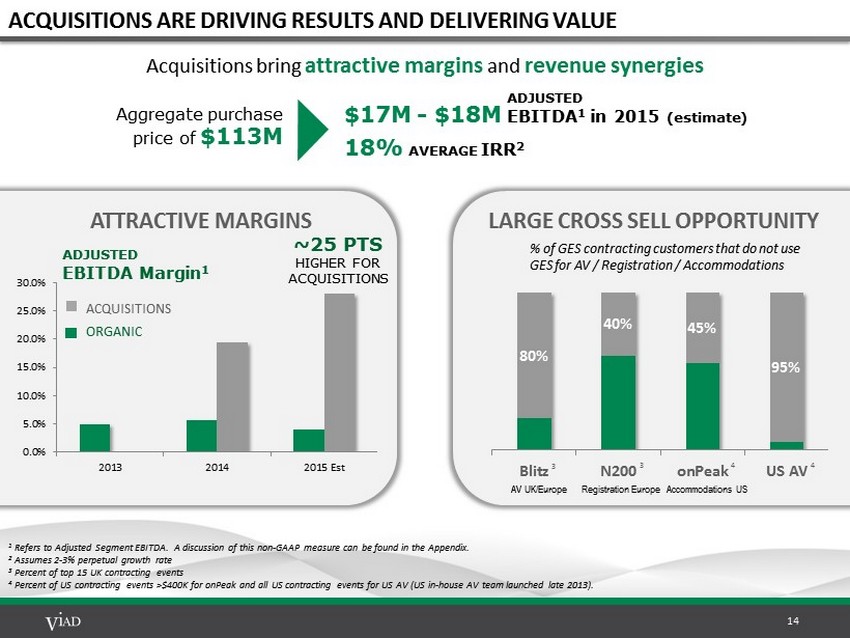
14 ACQUISITIONS ARE DRIVING RESULTS AND DELIVERING VALUE 1 Refers to Adjusted Segment EBITDA. A discussion of this non - GAAP measure can be found in the Appendix . 2 Assumes 2 - 3% perpetual growth rate 3 Percent of top 15 UK contracting events 4 Percent of US contracting events >$400K for onPeak and all US contracting events for US AV (US in - house AV team launched late 2 013 ). ATTRACTIVE MARGINS 0.0% 5.0% 10.0% 15.0% 20.0% 25.0% 30.0% 2013 2014 2015 Est ~25 PTS HIGHER FOR ACQUISITIONS ADJUSTED EBITDA Margin 1 O RGANIC AC QUISITIONS 80% 40% 45% 95% Blitz N200 onPeak US AV 4 LARGE CROSS SELL OPPORTUNITY % of GES contracting customers that do not use GES for AV / Registration / Accommodations 3 3 4 AV UK/Europe Registration Europe Accommodations US Acquisitions bring attractive margins and revenue synergies Aggregate purchase price of $113M $17M - $18M 18 % AVERAGE IRR 2 ADJUSTED EBITDA 1 in 2015 (estimate)

15 GES IS DRIVING PROFITABLE GROWTH By positioning GES as the preferred global, full - service provider for live events, we are driving growth in higher - margin service lines, increasing our share within the live events market and differentiating GES to enhance customer loyalty 2014 2015 2016 $944.5M >$1B O RGANIC AC QUISITIONS 2014 2015 2016 ~ $80M $54.9M * When adjusting to exclude major non - annual events and lower FX rate versus 2014, the total CAGR would be ~9% and the Organic CAGR would be ~ 6 % . 5 - 6%* CAGR ~3%* O RGANIC CAGR Revenue ADJUSTED EBITDA 1 O RGANIC AC QUISITIONS 1 Refers to Adjusted Segment EBITDA. A discussion of these non - GAAP measures can be found in the Appendix. Acquisitions include those already completed; potential future acquisitions, if completed, would be incremental to the figure s p resented above
16 Travel & Recreation Group (T&R) Brewster Travel Canada Glacier Park, Inc. Alaska Denali Travel

17 INTEGRATED OFFERINGS IN MARKETS WITH PERENNIAL DEMAND T&R is comprised of four lines of business that work together, driving economies of scope in and around iconic destinations targeting 8.5+ million annual visitors - 500 1,000 1,500 2,000 2,500 3,000 3,500 4,000 2004 2005 2006 2007 2008 2009 2010 2011 2012 2013 2014 Park Visitation (000) BANFF GLACIER JASPER DENALI +14.5% T&R Revenue CAGR 2010 – 2014 T&R consistently drives growth in markets with perennial demand HOSPITALITY ATTRACTIONS PACKAGE TOURS TRANSPORTATION Lines of Business

18 DRIVING GROWTH IN HIGH VALUE AREAS THROUGH REFRESH, BUILD, BUY We have a focused growth strategy to add scale to the business by strategically investing in hospitality and attractions, which have the highest margins and strong return on investment Revenue ($M) 2010 70 2011 87 2012 105 2013 108 2014 121 14.5% CAGR 29% CAGR 13% CAGR 0 % CAGR BUILD new assets, creating new revenue streams with economies of scale and scope BUY strategic assets that drive economies of scale and scope, improving financial performance Hospitality Attractions Package Tours Transportation Growth Strategy 11% CAGR REFRESH assets to optimize market position and maximize returns

19 BUILD - POWERFUL NEW EXPERIENCES THAT DRIVE POWERFUL RETURNS ~ $20M >90% INVESTMENT IRR 2 The Glacier Skywalk secured a significant return on investment, surpassing attendance expectations, and receiving international awards and media coverage Extensive Awards and Media Coverage Glacier Skywalk Jasper National Park | Opened May 2014 1 Refers to Adjusted Segment EBITDA. A d iscussion of this non - GAAP measure can be found in the Appendix. Adjusted EBITDA is down $0.1M from 2014 due to unfavorable FX variances that reduced EBITDA by $0.8M versus 2014. 2 Assumes Exit EBITDA of 10x. $4.4M ADJUSTED EBITDA 1 in 2015 (estimate)
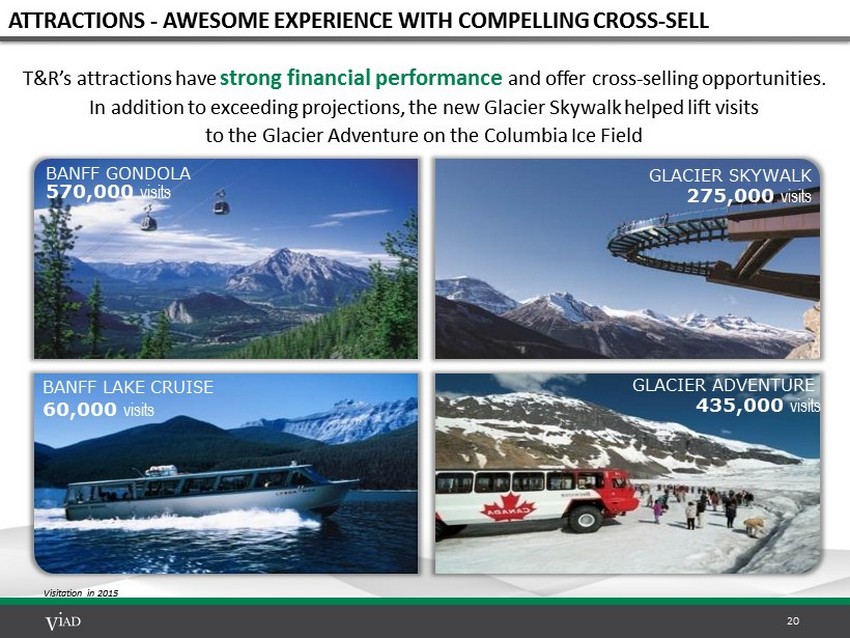
20 ATTRACTIONS - AWESOME EXPERIENCE WITH COMPELLING CROSS - SELL T&R’s attractions have strong financial performance and offer cross - selling opportunities. In addition to exceeding projections , the new Glacier Skywalk helped lift visits to the Glacier Adventure on the Columbia Ice Field 570,000 visits 275,000 visits 60,000 visits 435,000 visits Visitation in 2015 BANFF GONDOLA BANFF LAKE CRUISE GLACIER SKYWALK GLACIER ADVENTURE

21 REFRESH – POSITIONING FOR HIGHEST AND BEST USE ~ $20M >25% INVESTMENT The Banff Gondola is undergoing significant renovations that will ensure its ongoing success as the must do attraction in Banff and position it for optimal returns 1 Assumes 2% perpetual growth rate. IRR on full $20M capital investment a nd total future cash inflows from gondola operation is projected at >75% IRR 1 ON GROWTH CAPEX Increased Capacity for Guests • 25% more square feet • 8,000 SF rooftop viewing deck • Exterior climbing wall Enhanced Retail & Dining Offerings • Including sit down and grab - and - go • New conference space to accommodate weddings and corporate events State of the Art Interpretive Areas • New experiential area including high definition theater Construction Commenced September 2015 • Phased Re - Opening May - Aug 2016 • Occurring during off - peak season to minimize financial impact

22 BUY - PROVEN TRACK RECORD OF RETURNS ON ACQUISITIONS 22 1 Refers to Adjusted Segment EBITDA. A discussion of this non - GAAP measure can be found in the Appendix. 2 Assumes Exit EBITDA of 10x. January 2011 Grouse Mountain Lodge Year - round hotel in Whitefish, MT September 2011 Alaska Denali Travel L odging, package tours, transportation Rare in - holding within park July 2014 West Glacier Properties Lodging , retail, F&B at West entrance of park T&R now book - ends Going - to - the - Sun Road Rare in - holding within park June 2011 St. Mary Lodge L odging , retail, F&B at East entrance of park March 2012 Banff International Hotel Prime location in capacity - constrained downtown Banff Glacier National Park Denali National Park Glacier National Park Glacier National Park Banff National Park 5 ACQUISITIONS FOR $81M $10.6M 20 % AVERAGE IRR 2 ADJUSTED EBITDA 1 in 2014

23 HOSPITALITY REVENUE GROWTH OUTPACES ROOM COUNT We have successfully pursued scale and enhanced performance in our hospitality operations 2010 2011 2012 2013 2014 443 703 789 953 1,031 +133% ‘14 vs. ‘10 +98% BANFF +122% GLACIER PARK # of Hotel Rooms 1 133% INCREASE IN ROOM COUNT $38.2 $42.7 $25.7 $36.1 $15.5 +175% 175% INCREASE IN REVENUE 1 Reflects continuing operations. Including discontinued operations, the growth rates from 2010 to 2014 are 12% (rooms) and 37% (hospitality revenue). DENALI 2014 vs. 2010 1 Hospitality Revenue 1 ($M)

24 CONTINUED OPPORTUNITY TO SCALE BUSINESS ROOMS PROPERTIES ROOMS PROPERTIES BANFF / JASPER MARKET Town of Banff 6% 5% 4,750 40 Jasper 0% 0% 2,346 25 Lake Louise 0% 0% 1,133 8 Icefields Parkway 11% 10% 291 10 TOTAL 4% 4% 8,520 83 GLACIER NATIONAL PARK MARKET Whitefish 18% 5% 810 19 Glacier NP 13% 20% 587 10 Glacier NP East Gateway Communities 56% 12% 495 17 Waterton Lakes NP 23% 11% 375 9 Glacier NP West Gateway Communities 12% 6 % 276 18 Columbia Fall / Hungry Horse / Coram 0% 0% 195 12 TOTAL 22% 8% 2,738 85 DENALI NATIONAL PARK MARKET Denali Park Road Gateway 2% 4% 2,039 28 Talkeetna Area 0% 0% 749 11 Denali NP 38% 20% 110 5 TOTAL 3% 5% 2,898 44 VIAD TOTAL MARKET There is opportunity to increase market share , to further scale and leverage capabilities 4 % BANFF JASPER 22% GLACIER 3 % DENALI CURRENT MARKET SHARE NP = National Park

25 RATIONALIZING LOWER - MARGIN LINES OF BUSINESS We are exiting certain lower - margin, capital intensive activities in our Transportation and Package Tours lines of business to improve margins and returns WHAT WE WON’T DO WHAT WE WILL DO • Provide charter transportation services × Commoditized and highly competitive • Own/purchase motorcoaches × Capital intensive and costly to maintain • Sell package tours that cover all of Canada × Resource intensive with low - margins × Includes a low percentage of higher - margin T&R hotels and attractions • Offer differentiated sightseeing and airport shuttle services x Increase revenue per visitor with elevated guest experience and cross - sell through in - bus purchases • Free up capital to invest in higher return opportunities x Proceeds from sale of existing motorcoach fleet (~$9M est. ) to be redeployed in support of higher return opportunities • Free up internal resources to drive growth in higher - margin areas x Package tours resources to be redirected to sell more high - margin T&R hotels and attractions

26 SUMMARY

27 2016 OUTLOOK We expect significant growth in 2016 , with an increase in total segment operating income (EBIT) of 40% or more versus 2015 MARKETING & EVENTS GROUP • Revenue to exceed $1B (growth in the range of 10%) • Positive show rotation of $50M - $55M • Same - show growth in the mid - single digits • Growth strategy is resulting in cross - sell wins and growth in live events • Segment operating margin of ~5% (adjusted EBITDA margin of 7 - 8%) TRAVEL & RECREATION GROUP • Revenue to decrease in the mid - single digits • Reduction in Transportation and Package Tours ($8M - $10M) • Construction closures at Banff Gondola (~$1M) • Partially offset by strong growth across other lines of business • Segment operating margin of 23%+ (adjusted EBITDA margin of 31%+) Assumes modest FX headwind vs. 2015 and does not include potential future acquisitions

28 Viad has a disciplined and proactive acquisition program focused on proprietary deal - sourcing in support of our business unit strategies to drive shareholder value ACTIVE ACQUISITION PIPELINE Culture requirements: • Integrity • Customer - focus • Innovation • Continuous improvement Strong cultural alignment: • Facilitates integration • E nhances opportunities for cross - selling and other synergies ECONOMIC FIT Target EBITDA Multiples GES: 4 - 7x T&R: 7 - 10x Target IRR 15%+ Evaluate relative to share repurchase CULTURAL FIT STRATEGIC FIT • N ew lines of business to drive penetration across all Live Events segments • P roducts and services that are essential to Live Events while also supporting core contracting business • Leading players with proven products • I mmediate cross - sell opportunity T&R • H igh - return tourism assets in iconic natural destinations to scale (+2x) the business • Prioritize current geographies to maximize scale and scope but c onsider new geographies that bring meaningful scale and market share • Seek a combination of attractions and hotels to realize cross - sell advantages GES

29 VIAD OPPORTUNITY SUMMARY WELL - DEFINED GROWTH STRATEGIES VISION Clear plans for meaningful growth BALANCED CAPITAL ALLOCATION STRATEGY PERFORMANCE Focus on shareholder return TWO SOLID BUSINESS GROUPS STRENGTH Strong, proven foundation Viad is in a strong position to enhance shareholder value • Leading and defensible market positions • Recurring revenue streams • Strong and improving results with strong balance sheet • GES : Differentiating as preferred global, full - service provider for live events • T&R : Driving economies of scale and scope and enhancing unique portfolio of integrated tourism assets • Business development remains the priority • Opportunistically repurchase shares • Pay quarterly dividend: $0.10 / share (~1.5% yield) • Credit facility leverage ratios For acquisitions : 2.5x 1 For return of capital >$20M 2 : 2x 2 In any calendar year. $10.6M (448k shares) in 2014 $3.8M (141k shares) 9 /30/15 YTD 1 Through 12/31/15. 2.25x effective 1/1/16.

30 APPENDIX

31 VIAD SUMMARY INCOME STATEMENT DATA Note: Certain amounts above may not foot due to rounding. 1 Refer to the following pages for discussion and reconciliation of these non - GAAP measures to the most comparable GAAP measures. 2 Corporate activities expense have been adjusted to exclude acquisition transaction - related costs, CEO transition costs (2014 ), and shareholder nomination and settlement agreement costs ( 2015) which are classified as “Other Items”. Refer to the following pages for additional discussion of “Other Items”. Millions (except per share amounts) 2010 2011 2012 2013 2014 9/30/2014 YTD 9/30/2015 YTD Revenue: Marketing & Events Group 756.5$ 840.6$ 902.0$ 844.9$ 944.5$ 731.1$ 732.4$ Travel & Recreation Group 70.0 87.2 104.6 108.4 120.5 110.8 105.0 826.5$ 927.8$ 1,006.6$ 953.3$ 1,065.0$ 841.8$ 837.4$ Adjusted Segment EBITDA 1 : Marketing & Events Group 17.2$ 27.5$ 40.7$ 40.6$ 54.9$ 44.8$ 40.4$ Travel & Recreation Group 21.3 24.0 27.5 29.1 36.4 37.5 37.2 38.5$ 51.5$ 68.2$ 69.7$ 91.3$ 82.3$ 77.6$ Adjusted Segment Operating Income 1 : Marketing & Events Group (5.1)$ 5.2$ 17.9$ 20.1$ 32.5$ 29.6$ 20.0$ Travel & Recreation Group 16.1 17.9 20.3 21.8 28.1 31.0 30.8 11.0 23.1 38.2 41.9 60.6 60.6 50.7 Corporate Activities 2 (6.4) (7.7) (9.4) (6.8) (7.5) (5.0) (4.3) Interest Expense, net (1.3) (0.7) (0.7) (0.7) (1.7) (0.9) (2.9) Pre-tax Income Before Other Items 3.3 14.7 28.1 34.5 51.5 54.7 43.5 Income Taxes Before Other Items (1.3) (4.8) (7.8) (11.0) (15.8) (15.5) (13.9) Non-controlling Interest (0.1) (0.2) (0.2) (0.1) (0.4) (0.5) (0.5) Income Before Other Items 1 1.9$ 9.7$ 20.1$ 23.3$ 35.2$ 38.7$ 29.1$ Income Before Other Items Per Diluted Share 1 0.09$ 0.48$ 0.99$ 1.15$ 1.75$ 1.91$ 1.45$ Dilutive Shares Outstanding 20.3 20.1 20.0 20.3 20.1 20.2 19.9

32 NON - GAAP FINANCIAL MEASURES This document includes the presentation of “Income B efore O ther Items” , “Adjusted Segment Operating Income” and “Adjusted Segment EBITDA” , which are supplemental to results presented under accounting principles generally accepted in the United States of America (“GAAP”) and may not be comparable to similarly titled measures presented by other companies . These non - GAAP measures are utilized by management to facilitate period - to - period comparisons and analysis of Viad’s operating performance and should be considered in addition to, but not as substitutes for, other similar measures reported in accordance with GAAP . Income Before Other Items is defined by management as income from continuing operations attributable to Viad before restructuring charges/recoveries, impairment charges/recoveries, acquisition transaction - related costs, integration costs, other non - recurring expenses and tax matters . Adjusted Segment Operating Income is defined by management as segment operating income before integration costs . Segment operating income is a GAAP measure defined as income from continuing operations before corporate activities, interest expense and interest income, income taxes, restructuring charges, impairment losses and recoveries and the reduction for income attributable to non - controlling interest . Income Before Other Items and Adjusted Segment Operating Income are considered useful operating metrics, in addition to income from continuing operations attributable to Viad and segment operating income, as potential variations arising from non - operational expenses/income are eliminated, thus resulting in additional measures considered to be indicative of Viad’s performance . Adjusted Segment EBITDA is defined by management as segment operating income before integration costs and non - cash depreciation and amortization . Adjusted Segment EBITDA is considered a useful operating metric, in addition to segment operating income, as potential variations arising from non - recurring integration costs, amortization and depreciation are eliminated, thus resulting in an additional measure considered to be indicative of Viad’s segment performance . Management believes that the presentation of Adjusted Segment EBITDA provides useful information to investors regarding Viad’s results of operations for trending, analyzing and benchmarking the performance and value of Viad’s business . Management also believes that the presentation of Adjusted Segment EBITDA for acquisitions and the Glacier Skywalk enables investors to assess how effectively management is investing capital into major corporate development projects, both from a valuation and return perspective . Management uses Adjusted Segment EBITDA primarily as a performance measure and believes that the GAAP financial measure most directly comparable to this non - GAAP measure is segment operating income . Although Adjusted Segment EBITDA is used as a financial measure to assess the performance of the business, the use of Adjusted Segment EBITDA is limited, compared to the GAAP measure of segment operating income, because it does not consider non - cash depreciation and amortization expense associated with long - lived assets . Because Adjusted Segment EBITDA does not consider the above items, a user of Viad’s financial information should consider segment operating income as an important measure of financial performance because it provides a more complete measure of the Company’s segment performance .

33 NON - GAAP FINANCIAL MEASURES, CONTINUED Note: Certain amounts above may not foot due to rounding . INCOME BEFORE OTHER ITEMS Millions (except per share amounts) 2010 2011 2012 2013 2014 2010 2011 2012 2013 2014 Income from Continuing Operations Attributable to Viad (1.8)$ 7.4$ 3.3$ 19.4$ 40.8$ (0.09)$ 0.36$ 0.17$ 0.96$ 2.02$ Other Items (after-tax): Restructuring Charges 2.6 2.5 3.3 2.6 1.0 0.13 0.12 0.16 0.13 0.05 Impairment Charges 0.3 - - 1.6 0.5 0.01 - - 0.08 0.03 Acquisition-Related and Other Non-Recurring Expenses 1 - - - - 4.8 - - - - 0.24 Tax Matters 0.8 (0.1) 13.4 (0.4) (12.0) 0.04 - 0.66 (0.02) (0.59) Income Before Other Items 1.9$ 9.7$ 20.1$ 23.3$ 35.2$ 0.09$ 0.48$ 0.99$ 1.15$ 1.75$ 1 Includes the following items: acquisition transaction-related costs of $4.1M ( $2.6M after-tax); CEO Transition Costs of $2.7M ($1.7M after-tax); and integration costs of $0.8M ($0.6M after-tax). ADJUSTED SEGMENT OPERATING INCOME and ADJUSTED SEGMENT EBITDA Millions 2010 2011 2012 2013 2014 2010 2011 2012 2013 2014 Segment Operating Income (Loss) (5.1) 5.2 17.9 20.1 31.7 16.1 17.9 20.3 21.8 28.1 Acquisition Integration Costs - - - - 0.8 - - - - - Adjusted Segment Operating Income (Loss) (5.1) 5.2 17.9 20.1 32.5 16.1 17.9 20.3 21.8 28.1 Segment Depreciation 21.4 21.6 22.4 19.6 20.0 5.1 6.1 6.8 6.9 7.9 Segment Amortization 0.9 0.7 0.4 0.8 2.4 0.0 0.1 0.3 0.4 0.4 Adjusted Segment EBITDA 17.2$ 27.5$ 40.7$ 40.6$ 54.9$ 21.3$ 24.0$ 27.5$ 29.1$ 36.4$ Revenue 756.5$ 840.6$ 902.0$ 844.9$ 944.5$ 70.0$ 87.2$ 104.6$ 108.4$ 120.5$ Adjusted Segment Operating Margin -0.7% 0.6% 2.0% 2.4% 3.4% 23.1% 20.5% 19.4% 20.1% 23.3% Adjusted Segment EBITDA Margin 2.3% 3.3% 4.5% 4.8% 5.8% 30.4% 27.6% 26.3% 26.9% 30.2% TRAVEL & RECREATION GROUP INCOME BEFORE OTHER ITEMS INCOME BEFORE OTHER ITEMS PER SHARE MARKETING & EVENTS GROUP
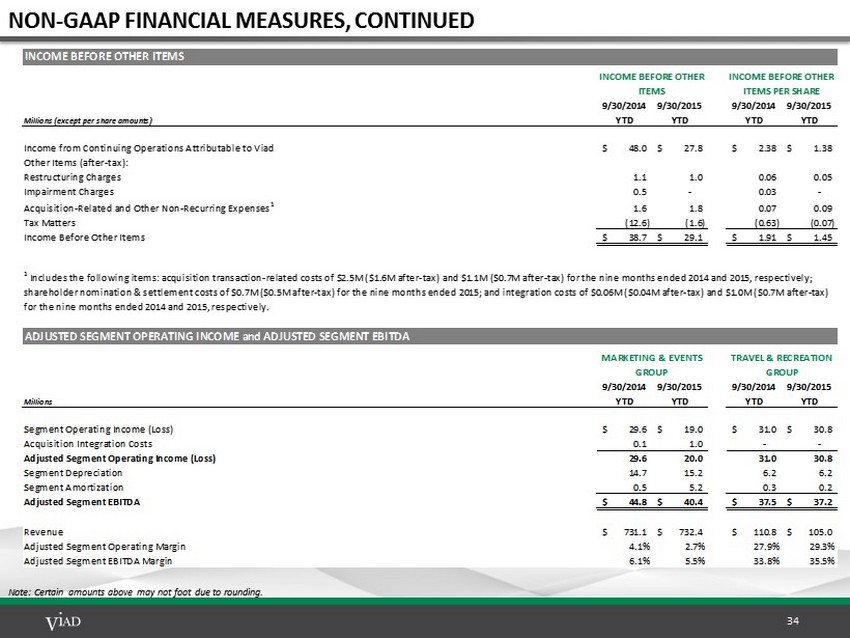
34 NON - GAAP FINANCIAL MEASURES, CONTINUED Note: Certain amounts above may not foot due to rounding . INCOME BEFORE OTHER ITEMS Millions (except per share amounts) 9/30/2014 YTD 9/30/2015 YTD 9/30/2014 YTD 9/30/2015 YTD Income from Continuing Operations Attributable to Viad 48.0$ 27.8$ 2.38$ 1.38$ Other Items (after-tax): Restructuring Charges 1.1 1.0 0.06 0.05 Impairment Charges 0.5 - 0.03 - Acquisition-Related and Other Non-Recurring Expenses 1 1.6 1.8 0.07 0.09 Tax Matters (12.6) (1.6) (0.63) (0.07) Income Before Other Items 38.7$ 29.1$ 1.91$ 1.45$ ADJUSTED SEGMENT OPERATING INCOME and ADJUSTED SEGMENT EBITDA Millions 9/30/2014 YTD 9/30/2015 YTD 9/30/2014 YTD 9/30/2015 YTD Segment Operating Income (Loss) 29.6$ 19.0$ 31.0$ 30.8$ Acquisition Integration Costs 0.1 1.0 - - Adjusted Segment Operating Income (Loss) 29.6 20.0 31.0 30.8 Segment Depreciation 14.7 15.2 6.2 6.2 Segment Amortization 0.5 5.2 0.3 0.2 Adjusted Segment EBITDA 44.8$ 40.4$ 37.5$ 37.2$ Revenue 731.1$ 732.4$ 110.8$ 105.0$ Adjusted Segment Operating Margin 4.1% 2.7% 27.9% 29.3% Adjusted Segment EBITDA Margin 6.1% 5.5% 33.8% 35.5% 1 Includes the following items: acquisition transaction-related costs of $2.5M ($1.6M after-tax) and $1.1M ($0.7M after-tax) for the nine months ended 2014 and 2015, respectively; shareholder nomination & settlement costs of $0.7M ($0.5M after-tax) for the nine months ended 2015; and integration costs of $0.06M ($0.04M after-tax) and $1.0M ($0.7M after-tax) for the nine months ended 2014 and 2015, respectively. INCOME BEFORE OTHER ITEMS INCOME BEFORE OTHER ITEMS PER SHARE MARKETING & EVENTS GROUP TRAVEL & RECREATION GROUP

35 NON - GAAP FINANCIAL MEASURES, CONTINUED Note : Certain amounts above may not foot due to rounding . 1 Marketing & Events Group acquisitions include : Blitz Communications, onPeak and N 200 (all acquired in the second half of 2014 ) . 2 Travel & Recreation Group acquisitions include : Grouse Mountain Lodge, St . Mary Lodge and Alaska Denali Travel (acquired in 2011 ) ; the Banff International Hotel (acquired in 2012 ) ; and the West Glacier Properties (acquired in July 2014 ) . The Company has also provided the following forward−looking non−GAAP financial measures : Adjusted Segment EBITDA and Adjusted Segment EBITDA Margin . The Company does not provide reconciliations of these forward−looking non−GAAP financial measures to the most directly comparable GAAP financial measures because, due to variability and difficulty in making accurate forecasts and projections and/or certain information not being ascertainable or accessible, not all of the information necessary for quantitative reconciliations of these forward−looking non−GAAP financial measures to the most directly comparable GAAP financial measures are available to the Company without unreasonable efforts . Consequently, any attempt to disclose such reconciliations would imply a degree of precision that could be confusing or misleading to investors . It is probable that the forward−looking non−GAAP financial measures provided without the directly comparable GAAP financial measures may be materially different from the corresponding non−GAAP financial measures . FORWARD - LOOKING NON - GAAP FINANCIAL MEASURES EBITDA FROM ACQUISITIONS and THE GLACIER SKYWALK Millions Acquisitions 1 All Other Total Acquisitions 2 Glacier Skywalk All Other Total Segment Operating Income (Loss) $ (0.1) $ 31.8 $ 31.7 $ 7.9 $ 3.9 $ 16.4 $ 28.1 $ 59.9 Integration Costs 0.8 - 0.8 - - - - 0.8 Segment Depreciation 0.8 19.2 20.0 2.4 0.6 4.9 7.9 27.9 Segment Amortization 1.7 0.6 2.4 0.3 - 0.0 0.4 2.7 Adjusted Segment EBITDA $ 3.3 $ 51.6 $ 54.9 $ 10.6 $ 4.5 $ 21.3 $ 36.4 $ 91.3 Revenue $ 16.7 $ 927.8 $ 944.5 $ 30.6 $ 5.7 $ 84.2 $ 120.5 $ 1,065.0 Adjusted Segment EBITDA Margin 19.5% 5.6% 5.8% 34.6% 79.2% 25.3% 30.2% 8.6% Year Ended December 31, 2014 MARKETING & EVENTS GROUP TRAVEL & RECREATION GROUP VIAD TOTAL

36 MARKETING & EVENTS GROUP (GES) KEY METRICS • 3 - 5 year contracts • 90%+ renewal rate • Largest contract is <5% of GES revenue • Clients span broad range of industries; not overly exposed to any given industry US BASE SAME - SHOW GROWTH 1 2014 GEOGRAPHIC REVENUE MIX SHOW ROTATION 2 RECURRING & DIVERSE REVENUES 1 Year - over - year revenue growth of shows that occur every year in the same quarter and are produced out of the same GES location 2 Net change in revenue due to non - annual shows produced by GES (shows occur every two, three or four years) 74% 19% 7% US EMEA Canada - 1.0% 11.2% 6.5% 3.1% 6.4% 4.0% 6.6% 2010 2011 2012 2013 2014 9/30/14 YTD 9/30/15 YTD $15 $16 $(48) $65 $(70) $50 - $55 $71 $(80) Millions 2011 2012 2013 2014 2015 2016 9 /30/14 9 /30/15 ( est ) ( est ) YTD YTD

37 GES - SIGNIFICANT OPPORTUNITY FOR GROWTH UNDER - PENETRATED SEGMENTS GES holds a leading position delivering its Core Services to the Exhibitions segment of the market and is expanding into other Live Events segments and New Services Exhibitions 1 in 3 major US shows is a GES client ~14,000 events in North America 1 Congresses / Conferences GES serviced >150 events in 2014 >250,000 events in North America 2 Corporate Events 7% of the Fortune 100 are GES clients >1M events in North America 2 Consumer Events Top 5 movie studios are GES clients GES touring exhibitions in 9 countries Core Services ~$4.5B US market size 3 ~$200M UK market size 3 ~$200M US market size 3 Audio - Visual > $1B US market size 3 >$250M UK market size 3 ~$165M US market size 4 ~$75M UK/Euro market size 4 Registration & Data 1 Source = CEIR; 2 Source = PwC; 3 Source = internal estimates; 4 Source = AMR NEW SERVICES Event Accommodation LIVE EVENTS SEGMENTS SERVICES OFFERED

38 ONPEAK/TRAVEL PLANNERS – ACQUIRED OCTOBER 7, 2014 FOR $76.3M MARKET COMPANY OVERVIEW BUSINESS & SERVICES OVERVIEW KEY HIGHLIGHTS Leading technology platform , expert data analytics, innovative culture Strong customer service culture and capabilities with long - term client relationships STRATEGIC FIT EXTENDS FULL SERVICE PROVIDER DEEPENS CLIENT RELATIONSHIP SCOPE OF CROSS - SELL PENETRATES CORPORATE ACCOUNTS Consolidating platform Intracompany New regions BRINGS TECHNOLOGY CAPABILITY DATA ASSET • Company Description: onPeak 1 provides end to end event accommodations solutions for event organizers and participants, with 2.7 million room night bookings annually • Key Services: S ite selection; hotel contract negotiations; registration integration; contact center; room block management; targeted marketing solutions; on - demand reporting tools; rate integrity tracking; hotel audits; post - event performance and impact tracking ADDITIONAL EFFICIENCIES YEARS IN BUSINESS: 25+ Each (onPeak & Travel Planners) KEY FACILITIES : Chicago, IL; New York, NY Atlanta, GA U.S. EVENT ACCOMMODATIONS ADDRESSABLE MARKET: ~$100M 1 Travel Planners was merged into onPeak in connection with the acquisition.
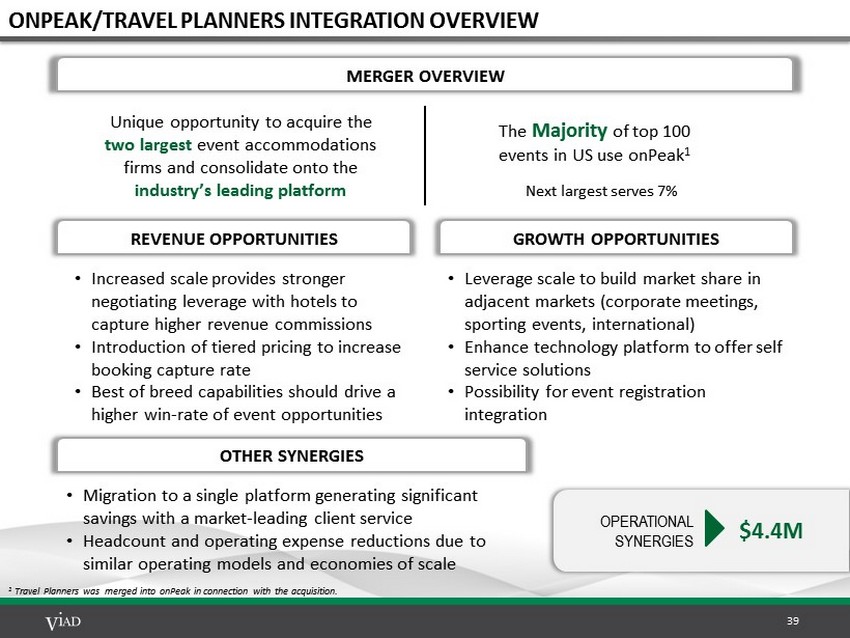
39 ONPEAK/TRAVEL PLANNERS INTEGRATION OVERVIEW MERGER OVERVIEW Next largest serves 7% OTHER SYNERGIES • Increased scale provides stronger negotiating leverage with hotels to capture higher revenue commissions • Introduction of tiered pricing to increase booking capture rate • Best of breed capabilities should drive a higher win - rate of event opportunities • Migration to a single platform generating significant savings with a market - leading client service • Headcount and operating expense reductions due to similar operating models and economies of scale Unique opportunity to acquire the two largest event accommodations firms and consolidate onto the industry’s leading platform The Majority of top 100 events in US use onPeak 1 REVENUE OPPORTUNITIES • Leverage scale to build market share in adjacent markets (corporate meetings, sporting events, international) • Enhance technology platform to offer self service solutions • Possibility for event registration integration GROWTH OPPORTUNITIES OPERATIONAL SYNERGIES $4.4M 1 Travel Planners was merged into onPeak in connection with the acquisition.
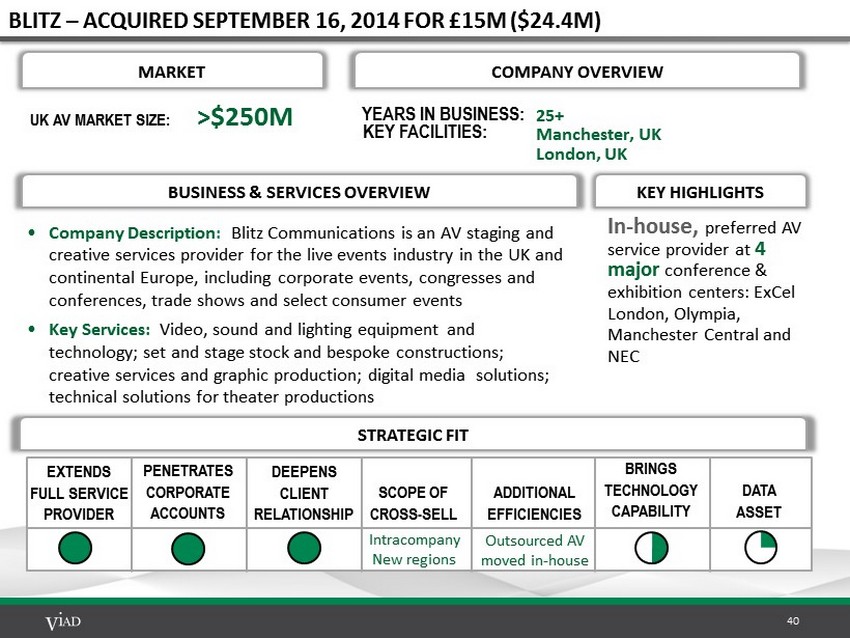
40 BLITZ – ACQUIRED SEPTEMBER 16, 2014 FOR £15M ($24.4M) • Company Description : Blitz Communications is an AV staging and creative services provider for the live events industry in the UK and continental Europe, including corporate events, congresses and conferences, trade shows and select consumer events • Key Services: Video, sound and lighting equipment and technology; set and stage stock and bespoke constructions; creative services and graphic production; digital media solutions; technical solutions for theater productions MARKET UK AV MARKET SIZE: >$250M COMPANY OVERVIEW BUSINESS & SERVICES OVERVIEW KEY HIGHLIGHTS In - house, preferred AV service provider at 4 major conference & exhibition centers: ExCel London, Olympia, Manchester Central and NEC STRATEGIC FIT EXTENDS FULL SERVICE PROVIDER DEEPENS CLIENT RELATIONSHIP SCOPE OF CROSS - SELL ADDITIONAL EFFICIENCIES PENETRATES CORPORATE ACCOUNTS Outsourced AV moved in - house Intracompany New regions BRINGS TECHNOLOGY CAPABILITY DATA ASSET YEARS IN BUSINESS: Manchester, UK London, UK 25+ KEY FACILITIES:

41 N200 – ACQUIRED NOVEMBER 24, 2014 FOR € 9.7M ($12.1M) MARKET COMPANY OVERVIEW BUSINESS & SERVICES OVERVIEW KEY HIGHLIGHTS Largest registration provider in the UK and The Netherlands Serves over 600 events each year, in 46 countries, supported by multi - lingual and multi - currency capabilities STRATEGIC FIT EXTENDS FULL SERVICE PROVIDER DEEPENS CLIENT RELATIONSHIP SCOPE OF CROSS - SELL PENETRATES CORPORATE ACCOUNTS Pilot integration to o nPeak Intracompany New regions BRINGS TECHNOLOGY CAPABILITY DATA ASSET • Company Description: N200 is a technology - based provider of registration and lead management services that has shifted towards a Software as a Service (SaaS) model during the past several years. Its market position is tied to technology leadership • Key Services: E vent registration, ticketing, attendee/exhibitor engagement and data intelligence software. These services are provided through N200’s Visit (registration platform), Visit Connect (lead management) and Visit Intelligence (data intelligence) ADDITIONAL EFFICIENCIES Watford, UK Haarlem, The Netherlands 20+ YEARS IN BUSINESS: KEY FACILITIES: UK / EUROPE MARKET SIZE: ~ $75M

42 TRAVEL & RECREATION GROUP (T&R) KEY METRICS HOSPITALITY METRICS 1 2014 GEOGRAPHIC REVENUE MIX 2014 LINE OF BUSINESS REVENUE MIX ATTRACTIONS METRICS 1 72% 22% 6% Brewster Glacier Park Alaska Denali Travel (Canada) (Montana) (Alaska) 35% 36% 16% 13% Hospitality Attractions Packaged Tours Transportation 1 Metrics are presented on a “same - store” basis, which includes assets owned by Viad and operating at full capacity for the entir ety of the periods presented, expressed on a constant currency basis. Passenger counts are expressed in thousands. $84 $85 $94 $99 $108 $109 59.0% 59.1% 63.2% 66.6% 74.1% 72.0% 2011 2012 2013 2014 9/30/14 YTD 9/30/15 YTD RevPAR Occupancy 826 907 916 1,053 1,236 1,265 $35 $36 $37 $37 $28 $32 2011 2012 2013 2014 9/30/14 YTD 9/30/15 YTD Passengers Revenue / Passenger

43 T&R HOSPITALITY - LODGING PORTFOLIO The Travel & Recreation Group provides lodging accommodations in and around Glacier National Park, Denali National Park and Preserve, Banff National Park and Jasper National Park Property Name Location Operating Season Rooms Banff International Hotel Banff National Park, AB Year - round 162 Glacier Park Lodge East Glacier, MT June – Sept 161 Grouse Mountain Lodge Whitefish, MT Year - round 144 Mount Royal Hotel Banff National Park, AB Year - round 135 St. Mary Lodge St. Mary, MT June – Sept 116 Prince of Wales Hotel Waterton Lakes Nat’l Park, AB June – Sept 86 Apgar Village Lodge Glacier National Park, MT May – Sept 48 Denali Cabins Denali National Park, AK May – Sept 46 Denali Backcountry Lodge Denali National Park, AK June – Sept 42 Glacier View Inn Jasper National Park, AB April – Oct 32 West Glacier Motel West Glacier, MT May – Sept 32 Motel Lake McDonald Glacier National Park, MT May – Sept 27 Total Room Count 1,031
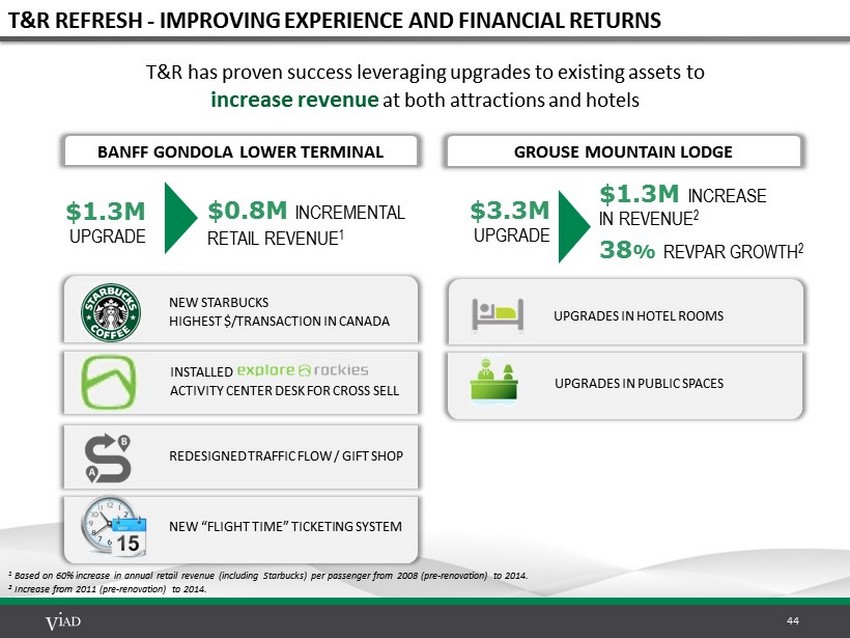
44 T&R REFRESH - IMPROVING EXPERIENCE AND FINANCIAL RETURNS 1 Based on 60% increase in annual retail revenue (including Starbucks) per passenger from 2008 (pre - renovation) to 2014. 2 Increase from 2011 (pre - renovation) to 2014. $1.3M UPGRADE BANFF GONDOLA LOWER TERMINAL $3.3M UPGRADE $1.3M INCREASE IN REVENUE 2 38 % REVPAR GROWTH 2 GROUSE MOUNTAIN LODGE INSTALLED ACTIVITY CENTER DESK FOR CROSS SELL NEW STARBUCKS HIGHEST $/TRANSACTION IN CANADA REDESIGNED TRAFFIC FLOW / GIFT SHOP NEW “FLIGHT TIME” TICKETING SYSTEM T&R has proven success leveraging upgrades to existing assets to increase revenue at both attractions and hotels UPGRADES IN PUBLIC SPACES UPGRADES IN HOTEL ROOMS $0.8M INCREMENTAL RETAIL REVENUE 1