Attached files
| file | filename |
|---|---|
| 8-K - 8-K - CIM Commercial Trust Corp | a15-24565_18k.htm |
Exhibit 99.1
CIM COMMERCIAL TRUST CORPORATION Third Quarter 2015 Investor Presentation 1

IMPORTANT DISCLOSURES FORWARD-LOOKING STATEMENTS The information set forth herein contains "forward-looking statements" and projections. You can identify these statements and projections by the fact that they do not relate strictly to historical or current facts or discuss the business and affairs of CIM Commercial Trust Corporation (“CMCT”) on a prospective basis. Further, statements that include words such as "may," "will," "project," "might," "expect," "believe," "anticipate," "intend,“ “target,” "could," "would," "estimate," "continue" "pursue," or "should" or the negative or other words or expressions of similar meaning, may identify forward-looking statements. CMCT bases these forward-looking statements and projections on particular assumptions that it has made in light of its experience, as well as its perception of expected future developments and other factors that it believes are appropriate under the circumstances. The forward-looking statements and projections are necessarily estimates reflecting the judgment of CMCT and involve a number of risks and uncertainties that could cause actual results to differ materially from those suggested by the forward-looking statements and projections. Accordingly, no representations or warranties are made regarding any forward-looking statements or projection and there can be no assurance that the results and events contemplated by the forward-looking statements and projections contained herein will in fact transpire. As you read and consider the information herein, you are cautioned to not place undue reliance on any forward-looking statements and projections. Forward-looking statements and projections are subject to risks, uncertainties and other factors, including those set forth in CMCT’s Annual Report on Form 10-K for the fiscal year ended December 31, 2014. New factors emerge from time to time, and it is not possible for CMCT to predict all of them. Nor can CMCT assess the impact of each such factor or the extent to which any factor, or combination of factors may cause results to differ materially from those contained in any forward-looking statements or projections. CMCT undertakes no obligation to publicly update or release any revisions to forward-looking statements and projections contained herein to reflect events or circumstances after the date hereof or to reflect the occurrence of unanticipated events, except as required by law. CMCT, its affiliates and their respective partners, members, equity holders, employees, officers, directors, agents, and representatives shall have no liability for any misstatement or omission of fact or any opinion expressed herein. 2
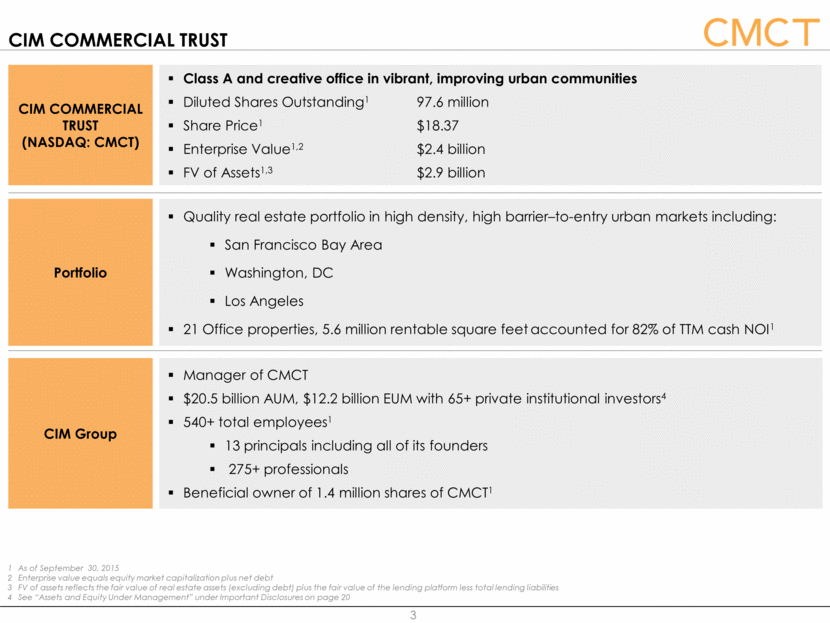
Cim Commercial trust CIM COMMERCIAL TRUST (NASDAQ: CMCT) Portfolio Quality real estate portfolio in high density, high barrier–to-entry urban markets including: San Francisco Bay Area Washington, DC Los Angeles 21 Office properties, 5.6 million rentable square feet accounted for 82% of TTM cash NOI1 Class A and creative office in vibrant, improving urban communities Diluted Shares Outstanding1 97.6 million Share Price1 $18.37 Enterprise Value1,2 $2.4 billion FV of Assets1,3 $2.9 billion CIM Group Manager of CMCT $20.5 billion AUM, $12.2 billion EUM with 65+ private institutional investors4 540+ total employees1 13 principals including all of its founders 275+ professionals Beneficial owner of 1.4 million shares of CMCT1 As of September 30, 2015 Enterprise value equals equity market capitalization plus net debt FV of assets reflects the fair value of real estate assets (excluding debt) plus the fair value of the lending platform less total lending liabilities See “Assets and Equity Under Management” under Important Disclosures on page 20 3
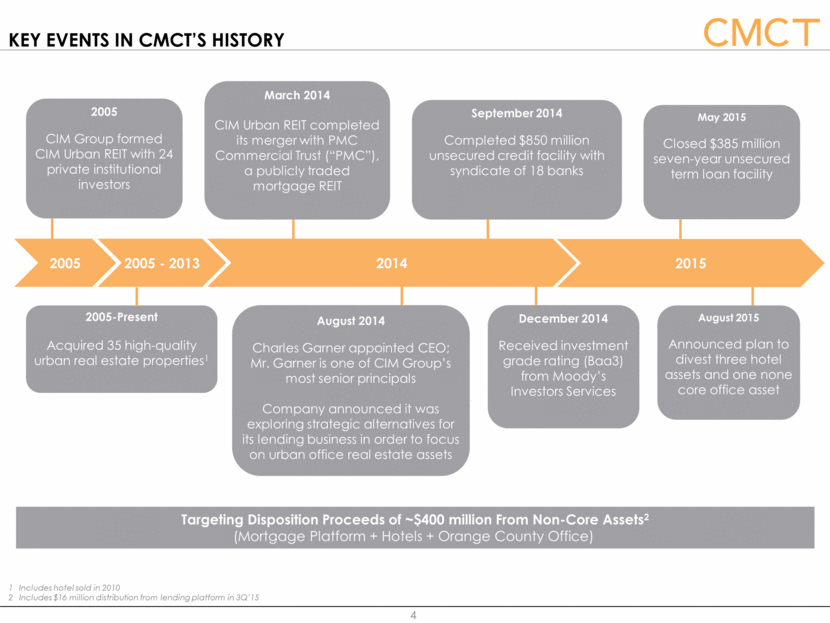
KEY EVENTS IN CMCT’s HISTORY 2005 CIM Group formed CIM Urban REIT with 24 private institutional investors 2005-Present Acquired 35 high-quality urban real estate properties1 May 2015 Closed $385 million seven-year unsecured term loan facility August 2014 Charles Garner appointed CEO; Mr. Garner is one of CIM Group’s most senior principals Company announced it was exploring strategic alternatives for its lending business in order to focus on urban office real estate assets 2005 2005 - 2013 2015 2014 September 2014 Completed $850 million unsecured credit facility with syndicate of 18 banks March 2014 CIM Urban REIT completed its merger with PMC Commercial Trust (“PMC”), a publicly traded mortgage REIT December 2014 Received investment grade rating (Baa3) from Moody’s Investors Services Targeting Disposition Proceeds of ~$400 million From Non-Core Assets2 (Mortgage Platform + Hotels + Orange County Office) 4 Includes hotel sold in 2010 Includes $16 million distribution from lending platform in 3Q’15 August 2015 Announced plan to divest three hotel assets and one none core office asset
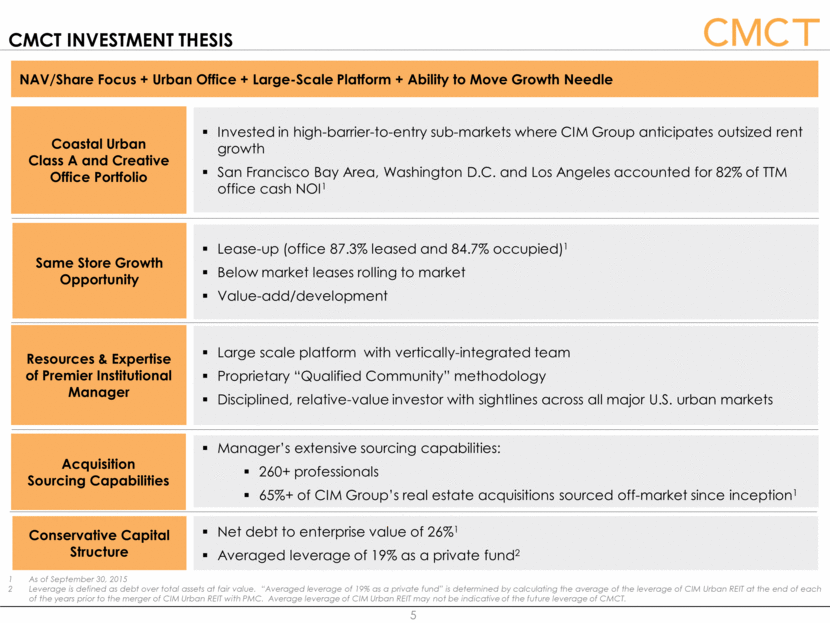
CMCT Investment thesis NAV/Share Focus + Urban Office + Large-Scale Platform + Ability to Move Growth Needle Resources & Expertise of Premier Institutional Manager Acquisition Sourcing Capabilities Coastal Urban Class A and Creative Office Portfolio Same Store Growth Opportunity Conservative Capital Structure Large scale platform with vertically-integrated team Proprietary “Qualified Community” methodology Disciplined, relative-value investor with sightlines across all major U.S. urban markets Manager’s extensive sourcing capabilities: 260+ professionals 65%+ of CIM Group’s real estate acquisitions sourced off-market since inception1 Invested in high-barrier-to-entry sub-markets where CIM Group anticipates outsized rent growth San Francisco Bay Area, Washington D.C. and Los Angeles accounted for 82% of TTM office cash NOI1 Lease-up (office 87.3% leased and 84.7% occupied)1 Below market leases rolling to market Value-add/development Net debt to enterprise value of 26%1 Averaged leverage of 19% as a private fund2 As of September 30, 2015 Leverage is defined as debt over total assets at fair value. “Averaged leverage of 19% as a private fund” is determined by calculating the average of the leverage of CIM Urban REIT at the end of each of the years prior to the merger of CIM Urban REIT with PMC. Average leverage of CIM Urban REIT may not be indicative of the future leverage of CMCT. 5
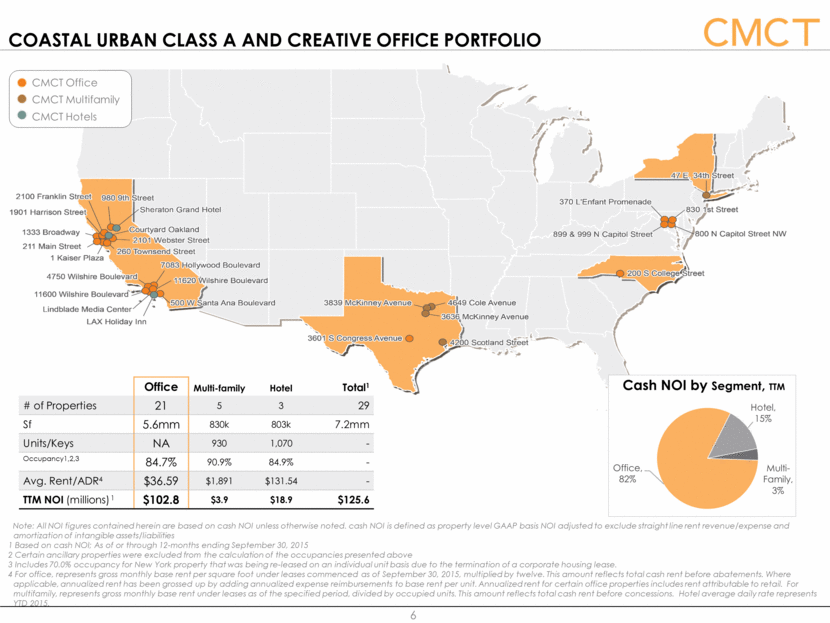
Coastal Urban Class A and Creative Office Portfolio Note: All NOI figures contained herein are based on cash NOI unless otherwise noted. cash NOI is defined as property level GAAP basis NOI adjusted to exclude straight line rent revenue/expense and amortization of intangible assets/liabilities 1 Based on cash NOI; As of or through 12-months ending September 30, 2015 2 Certain ancillary properties were excluded from the calculation of the occupancies presented above 3 Includes 70.0% occupancy for New York property that was being re-leased on an individual unit basis due to the termination of a corporate housing lease. 4 For office, represents gross monthly base rent per square foot under leases commenced as of September 30, 2015, multiplied by twelve. This amount reflects total cash rent before abatements. Where applicable, annualized rent has been grossed up by adding annualized expense reimbursements to base rent per unit. Annualized rent for certain office properties includes rent attributable to retail. For multifamily, represents gross monthly base rent under leases as of the specified period, divided by occupied units. This amount reflects total cash rent before concessions. Hotel average daily rate represents YTD 2015. 6 Cash NOI by Segment, TTM Office Multi-family Hotel Total1 # of Properties 21 5 3 29 Sf 5.6mm 830k 803k 7.2mm Units/Keys NA 930 1,070 - Occupancy1,2,3 84.7% 90.9% 84.9% - Avg. Rent/ADR4 $36.59 $1,891 $131.54 - TTM NOI (millions) 1 $102.8 $3.9 $18.9 $125.6 CMCT Office CMCT Multifamily CMCT Hotels
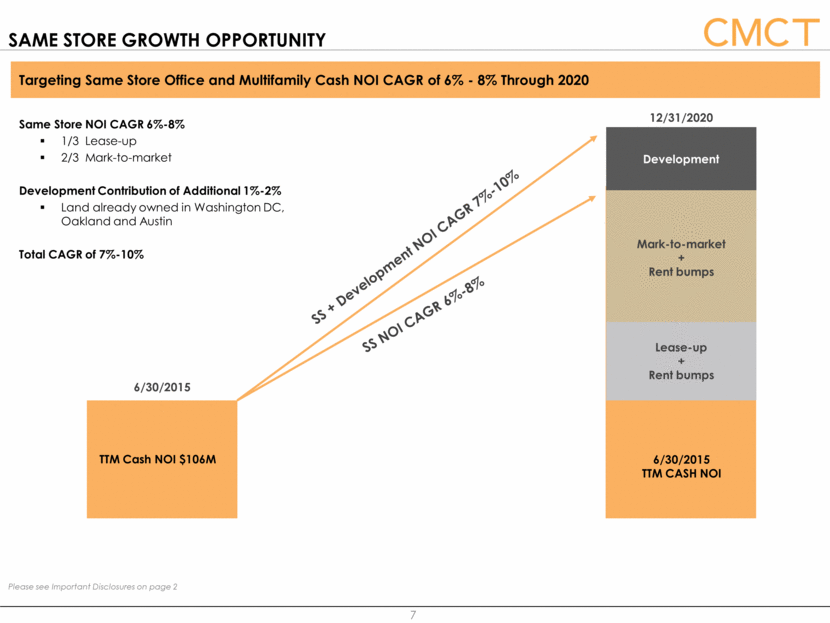
Same store growth opportunity Same Store NOI CAGR 6%-8% 1/3 Lease-up 2/3 Mark-to-market Development Contribution of Additional 1%-2% Land already owned in Washington DC, Oakland and Austin Total CAGR of 7%-10% Targeting Same Store Office and Multifamily Cash NOI CAGR of 6% - 8% Through 2020 7 Please see Important Disclosures on page 2 Development SS + Development NOI CAGR 7%-10% Mark-to-market + Rent bumps Lease-up + Rent bumps 12/31/2020 6/30/2015 TTM CASH NOI TTM Cash NOI $106M 6/30/2015
Strategies Core/Stabilized Equity Value-Add Equity Opportunistic Equity Debt Infrastructure Resources & Expertise of Premier Institutional Manager- CIM Group Established Established in 1994 as a partner for investors seeking to capitalize on U.S. urbanization Office Locations Headquartered in Los Angeles Offices in New York City, San Francisco Bay Area, Washington DC Metro Area and Dallas Experience Since inception, CIM Group has owned or currently has under development1 13.4 million square feet of office 4.8 million square feet of retail 12,800 residential units 6,500 hotel rooms As of September 30, 2015. Residential Units include both condo and apartment units. The examples above have been selected to generally illustrate the investment philosophy of CIM, and may not be representative of future investments. Past performance is not a guarantee of future results. 8 432 Park Avenue (New York) Dolby Theatre (Los Angeles) 11 Madison Avenue (New York) 800 North Capitol (Washington, DC)

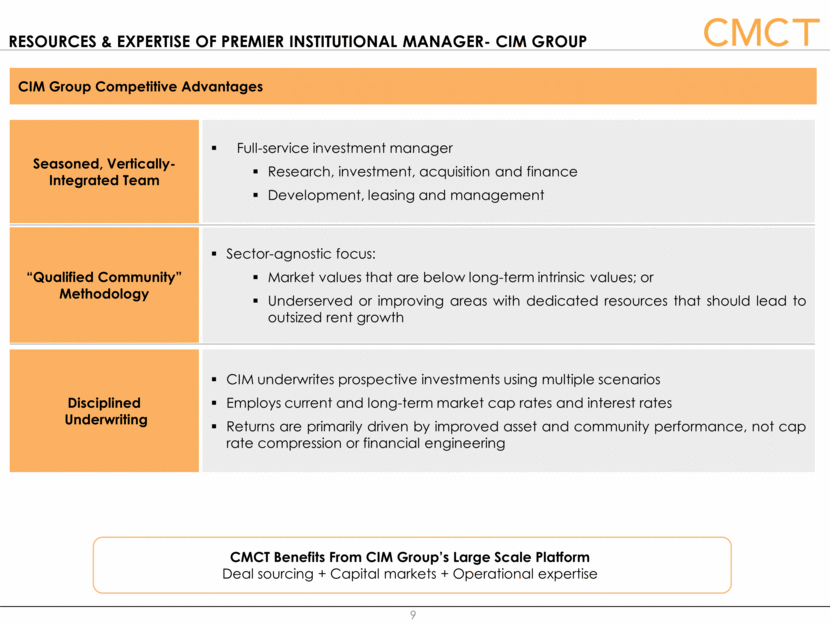
Resources & Expertise of Premier Institutional Manager- CIM Group Seasoned, Vertically-Integrated Team Full-service investment manager Research, investment, acquisition and finance Development, leasing and management “Qualified Community” Methodology Sector-agnostic focus: Market values that are below long-term intrinsic values; or Underserved or improving areas with dedicated resources that should lead to outsized rent growth Disciplined Underwriting CIM underwrites prospective investments using multiple scenarios Employs current and long-term market cap rates and interest rates Returns are primarily driven by improved asset and community performance, not cap rate compression or financial engineering 9 CIM Group Competitive Advantages CMCT Benefits From CIM Group’s Large Scale Platform Deal sourcing + Capital markets + Operational expertise
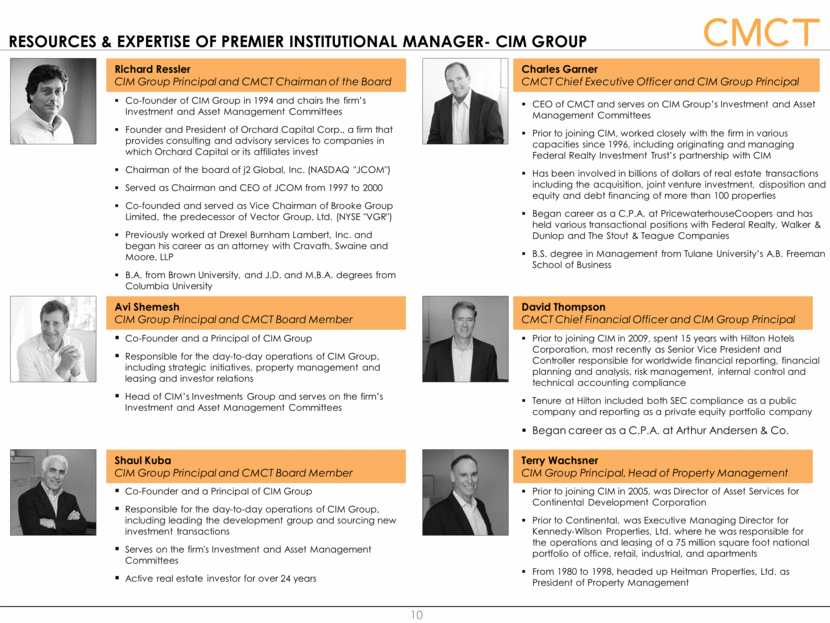
Resources & Expertise of Premier Institutional Manager- CIM Group Charles Garner CMCT Chief Executive Officer and CIM Group Principal CEO of CMCT and serves on CIM Group’s Investment and Asset Management Committees Prior to joining CIM, worked closely with the firm in various capacities since 1996, including originating and managing Federal Realty Investment Trust’s partnership with CIM Has been involved in billions of dollars of real estate transactions including the acquisition, joint venture investment, disposition and equity and debt financing of more than 100 properties Began career as a C.P.A. at PricewaterhouseCoopers and has held various transactional positions with Federal Realty, Walker & Dunlop and The Stout & Teague Companies B.S. degree in Management from Tulane University’s A.B. Freeman School of Business David Thompson CMCT Chief Financial Officer and CIM Group Principal Prior to joining CIM in 2009, spent 15 years with Hilton Hotels Corporation, most recently as Senior Vice President and Controller responsible for worldwide financial reporting, financial planning and analysis, risk management, internal control and technical accounting compliance Tenure at Hilton included both SEC compliance as a public company and reporting as a private equity portfolio company Began career as a C.P.A. at Arthur Andersen & Co. Terry Wachsner CIM Group Principal, Head of Property Management Prior to joining CIM in 2005, was Director of Asset Services for Continental Development Corporation Prior to Continental, was Executive Managing Director for Kennedy-Wilson Properties, Ltd. where he was responsible for the operations and leasing of a 75 million square foot national portfolio of office, retail, industrial, and apartments From 1980 to 1998, headed up Heitman Properties, Ltd. as President of Property Management Richard Ressler CIM Group Principal and CMCT Chairman of the Board Co-founder of CIM Group in 1994 and chairs the firm’s Investment and Asset Management Committees Founder and President of Orchard Capital Corp., a firm that provides consulting and advisory services to companies in which Orchard Capital or its affiliates invest Chairman of the board of j2 Global, Inc. (NASDAQ "JCOM") Served as Chairman and CEO of JCOM from 1997 to 2000 Co-founded and served as Vice Chairman of Brooke Group Limited, the predecessor of Vector Group, Ltd. (NYSE "VGR") Previously worked at Drexel Burnham Lambert, Inc. and began his career as an attorney with Cravath, Swaine and Moore, LLP B.A. from Brown University, and J.D. and M.B.A. degrees from Columbia University Avi Shemesh CIM Group Principal and CMCT Board Member Shaul Kuba CIM Group Principal and CMCT Board Member Co-Founder and a Principal of CIM Group Responsible for the day-to-day operations of CIM Group, including leading the development group and sourcing new investment transactions Serves on the firm's Investment and Asset Management Committees Active real estate investor for over 24 years Co-Founder and a Principal of CIM Group Responsible for the day-to-day operations of CIM Group, including strategic initiatives, property management and leasing and investor relations Head of CIM’s Investments Group and serves on the firm’s Investment and Asset Management Committees 10
summary NAV/Share Focus +Urban Office + Expertise of Large-Scale Platform + Ability to Move Growth Needle Resources & Expertise of Premier Institutional Manager Acquisition Sourcing Capabilities Coastal Urban Class A and Creative Office Portfolio Same Store Growth Opportunity Conservative Capital Structure Large scale platform with vertically-integrated team Proprietary “Qualified Community” methodology Disciplined, relative-value investor with sightlines across all major U.S. urban markets Manager’s extensive sourcing capabilities: 260+ professionals 65%+ of CIM Group’s real estate acquisitions sourced off-market since inception1 Invested in high-barrier-to-entry sub-markets where CIM Group anticipates outsized rent growth San Francisco Bay Area, Washington D.C. and Los Angeles accounted for 82% of TTM office cash NOI1 Lease-up (office 87.3% leased and 84.7% occupied)1 Below market leases rolling to market Value-add/development Net debt to enterprise value of 26%1 Averaged leverage of 19% as a private fund2 As of September 30, 2015 Leverage is defined as debt over total assets at fair value. “Averaged leverage of 19% as a private fund” is determined by calculating the average of the leverage of CIM Urban REIT at the end of each of the years prior to the merger of CIM Urban REIT with PMC. Average leverage of CIM Urban REIT may not be indicative of the future leverage of CMCT. 11
appendix 12
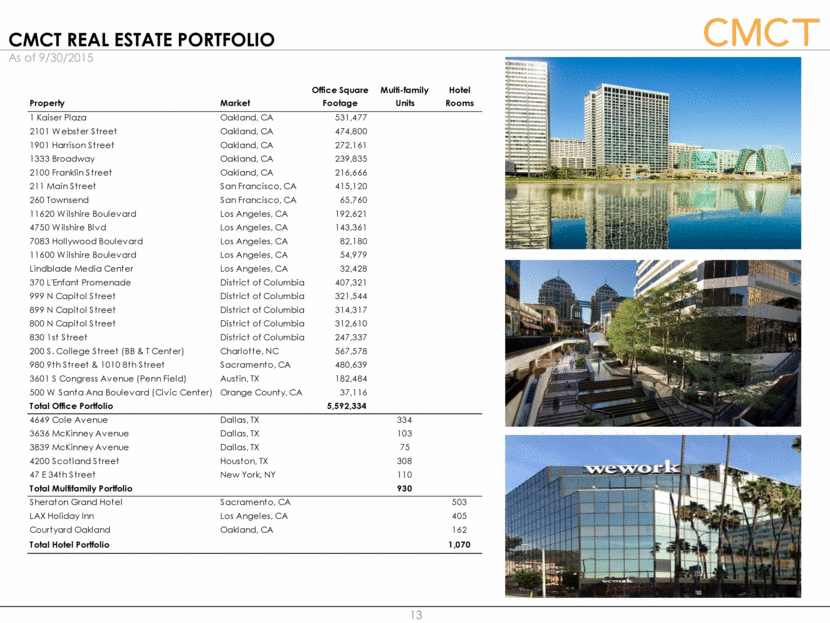
CMct Real Estate Portfolio 13 As of 9/30/2015 Property Market Office Square Footage Multi-family Units Hotel Rooms 1 Kaiser Plaza Oakland, CA 531,477 2101 Webster Street Oakland, CA 474,800 1901 Harrison Street Oakland, CA 272,161 1333 Broadway Oakland, CA 239,835 2100 Franklin Street Oakland, CA 216,666 211 Main Street San Francisco, CA 415,120 260 Townsend San Francisco, CA 65,760 11620 Wilshire Boulevard Los Angeles, CA 192,621 4750 Wilshire Blvd Los Angeles, CA 143,361 7083 Hollywood Boulevard Los Angeles, CA 82,180 11600 Wilshire Boulevard Los Angeles, CA 54,979 Lindblade Media Center Los Angeles, CA 32,428 370 L'Enfant Promenade District of Columbia 407,321 999 N Capitol Street District of Columbia 321,544 899 N Capitol Street District of Columbia 314,317 800 N Capitol Street District of Columbia 312,610 830 1st Street District of Columbia 247,337 200 S. College Street (BB & T Center) Charlotte, NC 567,578 980 9th Street & 1010 8th Street Sacramento, CA 480,639 3601 S Congress Avenue (Penn Field) Austin, TX 182,484 500 W Santa Ana Boulevard (Civic Center) Orange County, CA 37,116 Total Office Portfolio 5,592,334 4649 Cole Avenue Dallas, TX 334 3636 McKinney Avenue Dallas, TX 103 3839 McKinney Avenue Dallas, TX 75 4200 Scotland Street Houston, TX 308 47 E 34th Street New York, NY 110 Total Multifamily Portfolio 930 Sheraton Grand Hotel Sacramento, CA 503 LAX Holiday Inn Los Angeles, CA 405 Courtyard Oakland Oakland, CA 162 Total Hotel Portfolio 1,070
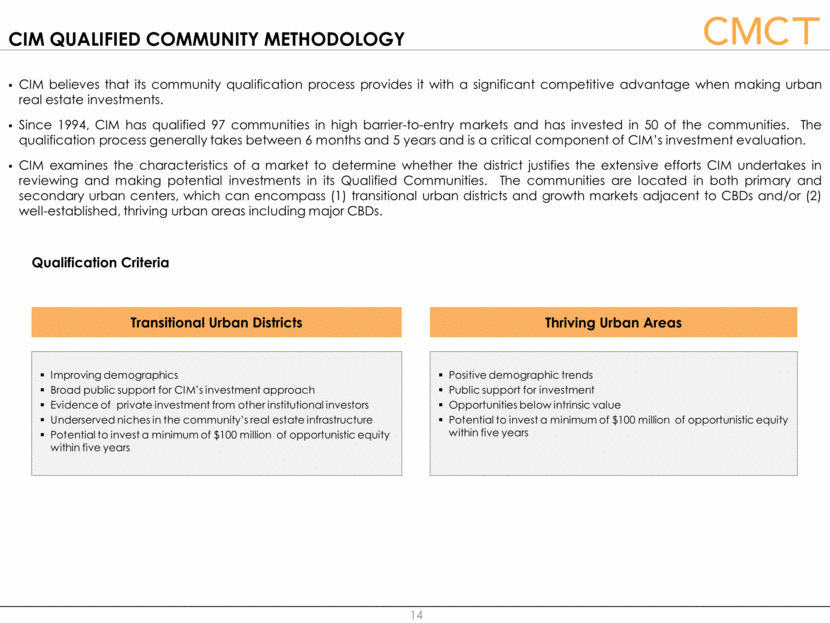
CIM QUALIFIED COMMUNITY METHODOLOGY 14 Qualification Criteria Transitional Urban Districts Improving demographics Broad public support for CIM’s investment approach Evidence of private investment from other institutional investors Underserved niches in the community’s real estate infrastructure Potential to invest a minimum of $100 million of opportunistic equity within five years Thriving Urban Areas Positive demographic trends Public support for investment Opportunities below intrinsic value Potential to invest a minimum of $100 million of opportunistic equity within five years CIM believes that its community qualification process provides it with a significant competitive advantage when making urban real estate investments. Since 1994, CIM has qualified 97 communities in high barrier-to-entry markets and has invested in 50 of the communities. The qualification process generally takes between 6 months and 5 years and is a critical component of CIM’s investment evaluation. CIM examines the characteristics of a market to determine whether the district justifies the extensive efforts CIM undertakes in reviewing and making potential investments in its Qualified Communities. The communities are located in both primary and secondary urban centers, which can encompass (1) transitional urban districts and growth markets adjacent to CBDs and/or (2) well-established, thriving urban areas including major CBDs.
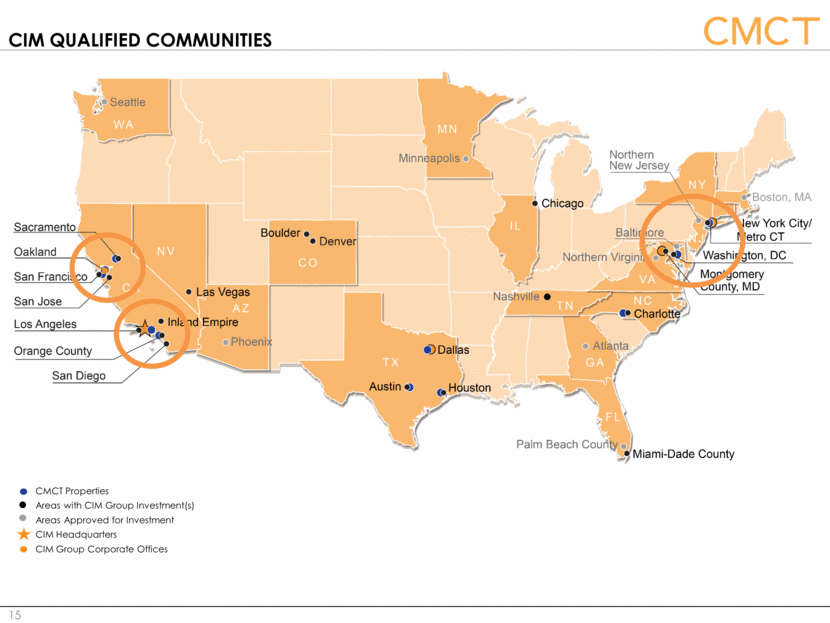
CIM QUALIFIED COMMUNITIES 15 CMCT Properties Areas with CIM Group Investment(s) Areas Approved for Investment CIM Headquarters CIM Group Corporate Offices
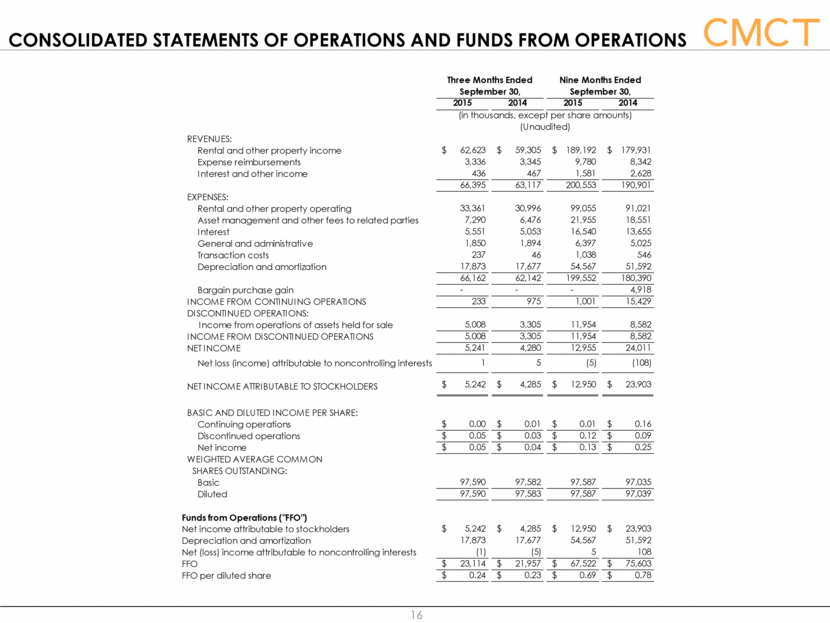
CONSOLIDATED STATEMENTS OF OPERATIONS and funds from operations 16 Three Months Ended Nine Months Ended September 30, September 30, 2015 2014 2015 2014 (in thousands, except per share amounts) (Unaudited) REVENUES: Rental and other property income $ 62,623 $ 59,305 $ 189,192 $ 179,931 Expense reimbursements 3,336 3,345 9,780 8,342 Interest and other income 436 467 1,581 2,628 66,395 63,117 200,553 190,901 EXPENSES: Rental and other property operating 33,361 30,996 99,055 91,021 Asset management and other fees to related parties 7,290 6,476 21,955 18,551 Interest 5,551 5,053 16,540 13,655 General and administrative 1,850 1,894 6,397 5,025 Transaction costs 237 46 1,038 546 Depreciation and amortization 17,873 17,677 54,567 51,592 66,162 62,142 199,552 180,390 Bargain purchase gain - - - 4,918 INCOME FROM CONTINUING OPERATIONS 233 975 1,001 15,429 DISCONTINUED OPERATIONS: Income from operations of assets held for sale 5,008 3,305 11,954 8,582 INCOME FROM DISCONTINUED OPERATIONS 5,008 3,305 11,954 8,582 NET INCOME 5,241 4,280 12,955 24,011 Net loss (income) attributable to noncontrolling interests 1 5 (5) (108) NET INCOME ATTRIBUTABLE TO STOCKHOLDERS $ 5,242 $ 4,285 $ 12,950 $ 23,903 BASIC AND DILUTED INCOME PER SHARE: Continuing operations $ 0.00 $ 0.01 $ 0.01 $ 0.16 Discontinued operations $ 0.05 $ 0.03 $ 0.12 $ 0.09 Net income $ 0.05 $ 0.04 $ 0.13 $ 0.25 WEIGHTED AVERAGE COMMON SHARES OUTSTANDING: Basic 97,590 97,582 97,587 97,035 Diluted 97,590 97,583 97,587 97,039 Funds from Operations ("FFO") Net income attributable to stockholders $ 5,242 $ 4,285 $ 12,950 $ 23,903 Depreciation and amortization 17,873 17,677 54,567 51,592 Net (loss) income attributable to noncontrolling interests (1) (5) 5 108 FFO $ 23,114 $ 21,957 $ 67,522 $ 75,603 FFO per diluted share $ 0.24 $ 0.23 $ 0.69 $ 0.78
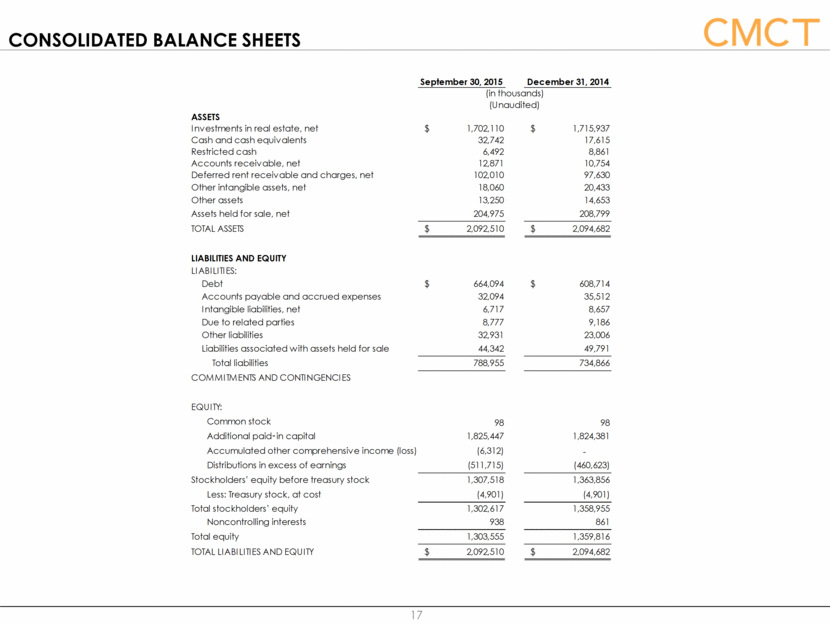
CONSOLIDATED BALANCE SHEETS 17 September 30, 2015 December 31, 2014 ASSETS Investments in real estate, net $ 1,702,110 $ 1,715,937 Cash and cash equivalents 32,742 17,615 Restricted cash 6,492 8,861 Accounts receivable, net 12,871 10,754 Deferred rent receivable and charges, net 102,010 97,630 Other intangible assets, net 18,060 20,433 Other assets 13,250 14,653 Assets held for sale, net 204,975 208,799 TOTAL ASSETS $ 2,092,510 $ 2,094,682 LIABILITIES AND EQUITY LIABILITIES: Debt $ 664,094 $ 608,714 Accounts payable and accrued expenses 32,094 35,512 Intangible liabilities, net 6,717 8,657 Due to related parties 8,777 9,186 Other liabilities 32,931 23,006 Liabilities associated with assets held for sale 44,342 49,791 Total liabilities 788,955 734,866 COMMITMENTS AND CONTINGENCIES EQUITY: Common stock 98 98 Additional paid ? in capital 1,825,447 1,824,381 Accumulated other comprehensive income (loss) (6,312) - Distributions in excess of earnings (511,715) (460,623) Stockholders’ equity before treasury stock 1,307,518 1,363,856 Less: Treasury stock, at cost (4,901) (4,901) Total stockholders’ equity 1,302,617 1,358,955 Noncontrolling interests 938 861 Total equity 1,303,555 1,359,816 TOTAL LIABILITIES AND EQUITY $ 2,092,510 $ 2,094,682 (in thousands) (Unaudited)
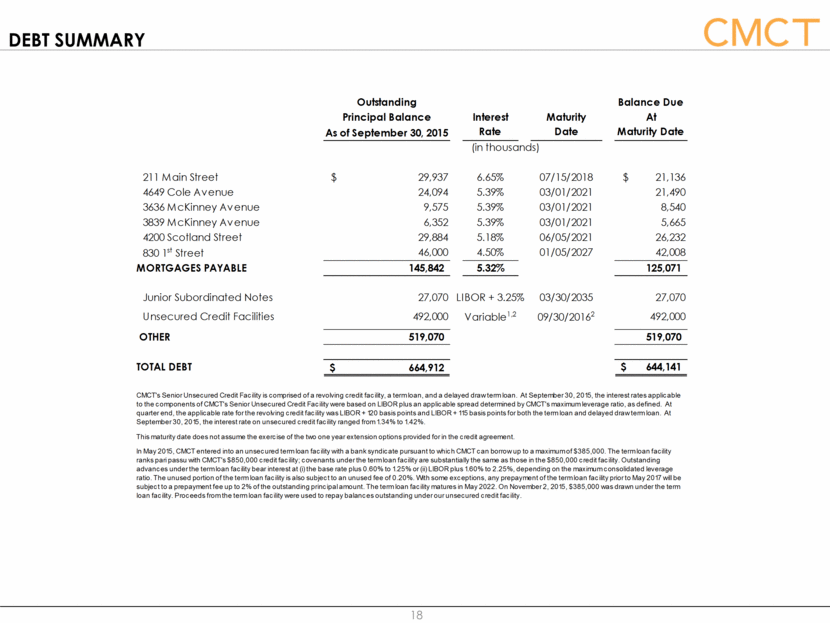
Debt summary 18 Outstanding Balance Due Principal Balance Interest Maturity At As of September 30, 2015 Rate Date Maturity Date (in thousands) 211 Main Street $ 29,937 6.65% 07/15/2018 $ 21,136 4649 Cole Avenue 24,094 5.39% 03/01/2021 21,490 3636 McKinney Avenue 9,575 5.39% 03/01/2021 8,540 3839 McKinney Avenue 6,352 5.39% 03/01/2021 5,665 4200 Scotland Street 29,884 5.18% 06/05/2021 26,232 830 1st Street 46,000 4.50% 01/05/2027 42,008 MORTGAGES PAYABLE 145,842 5.32% 125,071 Junior Subordinated Notes 27,070 LIBOR + 3.25% 03/30/2035 27,070 Unsecured Credit Facilities 492,000 Variable1,2 09/30/20162 492,000 OTHER 519,070 519,070 TOTAL DEBT $ 664,912 $ 644,141 CMCT's Senior Unsecured Credit Facility is comprised of a revolving credit facility, a term loan, and a delayed draw term loan. At September 30, 2015, the interest rates applicable to the components of CMCT's Senior Unsecured Credit Facility were based on LIBOR plus an applicable spread determined by CMCT's maximum leverage ratio, as defined. At quarter end, the applicable rate for the revolving credit facility was LIBOR + 120 basis points and LIBOR + 115 basis points for both the term loan and delayed draw term loan. At September 30, 2015, the interest rate on unsecured credit facility ranged from 1.34% to 1.42%. This maturity date does not assume the exercise of the two one year extension options provided for in the credit agreement. In May 2015, CMCT entered into an unsecured term loan facility with a bank syndicate pursuant to which CMCT can borrow up to a maximum of $385,000. The term loan facility ranks pari passu with CMCT's $850,000 credit facility; covenants under the term loan facility are substantially the same as those in the $850,000 credit facility. Outstanding advances under the term loan facility bear interest at (i) the base rate plus 0.60% to 1.25% or (ii) LIBOR plus 1.60% to 2.25%, depending on the maximum consolidated leverage ratio. The unused portion of the term loan facility is also subject to an unused fee of 0.20%. With some exceptions, any prepayment of the term loan facility prior to May 2017 will be subject to a prepayment fee up to 2% of the outstanding principal amount. The term loan facility matures in May 2022. On November 2, 2015, $385,000 was drawn under the term loan facility. Proceeds from the term loan facility were used to repay balances outstanding under our unsecured credit facility.
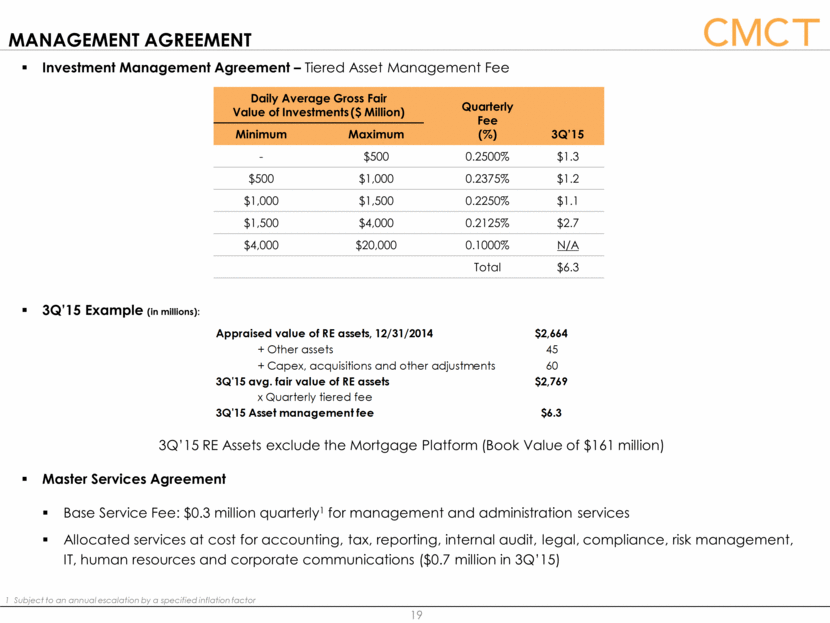
MANAGEMENT AGREEMENT Investment Management Agreement – Tiered Asset Management Fee 3Q’15 Example (in millions): 3Q’15 RE Assets exclude the Mortgage Platform (Book Value of $161 million) Master Services Agreement Base Service Fee: $0.3 million quarterly1 for management and administration services Allocated services at cost for accounting, tax, reporting, internal audit, legal, compliance, risk management, IT, human resources and corporate communications ($0.7 million in 3Q’15) Daily Average Gross Fair Value of Investments ($ Million) Quarterly Fee (%) 3Q’15 Minimum Maximum - $500 0.2500% $1.3 $500 $1,000 0.2375% $1.2 $1,000 $1,500 0.2250% $1.1 $1,500 $4,000 0.2125% $2.7 $4,000 $20,000 0.1000% N/A Total $6.3 1 Subject to an annual escalation by a specified inflation factor 19 Appraised value of RE assets, 12/31/2014 $2,664 + Other assets 45 + Capex, acquisitions and other adjustments 60 3Q'15 avg. fair value of RE assets $2,769 x Quarterly tiered fee 3Q'15 Asset management fee $6.3
Important Disclosures Assets and Equity Under Management • Assets Under Management (“AUM”), or Gross AUM, represents the (i) aggregate total gross assets (GAV) at fair value, including the shares of such assets owned by joint venture partners and co-investments, of all of CIM’s advised accounts (each an “Account” and collectively, the “Accounts”), plus (ii) the aggregate unfunded commitments of the Accounts, as of June 30, 2015. The GAV is calculated on the same basis as the June 30, 2015 unaudited financial statements prepared in accordance with U.S. generally accepted accounting principles on a fair value basis (“Book Value”), other than as described below with respect to CIM IV. The only investment currently held by CIM IV consists of shares in CIM Commercial Trust Corporation, a publically traded company; the Book Value of CIM IV is determined by assuming the underlying assets of CMCT are liquidated based upon management’s estimate of fair value. CIM does not view the price of CMCT’s publicly-traded shares to be a meaningful indication of the fair value of the CIM IV’s interest in CMCT due to the fact that the publicly-traded shares of CMCT represent less than 3% of the outstanding shares of CMCT and are thinly-traded. • Equity Under Management (“EUM”), or Net AUM, represents the (i) aggregate NAV of the Accounts (as described below), plus (ii) the aggregate unfunded commitments of the Accounts. The NAV of each Account is based upon the aggregate amounts that would be distributable (prior to incentive fee allocations) to such Account assuming a “hypothetical liquidation” of the Account on the date of determination, assuming that: (i) investments are sold at their Book Value (as defined above); (ii) debts are paid and other assets are collected; and (iii) appropriate adjustments and/or allocations between equity investors are made in accordance with applicable documents, in each case as determined in accordance with applicable accounting guidance. 20