Attached files
| file | filename |
|---|---|
| 8-K - 8-K - Starz, LLC | a15-24450_18k.htm |
Bank of America Merrill Lynch Leveraged Finance Conference December 2015 Page 1 Exhibit 99.1

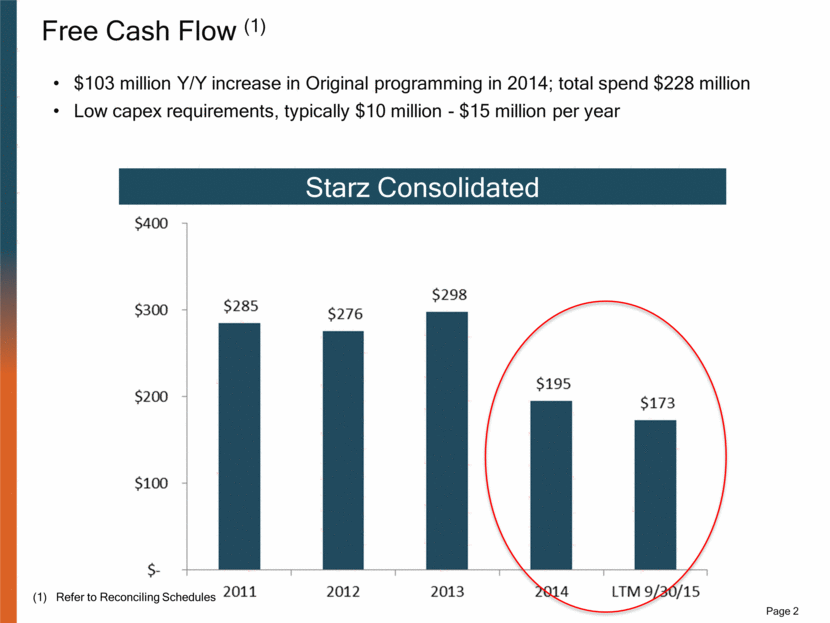
Free Cash Flow (1) (1) Refer to Reconciling Schedules Page 2 Starz Consolidated $103 million Y/Y increase in Original programming in 2014; total spend $228 million Low capex requirements, typically $10 million - $15 million per year
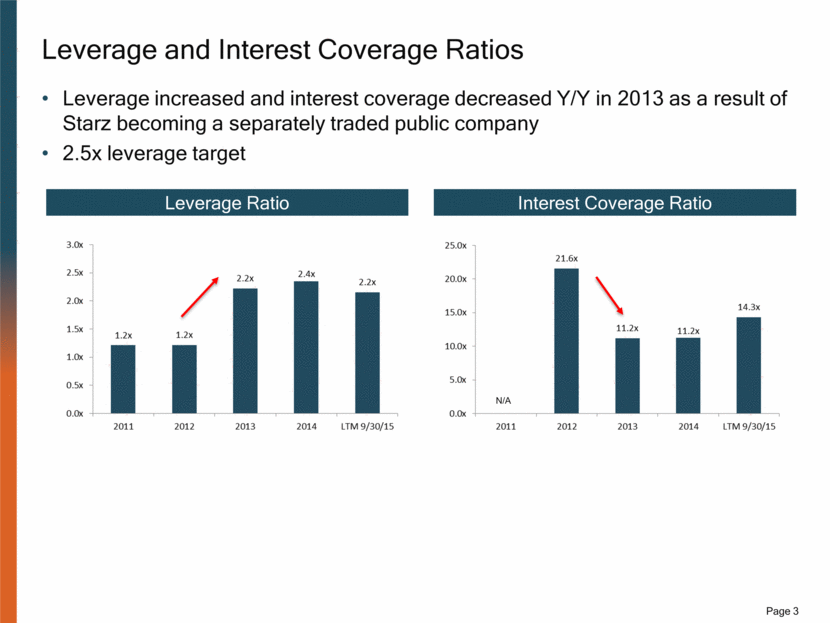
Leverage and Interest Coverage Ratios Page 3 Leverage Ratio Interest Coverage Ratio Leverage increased and interest coverage decreased Y/Y in 2013 as a result of Starz becoming a separately traded public company 2.5x leverage target N/A
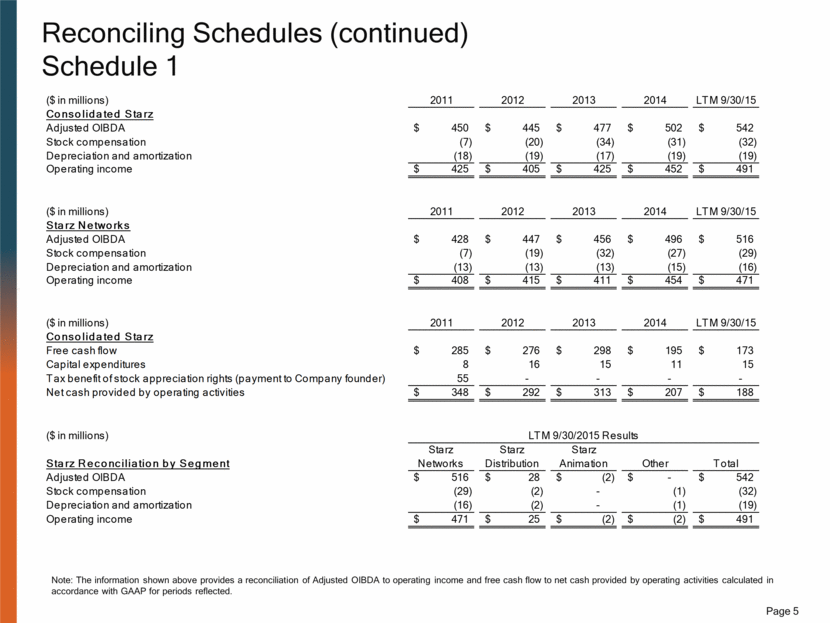
Reconciling Schedules We evaluate performance and make decisions about allocating resources to our operating segments based on financial measures such as Adjusted OIBDA. We define Adjusted OIBDA as revenue less programming costs, production and acquisition costs, home video cost of sales, operating expenses and selling, general and administrative expenses. Our chief operating decision maker uses this measure of performance in conjunction with other measures to evaluate our operating segments’ performance and make decisions about allocating resources among our operating segments. We believe that Adjusted OIBDA is an important indicator of the operational strength and performance of our operating segments, including each operating segment’s ability to assist in servicing our debt and to fund investments in films and television programs. In addition, this measure allows management to view operating results and perform analytical comparisons and benchmarking between operating segments and identify strategies to improve performance. This measure of performance excludes stock compensation and depreciation and amortization that are included in the measurement of operating income pursuant to GAAP. Accordingly, Adjusted OIBDA should be considered in addition to, but not as a substitute for, operating income, income before income taxes, net income, net cash provided by operating activities and other measures of financial performance prepared in accordance with GAAP. We define free cash flow as net cash provided by operating activities less investment in property and equipment. Free cash flow is an important metric as it represents the cash that Starz is able to generate after funding operating activities and capital expenditures which can be used to pursue new opportunities, reduce debt or repurchase shares. The information shown in Schedule 1 provides a reconciliation of Adjusted OIBDA to operating income and free cash flow to net cash provided by operating activities calculated in accordance with GAAP for periods reflected. Page 4
Reconciling Schedules (continued) Schedule 1 Note: The information shown above provides a reconciliation of Adjusted OIBDA to operating income and free cash flow to net cash provided by operating activities calculated in accordance with GAAP for periods reflected. Page 5 ($ in millions) 2011 2012 2013 2014 LTM 9/30/15 Consolidated Starz Adjusted OIBDA 450 $ 445 $ 477 $ 502 $ 542 $ Stock compensation (7) (20) (34) (31) (32) Depreciation and amortization (18) (19) (17) (19) (19) Operating income 425 $ 405 $ 425 $ 452 $ 491 $ ($ in millions) 2011 2012 2013 2014 LTM 9/30/15 Starz Networks Adjusted OIBDA 428 $ 447 $ 456 $ 496 $ 516 $ Stock compensation (7) (19) (32) (27) (29) Depreciation and amortization (13) (13) (13) (15) (16) Operating income 408 $ 415 $ 411 $ 454 $ 471 $ ($ in millions) 2011 2012 2013 2014 LTM 9/30/15 Consolidated Starz Free cash flow 285 $ 276 $ 298 $ 195 $ 173 $ Capital expenditures 8 16 15 11 15 Tax benefit of stock appreciation rights (payment to Company founder) 55 - - - - Net cash provided by operating activities 348 $ 292 $ 313 $ 207 $ 188 $ ($ in millions) LTM 9/30/2015 Results Starz Reconciliation by Segment Starz Networks Starz Distribution Starz Animation Other Total Adjusted OIBDA 516 $ 28 $ (2) $ - $ 542 $ Stock compensation (29) (2) - (1) (32) Depreciation and amortization (16) (2) - (1) (19) Operating income 471 $ 25 $ (2) $ (2) $ 491 $
