Attached files
| file | filename |
|---|---|
| 8-K - FORM 8-K - LEMAITRE VASCULAR INC | d24041d8k.htm |
Exhibit 99.1
DISCLAIMERS Forward Looking Statements This presentation contains certain forward looking statements that involve risks and uncertainties. Actual results and events may differ significantly from results and events discussed in forward looking statements. Factors that might cause or contribute to such differences include, but are not limited to, those discussed in “Risk Factors” in our Annual Report on Form 10K and subsequent Quarterly Reports on Form 10Q filed with the Securities and Exchange Commission. We undertake no obligation to update publicly any forward looking statements to reflect new information, events, or circumstances after the date they were made. Non GAAP Financial Measures This presentation contains non GAAP financial measures. Non GAAP financial measures are not prepared in accordance with generally accepted accounting principles and may not be comparable to similar non GAAP financial measures used by other companies. The most directly comparable financial measures calculated in accordance with GAAP and a reconciliation of GAAP to non GAAP financial measures are provided at the end of this presentation. Other Unless otherwise specified, all information contained herein is provided as of September 30, 2015, except that all management guidance is as of December 3, 2015 (unchanged from that given on October 27, 2015). Slide 2
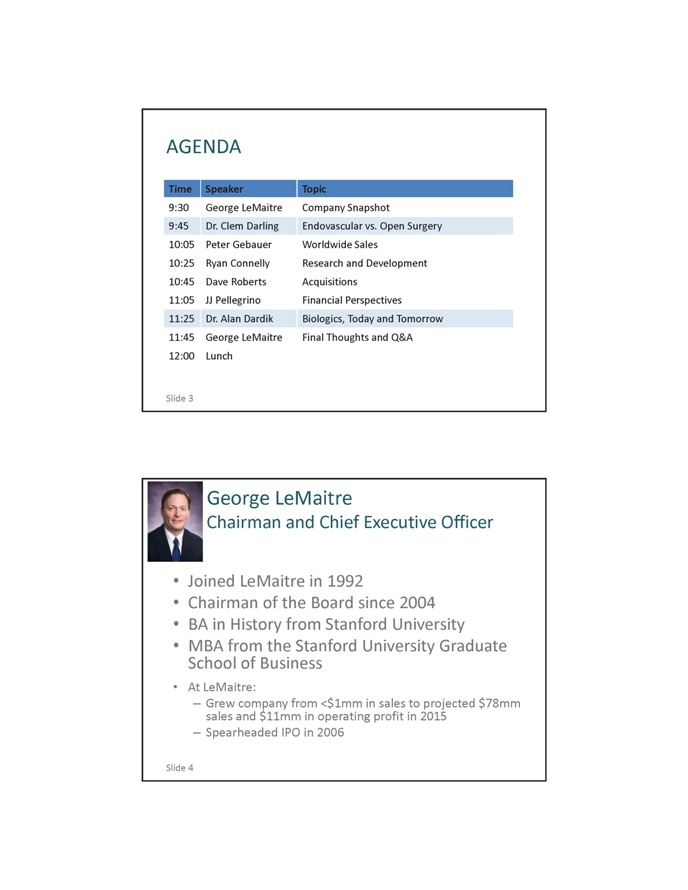
AGENDA Time Speaker Topic 9:30 George LeMaitre Company Snapshot 9:45 Dr. Clem Darling Endovascular vs. Open Surgery 10:05 Peter Gebauer Worldwide Sales 10:25 Ryan Connelly Research and Development 10:45 Dave Roberts Acquisitions 11:05 JJ Pellegrino Financial Perspectives 11:25 Dr. Alan Dardik Biologics, Today and Tomorrow 11:45 George LeMaitre Final Thoughts and Q&A 12:00 Lunch Slide 3 George LeMaitre Chairman and Chief Executive Officer Joined LeMaitre in 1992 Chairman of the Board since 2004 BA in History from Stanford University MBA from the Stanford University Graduate School of Business At LeMaitre: – sales and Grew company from $11mm in operating profit in 2015 $1mm in sales to projected $78mm – Spearheaded IPO in 2006 Slide 4
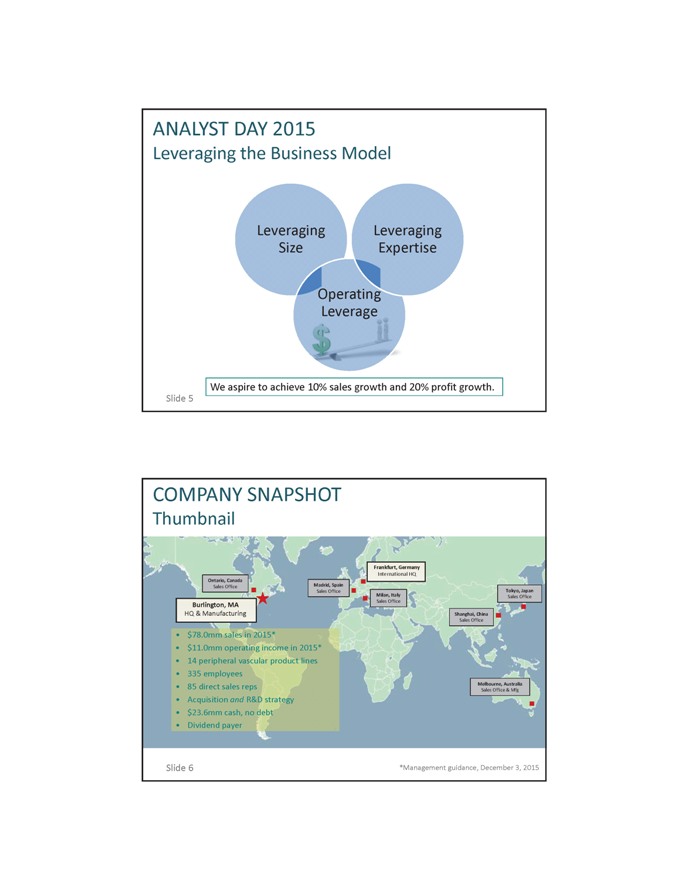
ANALYST DAY 2015 Leveraging the Business Model Leveraging Leveraging Size Expertise Oper Leverage We aspire to achieve 10% sales growth and 20% profit growth. Slide 5 COMPANY SNAPSHOT Thumbnail Sales Office $78.0mm sales in 2015* $11.0mm operating income in 2015* 14 peripheral vascular product lines 335 employees 85 direct sales reps Melbourne, Australia Sales Office & Mfg Acquisition and R&D strategy $23.6mm cash, no debt Dividend payer Slide 6 *Management guidance, December 3, 2015
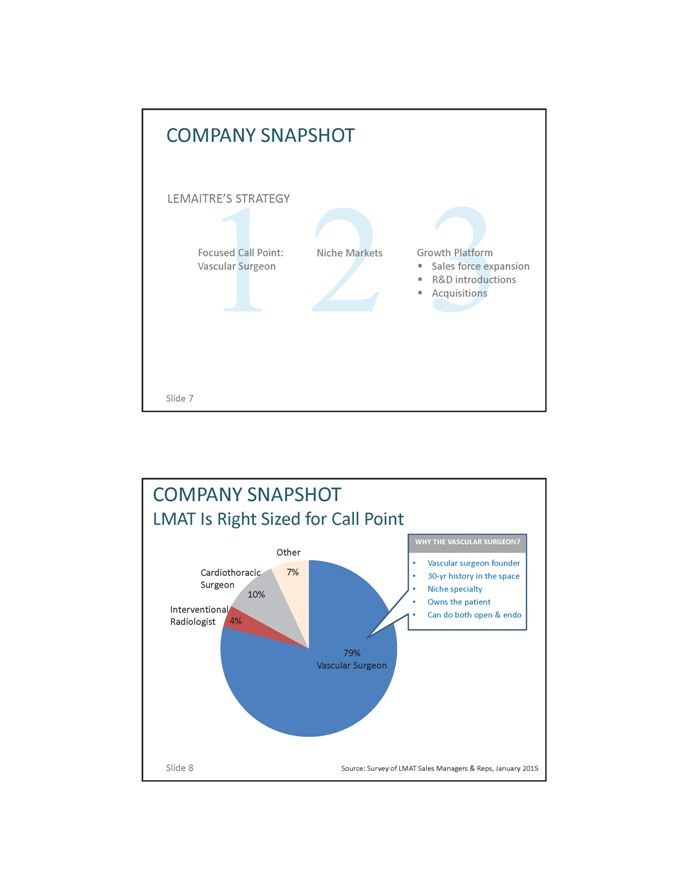
COMPANY SNAPSHOT LEMAITRE’S STRATEGY Focused Call Point: Niche Markets Growth Platform Vascular Surgeon Sales force expansionR&D introductions Acquisitions Slide 7 COMPANY SNAPSHOT LMAT Is Right Sized for Call Point WHY THE VASCULAR SURGEON Vascular surgeon founder 30yr history in the space Niche specialty Owns the patient Can do both open & endo Slide 8 Source: Survey of LMAT Sales Managers & Reps, January 2015
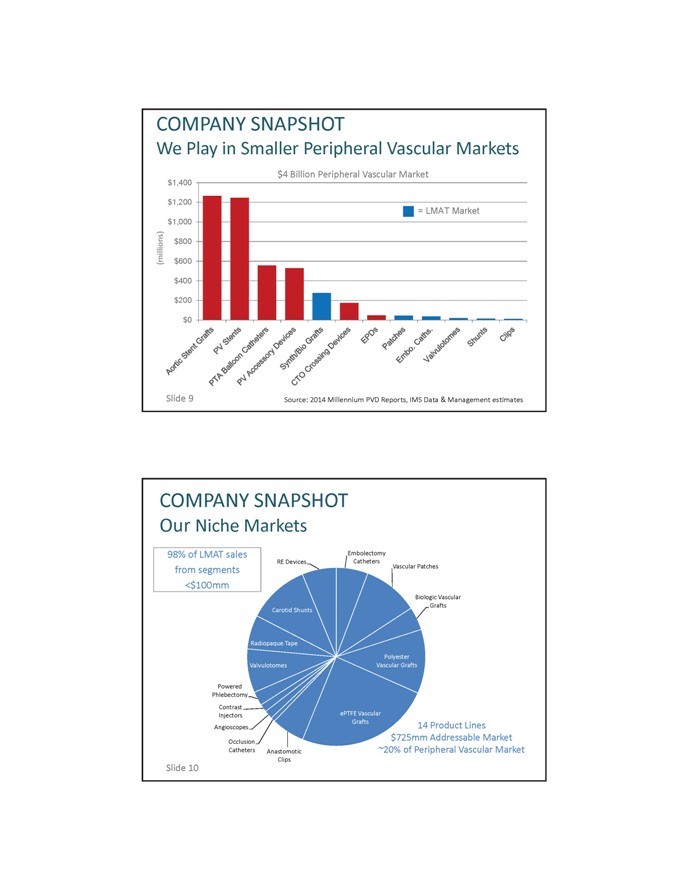
COMPANY SNAPSHOT We Play in Smaller Peripheral Vascular Markets $4 Billion Peripheral Vascular Market Slide 9 Source: 2014 Millennium PVD Reports, IMS Data & Management estimates COMPANY SNAPSHOT Our Niche Markets 14 Product Lines $725mm Addressable Market ~20% of Peripheral Vascular Market
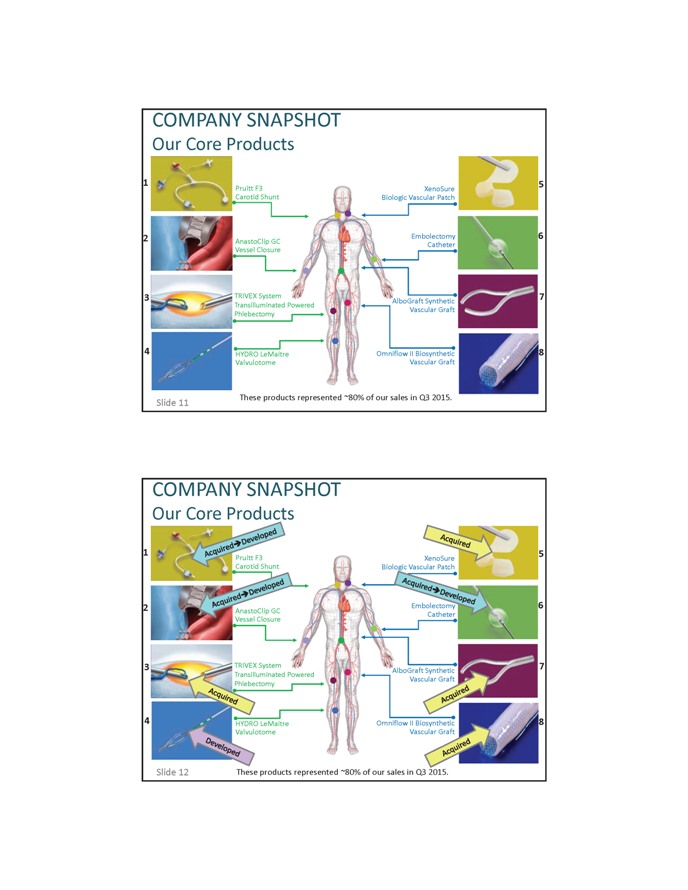
COMPANY SNAPSHOT Our Core Products These products represented ~80% of our sales in Q3 2015. COMPANY SNAPSHOT Our Core Products Slide 12 These products represented ~80% of our sales in Q3 2015.
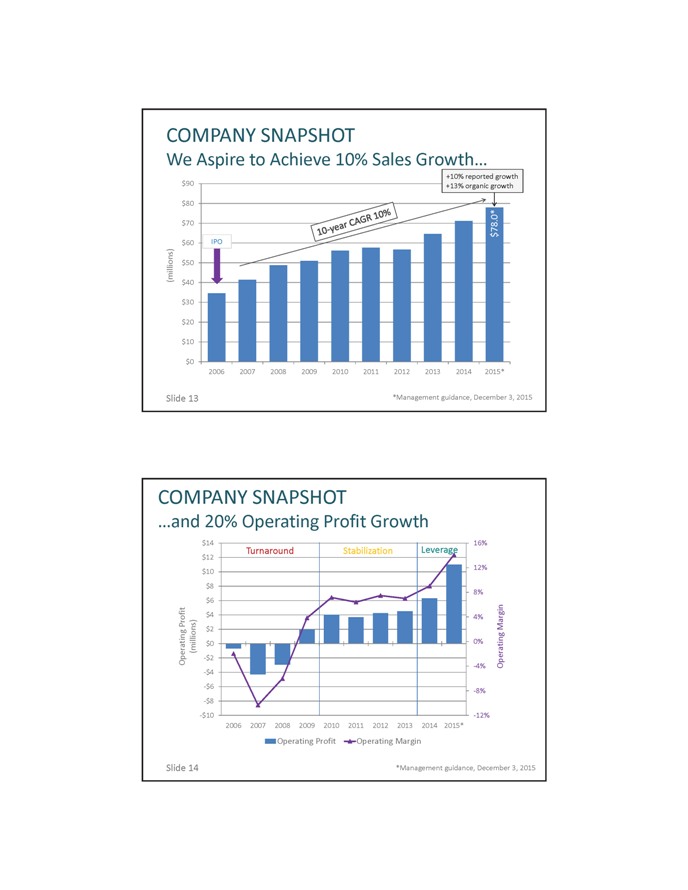
COMPANY SNAPSHOT We Aspire to Achieve 10% Sales Growth Slide 13 *Management guidance, December 3, 2015 COMPANY SNAPSHOT and 20% Operating Profit Growth Slide 14 *Management guidance, December 3, 2015
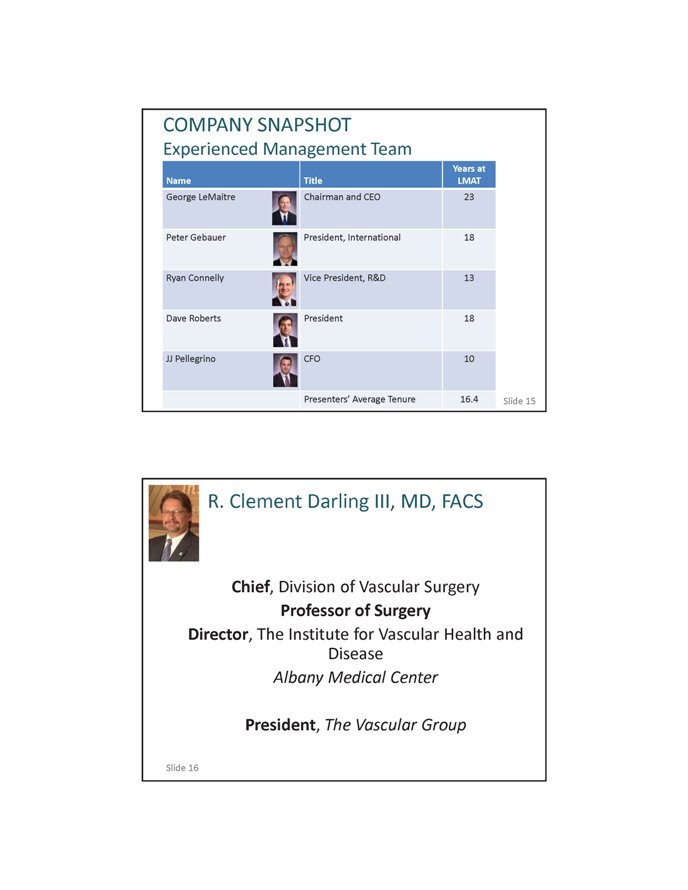
COMPANY SNAPSHOT Experienced Management Team Years at Name Title LMAT George LeMaitre Chairman and CEO 23 Peter Gebauer President, International 18 Ryan Connelly Vice President, R&D 13 Dave Roberts President 18 JJ Pellegrino CFO 10 Presenters’ Average Tenure 16.4 Slide 15 R. Clement Darling III, MD, FACS Chief, Division of Vascular Surgery Professor of Surgery Director, The Institute for Vascular Health and Disease Albany Medical Center President, The Vascular Group Slide 16
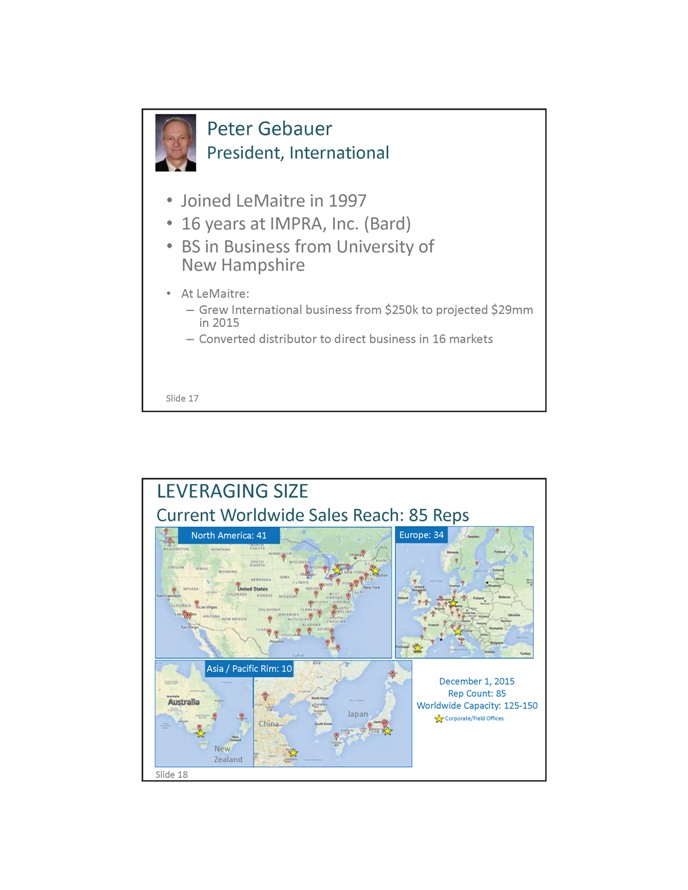
Peter Gebauer President, International Joined LeMaitre in 1997 16 years at IMPRA, Inc. (Bard) BS in Business from University of New Hampshire At LeMaitre: – in 2015 Grew International business from $250k to projected $29mm – Converted distributor to direct business in 16 markets Slide 17 LEVERAGING SIZE Current Worldwide Sales Reach: 85 Reps December 1, 2015 Rep Count: 85 Worldwide Capacity: 125 150 Corporate/Field Offices
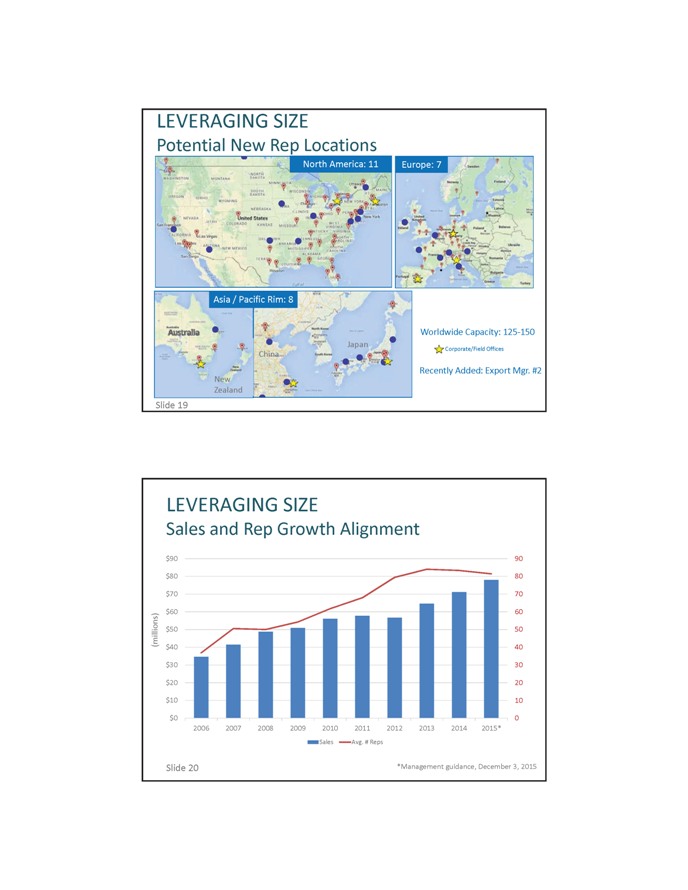
LEVERAGING SIZE Potential New Rep Locations Worldwide Capacity: 125 150 Corporate/Field Offices Recently Added: Export Mgr. #2 LEVERAGING SIZE Sales and Rep Growth Alignment Slide 20 *Management guidance, December 3, 2015

LEVERAGING SIZE Rep Tenure Contributing to Sales Growth Average Tenure in Months Sales Per Rep Slide 21 *Based on 2015 management sales guidance, December 3, 2015 LEVERAGING SIZE Proven Go Direct Record 15 0 3 (Win Loss TBD) DISTRIBUTOR BUYOUT MULTIPLE SALES CAGR YEAR COUNTRY SCORE SALES GROSS PROFIT SINCE “DIRECT” 1999 Germany N/A N/A 26% W 2001 Belgium 1.3x 0.8x 25% W 2001 Austria 0.5x 0.8x 18% W 2001 Netherlands 1.2x 1.6x 23% W 2002 UK 2.9x 2.4x 32% W 2004 Japan 0.3x 0.8x 17% W 2006 Sweden 0.7x 1.1x 13% W 2007 Canada N/A N/A 20% W 2007 France N/A N/A 22% W 2008 Italy 1.5x 3.6x 12% W 2011 Spain 2.3x 5.1x 18% W 2011 Denmark 0.9x 1.4x 11% W 2013 Switzerland 0.8x 1.3x 108% W 2014 Norway 2.1x 3.6x 151% W 2014 China N/A N/A N/A TBD 2014 Australia 1.0x 0.6x 258% W 2015 New Zealand N/A N/A N/A TBD 2016 Finland 0.6x 1.0x N/A TBD Median 1.0x 1.3x 22%
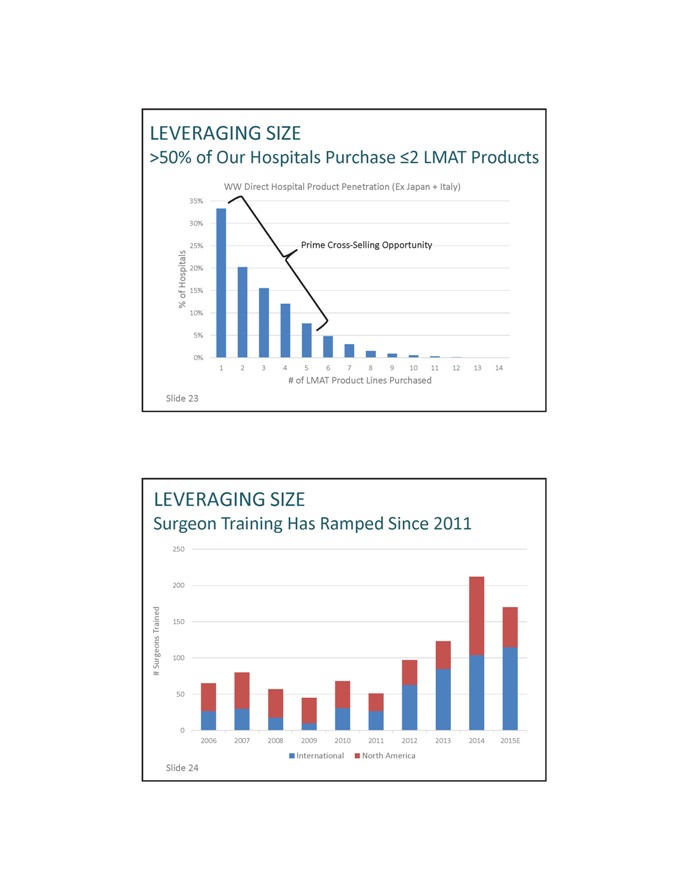
LEVERAGING SIZE >50% of Our Hospitals Purchase 2 LMAT Products WW Direct Hospital Product Penetration (Ex Japan + Italy) # of LMAT Product Lines Purchased Slide 23 LEVERAGING SIZE Surgeon Training Has Ramped Since 2011
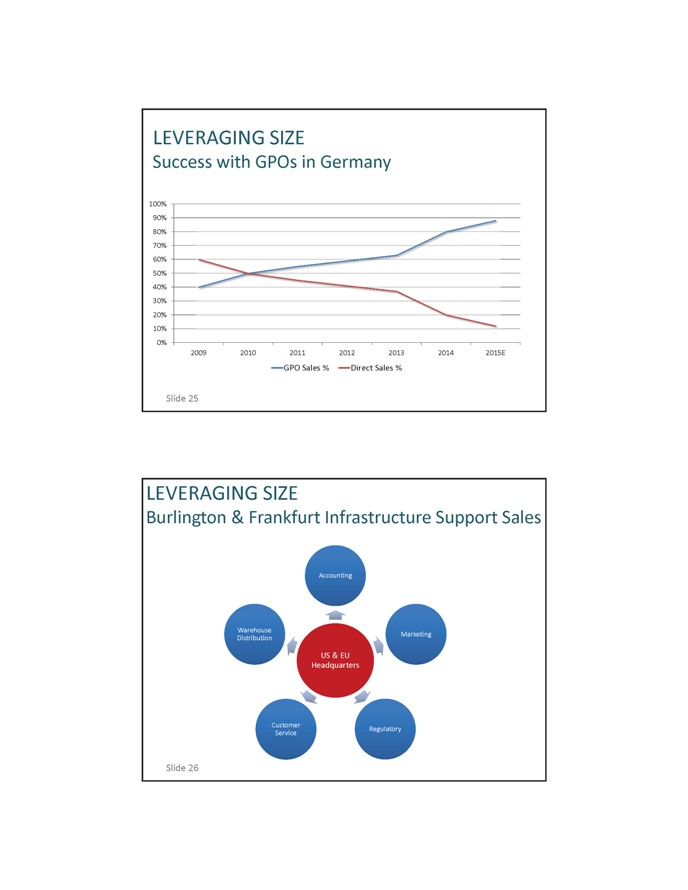
LEVERAGING SIZE Success with GPOs in Germany Slide 25 LEVERAGING SIZE Burlington & Frankfurt Infrastructure Support Sales Slide 26
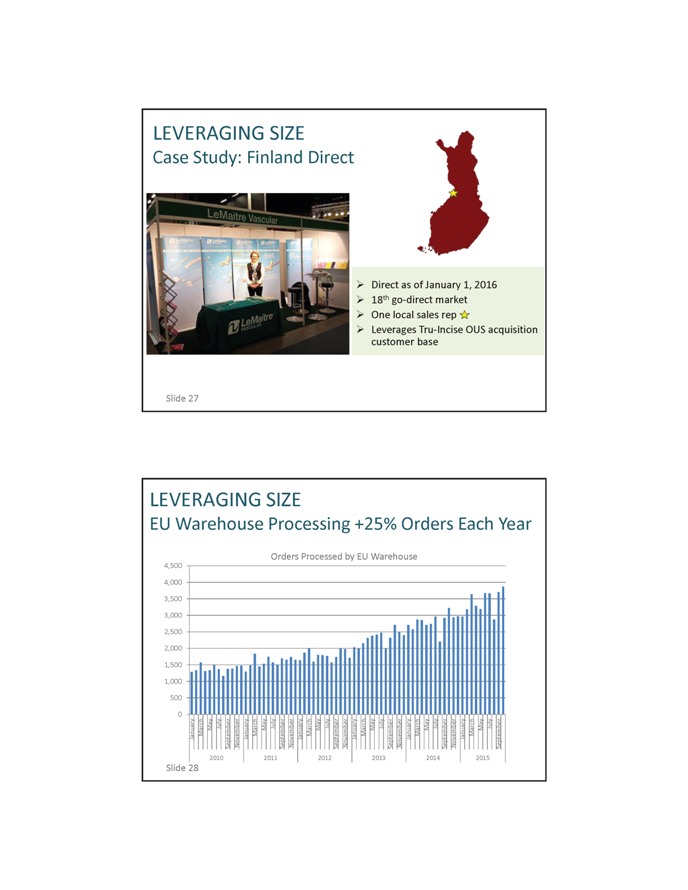
LEVERAGING SIZE Case Study: Finland Direct Direct as of January 1, 2016 18th go direct market One local sales rep Leverages Tru Incise OUS acquisition customer base Slide 27 LEVERAGING SIZE EU Warehouse Processing +25% Orders Each Year Orders Processed by EU Warehouse Slide 28
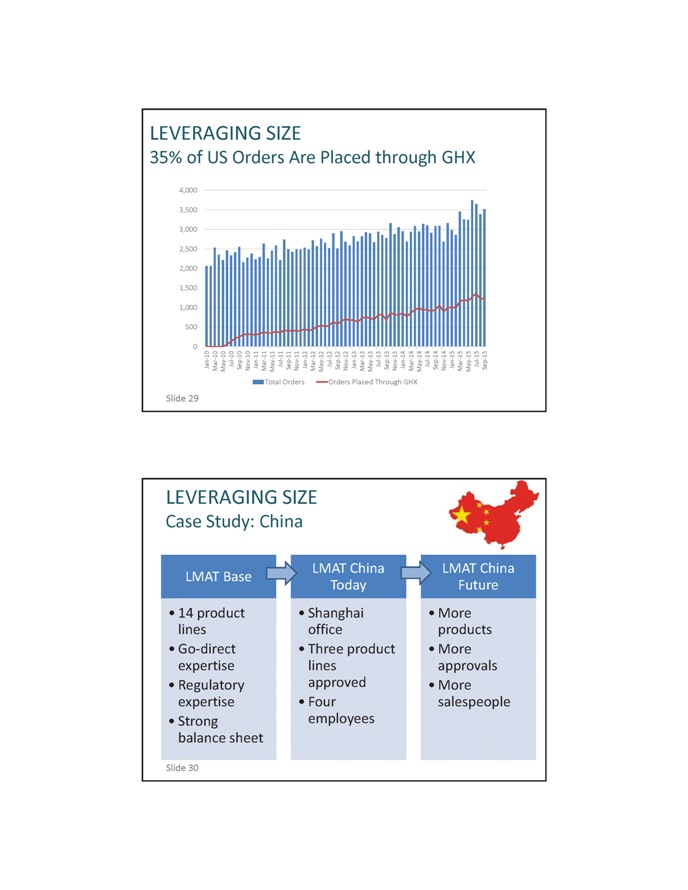
LEVERAGING SIZE 35% of US Orders Are Placed through GHX Slide 29 LEVERAGING SIZE Case Study: China LMAT China LMAT China LMAT Base Today Future 14 product Shanghai More lines office products Go-direct Three product More expertise lines approvals Regulatory approved More expertise Four salespeople Strong employees balance sheet Slide 30
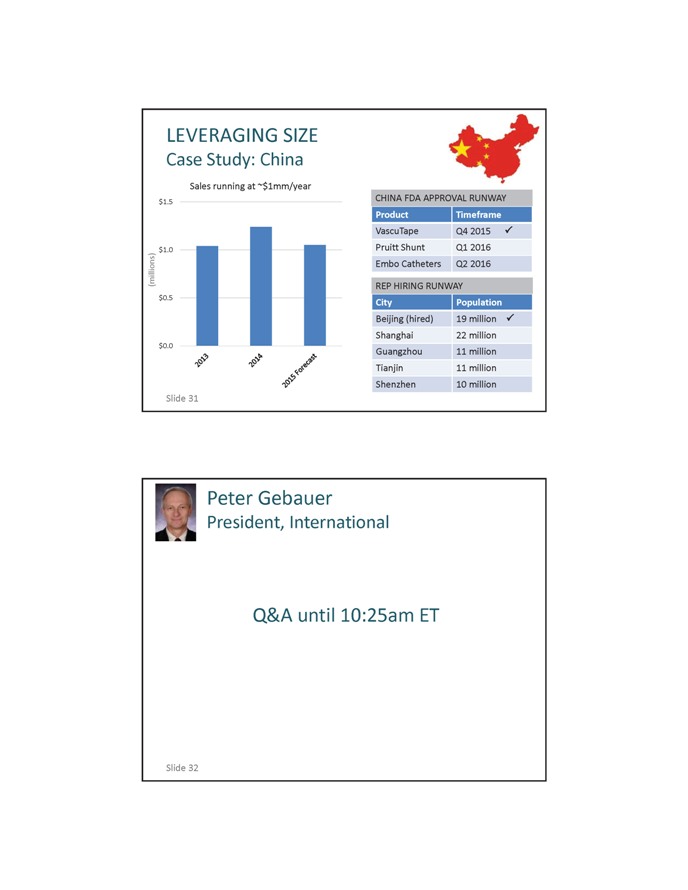
LEVERAGING SIZE Case Study: China Sales running at ~$1mm/year CHINA FDA APPROVAL RUNWAY Product Timeframe VascuTape Q4 2015 Pruitt Shunt Q1 2016 Embo Catheters Q2 2016 REP HIRING RUNWAY City Population Beijing (hired) 19 million Shanghai 22 million Guangzhou 11 million Tianjin 11 million Shenzhen 10 million Peter Gebauer President, International Q&A until 10:25am ET Slide 32
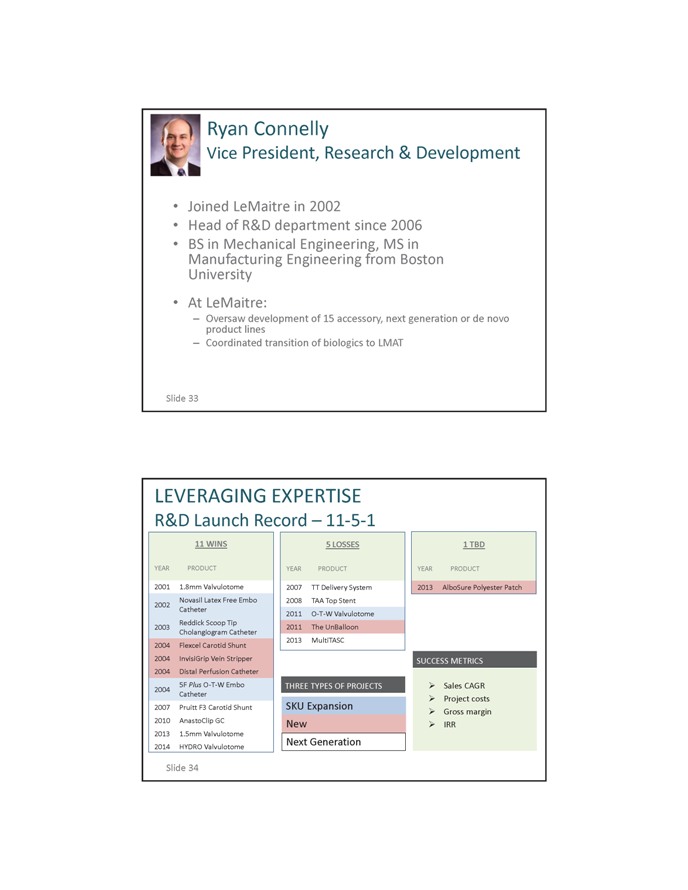
Ryan Connelly Vice President, Research & Development Joined LeMaitre in 2002 Head of R&D department since 2006 BS in Mechanical Engineering, MS in Manufacturing Engineering from Boston University At LeMaitre: – Oversaw development of 15 accessory, next generation or de novo product lines – Coordinated transition of biologics to LMAT Slide 33 11 WINS 5 LOSSES 1 TBD YEAR PRODUCT YEAR PRODUCT YEAR PRODUCT 2001 1.8mm Valvulotome 2007 TT Delivery System 2013 AlboSure Polyester Patch 2002 Novasil Latex Free Embo 2008 TAA Top Stent Catheter 2011 O T W Valvulotome Reddick Scoop Tip 2003 2011 The UnBalloon Cholangiogram Catheter 2004 Flexcel Carotid Shunt 2013 MultiTASC 2004 InvisiGrip Vein Stripper SUCCESS METRICS 2004 Distal Perfusion Catheter 2004 5F Plus O T W Embo THREE TYPES OF PROJECTS Sales CAGR Catheter Project costs 2007 Pruitt F3 Carotid Shunt SKU Expansion Gross margin 2010 AnastoClip GC New IRR 2013 1.5mm Valvulotome 2014 HYDRO Valvulotome Next Generation Slide 34
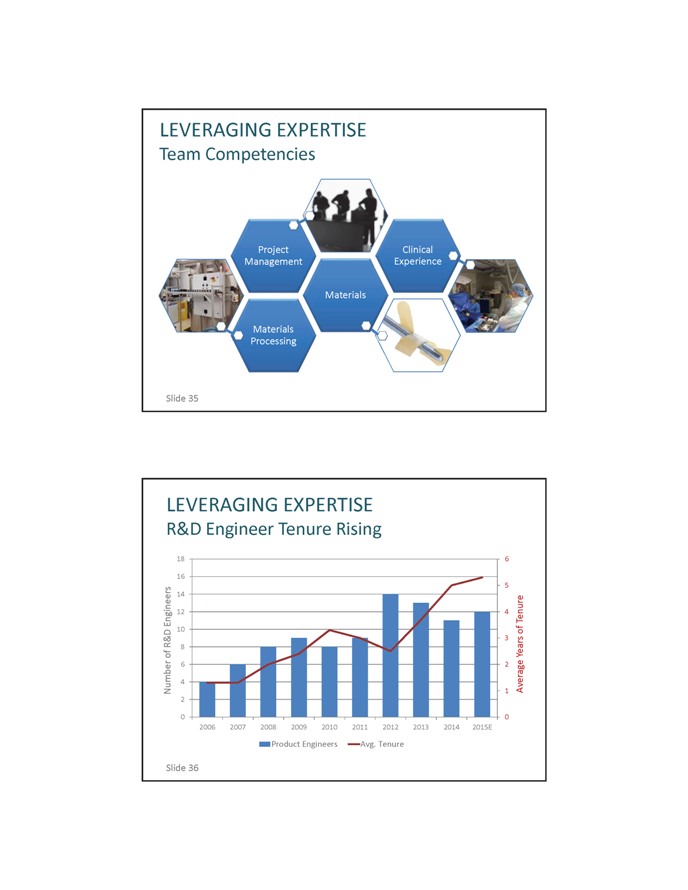
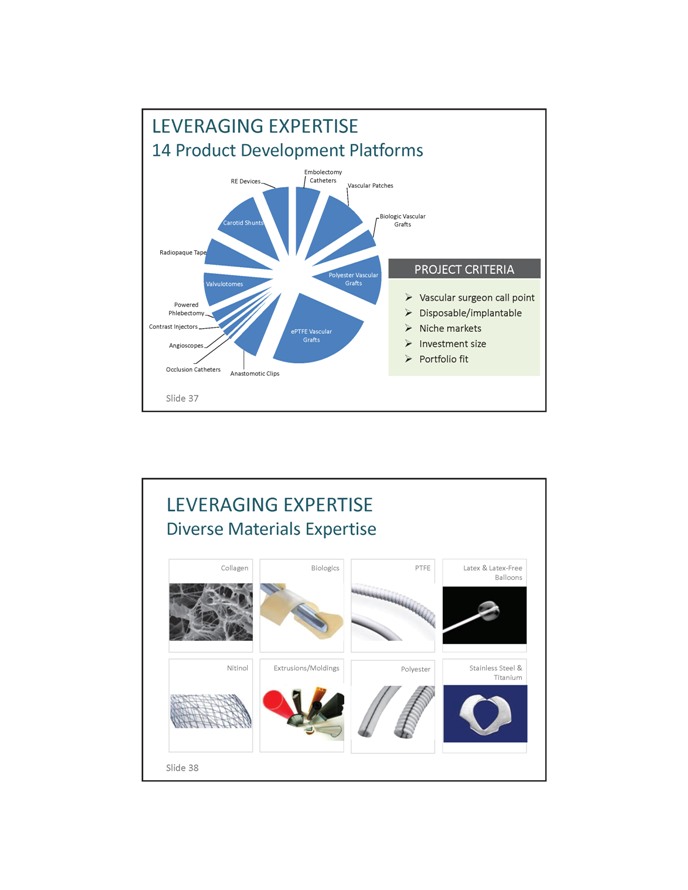
LEVERAGING EXPERTISE Team Competencies Slide 35 LEVERAGING EXPERTISE R&D Engineer Tenure Rising Slide 36
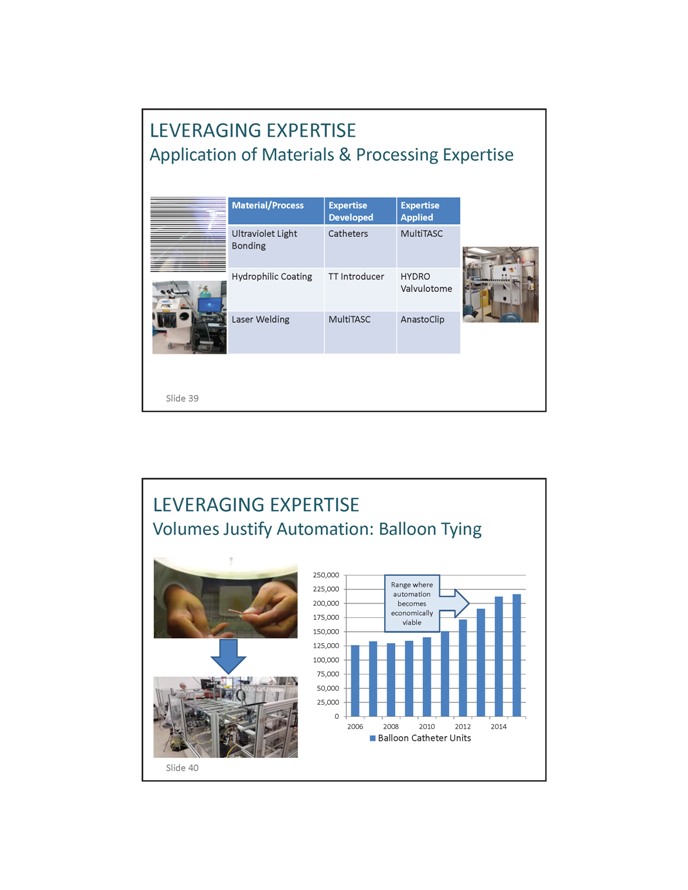
LEVERAGING EXPERTISE 14 Product Development Platforms PROJECT CRITERIA Vascular surgeon call point Disposable/implantable Niche markets Investment size Portfolio fit LEVERAGING EXPERTISE Diverse Materials Expertise Slide 38
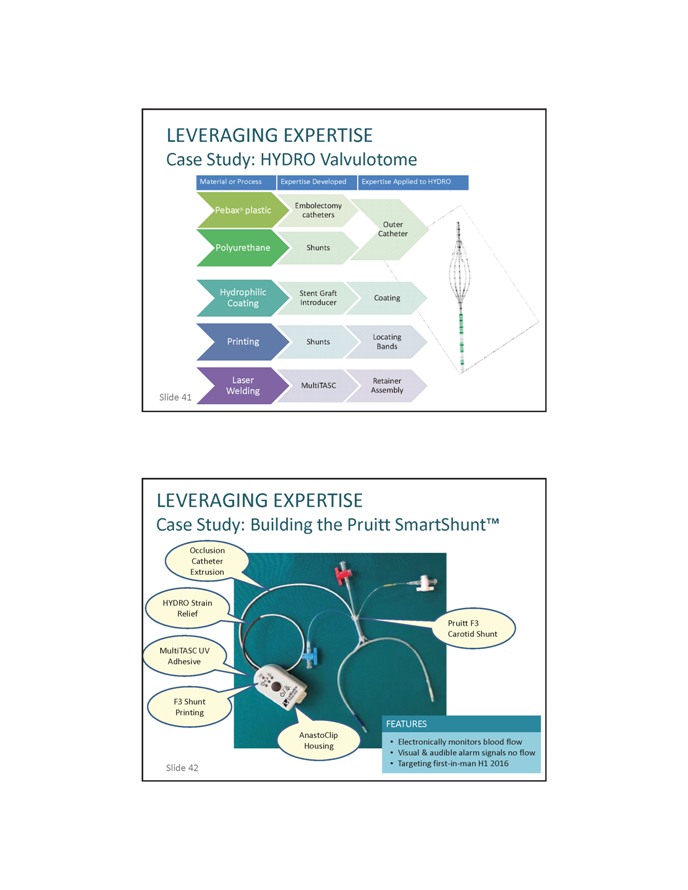
LEVERAGING EXPERTISE Application of Materials & Processing Expertise Material/Process Expertise Expertise Developed Applied Ultraviolet Light Catheters MultiTASC Bonding Hydrophilic Coating TT Introducer HYDRO Valvulotome Laser Welding MultiTASC AnastoClip Slide 39 LEVERAGING EXPERTISE Volumes Justify Automation: Balloon Tying Balloon Catheter Units Slide 40
LEVERAGING EXPERTISE Case Study: HYDRO Valvulotome LEVERAGING EXPERTISE Case Study: Building the Pruitt SmartShunt™ FEATURES Electronically monitors blood flow Visual & audible alarm signals no flow Targeting first-in-man H1 2016
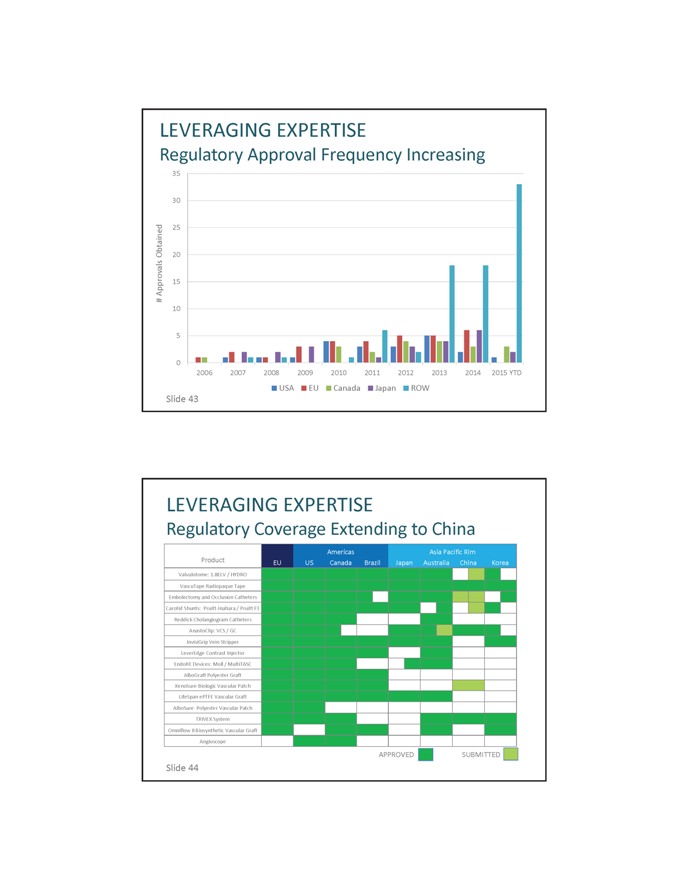
LEVERAGING EXPERTISE Regulatory Approval Frequency Increasing LEVERAGING EXPERTISE Regulatory Coverage Extending to China Slide 44
Ryan Connelly Vice President, Research & Development Q&A until 10:45am ET David Roberts President Joined LeMaitre in 1997 Joined LMAT Board of Directors in 2001 BA in Business Economics, Brown University MBA from Stanford University Graduate School of Business At LeMaitre: – 17 Acquisitions in 17 years – CFO during IPO in 2006 Slide 46
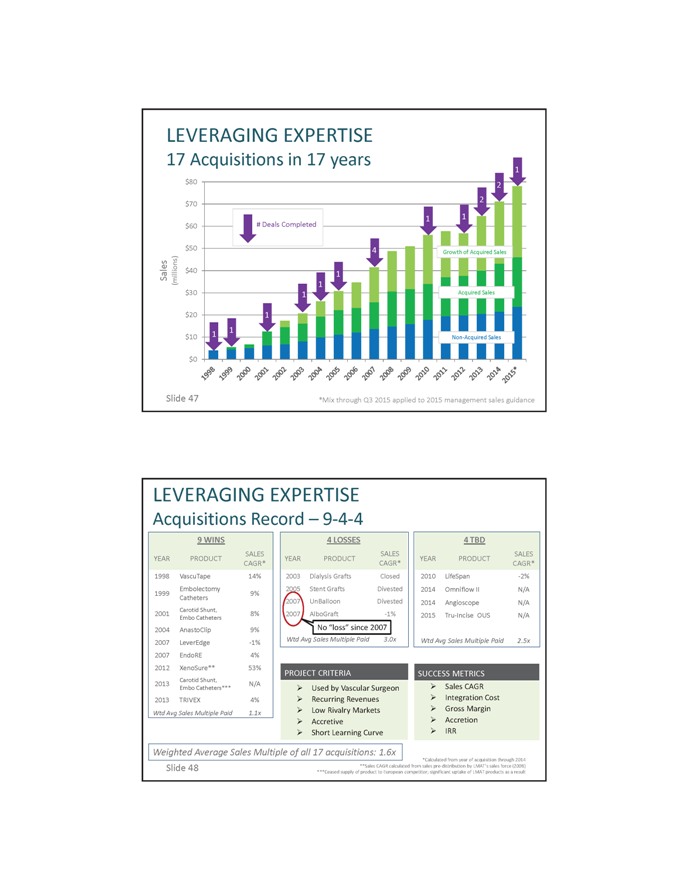
LEVERAGING EXPERTISE 17 Acquisitions in 17 years Slide 47 *Mix through Q3 2015 applied to 2015 management sales guidance LEVERAGING EXPERTISE Acquisitions Record – 9-4-4 9 WINS YEAR PRODUCT SALES CAGR* 1998 VascuTape 14% Embolectomy 1999 9% Catheters Carotid Shunt, 2001 8% Embo Catheters 2004 AnastoClip 9% 2007 LeverEdge 1% 2007 EndoRE 4% 2012 XenoSure** 53% Carotid Shunt, 2013 N/A Embo Catheters*** 2013 TRIVEX 4% Wtd Avg Sales Multiple Paid 1.1x 4 LOSSES 4 TBD SALES SALES YEAR PRODUCT YEAR PRODUCT CAGR* CAGR* 2003 Dialysis Grafts Closed 2010 LifeSpan 2% 2005 Stent Grafts Divested 2014 Omniflow II N/A 2007 UnBalloon Divested 2014 Angioscope N/A 2007 AlboGraft ?1% 2015 Tru-Incise OUS N/A No “loss” since 2007 Wtd Avg Sales Multiple Paid 3.0x Wtd Avg Sales Multiple Paid 2.5x PROJECT CRITERIA SUCCESS METRICS Used by Vascular Surgeon Sales CAGR Recurring Revenues Integration Cost Low Rivalry Markets Gross Margin Accretive Accretion Short Learning Curve IRR Weighted Average Sales Multiple of all 17 acquisitions: 1.6x *Calculated from year of acquisition through 2014 Slide 48 **Sales CAGR calculated from sales pre-distribution by LMAT’s sales force (2008) ***Ceased supply of product to European competitor; significant uptake of LMAT products as a result
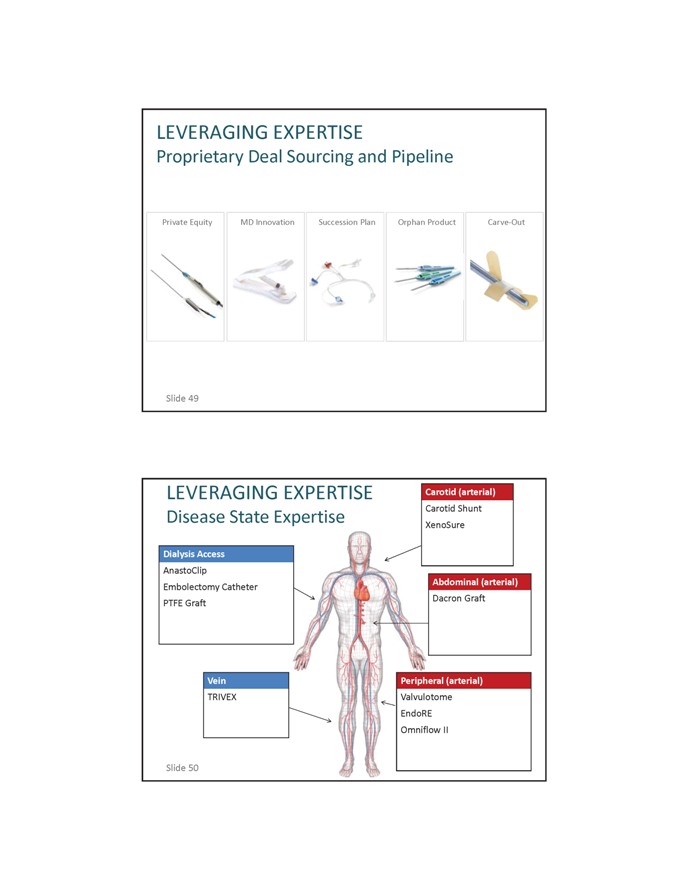
LEVERAGING EXPERTISE Proprietary Deal Sourcing and Pipeline Private Equity MD Innovation Succession Plan Orphan Product Carve-Out LEVERAGING EXPERTISE Disease State Expertise Dialysis Access AnastoClip Embolectomy Catheter PTFE Graft Vein TRIVEX Carotid (arterial) Carotid Shunt XenoSure Abdominal (arterial) Dacron Graft Peripheral (arterial) Valvulotome EndoRE Omniflow II Slide 50
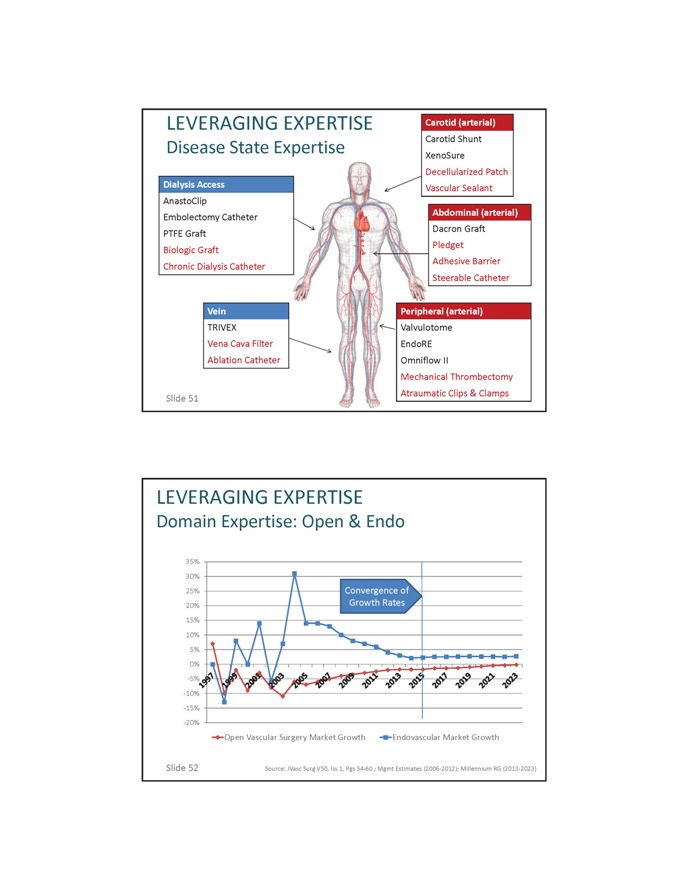
LEVERAGING EXPERTISE Disease State Expertise Dialysis Access AnastoClip Embolectomy Catheter PTFE Graft Biologic Graft Chronic Dialysis Catheter Vein TRIVEX Vena Cava Filter Ablation Catheter Slide 51 Carotid (arterial) Carotid Shunt XenoSure Decellularized Patch Vascular Sealant Abdominal (arterial) Dacron Graft Pledget Adhesive Barrier Steerable Catheter Peripheral (arterial) Valvulotome EndoRE Omniflow II Mechanical Thrombectomy Atraumatic Clips & Clamps LEVERAGING EXPERTISE Domain Expertise: Open & Endo Slide 52 Source: JVasc Surg V50, Iss 1, Pgs 54-60 ; Mgmt Estimates (2006-2012); Millennium RG (2013-2023)
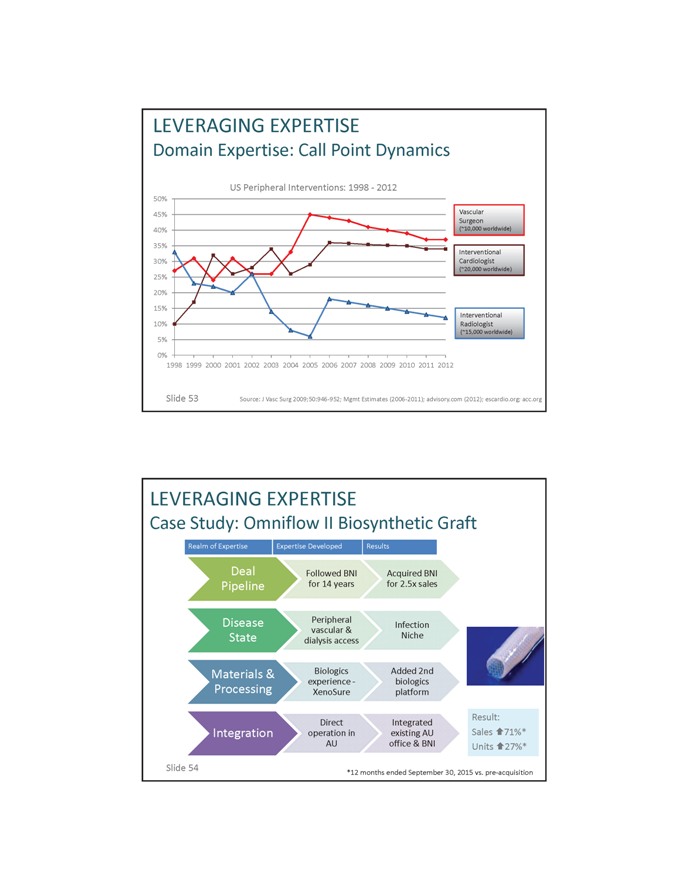
LEVERAGING EXPERTISE Domain Expertise: Call Point Dynamics US Peripheral Interventions: 1998 2012 Slide 53 Source: J Vasc Surg 2009;50:946 952; Mgmt Estimates (2006-2011); advisory.com (2012); escardio.org; acc.org LEVERAGING EXPERTISE Case Study: Omniflow II Biosynthetic Graft Result: Sales 71%* Units 27%* Slide 54 *12 months ended September 30, 2015 vs. pre-acquisition
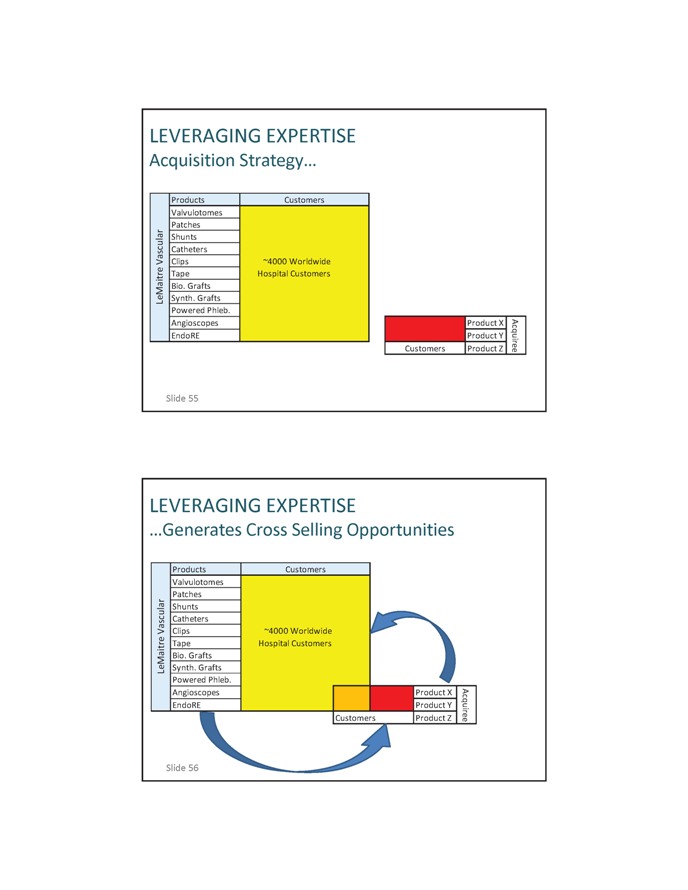
LEVERAGING EXPERTISE Acquisition Strateg Slide 55 LEVERAGING EXPERTISE Generates Cross Selling Opportunities Slide 56
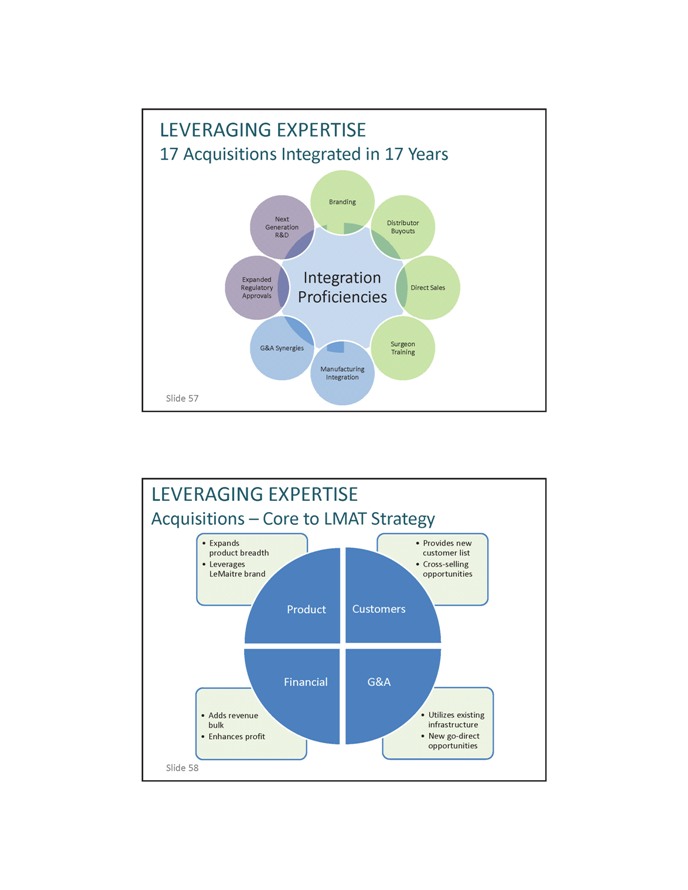
LEVERAGING EXPERTISE 17 Acquisitions Integrated in 17 Years LEVERAGING EXPERTISE Acquisitions – Core to LMAT Strategy
David Roberts President Q&A until 11:05am ET Slide 59 JJ Pellegrino Chief Financial Officer Joined LeMaitre in 2005 Chief Financial Officer since 2007 B.A. in Economics, Harvard College and M.B.A. from Harvard Business School At LeMaitre: – Manages Finance, IT and HR functions worldwide – Has overseen over $15mm in cost-cutting initiatives Slide 60
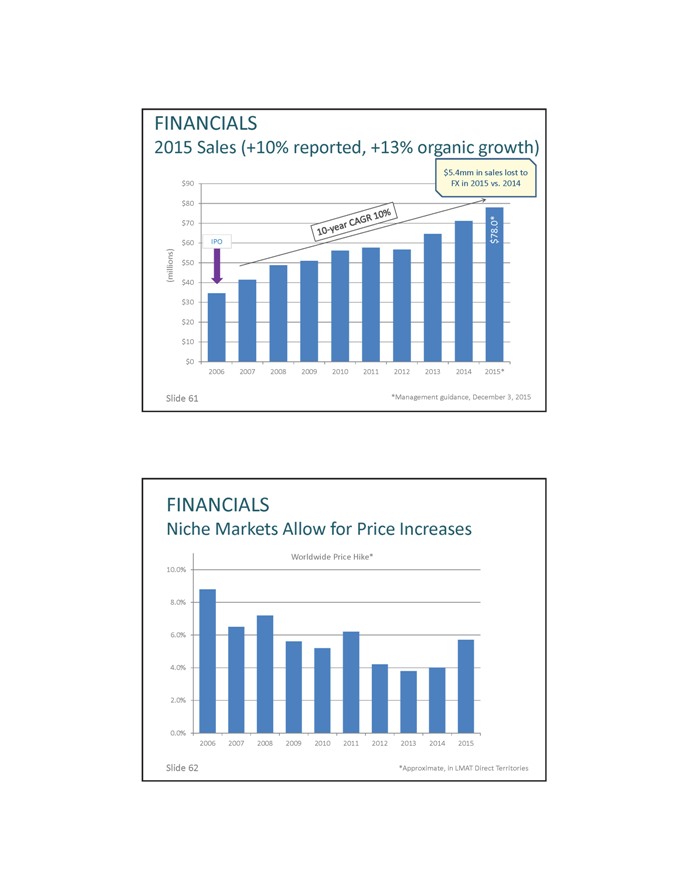
FINANCIALS 2015 Sales (+10% reported, +13% organic growth) Slide 61 *Management guidance, December 3, 2015 FINANCIALS Niche Markets Allow for Price Increases Worldwide Price Hike* Slide 62 *Approximate, in LMAT Direct Territories
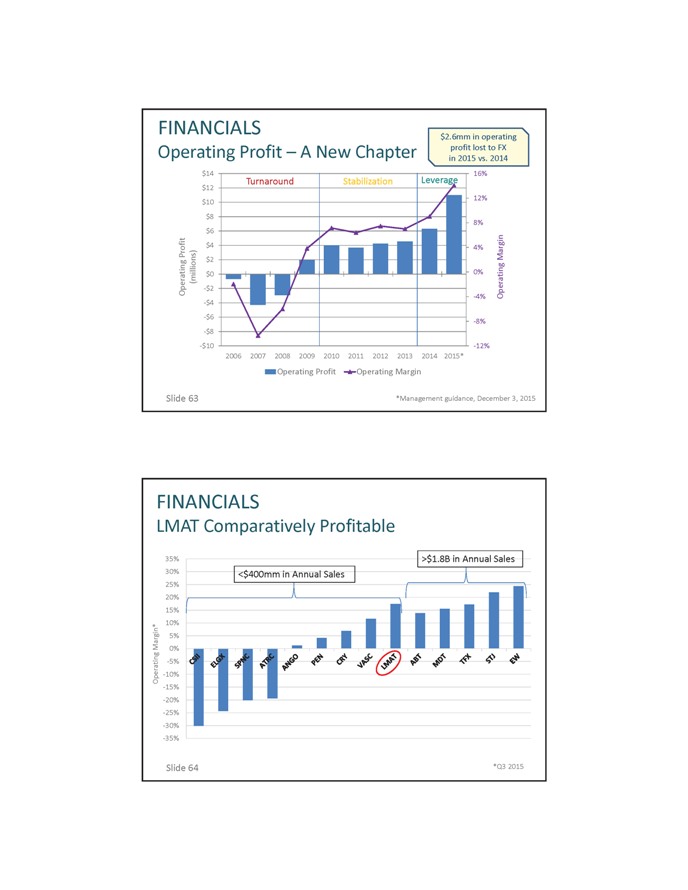
FINANCIALS Operating Profit – A New Chapter Slide 63 *Management guidance, December 3, 2015 FINANCIALS LMAT Comparatively Profitable Slide 64 *Q3 2015
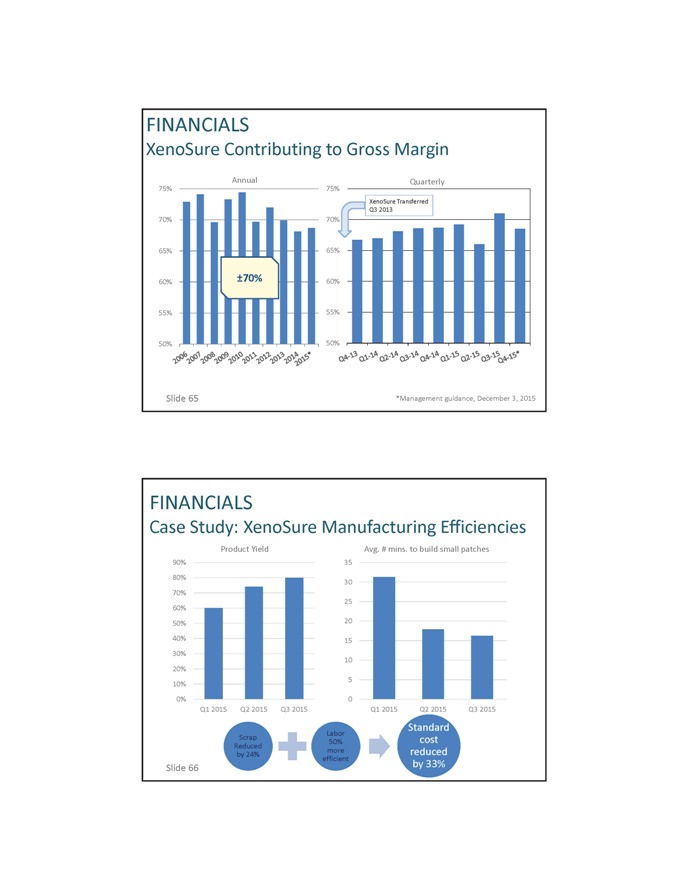
FINANCIALS XenoSure Contributing to Gross Margin Slide 65 *Management guidance, December 3, 2015 FINANCIALS Case Study: XenoSure Manufacturing Efficiencies
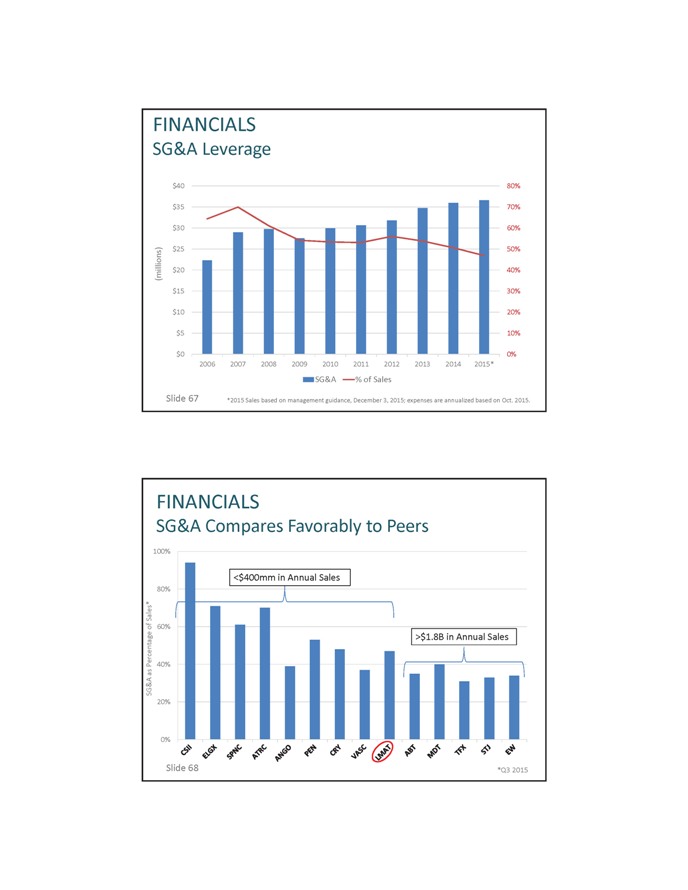
FINANCIALS SG&A Leverage Slide 67 *2015 Sales based on management guidance, December 3, 2015; expenses are annualized based on Oct. 2015. FINANCIALS SG&A Compares Favorably to Peers Slide 68 *Q3 2015
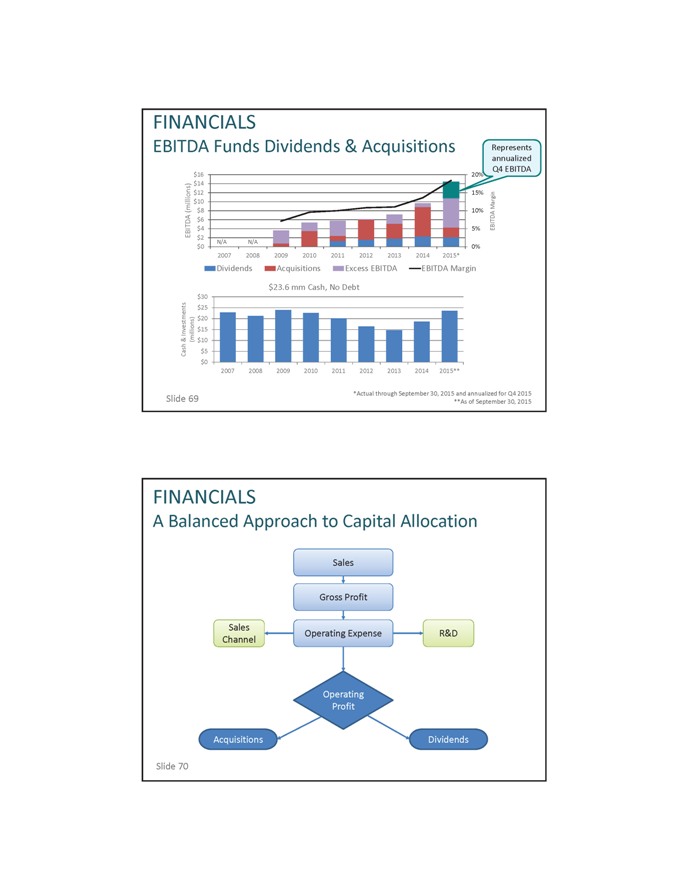
FINANCIALS EBITDA Funds Dividends & Acquisitions Slide 69 *Actual through September 30, 2015 and annualized for Q4 2015 **As of September 30, 2015 FINANCIALS A Balanced Approach to Capital Allocation Sales Gross Profit Sales Operating Expense R&D Channel Operating Profit Acquisitions Dividends Slide 70
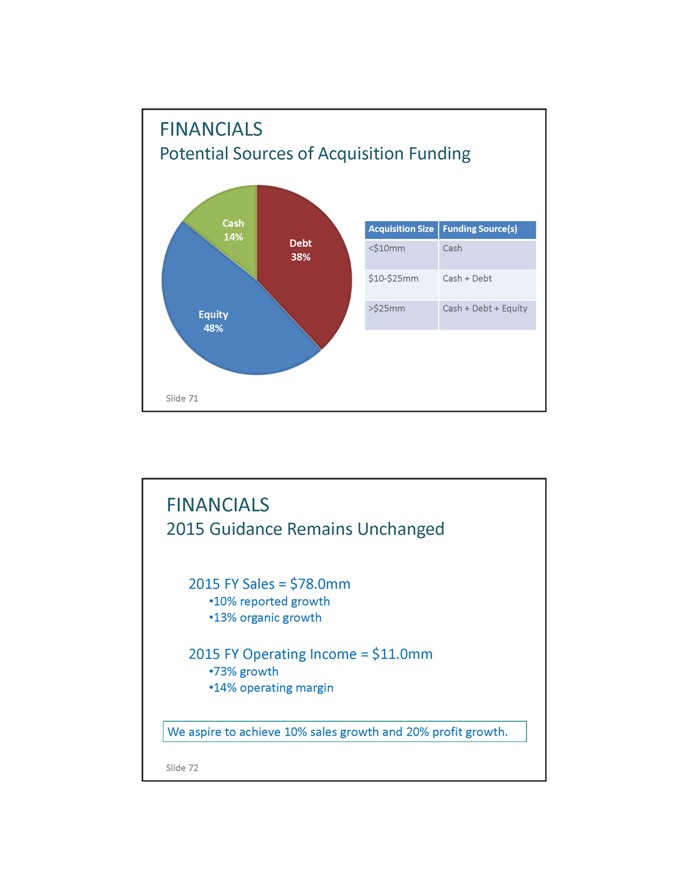
FINANCIALS Potential Sources of Acquisition Funding Acquisition Size Funding Source(s) <$10mm Cash $10?$25mm Cash + Debt >$25mm Cash + Debt + Equity Slide 71 FINANCIALS 2015 Guidance Remains Unchanged 2015 FY Sales = $78.0mm 10% reported growth 13% organic growth 2015 FY Operating Income = $11.0mm 73% growth 14% operating margin We aspire to achieve 10% sales growth and 20% profit growth. Slide 72
JJ Pellegrino Chief Financial Officer Q&A until 11:25am ET Slide 73 Alan Dardik, MD/PhD, FACS, FAHA Surgeon Chief, Vascular Service VA Connecticut Healthcare Systems Scientist Principal Investigator, Dardik Laboratory Yale University Professor Professor of Surgery Yale University Slide 74
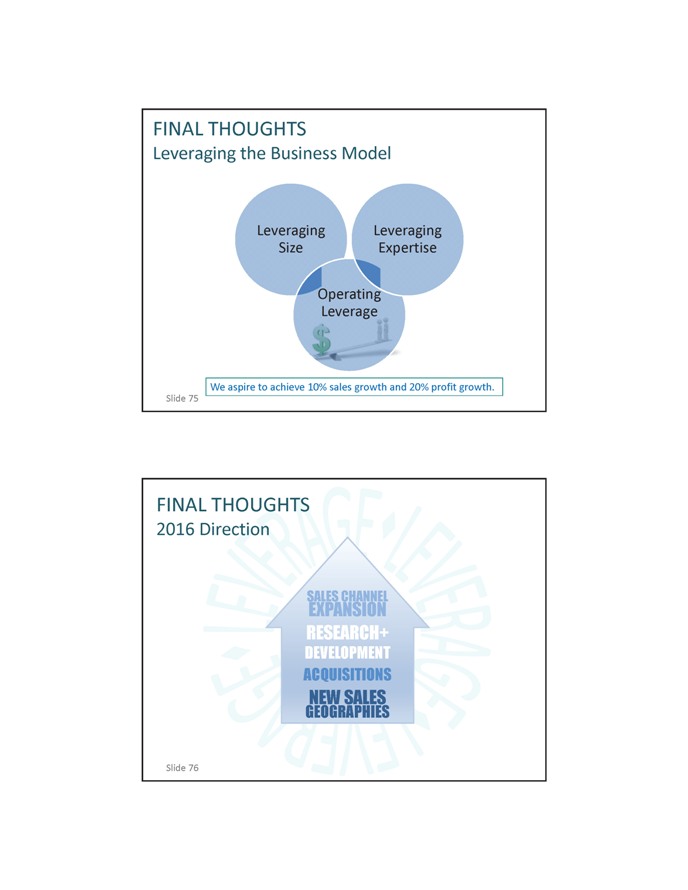
FINAL THOUGHTS Leveraging the Business Model We aspire to achieve 10% sales growth and 20% profit growth. Slide 75 FINAL THOUGHTS 2016 Direction
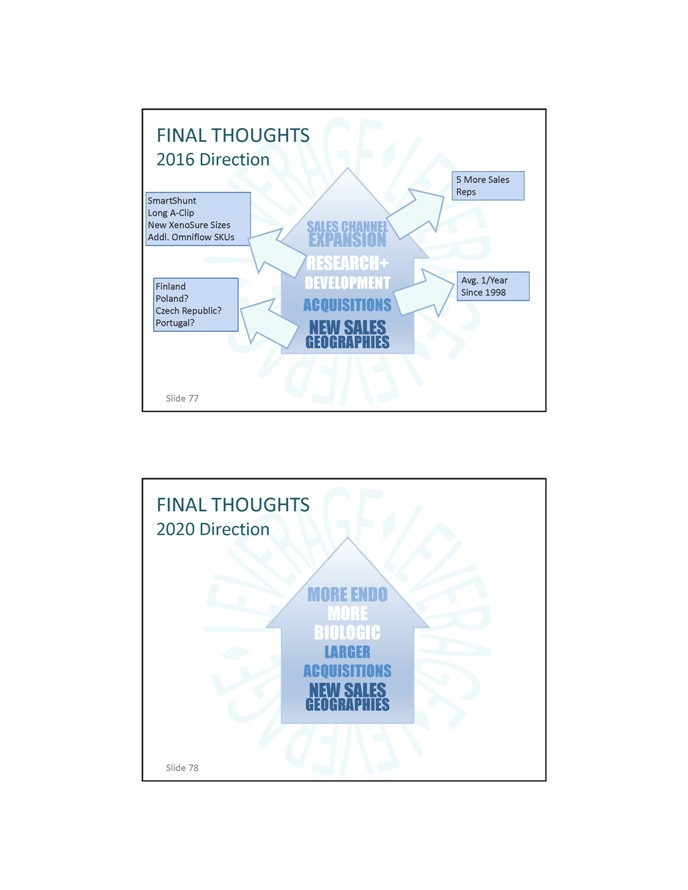
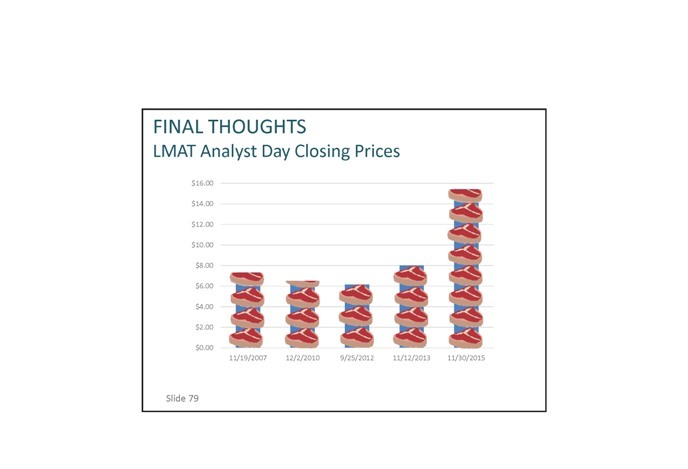
FINAL THOUGHTS 2016 Direction SmartShunt Long A?Clip New XenoSure Sizes Addl. OmniflowSKUs Finland Poland? Czech Republic? Portugal? 5 More Sales Reps Avg. 1/Year Since 1998 Slide 77 FINAL THOUGHTS 2020 Direction Slide 78
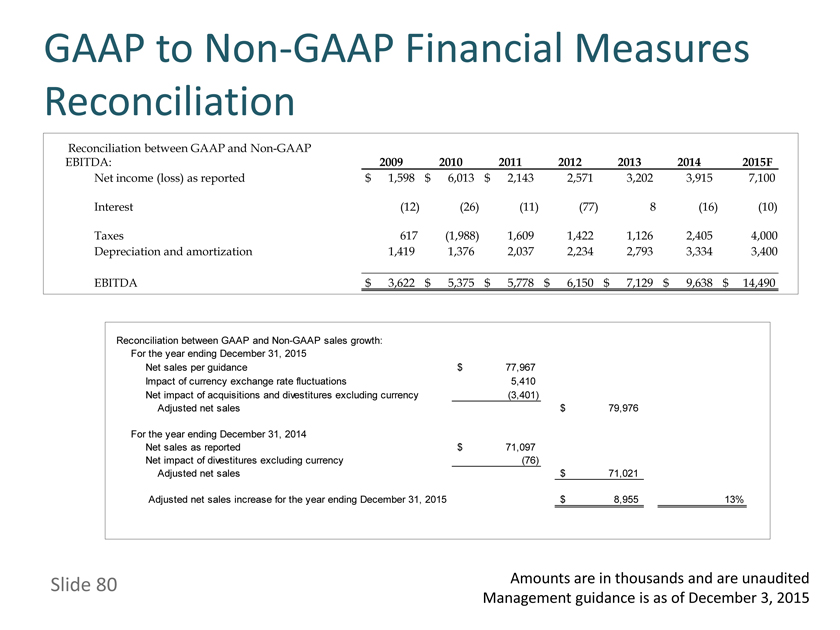
FINAL THOUGHTS LMAT Analyst Day Closing Prices Slide 79
| ||
GAAP to Non-GAAP Financial Measures Reconciliation
Reconciliation between GAAP and Non-GAAP
EBITDA: 2009 2010 2011 2012 2013
2014 2015F
Net income (loss) as reported $ 1,598 $ 6,013 $ 2,143 2,571 3,202 3,915 7,100
Interest (12) (26) (11) (77) 8 (16) (10)
Taxes 617 (1,988) 1,609 1,422 1,126 2,405 4,000
Depreciation and amortization 1,419 1,376 2,037 2,234 2,793 3,334 3,400
EBITDA $ 3,622 $ 5,375 $ 5,778 $ 6,150 $ 7,129 $ 9,638 $ 14,490
Reconciliation between GAAP and Non-GAAP sales growth:
For the year ending
December 31, 2015
Net sales per guidance $ 77,967
Impact of currency exchange
rate fluctuations 5,410
Net impact of acquisitions and divestitures excluding currency (3,401)
Adjusted net sales $ 79,976
For the year ending December 31, 2014
Net sales as reported $ 71,097
Net impact of divestitures excluding currency (76)
Adjusted net sales $ 71,021
Adjusted net sales increase for the year ending December 31, 2015
$ 8,955 13%
Slide 80
Amounts are in thousands and are unaudited
Management guidance is as of December 3, 2015
|
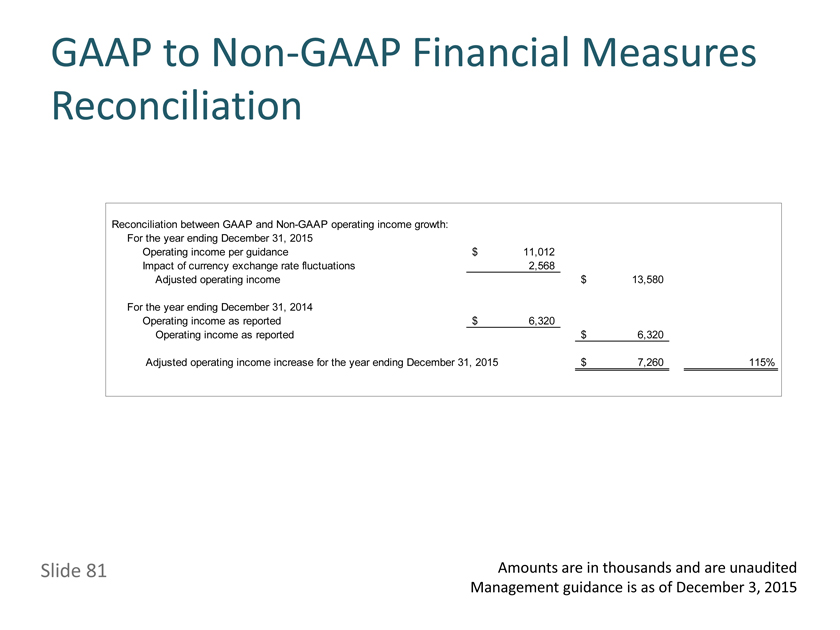
GAAP to Non-GAAP Financial Measures Reconciliation
Reconciliation between GAAP and Non-GAAP operating income growth:
For the
year ending December 31, 2015
Operating income per guidance $ 11,012
Impact
of currency exchange rate fluctuations 2,568
Adjusted operating income $ 13,580
For the year ending December 31, 2014
Operating income as reported $ 6,320
Operating income as reported $ 6,320
Adjusted operating income increase for
the year ending December 31, 2015 $ 7,260 115%
Slide 81
Amounts are in
thousands and are unaudited
Management guidance is as of December 3, 2015