Attached files
| file | filename |
|---|---|
| 8-K - FORM 8-K - Macquarie Leasing Pty Ltd | d77664d8k.htm |
Exhibit 99.1


ANZ ANNUAL REPORT 2015
|
WHO WE ARE AND HOW WE OPERATE
ANZ’s history of expansion and growth stretches over 180 years. We have a strong franchise in Retail, Commercial and Institutional banking in our home markets of Australia and New Zealand and we have been operating in Asia Pacific for more than 30 years.
Today, ANZ operates in 34 countries globally. We are the fourth largest bank in Australia, the largest banking group in New Zealand and the Pacific, and among the top 20 banks in the world.
|
| 1 | Asia Pacific, Europe and America (APEA) network revenue includes income generated in Australia and New Zealand as a result of referral from ANZ’s APEA network. |
ANNUAL REPORT 2015 1

ANZ ANNUAL REPORT 2015
FINANCIAL HIGHLIGHTS
| 2015 | 2014 | |||||||
| Profitability |
||||||||
| Profit attributable to shareholders of the Company ($m) |
7,493 | 7,271 | ||||||
| Cash profit ($m)1 |
7,216 | 7,117 | ||||||
| Return on: |
||||||||
| Average ordinary shareholders’ equity2 |
14.5% | 15.8% | ||||||
| Average ordinary shareholders’ equity (cash basis)1,2 |
14.0% | 15.4% | ||||||
| Average assets |
0.88% | 0.97% | ||||||
| Net interest margin |
2.04% | 2.13% | ||||||
| Cash profit per average FTE ($)1 |
141,621 | 142,064 | ||||||
| Efficiency |
||||||||
| Operating expenses to operating income |
44.4% | 43.7% | ||||||
| Operating expenses to average assets |
1.10% | 1.17% | ||||||
| Operating expenses to operating income (cash basis)1 |
45.6% | 44.7% | ||||||
| Operating expenses to average assets (cash basis)1 |
1.10% | 1.17% | ||||||
| Balance Sheet |
||||||||
| Gross loans and advances ($b)3 |
574.3 | 525.7 | ||||||
| Customer deposits ($b) |
444.6 | 403.7 | ||||||
| Total equity ($b) |
57.4 | 49.3 | ||||||
| Gross impaired assets ($b) |
2.7 | 2.9 | ||||||
| Capital and Liquidity |
||||||||
| Common Equity Tier 1 – APRA Basel 3 |
9.6% | 8.8% | ||||||
| Common Equity Tier 1 – Internationally Comparable Basel 34 |
13.2% | 12.5% | ||||||
| Liquidity Coverage Ratio |
122% | 111% | ||||||
| Credit impairment provisioning |
||||||||
| Individual credit impairment charge ($m) |
1,084 | 1,141 | ||||||
| Collective credit impairment charge/(release) ($m) |
95 | (155) | ||||||
| Total credit impairment charge ($m) |
1,179 | 986 | ||||||
| Individual credit impairment charge as a % of average gross loans and advances |
0.19% | 0.22% | ||||||
| Total credit impairment charge as a % of average gross loans and advances |
0.21% | 0.19% | ||||||
| Ordinary share dividends |
||||||||
| Interim – 100% franked (cents) |
86 | 83 | ||||||
| Final – 100% franked (cents) |
95 | 95 | ||||||
| Total dividend (cents) |
181 | 178 | ||||||
| Ordinary share dividend payout ratio5 |
68.6% | 67.4% | ||||||
| Cash ordinary share dividend payout ratio1,5 |
71.2% | 68.9% | ||||||
| Preference share dividend ($m) |
||||||||
| Dividend paid6 |
1 | 6 | ||||||
| 1 | Statutory profit has been adjusted to exclude non-core items to arrive at cash profit, and has been provided to assist readers to understand the results for the ongoing business activities of the Group. The adjustments made in arriving at cash profit are included in statutory profit which is subject to audit within the context of the Group statutory audit opinion. Cash profit is not audited by the external auditor, however the external auditor has informed the Audit Committee that the adjustments have been determined on a consistent basis across each year. Refer to page 18 and pages 184 to 185 for analysis of the adjustments between statutory profit and cash profit. |
| 2 | Average ordinary shareholders’ equity excludes non-controlling interests and preference shares. |
| 3 | Loans and advances as at 30 September 2015 include assets classified as held for sale. |
| 4 | ANZ’s interpretation of the regulations documented in the Basel Committee publications; “Basel 3: A global regulatory framework for more resilient banks and banking systems” (June 2011) and “International Convergence of Capital Measurement and Capital Standards” (June 2006). Also includes differences identified in APRA’s information paper entitled International Capital Comparison Study (13 July 2015). |
| 5 | Dividend payout ratio is calculated using the proposed 2015 final, 2015 interim, 2014 final and 2014 interim dividends. |
| 6 | Represents dividends paid on Euro Trust Securities (preference shares) issued on 13 December 2004. The Euro Trust Securities were bought back by ANZ for cash at face value and cancelled on 15 December 2014. |
FINANCIAL HIGHLIGHTS 5
CHAIRMAN’S REPORT
A MESSAGE FROM DAVID GONSKI, AC
I am pleased to report that ANZ’s statutory profit after tax for the 2015 financial year was $7.5 billion, up 3%. The cash profit (which excludes non-core items from the statutory profit) was $7.2 billion, up 1%.

| 6 |
ANZ ANNUAL REPORT 2015
CHIEF EXECUTIVE OFFICER’S REPORT
A MESSAGE FROM MICHAEL SMITH, OBE
ANZ produced another record result in 2015. In a constrained environment, we continued to see growth in our customer franchises in Australia, in New Zealand and in key Asian markets.

| CHAIRMAN’S REPORT AND CHIEF EXECUTIVE OFFICER’S REPORT 7 |
DIRECTORS’ REPORT
The directors present their report together with the financial statements of the consolidated entity (the Group), being Australia and New Zealand Banking Group Limited (the Company) and its controlled entities, for the year ended 30 September 2015 and the independent auditor’s report thereon. The information is provided in conformity with the Corporations Act 2001.
| 8 |
ANZ ANNUAL REPORT 2015
Directors’ Qualifications, Experience and Special Responsibilities
At the date of this report, the Board comprises seven Non-Executive Directors and one Executive Director, the Chief Executive Officer. The names of the Directors, together with details of their qualifications, experience and special responsibilities are set out below.
MR D M GONSKI, AC, Chairman, Independent Non-Executive Director and Chair of the Governance Committee
| DIRECTORS’ REPORT 9 |
DIRECTORS’ REPORT (continued)
MR M R P SMITH, OBE, Chief Executive Officer and Executive Director
MS I R ATLAS Independent Non-Executive Director
MS P J DWYER Independent Non-Executive Director and Chair of the Audit Committee
| 10 |
ANZ ANNUAL REPORT 2015
MR LEE HSIEN YANG Independent Non-Executive Director and Chair of the Technology Committee
MR G R LIEBELT Independent Non-Executive Director and Chair of the Human Resources Committee
MR I J MACFARLANE, AC, Independent Non-Executive Director and Chair of the Risk Committee
| DIRECTORS’ REPORT 11 |
DIRECTORS’ REPORT (continued)
MR J T MACFARLANE Independent Non-Executive Director
Directors’ attendance at Board and Committee meetings
Details of the number of Board and Board Committee meetings held during the year and Directors’ attendance at those meetings are set out below.
| Board | Risk Committee |
Audit Committee |
Human Resources Committee |
Governance Committee |
Technology Committee1 |
Executive Committee |
Committee of the Board2 |
Shares Committee2 | ||||||||||||||||||||||||||||
|
A
|
B | A | B | A | B | A | B | A | B | A | B | A | B | A | B | A | B | |||||||||||||||||||
|
I R Atlas3 |
11 | 11 | 4 | 4 | 4 | 4 | 3 | 3 | 1 | 1 | ||||||||||||||||||||||||||
|
P J Dwyer |
11 | 11 | 8 | 8 | 6 | 6 | 6 | 6 | 4 | 4 | 1 | 1 | ||||||||||||||||||||||||
|
D M Gonski |
11 | 11 | 8 | 8 | 6 | 5 | 6 | 6 | 4 | 4 | 1 | 1 | 8 | 8 | 2 | 2 | ||||||||||||||||||||
|
Lee Hsien Yang |
11 | 11 | 8 | 8 | 6 | 6 | 1 | 1 | 1 | 1 | ||||||||||||||||||||||||||
|
G R Liebelt |
11 | 11 | 8 | 8 | 6 | 6 | 4 | 4 | 1 | 1 | 1 | 1 | ||||||||||||||||||||||||
|
I J Macfarlane |
11 | 11 | 8 | 8 | 6 | 6 | 4 | 4 | 1 | 1 | ||||||||||||||||||||||||||
|
J T Macfarlane |
11 | 11 | 8 | 8 | 6 | 6 | 1 | 1 | 1 | 1 | ||||||||||||||||||||||||||
|
M R P Smith |
11
|
11
|
8
|
8
|
1
|
1
| ||||||||||||||||||||||||||||||
Column A – Indicates the number of meetings the Director was eligible to attend.
Column B – Indicates the number of meetings attended. The Chairman is an ex-officio member of the Audit, Governance, Human Resources, Risk and Technology Committees.
With respect to Committee meetings, the table above records attendance of Committee members. Any Director is entitled to attend these meetings and from time to time Directors attend meetings of Committees of which they are not a member.
| 1 | During 2014/15, a root and branch review of the Technology Committee was undertaken with respect to its role, objectives and performance. The Committee did not meet while the review was underway. |
| 2 | The meetings of the Shares Committee and Committee of the Board as referred to in the table above include those conducted by written resolution. |
| 3 | Ms I R Atlas was appointed to the Board on 24 September 2014 and was a member of the Audit Committee, Human Resources Committee and Governance Committee from 1 January 2015. |
Corporate Governance Statement
ANZ is committed to maintaining high standards of Corporate Governance. ANZ confirms it has followed the ASX Corporate Governance Council’s Corporate Governance Principles and Recommendations (3rd edition) during the 2015 financial year. ANZ’s Corporate Governance Statement, together with the ASX Appendix 4G which relates to the Corporate Governance Statement, can be viewed at: http://shareholder.anz.com/our-company/corporate-governance, and has been lodged with the ASX.
12
ANZ ANNUAL REPORT 2015
| DIRECTORS’ REPORT 13 |
DIRECTORS’ REPORT (continued)


| 14 |
ANZ ANNUAL REPORT 2015
DIRECTORS’ REPORT (continued)
OPERATING AND FINANCIAL REVIEW
DIRECTORS’ REPORT 15
DIRECTORS’ REPORT (continued)
THE GROUP’S STRATEGIC PRIORITIES AND OUTLOOK1
| 1 | Statutory profit has been adjusted to exclude non-core items to arrive at cash profit, and has been provided to assist readers to understand the results for the ongoing business activities of the Group. The adjustments made in arriving at cash profit are included in statutory profit which is subject to audit within the context of the Group statutory audit opinion. Cash profit is not audited by the external auditor, however the external auditor has informed the Audit Committee that the adjustments have been determined on a consistent basis across each year. Refer to page 18 and pages 184 to 185 for analysis of the adjustments between statutory profit and cash profit. The Operating and Financial Review is reported on a cash basis unless otherwise noted. |
16
ANZ ANNUAL REPORT 2015
DIRECTORS’ REPORT 17
DIRECTORS’ REPORT (continued)
Results of the operations of the Group
| 2015 | 2014 | |||||||||||
| Income Statement | $m | $m | Movt | |||||||||
| Net interest income |
14,616 | 13,810 | 6% | |||||||||
| Other operating income |
6,455 | 6,244 | 3% | |||||||||
| Operating income |
21,071 | 20,054 | 5% | |||||||||
| Operating expenses |
(9,359 | ) | (8,760 | ) | 7% | |||||||
| Profit before credit impairment and income tax |
11,712 | 11,294 | 4% | |||||||||
| Credit impairment charge |
(1,179 | ) | (986 | ) | 20% | |||||||
| Profit before income tax |
10,533 | 10,308 | 2% | |||||||||
| Income tax expense and non-controlling interests |
(3,040 | ) | (3,037 | ) | 0% | |||||||
| Profit attributable to shareholders of the Company |
7,493 | 7,271 | 3% | |||||||||
Non-IFRS information
The Group provides an additional measure of performance which is prepared on a basis other than in accordance with the accounting standards – cash profit. The guidance provided in ASIC Regulatory Guide 230 has been followed when presenting this information.
Cash Profit
Statutory profit has been adjusted to exclude non-core items to arrive at cash profit, and has been provided to assist readers to understand the results for the ongoing business activities of the Group. The adjustments made in arriving at cash profit are included in statutory profit which is subject to audit within the context of the Group statutory audit opinion. Cash profit is not subject to audit by the external auditor, however the external auditor has informed the Audit Committee that the adjustments have been determined on a consistent basis across each year.
| 2015 | 2014 | |||||||||||
| $m | $m | Movt | ||||||||||
| Statutory profit attributable to shareholders of the Company |
7,493 | 7,271 | 3% | |||||||||
| Adjustments between statutory profit and cash profit |
(277 | ) | (154 | ) | 80% | |||||||
| Cash profit |
7,216 | 7,117 | 1% | |||||||||
| Adjustments between statutory profit and cash profit ($m) | 2015 | 2014 | Movt | |||||||||
| Treasury shares adjustment |
(16 | ) | 24 | large | ||||||||
| Revaluation of policy liabilities |
(73 | ) | (26 | ) | large | |||||||
| Economic hedging |
(179 | ) | (72 | ) | large | |||||||
| Revenue and net investment hedges |
(3 | ) | (101 | ) | -97% | |||||||
| Structured credit intermediation trades |
(6 | ) | 21 | large | ||||||||
| Total adjustments between statutory profit and cash profit |
(277 | ) | (154 | ) | 80% | |||||||
Refer pages 184 to 185 for analysis of the adjustments between statutory profit and cash profit.
| Non-financial key performance metrics1 | 2015 | 2014 | ||||||
| Employee engagement |
76% | 73% | ||||||
| Customer satisfaction |
||||||||
| – Australia (retail customer satisfaction)2 |
82.1% | 82.6% | ||||||
| – New Zealand (retail customer satisfaction)3 |
89.0% | 85.0% | ||||||
| IIB (Institutional Relationship strength index ranking)4 |
||||||||
| – APEA |
1 | 1 | ||||||
| – New Zealand |
1 | 1 | ||||||
| Women in management5 |
40.4% | 39.2% | ||||||
| 1 | The Group uses a number of non-financial measures to assess performance. These metrics form part of the balanced scorecard used to measure performance in relation to the Group’s main incentive programs. Discussion of the non-financial performance metrics is included within the Remuneration report on pages 43 to 44 of this Directors’ report. |
| 2 | Source: Roy Morgan Research. Base: ANZ Main Financial Institution Customers, aged 14+, based on six months to September for each year. |
| 3 | Camorra Research Retail Market Monitor (2015). The Nielson Company Consumer Finance Monitor (2012) excludes National Bank brand. Base: ANZ main bank customers aged 15+, rolling 6 months moving average to September. Based on responses of excellent, very good and good. |
| 4 | Source: Peter Lee Associates Large Corporate and Institutional Relationship Banking surveys, Australia and New Zealand 2015. |
| 5 | Includes all employees regardless of leave status but not contractors (which are included in FTE). |
18
ANZ ANNUAL REPORT 2015
The following analysis of the business performance is on a cash basis.
| 2015 | 2014 | |||||||||||
| Income Statement | $m | $m | Movt | |||||||||
| Net interest income |
14,616 | 13,797 | 6% | |||||||||
| Other operating income |
5,902 | 5,781 | 2% | |||||||||
| Operating income |
20,518 | 19,578 | 5% | |||||||||
| Operating expenses |
(9,359 | ) | (8,760 | ) | 7% | |||||||
| Profit before credit impairment and income tax |
11,159 | 10,818 | 3% | |||||||||
| Credit impairment charge |
(1,205 | ) | (989 | ) | 22% | |||||||
| Profit before income tax |
9,954 | 9,829 | 1% | |||||||||
| Income tax expense and non-controlling interests |
(2,738 | ) | (2,712 | ) | 1% | |||||||
| Cash profit |
7,216 | 7,117 | 1% | |||||||||
| Financial performance metrics | 2015 | 2014 | Movt | |||||||||
| Return on average ordinary shareholders’ equity1 |
14.0% | 15.4% | -140 bps | |||||||||
| Return on average assets |
0.85% | 0.95% | -10 bps | |||||||||
| Net Interest Income | 2015 | 2014 | Movt | |||||||||
| Net interest income ($m) |
14,616 | 13,797 | 6% | |||||||||
| Net interest margin (%) |
2.04% | 2.13% | -9 bps | |||||||||
| Average interest earnings assets ($m) |
718,147 | 646,997 | 11% | |||||||||
| Average deposits and other borrowings |
559,779 | 507,856 | 10% | |||||||||
| 1 | Average ordinary shareholders’ equity excludes non-controlling interests and preference shares. |
Net interest income increased $819 million (6%) with 11% growth in average interest earning assets, partly offset by a 9 basis point decrease in net interest margin. $276 million (2%) of the increase in net interest income was due to foreign currency translation. The $71.2 billion increase in average interest earning assets was due to foreign currency translation of $20.9 billion, loan growth of $26.7 billion in home loans and commercial lending, and $24.7 billion growth in Global Markets driven by the Group liquidity portfolio and cash reserves. The decrease in net interest margin was due to asset competition, lower earnings on capital and higher liquid asset holdings, partly offset by favourable deposit pricing.
Average interest earning assets (+$71.2 billion or +11%)
| } | International and Institutional Banking (+$44.5 billion or +17%): excluding foreign currency translation, growth was $25.1 billion or +9%. $24.7 billion of this increase was in Global Markets driven by a $17.0 billion increase in the Group liquidity portfolio in response to regulatory requirements, a $3.8 billion increase in reverse repos and a $2.2 billion increase in collateral paid against derivative liabilities. Lending in Global Loans increased by $4.2 billion. Global Trade volumes contracted by $4.6 billion due to the impact of lower commodity prices. |
| } | Australia (+$19.9 billion or +7%): driven by growth in home loans where market share continued to increase. |
| } | New Zealand (+$6.3 billion or +7%): excluding foreign currency translation, growth was $5.1 billion or +6% driven by market share gains in Retail, as well as Commercial loan growth. |
| } | Global Wealth and Group Centre (+$0.5 billion or 4%): broadly unchanged over the year. |
Average deposits and other borrowings (+$51.9 billion or +10%)
| } | International and Institutional Banking (+$25.6 billion or +12%): excluding foreign currency translation, deposits and other borrowings increased $5.7 billion or +2% driven by $6.7 billion growth in customer deposits in Transaction Banking, particularly in Asia, partially offset by a reduction of $1.8 billion in certificates of deposits. |
| } | Australia (+$7.3 billion or +5%): driven by growth in customer deposits within Retail and Commercial. |
| } | New Zealand (+$7.3 billion or +13%): excluding foreign currency translation, growth was $6.5 billion or +12% due to increased customer deposits across Retail and Commercial, particularly in Retail savings products. |
| } | Global Wealth and Group Centre (+$11.7 billion or 16%): growth mainly in Treasury repo borrowings. |
DIRECTORS’ REPORT 19
DIRECTORS’ REPORT (continued)
| Other Operating Income |
2015 $m |
20141 $m |
Movt | |||||||||
| Fee and commission income2 |
2,448 | 2,364 | 4% | |||||||||
| Foreign exchange earnings2 |
79 | 96 | -18% | |||||||||
| Net income from funds management and insurance |
1,425 | 1,283 | 11% | |||||||||
| Share of associates’ profit2 |
625 | 510 | 23% | |||||||||
| Global Markets other operating income |
1,185 | 1,285 | -8% | |||||||||
| Other2,3 |
140 | 243 | -42% | |||||||||
| Cash other operating income |
5,902 | 5,781 | 2% | |||||||||
| 1 | Comparative amounts have changed. Refer to note 45 for details. |
| 2 | Excluding Global Markets. |
| 3 | Other income includes a $125 million gain on sale of ANZ Trustees in July 2014 and a $21 million loss arising on sale of Saigon Securities Inc (SSI) in September 2014. |
Other operating income increased $121 million (2%) with $212 million (4%) due to foreign currency translation. Adjusting for this, other operating income decreased by $91 million (- 2%). The decrease was due to a reduction in Global Markets’ other operating income of $218 million and the one-off $125m gain on sale of Trustees in second half 2014, partially offset by a $124 million increase in net funds management and insurance income, a $64m increase in share of associates’ profit and $42m increased fee income in IIB from volume growth.
| } | Fee income increased by $84 million (4%) with $65 million positive impact due to foreign currency translation, increased fee income of $42 million in IIB from Retail Asia Pacific and Transaction Banking volume growth, partially offset by the divestment of the ANZ Trustees business in July 2014. |
| } | Net foreign exchange income decreased by $17 million. Adjusting for $12 million positive impact of foreign currency translation, the $29 million decrease was largely as a result of higher realised losses on foreign currency hedges ($61 million), these offset translation gains elsewhere in the Group, and higher unrealised gains on foreign currency balances held in IIB ($19 million). |
| } | Net income from funds management and insurance increased $142 million with $18 million positive impact of foreign currency translation, and $107 million increase in Global Wealth income due to increased funds under management and in-force premiums, as well as growth in insurance income due to improved lapse experience and a large one-off loss in 2014 due to the exit of a Group life insurance plan. |
| } | Share of associates’ profit increased by $115 million with foreign currency translation driving an increase of $51 million and the remaining increase due to: |
| – | Shanghai Rural Commercial Bank increased $53 million due to lending growth and the impairment of an investment held by SRCB in 2014. |
| – | Bank of Tianjin increased $45 million due to asset growth. |
| – | AMMB Holdings Berhad decreased $22 million mainly due to net interest margin contraction from a change in lending mix, and the divestment of its insurance business in September 2014. |
| – | P.T. Bank Pan Indonesia decreased $13 million mainly due to lower earnings and a $10 million loan recovery in 2014. |
| } | Global Markets other operating income decreased by $100 million. Adjusting for the positive impact of foreign currency translation ($118 million), income decreased by $218 million mainly driven by widening credit spreads on balance sheet trading positions and Asian and European bond holdings. |
| } | Other income decreased by $103 million. Adjusting for a $39 million positive foreign currency translation, the decrease of $142 million was mainly due to the $125 million gain on sale of ANZ Trustees recognised in 2014. |
20
ANZ ANNUAL REPORT 2015
| Operating Expenses | 2015 $m |
2014 $m |
Movt | |||||||
| Personnel expenses |
5,479 | 5,088 | 8% | |||||||
| Premises expenses |
922 | 888 | 4% | |||||||
| Technology expenses |
1,462 | 1,266 | 15% | |||||||
| Restructuring expenses |
31 | 113 | -73% | |||||||
| Other expenses |
1,465 | 1,405 | 4% | |||||||
| Total cash operating expenses |
9,359 | 8,760 | 7% | |||||||
| Key performance metrics |
||||||||||
| Operating expenses to operating income |
45.6% | 44.7% | 90 bps | |||||||
| Full time equivalent staff (FTE)1 |
50,152 | 50,328 | 0% | |||||||
The Group’s operating expenses increased $599 million (7%) with $324 million (4%) due to foreign currency translation. Key factors included:
| } | Personnel expenses increased $391 million (8%), with $214 million (4%) due to foreign exchange translation and $177 million (3%) driven by annual salary increases and related costs. |
| } | Premises expenses increased $34 million (4%), with $29 million (3%) driven by foreign exchange translation and $5 million (1%) due to the impact of rent increases linked to CPI. |
| } | Technology expenses increased $196 million (15%), with $30 million (1%) due to foreign exchange translation and $166 million (13%) due to increased depreciation and amortisation on key infrastructure projects, higher data storage and software license costs and the increased use of outsourced and managed services. |
| } | Restructuring expenses decreased $82 million (-73%), with $2 million (2%) due to foreign exchange translation and $80 million (71%) from decreased restructuring costs across all Divisions. |
| } | Other expenses increased $60 million (4%), with $49 million (3%) due to foreign exchange translation and $11 million (1%) from higher spend related to compliance and regulatory remediation activities, partly offset by GST recoveries and the write-down of intangible assets in Global Wealth in 2014. |
| Credit impairment charge | 2015 $m |
2014 $m |
Movt | |||||||
| Individual credit impairment charge |
1,110 | 1,144 | -3% | |||||||
| Collective credit impairment charge/(release) |
95 | (155 | ) | large | ||||||
| Total credit impairment charge to income statement |
1,205 | 989 | 22% | |||||||
Total credit impairment charges increased $216 million (22%) due to a $250 million increase in collective credit impairment charges, offset by a $34 million (3%) decrease in individual impairment charges. The $95 million collective charge for the year reflects lending growth in Australia, credit downgrades of a few IIB customers, partially offset by associated economic cycle releases. This compares to a $155 million release in 2014 resulting from non-recurring provision releases and credit upgrades in IIB and New Zealand, and net decreases in the economic cycle overlay.
DIRECTORS’ REPORT 21
DIRECTORS’ REPORT (continued)
FINANCIAL POSITION OF THE GROUP
| Summary Balance Sheet | 2015 $b |
2014 $b |
Movt | |||||||||
| Assets |
||||||||||||
| Cash/Settlement balances owed to ANZ/Collateral paid |
82.5 | 58.3 | 42% | |||||||||
| Trading and available-for-sale assets |
92.7 | 80.6 | 15% | |||||||||
| Derivative financial instruments |
85.6 | 56.4 | 52% | |||||||||
| Net loans and advances |
570.2 | 521.8 | 9% | |||||||||
| Investments backing policy liabilities |
34.8 | 33.6 | 4% | |||||||||
| Other |
24.1 | 21.4 | 13% | |||||||||
| Total Assets |
889.9 | 772.1 | 15% | |||||||||
| Liabilities |
||||||||||||
| Settlement balances owed by ANZ/Collateral received |
19.1 | 15.7 | 22% | |||||||||
| Deposits and other borrowings |
570.8 | 510.1 | 12% | |||||||||
| Derivative financial instruments |
81.3 | 52.9 | 54% | |||||||||
| Debt issuances |
93.7 | 80.1 | 17% | |||||||||
| Policy liabilities/external unit holder liabilities |
38.7 | 37.7 | 3% | |||||||||
| Other |
28.9 | 26.3 | 10% | |||||||||
| Total Liabilities |
832.5 | 722.8 | 15% | |||||||||
| Total Equity |
57.4 | 49.3 | 16% | |||||||||
The Group’s balance sheet continued to strengthen during 2015 with stronger capital ratios, an increased liquidity portfolio, and lower gross impaired assets.
| } | Cash, settlement balances and collateral paid increased by $24 billion, with $7 billion due to foreign exchange translation. The remaining increase was primarily driven by increased short term deposits with the US Federal Reserve and Bank of England, following the introduction of Basel 3 liquidity risk standards in Australia on 1 January 2015, and higher collateral paid on derivative liabilities with collateralised counterparties. |
| } | Trading and available-for-sale assets increased $12 billion, with $5 billion due to foreign exchange translation. The increase was primarily driven by growth in the size of the Liquidity portfolio influenced by new liquidity requirements. |
| } | Derivative financial instruments increased on higher customer demand for interest rate hedging products in light of low interest rates, along with increased customer demand for foreign exchange spot and forward products driven by volatility in the Asia market. Net derivative financial instruments increased by $1 billion primarily driven by movements in foreign exchange and interest rates, along with the impact of foreign exchange translation. |
| } | Net loans and advances increased $48 billion, with $19 billion due to foreign exchange rate translation, $26 billion growth in Australia division on home loan and non-housing term loans, a $7 billion increase in New Zealand home loans and non-housing term loans and a $3 billion decrease driven by Global Transaction Banking. |
| } | Deposits and other borrowings increased $60 billion, with $32 billion due to foreign exchange rate translation impacts, $31 billion increase in interest bearing deposits, $17 billion growth in Group Treasury certificates of deposit and commercial paper, and a $17 billion decrease in term deposits composed of $10 billion decrease in IIB and $8 billion decrease in Australia division partially offset by $1 billion increase in New Zealand. |
| } | Total equity increased $8 billion primarily due to $7.5 billion of profits generated over the year, $3 billion from an institutional placement and retail share purchase plan, and other comprehensive income of $2 billion, offset by the payment (net of reinvestment) of the 2014 final and 2015 interim dividends of $4 billion. |
| Credit Provisioning | 2015 | 2014 | Movt | |||||||||
| Gross impaired assets ($m) |
2,719 | 2,889 | -6% | |||||||||
| Credit risk weighted assets ($b) |
349.8 | 308.9 | 13% | |||||||||
| Total provision for credit impairment ($m) |
4,017 | 3,933 | 2% | |||||||||
| Individual provision as % of gross impaired assets |
39.0% | 40.7% | 170 bps | |||||||||
| Collective provision as % of credit risk weighted assets |
0.85% | 0.89% | 4 bps | |||||||||
Gross impaired assets decreased $170 million (6%) primarily driven by the continued workout of the impaired asset portfolio. The Group has an individual provision coverage ratio on impaired assets of 39.0% at 30 September 2015, down from 40.7% at September 2014.
22
ANZ ANNUAL REPORT 2015
The collective provision as a percentage of credit risk-weighted assets was 0.85% as at 30 September 2015, down from 89 bps from 30 September 2014, continuing to provide sound credit provision coverage.
| Liquidity and Funding | 2015 | 2014 | Movt | |||||||||
| Total liquid assets ($b) |
184.5 | 149.6 | 23% | |||||||||
| Liquidity Coverage Ratio (LCR) |
122% | 111% | 10% | |||||||||
The Group holds a portfolio of high quality unencumbered liquid assets in order to protect the Group’s liquidity position in a severely stressed environment, as well as to meet regulatory requirements. High quality liquid assets comprise three categories, with the definitions consistent with Basel 3 LCR:
| } | Highest-quality liquid assets (HQLA1): Cash, highest credit quality government, central bank or public sector securities eligible for repurchase with central banks to provide same-day liquidity. |
| } | High-quality liquid assets (HQLA2): High credit quality government, central bank or public sector securities, high quality corporate debt securities and high quality covered bonds eligible for repurchase with central banks to provide same-day liquidity. |
| } | Alternative liquid assets (ALA): Assets qualifying as collateral for the Committed Liquidity Facility (CLF) and eligible securities listed by the Reserve Bank of New Zealand (RBNZ). |
The Group monitors and manages the composition of liquid assets to ensure diversification by asset class, counterparty, currency and tenor. Minimum levels of liquid assets held are set annually based on a range of ANZ specific and general market liquidity stress scenarios such that potential cash flow obligations can be met over the short to medium term, and holdings are appropriate to existing and future business activities, regulatory requirements and in line with the approved risk appetite.
During the year customer funding increased by $40.7 billion (10%) and wholesale funding increased $38.1 billion (19%). Customer funding represents 60.6% of total funding. $18.8 billion of term wholesale debt (with a remaining term greater than one year as at 30 September 2015) was issued during the year ended 30 September 2015 (Sep 2014: $23.9 billion). The weighted average tenor of new term debt was 4.9 years (2014: 4.9 years).
| Capital Management | 2015 | 2014 | Movt | |||||||||
| Common Equity Tier 1 |
||||||||||||
| – APRA Basel 3 |
9.6% | 8.8% | 80 bps | |||||||||
| – Internationally Comparable Basel 3 |
13.2% | 12.5% | 70 bps | |||||||||
| Risk weighted assets ($b) (APRA Basel 3) |
401.9 | 361.5 | 40.4 | |||||||||
APRA, under the authority of the Banking Act 1959, sets minimum regulatory capital requirements for banks including what is acceptable as capital and provide methods of measuring the risks incurred by the Bank.
The Group’s Common Equity Tier 1 ratio increased 80 bps to 9.6% based upon the APRA Basel 3 standards, exceeding APRA’s minimum requirements, with cash earnings, and capital initiatives, outweighing dividends, incremental risk weighted assets and deductions.
Capital initiatives included $3.2 billion of capital raised via an institutional share placement and retail share purchase plan in response to higher capital requirements for Australian residential mortgages by APRA from 1 July 2016.
Pillar 3 information
ANZ provides information required by APS 330: Public Disclosure in the Regulatory Disclosures section of its website: shareholder.anz.com/pages/regulatory-disclosure.
This information includes disclosures detailed in the following sections of the Standard:
Attachment A: Capital disclosure template
Attachment B: Main features of capital instruments
Attachment E: Leverage ratio disclosure requirements
Attachment F: Liquidity Coverage Ratio disclosure template
RESULTS OF MAJOR SEGMENTS OF THE GROUP
The Group operates on a divisional structure with Australia, IIB, New Zealand, and Global Wealth being the major operating divisions. The IIB and Global Wealth divisions are coordinated globally. Global Technology Services and Operations (GTSO) and Group Centre provide support to the operating divisions, including technology, operations, shared services, property, risk management, financial management, strategy, marketing, human resources and corporate affairs. The Group Centre also includes Group Treasury and Shareholder Functions.
During 2015 the Merchant Services and Commercial Credit Cards businesses were transferred out of the Cards and Payments business unit in Australia Retail and split between Australia C&CB and IIB based on customer ownership.
There have been no other significant structure changes, however certain prior period comparatives have been restated to align with current period presentation as a result of changes to customer segmentation and the continued realignment of support functions.
DIRECTORS’ REPORT 23
DIRECTORS’ REPORT (continued)
Australia
Australia Division’s strategy is focused on growing customers, products per customer and cross-sell between Divisions through improving the customer proposition in all parts of our business.
In 2015, Australia Division delivered a 7% increase in cash profit and accounted for 45% of the ANZ Group Cash profit. The cost to income ratio has improved from 36.8% to 36.4% while investment has continued in key growth areas such as increasing distribution sales capacity and capability, expanding our presence in NSW and building out key customer and industry segments in our Corporate and Commercial business (C&CB).
We continue to deliver innovative and digital solutions to enhance the customer experience and allow customers to have more control over their banking needs. Digital sales have increased 30% in the year. Customer acquisition has increased by 3%, 59% of Retail customers hold multiple products with us and C&CB cross-sell has increased 5%. Margins have been well managed with lending margin pressure from competition being largely offset from deposit repricing.
In Retail, Home loan sales are up 24% nationally and on track to deliver 6 consecutive years of above system growth1. Home loan sales in NSW have grown 63% in the year. Cards momentum continues with acquisitions up 29% and market share is 20%1. Individual impairment loss rates are at their lowest level in 8 years, with increases in collective impairment charges predominantly from lending growth.
C&CB continues to grow its business, targeting key sectors and supporting customers across the region. Customer numbers grew 5%, lending growth increased by 6% with Small Business a highlight growing at 12%. Cost discipline and underlying asset quality remains sound.
| Income statement | 2015 $m |
2014 $m |
Movt | |||||||||
| Net interest income |
7,509 | 7,077 | 6% | |||||||||
|
Other operating income |
1,169 | 1,116 | 5% | |||||||||
| Operating income |
8,678 | 8,193 | 6% | |||||||||
| Operating expenses |
(3,157 | ) | (3,015 | ) | 5% | |||||||
| Profit before credit impairment and income tax |
5,521 | 5,178 | 7% | |||||||||
| Credit impairment charge |
(853 | ) | (818 | ) | 4% | |||||||
| Profit before income tax |
4,668 | 4,360 | 7% | |||||||||
| Income tax expense and non-controlling interests |
(1,394 | ) | (1,306 | ) | 7% | |||||||
| Cash profit |
3,274 | 3,054 | 7% | |||||||||
| Key performance metrics |
||||||||||||
| Number of employees (FTE) |
9,781 | 9,904 | -1% | |||||||||
| Net interest margin |
2.50% | 2.52% | -2 bps | |||||||||
| Operating expenses to operating income |
36.4% | 36.8% | -40 bps | |||||||||
| Net loans and advances ($b) |
313.7 | 287.8 | 9% | |||||||||
| Customer deposits ($b) |
169.3 | 160.7 | 5% | |||||||||
Cash profit increased 7%, with 6% income growth, a 5% increase in expenses and a 4% increase in credit impairment charges.
Key factors affecting the result were:
| } | Net interest income increased by $432 million or 6% primarily due to Home Loans and Small Business Banking lending growth of 10% and 12% respectively. Lending margin contraction from competition was partially offset by favourable deposit pricing. |
| } | Other operating income increased $53 million or 5% primarily due to increased net interchange fee revenue, and lending fee income driven by Small Business Banking lending growth. |
| } | Operating expenses increased $142 million or 5%. This was primarily due to investments supporting our sales force growth strategy (particularly in NSW and Digital), as well as wage inflation. |
| } | Credit impairment charges increased $35 million or 4%, with a lower individual impairment charge partially offsetting a higher collective charge. The lower individual charge reflected write-backs in Corporate Banking partially offset by higher charges in Personal Loans, Small Business Banking and Esanda. The collective charge increase is mainly due to lending growth in Cards and Small Business with methodology adjustments in Esanda and changes to hardship policy also contributing to the increase. |
| 1 | Source: APRA Monthly Banking Statistics 12 months to September 2015. |
24
ANZ ANNUAL REPORT 2015
International and Institutional Banking
International and Institutional Banking (IIB) division provides markets, transaction banking and lending services to Institutional clients globally, leveraging its Australian market strength, and capability to reach across Asia. The Global Banking division serves customers with multi-product and multi-geographic requirements, while International Banking serves customers with less complex needs. IIB also provides banking and wealth management services to affluent and emerging affluent retail clients across Asia Pacific. In addition, IIB manages the Group’s investment in partnerships in Asia.
IIB’s four key strategic priorities are:
| } | Connecting with more customers by providing seamless value: supporting customers’ trade and investment activities across the key Asia Pacific corridors through the provision of multi-product, integrated solutions. |
| } | Delivering leading products through insights: combining leading product excellence with industry and regional expertise to provide tailored, innovative solutions to customers. |
| } | Intensifying balance sheet discipline: accelerating performance by managing capital efficiently and prudently. |
| } | Scaling and optimising infrastructure: simplifying and focusing the business to effectively control costs. |
IIB continues to focus on growing its mix of higher returning products; Markets and Cash Management. Loans remain an important product from which to build customer relationships.
| Income statement | 2015 $m |
2014 $m |
Movt | |||||||||
| Net interest income |
4,173 | 4,009 | 4% | |||||||||
|
Other operating income |
3,246 | 3,096 | 5% | |||||||||
| Operating income |
7,419 | 7,105 | 4% | |||||||||
| Operating expenses |
(3,616 | ) | (3,275 | ) | 10% | |||||||
| Profit before credit impairment and income tax |
3,803 | 3,830 | -1% | |||||||||
| Credit impairment charge |
(295 | ) | (216 | ) | 37% | |||||||
| Profit before income tax |
3,508 | 3,614 | -3% | |||||||||
| Income tax expense and non-controlling interests |
(844 | ) | (906 | ) | -7% | |||||||
| Cash profit |
2,664 | 2,708 | -2% | |||||||||
| Key performance metrics |
||||||||||||
| Number of employees (FTE) |
7,578 | 7,749 | -2% | |||||||||
| Net interest margin |
1.34% | 1.50% | -16 bps | |||||||||
| Operating expenses to operating income |
48.7% | 46.1% | 260 bps | |||||||||
| Net loans and advances ($b) |
154.7 | 142.0 | 9% | |||||||||
| Customer deposits ($b) |
202.5 | 183.1 | 11% | |||||||||
Cash profit decreased by 2% due to an increase in operating expenses and credit impairment charges, partially offset by an increase in operating income.
Key factors affecting the result were:
| } | Net interest income increased 4%. The increase in net interest income was driven by Retail Asia Pacific, Global Markets and Global Transaction Banking, partially offset by decreases in Global Loans. Average deposits and other borrowings increased 12% and average gross loans increased 11%. Net interest margin declined 16 bps, mainly due to excess liquidity in Australia. |
| } | Other operating income increased by 5%, due to increased Global Transaction Banking fees reflecting deposit volume growth in all geographies along with income growth from Asia Partnerships, higher Investment and Insurance income in Retail Asia Pacific, higher Global Markets Sales income and increased fee income from Global Loans. These increases were offset by a decrease in Global Markets Balance Sheet Trading income which was negatively impacted by widening credit spreads towards the end of the year. |
| } | Operating expenses increased by 10%, with ongoing investment in key growth, infrastructure, and compliance-related projects. |
| } | Credit impairment charges increased 37%. Individual credit impairment charges were flat with higher provisions in Global Loans offset by lower provisions in Global Transaction Banking. Collective credit impairment charges increased due to non-recurring provision releases in Retail Asia Pacific and higher level of customer credit rating upgrades in Global Loans in the prior year. |
DIRECTORS’ REPORT 25
DIRECTORS’ REPORT (continued)
New Zealand
New Zealand is a core market and ANZ is well positioned with its market leading network coverage and super regional connections. We maintained our momentum and continued to grow our market share in key products1 during 2015, including mortgage lending, business lending, credit cards and deposits. Our gross impaired assets ratio has reduced due to improved credit quality across the portfolio and our operating expenses to operating income ratio continued to trend downwards, due to revenue growth and continued benefits from our simplification strategy. Our vision is to help New Zealanders achieve more by offering unrivalled connections across the region and the best combination of convenience, service and price. We remain well placed to deliver this.
Retail2
We have grown customer numbers in 2015 and are now the biggest mortgage lender3 across all major cities and we are earning more revenue per FTE. We delivered new digital functionality for our customers, and our mobile banking application (goMoney™) was consistently rated either 98% or 99% for customer satisfaction4. Our focus on having the best people in the right locations is paying off, with growth in the key Auckland and Christchurch markets and the migrant and Small Business Banking customer segments.
Commercial
We have continued to see lending growth in our Commercial business. Portfolio quality and supporting existing customers has been the key focus in the Agri market. Our network of frontline specialists has played a leading role in delivering business and industry specific insights. Our focus on simplification continues and projects, including loan document simplification and process reengineering, have improved efficiency for staff and made banking easier for our customers.
| Income statement | 2015 $m |
2014 $m |
Movt | |||||||||
| Net interest income |
2,316 | 2,171 | 7% | |||||||||
| Other operating income |
368 | 349 | 5% | |||||||||
| Operating income |
2,684 | 2,520 | 7% | |||||||||
| Operating expenses |
(1,064 | ) | (1,031 | ) | 3% | |||||||
| Profit before credit impairment and income tax |
1,620 | 1,489 | 9% | |||||||||
| Credit impairment (charge)/release |
(55 | ) | 8 | large | ||||||||
| Profit before income tax |
1,565 | 1,497 | 5% | |||||||||
| Income tax expense and non-controlling interests |
(438 | ) | (419 | ) | 5% | |||||||
| Cash profit |
1,127 | 1,078 | 5% | |||||||||
| Key performance metrics |
||||||||||||
| Number of employees (FTE) |
5,068 | 5,059 | 0% | |||||||||
| Net interest margin |
2.48% | 2.49% | -1 bp | |||||||||
| Operating expenses to operating income |
39.7% | 40.9% | -120 bps | |||||||||
| Net loans and advances ($b) |
95.2 | 86.1 | 11% | |||||||||
| Customer deposits ($b) |
59.7 | 51.4 | 16% | |||||||||
Cash profit increased 5%, primarily driven by an improvement in net interest income due to lending growth and disciplined expense management, partially offset by high credit impairment charges.
Key factors affecting the result were:
| } | Net interest income increased 7%, primarily due to above system growth in lending1. Average gross loans and advances grew 7%, with growth across both the housing and non-housing portfolios. Margins were broadly flat, despite competitive market conditions. |
| } | Other operating income increased 5% driven by increased sales of KiwiSaver and insurance products via the branch network. |
| } | Operating expenses increased 3% driven by inflationary impacts and investment activity partly offset by productivity measures. |
| } | Credit impairment charges increased $63 million from a net release of $8 million in 2014 to a charge of $55 million in 2015. The individual credit impairment charge decreased 14% reflecting lower levels of new and top-up provisions, partially offset by lower write-backs in Commercial. The collective provision charge was $72 million higher due to portfolio growth, a lower release of economic overlay provisions and reduced rate of improvement in credit quality compared to 2014. |
| 1 | Source: RBNZ August 2015. |
| 2 | Retail now includes Small Business Banking which was previously included in Commercial. |
| 3 | Source: Core Logic (mortgage registrations) September 2015. |
| 4 | Source: Camorra (rolling 6 month average) Retail Market Monitor. |
26
ANZ ANNUAL REPORT 2015
Global Wealth
Global Wealth provides a range of innovative solutions to customers across the Asia Pacific region to make it easier for them to connect with, protect and grow their wealth. Global Wealth serves over 2.4 million customers and manages $65 billion in investment and retirement savings. Customers can access ANZ’s wealth solutions through teams of qualified financial planners and advisers, innovative digital platforms, ANZ Private Bankers, ANZ branches and direct channels.
Global Wealth continues to deliver innovative solutions that are aligned to ANZ’s strategy to improve customer experience. We developed Grow™ – a series of innovations across the physical, digital and advice space to help our customers better connect with, protect and grow their financial well-being. These include ANZ Smart Choice Super, a simple and direct retirement savings solution; the ANZ Grow Centre, a destination that blends digital tools with physical wealth specialists, where customers can get help with everything from their digital device to financial advice; and Grow by ANZ™, our award winning digital app that brings banking, share investments, superannuation and insurance, together in one place.
Funds Management
The Funds Management business helps customers grow their wealth through investment (including direct shares via E*TRADE), superannuation and pension solutions. Global Wealth has embraced the changing regulatory environment to reshape the business, simplifying operational processes and delivering innovative solutions like ANZ Smart Choice Super and ANZ KiwiSaver.
Insurance
The Insurance business provides protection for all life stages through a comprehensive range of life and general insurance products distributed through intermediated and direct channels. Global Wealth’s focus on retail risk resulted in a 9% growth in individual in-force premiums, while continued investment in retention initiatives in Australia reduced retail lapse rates by 20 bps.
Private Wealth
Operating in six geographies across the region we continue to strengthen our Private Wealth offerings by building core investment advice capabilities and developing a suite of global investment solutions.
| Income statement | 2015 $m |
2014 $m |
Movt | |||||||||
| Net funds management and insurance income |
1,361 | 1,249 | 9% | |||||||||
| Other operating income including net interest income |
369 | 496 | -26% | |||||||||
| Operating expenses including credit provision |
(975 | ) | (1,002 | ) | -3% | |||||||
| Profit before income tax |
755 | 743 | 2% | |||||||||
| Income tax expense and non-controlling interests |
(154 | ) | (201 | ) | -23% | |||||||
| Cash profit |
601 | 542 | 11% | |||||||||
| Consisting of: |
||||||||||||
| – Funds Management |
157 | 120 | 31% | |||||||||
| – Insurance |
296 | 224 | 32% | |||||||||
| – Private Wealth1 |
93 | 181 | -49% | |||||||||
| – Corporate and Other |
55 | 17 | large | |||||||||
| Total Global Wealth |
601 | 542 | 11% | |||||||||
| Key performance metrics |
||||||||||||
| Number of employees (FTE) |
2,489 | 2,290 | 9% | |||||||||
| Operating expenses to operating income |
56.4% | 57.5% | -110 bps | |||||||||
| Funds under management ($m) |
65,392 | 61,411 | 6% | |||||||||
| In-force premiums ($m) |
2,217 | 2,038 | 9% | |||||||||
| Retail insurance lapse rates |
||||||||||||
| – Australia |
13.3% | 13.5% | -20 bps | |||||||||
| – New Zealand |
15.8% | 16.1% | -30 bps | |||||||||
| 1 | In 2014 Private Wealth included a $125 million gain on the sale of ANZ trustees. |
DIRECTORS’ REPORT 27
DIRECTORS’ REPORT (continued)
Cash profit increased by 11%. Excluding a $56 million one-off tax consolidation benefit in September 2015 and the $64 million net impact of the ANZ Trustees sale and subsequent investment in productivity initiatives in September 2014, cash profit increased by 14%.
Key factors affecting the result were:
| } | Funds Management operating income increased by 6%. This was driven by 10% growth in average FUM (excluding Private Wealth FUM) as a result of solid volume growth in the ANZ Smart Choice Super and ANZ KiwiSaver products. |
| } | Insurance operating income increased by 18%. September 2014 full year results included a one-off $47 million experience loss due to the exit of a Group Life Insurance plan. Excluding this, operating income grew by 9% reflecting solid in-force premium growth and lower lapse rates. This performance contributed to an 18% uplift in the Embedded Value (gross of transfers). |
| } | Excluding the gain on sale from ANZ Trustees and related income in September 2014, Private Wealth operating income increased by 12%. This was driven by improved volumes with strong growth in customer deposits and investment FUM, up by 33% and 22%, respectively. |
| } | Operating expenses decreased by 3%. Excluding the net impact of ANZ Trustees related expenses and the write-down of intangibles in September 2014, expenses increased by 2%. This was driven by higher regulatory and compliance expenses. |
Global Technology, Services and Operations (GTSO) and Group Centre
GTSO and Group Centre provide support to the operating divisions, including technology, operations, shared services, property, risk management, financial management, strategy, marketing, human resources and corporate affairs. The Group centre also includes Group Treasury and Shareholder Functions.
| Income statement | 2015 $m |
2014 $m |
Movt | |||||||||
| Operating income |
7 | 15 | -53% | |||||||||
| Operating expenses |
(547 | ) | (435 | ) | 26% | |||||||
| Profit/(Loss) before credit impairment and income tax |
(540 | ) | (420 | ) | 29% | |||||||
| Credit impairment (charge)/release |
(2 | ) | 35 | large | ||||||||
| Profit/(Loss) before income tax |
(542 | ) | (385 | ) | 41% | |||||||
| Income tax expense and non-controlling interests |
92 | 120 | -23% | |||||||||
| Cash profit/(loss) |
(450 | ) | (265 | ) | 70% | |||||||
| Key performance metrics |
||||||||||||
| Number of employees (FTE) |
25,236 | 25,326 | 0% | |||||||||
Key factors affecting the results were:
| } | Operating income decreased $8 million primarily due to increased realised revenue hedge losses partly offset by higher income generated from increased capital held in Group Centre. |
| } | Operating expenses increased $112 million due to increased investment in enterprise projects, higher depreciation and amortisation and investment in the Global Compliance function. |
| } | Credit impairment charges decreased $37 million primarily due to the release of an economic cycle provision held in Group Centre in 2014. |
| } | The decrease in FTE is primarily due to productivity initiatives in GTSO partly offset by the build out of the Global Compliance function. |
28
ANZ ANNUAL REPORT 2015
DIRECTORS’ REPORT 29
DIRECTORS’ REPORT (continued)
30
ANZ ANNUAL REPORT 2015
DIRECTORS’ REPORT (continued)
REMUNERATION REPORT
Contents
DIRECTORS’ REPORT 31
DIRECTORS’ REPORT (continued)
Introduction from the Chair of the Human Resources Committee
Dear Shareholder,
I am pleased to present our Remuneration Report for the year ending 30 September 2015.
Our remuneration framework is designed to create value for all stakeholders, to differentiate rewards based on performance and in line with our risk management framework, and to provide competitive rewards that attract, motivate and retain talented people.
In 2015 ANZ delivered solid results in a challenging environment and the ANZ Board has assessed the 2015 performance for each category within the balanced scorecard of measures against annual objectives and progress towards broader long term strategic goals.
The results achieved have been reflected in the variable remuneration outcomes received by the Chief Executive Officer (CEO) and Disclosed Executives.
The Long Term Variable Remuneration (LTVR)1 awarded in 2011 was tested in late 2014. Although ANZ achieved Total Shareholder Return (TSR) of 89.65% and 87.83% over the three year performance periods for the Disclosed Executives and CEO awards respectively, ANZ’s TSR did not reach the median of the comparator group. Accordingly, the performance rights did not vest and the CEO and Disclosed Executives received no value from these awards. These awards have now lapsed.
The Human Resources (HR) Committee continues to have a strong focus on the relationship between business performance, risk management and remuneration, and regularly reviews the executive remuneration structure to ensure it remains appropriate.
During 2015 the HR Committee conducted a comprehensive review of ANZ’s variable remuneration framework, which resulted in the following changes to LTVR for the CEO and Disclosed Executives, effective for LTVR grants made from 1 October 2015:
| } | To enhance the relevance of the select financial services comparator group, it has been modified to comprise core local and global competitors. Based on their strategic focus, two regional banks are being incorporated into the comparator group along with two international banks who have similar operations to ANZ. ASX Limited and insurance companies will be removed from the comparator group as their operations are largely different to that of ANZ’s and they are not direct competitors. |
| } | To strengthen the focus of executives on growing positive returns to shareholders, Absolute Compound Annual Growth Rate (CAGR) TSR is being introduced as a third performance hurdle (in addition to relative TSR). One third of the LTVR will now be contingent on ANZ achieving or exceeding a threshold level of growth (as determined by the Board). The remaining two thirds will be split between the existing relative TSR measures. This combination provides balance to the plan, rewarding executives for performance that exceeds that of peer companies, while still ensuring there is a continued focus on providing positive growth (even when the market is declining). Absolute CAGR TSR provides executives with a more direct line of sight to the performance required to achieve shareholder value creation and provides a tighter correlation between the executives’ rewards and the shareholders’ financial outcomes. |
| } | To increase transparency and reduce volatility in the number of instruments allocated each year a face value allocation methodology is being used to determine the number of LTVR performance rights allocated to the incoming CEO and Disclosed Executives. This replaces the fair value methodology. To ensure that a similar number of instruments are granted, a one-off conversion is being undertaken. The number of instruments allocated to the incoming CEO and Disclosed Executives will be calculated based on the five trading day Volume Weighted Average Price (VWAP) of the Company’s shares traded on the ASX in the week up to and including the start of the performance period (18 November 2015). |
On 1 October 2015 the Board announced that Mr Shayne Elliott will become CEO and join the Board on 1 January 2016 succeeding Mr Michael Smith. Mr Elliott’s at target remuneration will be $6.3 million (which is 39% less than Mr Smith’s at target remuneration of $10.2 million) and will comprise of three components:
| } | Fixed remuneration of $2.1 million. |
| } | Annual Variable Remuneration (AVR)2 target of $2.1 million (100% of fixed remuneration). This will be prorated for the period from the commencement date (1 January 2016) to 30 September 2016. Mr Elliott’s AVR target for his current role as Chief Financial Officer (CFO) will apply from 1 October 2015 to 31 December 2015. |
| } | Long Term Variable Remuneration target of $2.1 million. The initial award has a current face value of $2.1 million at 50% vesting and $4.2 million at 100% vesting. Subject to shareholder approval at the 2015 Annual General Meeting this award will be delivered as three equal tranches of performance rights allocated on a face value basis, not at fair value as used previously. Each tranche will be measured over a three year performance period against the performance hurdle relevant to each tranche, as specified by the Board. |
Termination arrangements for Mr Smith are in line with his contract (as previously disclosed to shareholders).
Further detail is provided within the Remuneration Report which we hope you will find informative.

Graeme R Liebelt
Chair – Human Resources Committee
| 1 | LTVR – Also referred to as Long Term Incentive (LTI). |
| 2 | AVR – Also referred to as Short Term Incentive (STI). |
32
ANZ ANNUAL REPORT 2015
1. Basis of Preparation
The Remuneration Report is designed to provide shareholders with an understanding of ANZ’s remuneration policies and the link between our remuneration approach and ANZ’s performance, in particular regarding Key Management Personnel (KMP) as defined under the Corporations Act 2001. Individual outcomes are provided for ANZ’s Non-Executive Directors (NEDs), the CEO and Disclosed Executives (current and former).
The Disclosed Executives are defined as those direct reports to the CEO with responsibility for the strategic direction and management of a major revenue generating Division or who control material revenue and expenses that fall within the definition of KMP.
The Remuneration Report for the Company and the Group for 2015 has been prepared in accordance with section 300A of the Corporations Act 2001. Information in Table 5: Non Statutory Remuneration Disclosure has been prepared in accordance with the presentation basis set out in Section 8.5. The information provided in this Remuneration Report has been audited as required by section 308(3C) of the Corporations Act 2001, unless indicated otherwise, and forms part of the Directors’ Report.
2. Key Management Personnel (KMP)
The KMP disclosed in this year’s report are detailed in Table 1.
TABLE 1: KEY MANAGEMENT PERSONNEL
| Name | Position | Term as KMP in 2015 | ||
| Non-Executive Directors (NEDs) | ||||
| D Gonski | Chairman – Appointed Chairman 1 May 2014 (Appointed Director 27 February 2014) | Full Year | ||
| I Atlas | Director – Appointed 24 September 2014 | Full Year | ||
| P Dwyer | Director – Appointed April 2012 | Full Year | ||
| H Lee | Director – Appointed February 2009 | Full Year | ||
| G Liebelt | Director – Appointed July 2013 | Full Year | ||
| I Macfarlane | Director – Appointed February 2007 | Full Year | ||
| J T Macfarlane | Director – Appointed 22 May 2014 | Full Year | ||
| Non-Executive Directors (NEDs) – Former | ||||
| J Morschel | Chairman – Appointed Chairman March 2010 (Appointed Director October 2004), retired 30 April 2014 | -- | ||
| G Clark | Director – Appointed February 2004, retired 18 December 2013 | -- | ||
| P Hay | Director – Appointed November 2008, retired 30 April 2014 | -- | ||
| D Meiklejohn | Director – Appointed October 2004, retired 18 December 2013 | -- | ||
| A Watkins | Director – Appointed November 2008, retired 30 April 2014 | -- | ||
| Chief Executive Officer (CEO) | ||||
| M Smith | Chief Executive Officer and Executive Director – Concluding in role 31 December 2015 | Full Year | ||
| Disclosed Executives – Current | ||||
| A Currie | Chief Operating Officer | Full Year | ||
| S Elliott | Chief Financial Officer (Chief Executive Officer and Executive Director from 1 January 2016) | Full Year | ||
| A Géczy | Chief Executive Officer, International & Institutional Banking | Full Year | ||
| D Hisco | Chief Executive Officer, New Zealand | Full Year | ||
| G Hodges | Deputy Chief Executive Officer | Full Year | ||
| J Phillips | Chief Executive Officer, Global Wealth and Group Managing Director, Marketing, Innovation and Digital | Full Year | ||
| M Whelan | Chief Executive Officer, Australia – Appointed 3 April 2015 | Part Year | ||
| N Williams | Chief Risk Officer | Full Year | ||
| Disclosed Executives – Former | ||||
| P Chronican | Former Chief Executive Officer, Australia – Concluded in role 2 April 2015, ceasing employment 31 December 2015 | Full Year | ||
DIRECTORS’ REPORT 33
DIRECTORS’ REPORT (continued)
3. Role of the Board in Remuneration
The HR Committee is a Committee of the Board. The HR Committee is responsible for:
| } | reviewing and making recommendations to the Board in relation to remuneration governance, director and senior executive remuneration and senior executive succession; |
| } | specifically making recommendations to the Board on remuneration and succession matters related to the CEO, and individual remuneration arrangements for other key executives covered by the Group’s Remuneration Policy; |
| } | the design of significant variable remuneration (such as the ANZ Employee Reward Scheme (ANZERS) and the Institutional Total Incentives Performance Plan (TIPP)); and |
| } | remuneration structures for senior executives and others specifically covered by the Remuneration Policy. |
More details about the role of the HR Committee can be found on the ANZ website.1
The link between remuneration and risk is considered a key requirement by the Board. Committee membership is structured to ensure overlap of representation across the HR Committee and Risk Committee, with three NEDs currently on both committees. The HR Committee has free and unfettered access to risk and financial control personnel, and can also engage independent external advisors as needed.
Throughout the year the HR Committee and management received information from external providers including Aon Hewitt, Ashurst, Ernst and Young, Hay Group, Herbert Smith Freehills, McLagan, Mercer Consulting (Australia) Pty Ltd and PricewaterhouseCoopers. This information related to market data and market practice information, legislative requirements and interpretation of governance and regulatory requirements.
The HR Committee did not receive any recommendations from remuneration consultants during the year in relation to the remuneration arrangements of KMP. ANZ employs in-house remuneration professionals who provide recommendations to the HR Committee/Board, taking into consideration market information provided by external providers. The Board’s decisions were made independently using the information provided and having careful regard to ANZ’s strategic objectives, risk appetite and Remuneration Policy and principles.
4. HR Committee Activities
During 2015, the HR Committee met on six occasions, with remuneration matters an agenda item on each occasion. The HR Committee has a strong focus on the relationship between business performance, risk management and remuneration, with the following activities occurring during the year:
| } | annual review of the effectiveness of the Remuneration Policy; |
| } | review of key senior executive appointments and terminations; |
| } | involvement of the Risk function in remuneration regulatory and compliance related activities; |
| } | monitoring of regulatory and compliance matters relating to remuneration governance; |
| } | review of variable remuneration arrangements including changes to LTVR; |
| } | review of reward outcomes for key senior executives; |
| } | review of ANZ’s risk culture and employee engagement; |
| } | review of health and safety; |
| } | review of diversity and inclusion; and |
| } | review of succession plans for key senior executives. |
| 1 | Go to anz.com > about us > our company > corporate governance > HR Committee Charter. |
34
ANZ ANNUAL REPORT 2015
5. Remuneration Strategy and Objectives
ANZ’s remuneration strategy, the Group’s Remuneration Policy and reward frameworks all reflect the importance of sound risk management. The following principles underpin ANZ’s Remuneration Policy, which is approved by the Board and applied globally across ANZ:
| } | creating and enhancing value for all ANZ stakeholders; |
| } | emphasising the ‘at risk’ components of total rewards to increase alignment with shareholders and encourage behaviour that supports the long term financial soundness and the risk management framework of ANZ, and the delivery of superior long term total shareholder returns; |
| } | differentiating rewards in line with ANZ’s culture of rewarding for outperformance and demonstration of behaviours aligned with ANZ’s values (Integrity, Collaboration, Accountability, Respect and Excellence); and |
| } | providing a competitive reward proposition to attract, motivate and retain the highest quality individuals in order to deliver ANZ’s business and growth strategies. |
Appropriate risk management is fundamental to the way ANZ operates and is therefore a key element of the way performance is measured and assessed at a Group, Division and individual level. Variable remuneration outcomes reflect performance against a balanced scorecard of financial and non-financial (including risk) measures.
The core elements of ANZ’s remuneration strategy for the CEO and Disclosed Executives are set out below:
FIGURE 1: REMUNERATION OBJECTIVES
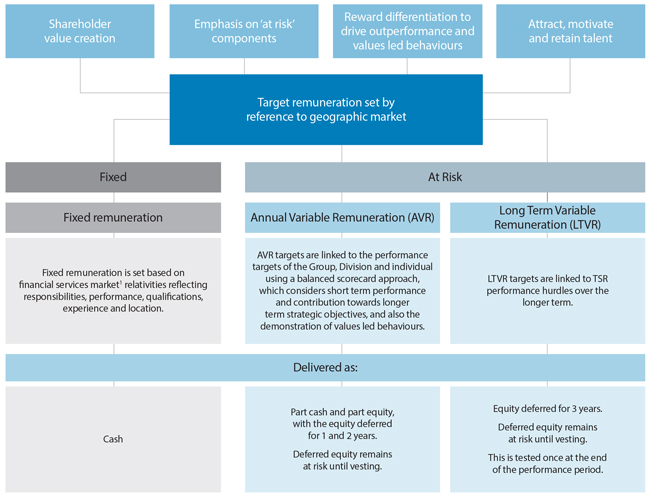
| 1 | Considered the most relevant comparator as this is the main pool for sourcing talent and where key talent may be lost. |
DIRECTORS’ REPORT 35
DIRECTORS’ REPORT (continued)
6. The Composition of Remuneration at ANZ
The Board aims to find a balance between:
| } | fixed and at-risk remuneration; |
| } | annual and long term variable remuneration; and |
| } | cash and deferred equity. |
Figure 2 provides an overview of the target remuneration mix for the CEO and Disclosed Executives.
FIGURE 2: TARGET REMUNERATION MIX
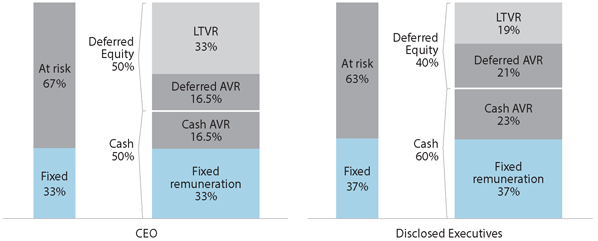
The remuneration mix in Figure 2 is based on LTVR face value at 50% vesting assuming an ‘on target’ award (was based on fair value in previous reports).
The CEO’s target remuneration mix is equally weighted between fixed remuneration, AVR and LTVR, with approximately half of total target remuneration payable in cash in the current year and half allocated as equity and deferred over one, two or three years.
The target remuneration mix for Disclosed Executives is weighted between fixed remuneration (37%), AVR (44%) and LTVR (19%), with approximately 60% of total target remuneration payable in cash in the current year and 40% allocated as equity and deferred over one, two or three years.
The deferred remuneration for the CEO and Disclosed Executives remains at risk (Board has discretion to reduce downward to zero) until vesting date.
The Board has adopted this mix as an effective reward mechanism to drive strong performance and value for the shareholder in both the short and longer term.
The CEO and Disclosed Executives may be awarded amounts above or below the target for both AVR and LTVR.
ANZ’s AVR and LTVR deferral arrangements are designed to ensure that the CEO and Disclosed Executives are acting in the best long term interests of ANZ and its shareholders. Deferring part of their AVR over one and two years, and all of their LTVR over three years every year results in a substantial amount of their variable remuneration being directly linked to long term shareholder value. For example as at 30 September 2015 Mr Smith held 91,855 unvested AVR deferred shares and 759,168 unvested LTVR performance rights, the combined value1 of which was around six times his fixed remuneration. Similarly as at 30 September 2015 Disclosed Executives held unvested equity, the value1 of which was around four times their average fixed remuneration.
| 1 | Value is based on the number of unvested deferred shares and unvested rights held at 30 September 2015 multiplied by the ANZ closing share price as at 30 September 2015. |
36
ANZ ANNUAL REPORT 2015
The following diagram demonstrates the time horizon associated with AVR and LTVR awards.
FIGURE 3: AVR AND LTVR TIME HORIZON RELATING TO 2015
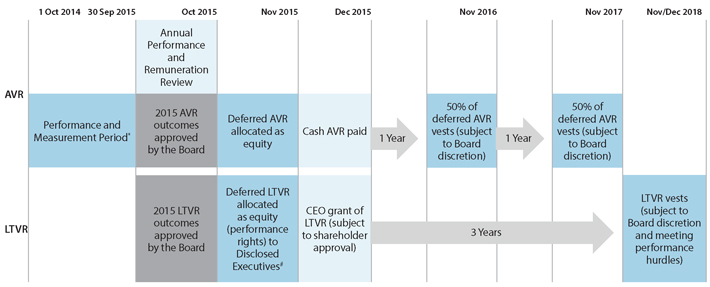
| * | 2014 deferred AVR and deferred LTVR granted in November/December 2014 |
| # | CRO allocated deferred shared rights |
The reward structure for the CEO and Disclosed Executives is detailed below. The only exception is the Chief Risk Officer (CRO) whose remuneration arrangements have been structured differently to preserve the independence of this role and to minimise any conflicts of interest in carrying out the risk control function across the organisation. The CRO’s role has more limited AVR leverage for individual performance and none (either positive or negative) for Group performance. LTVR is delivered as unhurdled deferred share rights, with a three year time based hurdle, and is therefore not subject to meeting TSR performance hurdles.
6.1 FIXED REMUNERATION
The fixed remuneration amount is expressed as a total dollar amount which can be taken as cash salary, superannuation contributions and other nominated benefits.
6.2 VARIABLE REMUNERATION
Variable remuneration forms a significant part of the CEO’s and Disclosed Executives’ potential remuneration, providing at risk components that are designed to drive performance in the short, medium and long term. The term variable remuneration within ANZ covers both the annual variable remuneration and long term variable remuneration arrangements.
Downward adjustment
The Board has on-going and absolute discretion to:
| } | adjust deferred variable remuneration downwards, or to zero at any time, including after the grant of such remuneration, where the Board considers such an adjustment is necessary to protect the financial soundness of ANZ or to meet unexpected or unknown regulatory requirements, or if the Board subsequently considers that having regard to information which has come to light after the grant of deferred equity/cash, the deferred equity/cash was not justified; |
| } | withhold vesting until the Board has considered any information that may impact the vesting. |
Prior to any scheduled release of deferred equity/deferred cash, the Board considers whether any downward adjustment should be made. No downward adjustment was applied to the remuneration of the CEO and Disclosed Executives during 2015.
DIRECTORS’ REPORT 37
DIRECTORS’ REPORT (continued)
6.2.1 Annual Variable Remuneration (AVR)
AVR provides an annual opportunity for a variable remuneration award. It is assessed against Group, Divisional and individual objectives based on a balanced scorecard of measures and positive demonstration of values led behaviours. Many of the measures relate to contribution towards medium to longer term performance outcomes aligned to ANZ’s strategic objectives as well as annual goals.
AVR ARRANGEMENTS
| ANZ’s Employee Reward Scheme (ANZERS) structure and pool is reviewed by the HR Committee and approved by the Board. The size of the overall pool is based on an assessment of the balanced scorecard of measures of the Group. | ||||
| Performance targets | In order to focus on achieving individual, Divisional and Group performance objectives a mix of quantitative and qualitative short, medium and long term measures are assessed. | |||
| Targets are set considering prior year performance, industry standards and ANZ’s strategic objectives. Many of the measures also focus on targets which are set for the current year in the context of progress towards longer term goals. The specific targets and features relating to all these measures have not been provided in detail due to their commercial sensitivity. | ||||
| For the CEO and Disclosed Executives, the weighting of measures in each individual’s balanced scorecard will vary to reflect the responsibilities of their role. For example the CEOs of the Australia, New Zealand, Global Wealth and International and Institutional Banking divisions and also the CFO have a heavier weighting on financial measures (typically 40%) compared to other Disclosed Executives. | ||||
| The validation of performance and achievements against these objectives at the end of the year, for: | ||||
| } | the CEO involves input from the CRO, CFO and Group General Manager Global Internal Audit on risk management, financial performance and internal audit matters respectively, followed by review and endorsement by the HR Committee, with final outcomes approved by the Board; and | |||
| } | Disclosed Executives involves a review by the CEO, input on each individual’s risk management from the CRO, input on each area’s internal controls from the Group General Manager Global Internal Audit and input on the financial performance of all key Divisions from the CFO. Preliminary and final review is completed by the HR Committee and final outcomes are approved by the Board. | |||
| The Board reviews performance outcomes against target for each metric, combined with a judgmental assessment of the prioritisation and impact of each outcome relative to overall business performance for both the short and longer term. | ||||
| Rewarding performance | The 2015 target AVR award level for the CEO represents one third of target remuneration and for Disclosed Executives 44% of their target remuneration. The maximum AVR opportunity for the CEO and Disclosed Executives is up to 200%. Where a weak performance is assessed for the CEO or Disclosed Executives AVR opportunity is adjusted down accordingly (and potentially to a nil payment). | |||
| Mandatory deferral | Mandatory deferral of a portion of the AVR places an increased emphasis on having a variable structure that is flexible, continues to be performance linked, has significant retention elements and aligns the interests of the CEO and Disclosed Executives to shareholders to deliver against strategic objectives. | |||
| The mandatory deferral threshold for AVR payments is currently $100,000 (subject to a minimum deferral amount of $25,000) with: | ||||
| } | the first $100,000 of amount paid in cash; | |||
| } | 50% of amount above $100,000 paid in cash; | |||
| } | 25% of amount above $100,000 deferred in ANZ equity for one year; and | |||
| } | 25% of amount above $100,000 deferred in ANZ equity for two years. | |||
| The deferred component of AVR paid in relation to the 2015 year is delivered as ANZ deferred shares or deferred share rights. At the end of the deferral period, each deferred share right entitles the holder to one ordinary share. Deferred shares are ordinary shares. | ||||
38
ANZ ANNUAL REPORT 2015
6.2.2 Long Term Variable Remuneration (LTVR)
LTVR provides an annual opportunity for an equity award deferred for three years that aligns a significant portion of overall remuneration to shareholder value over the longer term.
The HR Committee determines appropriate LTVR awards for the financial year by referencing performance achieved in that year. A grant is then made after the end of the financial year.
LTVR ARRANGEMENTS (granted prior to 1 October 20151) – EXCLUDING THE CRO
|
Type of equity awarded |
LTVR was delivered to the CEO and Disclosed Executives as performance rights. A performance right is a right to acquire a share at nil cost, subject to meeting time and performance hurdles. Upon exercise, each performance right entitles the CEO and Disclosed Executives to one ordinary share.
| |||||
|
Time restrictions |
Performance rights awarded to the CEO and Disclosed Executives will be tested against the relevant performance hurdle at the end of the three year performance period. A three year performance period provides a reasonable period to align reward with shareholder return and also acts as a vehicle to retain the CEO and Disclosed Executives. If the performance rights do not achieve the required performance hurdle they are forfeited at that time.
| |||||
|
Performance hurdle |
The performance rights have been designed to reward the CEO and Disclosed Executives if the Group’s TSR is at or above the median TSR of the relevant comparator group over a three year period. TSR represents the change in the value of a share plus the value of reinvested dividends paid. TSR was chosen as the most appropriate comparative measure as it focuses on the delivery of shareholder value and is a well understood and tested mechanism to measure performance. The performance rights granted to the Disclosed Executives and CEO in November/December 2014 were split into two equal tranches with vesting dependent upon the Company’s relative TSR performance against two different comparator groups (as detailed below). Note that grants prior to 1 October 2013 are subject to one performance hurdle only (TSR against the select financial services comparator group).
| |||||
|
Vesting schedule |
The proportion of performance rights that become exercisable in each tranche will depend upon the TSR achieved by ANZ relative to the companies in the relevant comparator group at the end of the three year performance period. An averaging calculation is used for TSR over a 90 day period for start and end values in order to reduce the impact of share price volatility. To ensure an independent TSR measurement, ANZ engages the services of an external organisation (Mercer Consulting (Australia) Pty Ltd) to calculate ANZ’s performance against the TSR hurdles. The level of performance required for each level of vesting, and the percentage of vesting associated with each level of performance, are set out below. The performance rights lapse if the performance condition is not met. There is no re-testing.
| |||||
| If the TSR of the Company compared to the | ||||||
| TSR of the relevant comparator group: | The percentage of performance rights which will vest is: | |||||
|
| ||||||
| Does not reach the 50th percentile | 0% | |||||
|
| ||||||
| Reaches or exceeds the 50th percentile but does not reach the 75th percentile | 50%, plus 2% for every one percentile increase above the 50th percentile | |||||
|
| ||||||
| Reaches or exceeds the 75th percentile | 100%
| |||||
| Comparator groups | For the LTVR granted in November/December 2014:
| |||||
| } | The first tranche will be measured against a select financial services comparator group, which consists of the following nine companies: | |||||
| } AMP Limited | } National Australia Bank Limited | |||||
| } ASX Limited | } QBE Insurance Group Limited | |||||
| } Commonwealth Bank of Australia Limited | } Suncorp Group Limited | |||||
| } Insurance Australia Group Limited | } Westpac Banking Corporation | |||||
| } Macquarie Group Limited | ||||||
|
} |
The second tranche will be measured against a comparator group comprising the companies within the S&P/ASX 50 Index as at the start of the performance period (21 November 2014). | |||||
|
Each tranche will be measured independently from the other so one tranche may vest fully or partially but another tranche may not.
| ||||||
|
Size of LTVR grants |
For the LTVR granted in November/December 2014, the size of individual LTVR grants was determined by reference to the performance and assessed potential of the individual. Individuals were advised of their LTVR award value, which was then split into two equal tranches and each tranche was compared to a different comparator group as explained above. The total number of performance rights in each tranche was based on an independent fair value calculation (as at the start of the performance period2) of a performance right in that tranche as independently valued. The future value of the grant may range from zero to an undefined amount depending on performance against the hurdle and the share price at the time of exercise.
| |||||
| 1 | And granted after 1 October 2013. |
| 2 | As at the allocation date for grants prior to 1 October 2014. |
DIRECTORS’ REPORT 39
DIRECTORS’ REPORT (continued)
LTVR ARRANGEMENTS FOR THE CRO
| Deferred share rights | The CRO is the only Disclosed Executive to receive LTVR deferred share rights, rather than performance rights.
Deferred share rights are subject to a time-based vesting hurdle of three years, during which time they are held in trust. The value used to determine the number of LTVR deferred share rights to be allocated is based on an independent fair value calculation. |
6.3 OTHER REMUNERATION ELEMENTS
Hedging and Margin Lending Prohibition
As specified in the Trading in ANZ Securities Policy and in accordance with the Corporations Act 2001, equity allocated under ANZ variable remuneration plans must remain at risk until fully vested (in the case of deferred shares) or exercisable (in the case of deferred share rights or performance rights). As such, it is a condition of grant that no schemes are entered into, by an individual or their associated persons, that specifically protects the unvested value of shares, deferred share rights or performance rights allocated. Doing so would constitute a breach of the grant conditions and would result in the forfeiture of the relevant shares, deferred share rights or performance rights.
ANZ also prohibits the CEO and Disclosed Executives from providing ANZ securities in connection with a margin loan or similar financing arrangements which may be subject to a margin call or loan to value ratio breach.
To monitor adherence to this policy, ANZ’s CEO and Disclosed Executives are required to sign an annual declaration stating that they and their associated persons have not entered into (and are not currently involved in) any schemes to protect the value of their interests in any ANZ securities. Based on the 2015 declarations, ANZ can advise that the CEO and Disclosed Executives are fully compliant with this policy.
CEO and Disclosed Executives Shareholding Guidelines
The CEO and Disclosed Executives are expected to accumulate ANZ shares over a five year period, to the value of 200% of their fixed remuneration and to maintain this shareholding while an executive of ANZ. Shareholdings for this purpose include all vested and allocated (but unvested) equity which is not subject to performance hurdles. Based on equity holdings as at 30 September 2015 and the equity to be granted on 18 November 2015 as a result of 2015 Performance and Remuneration Review outcomes, the CEO and all Disclosed Executives meet or, if less than five years tenure, are on track to meet their minimum shareholding guidelines requirement.
Conditions of Grant
The conditions under which deferred shares, deferred share rights and performance rights are granted are approved by the Board in accordance with the rules of the ANZ Employee Share Acquisition Plan and/or the ANZ Share Option Plan.
Where deferred share rights or performance rights are granted, any portion of the award which vests may be satisfied by a cash equivalent payment rather than shares at the Board’s discretion.
CEO Contract Terms
The following sets out details of the contract terms relating to the CEO. The contract terms are in line with industry practice (based on external advice on Australian and international peer company benchmarks) and ASX Corporate Governance Principles.
|
Length of contract |
Mr Smith commenced as CEO and Executive Director of ANZ on 1 October 2007 and is on a permanent contract. | |
|
On 1 October 2015 the Board announced that Mr Smith will be succeeded as CEO by Mr Elliott effective 1 January 2016.
| ||
|
Key terms of leaving arrangement |
Under his existing employment contract Mr Smith is entitled to 12 months’ notice and ANZ has the right to require him to work all or part of this notice period. Accordingly, ANZ has determined as follows:
| |
| 1. Mr Smith will work in the role as CEO for the first 3 months (to 31 December 2015);
| ||
| 2. Mr Smith will be on leave for a period of approximately 6 months (gardening leave) (to 7 July 2016);
| ||
| 3. Mr Smith will then receive a payment for the remaining approximately 3 months in lieu of notice (to 30 September 2016). | ||
|
As a result of the above, Mr Smith will continue to be paid his fixed remuneration on a monthly basis to 7 July 2016 (items 1 and 2 above). On Mr Smith’s departure from ANZ on 7 July 2016, in accordance with the terms of his existing employment contract, he will therefore be entitled to:
| ||
|
} A payment in lieu of notice for the approximately 3 month period (item 3 above) based on his above mentioned fixed remuneration; and
| ||
|
} A payment for pro rata long service leave and other statutory entitlements; and
| ||
|
} A payment to relocate Mr Smith and his family from Australia if he decides to relocate.
| ||
| ANZ will also continue to provide life insurance coverage for Mr Smith for the period through to 7 July 2016. No ex gratia payments will be made. | ||
|
Equity granted in prior years under ANZ’s AVR and LTVR plans will, in accordance with the terms of their issue and Mr Smith’s existing employment contract, remain on foot and will vest at the originally intended vesting dates to the extent to which the performance conditions (where applicable) are satisfied in accordance with the Conditions of Grant (and the terms approved by Shareholders for the performance rights). Where the rights have vested the Board may determine to settle in equity or a cash equivalent payment. There will be no accelerated or automatic vesting upon ceasing employment. Mr Smith will also be entitled to the value of the superannuation funds that he has accumulated over his 8 years with ANZ.
|
40
ANZ ANNUAL REPORT 2015
Incoming CEO and Disclosed Executives’ Contract Terms
The following sets out details of the contract terms relating to the incoming CEO and Disclosed Executives. The contract terms for the incoming CEO and all Disclosed Executives are similar, but do, on occasion, vary to suit different needs.
|
Length of contract |
The incoming CEO and Disclosed Executives are all on a permanent contract, which is an ongoing employment contract until notice is given by either party.
| |
|
Resignation |
In order to terminate the employment arrangements: | |
|
u the incoming CEO is required to provide the Company with 12 months’ written notice; | ||
|
u Disclosed Executives are required to provide the Company with 6 months’ written notice. | ||
|
On resignation, unless the Board determines otherwise, all unvested deferred shares, all unvested or vested but unexercised performance rights and all deferred share rights are forfeited.
| ||
|
Termination on notice by ANZ |
ANZ may terminate employment by providing 12 months’ written notice or payment in lieu of the notice period based on fixed remuneration. On termination on notice by ANZ, unless the Board determines otherwise: | |
|
u all unvested deferred shares, performance rights and deferred share rights are forfeited; and | ||
|
u only performance rights and deferred share rights that are vested may be exercised. | ||
|
Where the Disclosed Executive’s termination is classified as a ‘good leaver’, then, unless the Board decides otherwise, any unvested AVR deferred equity will be retained and released at the original vesting date. Any unvested LTVR performance rights (subject to performance hurdles being met) and LTVR deferred equity will be prorated for the period from the date of grant to the full notice termination date and released at the original vesting date.
| ||
|
Redundancy (not applicable for the CEO) |
If ANZ terminates Disclosed Executive’s employment for reasons of redundancy, a severance payment will be made that is equal to 12 months’ fixed remuneration. | |
|
All unvested AVR deferred equity remains subject to downward adjustment and are released at the original vesting date. All unvested LTVR performance rights (subject to performance hurdles being met), LTVR deferred equity will be prorated for the period from the date of grant to the full notice termination date and released at the original vesting date.
| ||
|
Death or total and permanent disablement |
On death or total and permanent disablement all unvested AVR deferred shares, all deferred share rights and all performance rights will vest.
| |
|
Termination for serious misconduct |
ANZ may immediately terminate employment at any time in the case of serious misconduct, and the executive will only be entitled to payment of fixed remuneration up to the date of termination.
On termination without notice by ANZ in the event of serious misconduct all deferred shares held in trust will be forfeited and all performance rights and deferred share rights will be forfeited.
| |
|
Change of control (applicable for the CEO only) |
Where a change of control occurs, which includes a person acquiring a relevant interest in at least 50% of the Company’s ordinary shares as a result of a takeover bid, or other similar event, the applicable performance conditions applying to the performance rights will be tested and the performance rights will vest based on the extent the performance conditions are satisfied. No pro rata reduction in vesting will occur based on the period of time from the date of grant to the date of the change of control event occurring, and vesting will only be determined by the extent to which the performance conditions are satisfied.
Any performance rights which vest based on satisfaction of the performance conditions will vest at a time (being no later than the final date on which the change of control event will occur) determined by the Board.
Any performance rights which do not vest will lapse with effect from the date of the change of control event occurring, unless the Board determines otherwise.
Any unvested AVR deferred shares will vest at a time (being no later than the final date on which the change of control event will occur) determined by the Board.
| |
|
Statutory Entitlements |
Payment of statutory entitlements of long service leave and annual leave applies in all events of separation.
|
DIRECTORS’ REPORT 41
DIRECTORS’ REPORT (continued)
7. Linking Remuneration to Balanced Scorecard Performance
7.1 ANZ PERFORMANCE
TABLE 2: ANZ’S FINANCIAL PERFORMANCE 2011 – 2015
| 2011 | 2012 | 2013 | 2014 | 2015 | ||||||||||||||||
| Statutory profit ($m) |
5,355 | 5,661 | 6,310 | 7,271 | 7,493 | |||||||||||||||
| Cash/Underlying profit1 (unaudited) |
5,652 | 5,830 | 6,492 | 7,117 | 7,216 | |||||||||||||||
| Cash/Underlying return on equity (ROE) (%) (unaudited) |
16.2% | 15.1% | 15.3% | 15.4% | 14.0% | |||||||||||||||
| Cash/Underlying earnings per share (EPS) (unaudited) |
218.4 | 218.5 | 238.3 | 260.3 | 260.3 | |||||||||||||||
| Share price at 30 September ($)2 |
19.52 | 24.75 | 30.78 | 30.92 | 27.08 | |||||||||||||||
| Total dividend (cents per share) |
140 | 145 | 164 | 178 | 181 | |||||||||||||||
| Total shareholder return (12 month %) |
(12.6 | ) | 35.4 | 31.5 | 5.9 | (7.5) | ||||||||||||||
| Average AVR as a % of target3 |
110% | 117% | 133% | 133% | 128% | |||||||||||||||
| 1 | From 1 October 2012, the Group has used cash profit as a measure of performance for ongoing business activities of the Group, enabling shareholders to assess Group and divisional performance against prior periods and against peer institutions. For 2012 to 2015 statutory profit has been adjusted for non-core items to arrive at cash profit. For 2011 statutory profit has been adjusted for non-core items to arrive at underlying profit, which like cash profit is a measure of the ongoing business performance of the Group but used different criteria for adjusting items. Neither cash profit nor underlying profit are audited; however, the external auditor has informed the Audit Committee that the cash/underlying profit adjustments have been determined on a consistent basis across the respective periods presented. |
| 2 | The opening share price at 1 October 2010 was $23.79. |
| 3 | The average AVR payments for each year are based on those executives (including the CEO) disclosed in each relevant reporting period. |
Figure 4 compares ANZ’s TSR performance against the median TSR and upper quartile TSR of the LTVR select financial services (SFS) comparator group and also against the S&P/ASX 50 Index over the 2011 to 2015 measurement period. ANZ’s TSR performance is below the median TSR of the LTVR SFS comparator group and above the ASX 50 index over the five year period to 30 September 2015. Although this is across a different performance period, it is consistent with the outcomes of the most recently tested LTVR grants.
FIGURE 4: ANZ 5-YEAR CUMULATIVE TOTAL SHAREHOLDER RETURN PERFORMANCE
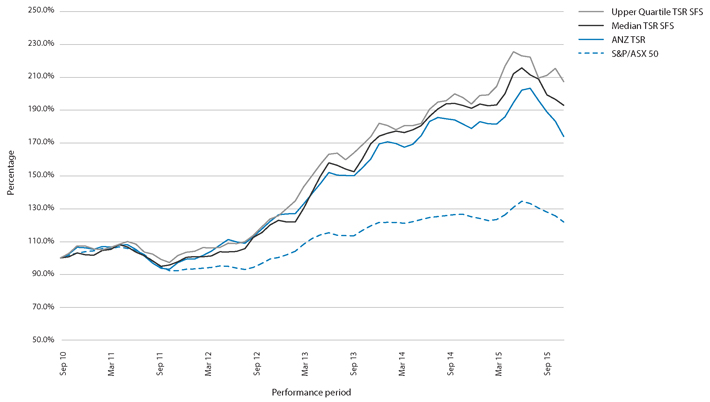
42
ANZ ANNUAL REPORT 2015
7.2 AVR – PERFORMANCE AND OUTCOMES
ANZ uses a balanced scorecard to measure performance in relation to the Group’s main variable remuneration plans. The scorecard provides a framework whereby a combination of measures can be applied to ensure a broader long term strategic focus on driving shareholder value as well as a focus on annual priorities.
The balanced scorecard is aligned to the Group’s long term strategic intent under the themes of High Performing, Most Respected, Well Managed, Best Connected and Customer Driven, with each of the five categories having broadly equal weighting. The HR Committee considers performance against the balanced scorecard and also takes into account affordability (in light of Group performance) in approving the pool spend.
The Board has assessed ANZ’s overall 2015 performance as above, on or below target for each category within the balanced scorecard of measures. The Board has given full consideration to the performance of the Group and the Disclosed Executives in determining their rewards. Overall spend approved by the Board for the main annual variable remuneration pool was below target levels with a range of underlying outcomes for individuals, in line with ANZ’s objectives of differentiating reward based on performance.
The following provides key measures within each category of the balanced scorecard used in 2015 for assessing performance for the purpose of determining annual variable remuneration pools.
| Category
|
Measure
|
Outcome1
| ||
| High Performing | Below Target: | |||
| Revenue | Revenue of $20,518 million, up 5% on 2014. Strong growth in Australia and New Zealand divisions was moderated by lower growth in International and Institutional Banking – reflecting both the challenging conditions along with decisions taken to restrict Risk Weighted Assets growth and also to forego some lower margin Financial Institutions Trade business – and in Global Wealth, where 2014 benefited from the Trustees’ sale. | |||
| Economic profit2 | Economic profit of $2,381 million (determined using an 11% Cost of Capital), was down 13% year on year due to higher capital holding in preparation for regulatory capital changes. | |||
| Return on equity (ROE) | Cash ROE of 14.0% was down from 15.4% in 2014 due to growth in cash profit being more than offset by higher capital growth on the back of capital raisings and the dilutive impact of a weakening AUD.
| |||
| Cash earnings per share (EPS)
|
Cash EPS of 260.3 cents, in line with 2014, and reflects the impact of share issuances from the capital raising and interim dividend discounted reinvestment plan. | |||
|
Most Respected |
Above Target: | |||
| Workforce diversity | Workforce diversity is core to delivering on our super regional strategy. The percentage of management roles filled by women has increased from 39.2% to 40.4% year on year.3 ANZ is continually focused on increasing the diversity of its workforce. | |||
| Employee engagement | An engaged workforce is regarded as an important driver of sustainable long term performance. Despite continuing challenging business conditions and significant bank-wide changes over the year, employee engagement has improved to 76% in 2015 compared to 73% in 2014. | |||
| Senior leaders as role models | The overall assessment of Senior Leaders as role models of our values has remained steady at 71% year on year.
| |||
| Well Managed | On Target: | |||
| Maintain strong credit rating | Maintained a strong credit rating at AA which is fundamental to the ongoing stability of the Group. | |||
| Core funding ratio (CFR) | Maintained a strong CFR of 94.9%, through disciplined balance sheet management. | |||
| Cost to income ratio | Cost to income ratio of 45.6% increased 90bps due to slower revenue growth in International and Institutional Banking and the cost of hedging our foreign currency denominated profits being a reduction against revenue, and increased depreciation and amortisation. | |||
| Number of repeat adverse internal audit ratings | ANZ Global Internal Audit conducts an ongoing and rigorous review process to identify weaknesses in procedures and compliance with policies. In 2015 there were no repeat adverse audit ratings.
| |||
DIRECTORS’ REPORT 43
DIRECTORS’ REPORT (continued)
| Category
|
Measure
|
Outcome1
| ||
| Best Connected | On Target: | |||
| Growth in Asia Pacific, Europe and America (APEA) | ANZ aspires to be the most respected bank in the Asia Pacific region by using super regional connectivity to better meet the needs of customers which are increasingly linked to regional capital, trade and wealth flows. One important measure of the success of the super regional strategy is the growth in total Network revenues (revenue arising from having a meaningful business in APEA regardless of whether the revenue is subsequently booked within the region or in Australia or New Zealand). APEA Network revenue accounted for 25% of Group revenue in 2015. | |||
| Growth in cross-border revenue | Growth in cross-border revenue improved from 2% to 3.9% highlighting the strength of our regional networks. | |||
| Growth in products per customer | In 2015, products per customer increased in Australia, New Zealand and Wealth divisions with International and Institutional Banking remaining stable.
| |||
| Customer Driven | On Target: | |||
| Customer satisfaction (based on external survey outcomes) | ANZ tracks customer satisfaction across its businesses as part of a group of indicators of longer term performance trends. ANZ aims to achieve top quartile customer satisfaction scores in each business based on external surveys. | |||
| In 2015, customer satisfaction in Australia Retail has decreased slightly, but market share has increased, and Corporate and Commercial segment maintained a stable customer satisfaction score. | ||||
| Customer satisfaction in New Zealand has improved across Personal, Commercial and Rural customer segments whilst also increasing market share. | ||||
| International and Institutional Banking has achieved #1 ranking in terms of customer satisfaction (Peter Lee Surveys) in APEA and New Zealand. | ||||
| Wealth customer satisfaction increased in both ANZ Financial Planning and Direct Channels.
| ||||
| 1 | The outcomes of these key measures are derived from unaudited financial and non-financial information. |
| 2 | Economic profit is an unaudited risk adjusted profit measure determined by adjusting cash profit for economic credit costs, the benefit of imputation credits and the cost of capital. |
| 3 | Includes all employees regardless of leave status but not contractors (which are included in FTE). |
7.3 LTVR – PERFORMANCE AND OUTCOMES
The following provides the vesting outcomes for LTVR performance rights granted to the CEO and Disclosed Executives (excluding the CRO) in November/December 2011 which reached the end of the performance period in November/December 2014.
TABLE 3: LTVR PERFORMANCE RIGHTS HURDLE OUTCOMES
| Recipients | Type | Hurdle | Grant date | First date exercisable |
ANZ TSR % |
Median TSR % |
Vested % | Lapsed % | ||||||||
| CEO |
LTVR performance rights | Relative TSR – Select financial services | 16-Dec-11 | 16-Dec-14 | 87.83% | 93.95% | 0% | 100% | ||||||||
| Executives |
LTVR performance rights | Relative TSR – Select financial services | 14-Nov-11 | 13-Nov-14 | 89.65% | 96.59% | 0% | 100% |
44
ANZ ANNUAL REPORT 2015
8. 2015 Remuneration
8.1 NON-EXECUTIVE DIRECTORS (NEDS)
Principles underpinning the remuneration policy for NEDs.
| Principle
|
Comment
| |
| Aggregate Board and Committee fees are within the maximum annual aggregate limit approved by shareholders
|
The current aggregate fee pool for NEDs of $4 million was approved by shareholders at the 2012 Annual General Meeting. The annual total of NEDs’ fees, including superannuation contributions, is within this agreed limit. | |
|
Fees are set by reference to key considerations |
Board and Committee fees are set by reference to a number of relevant considerations including: | |
|
u general industry practice and best principles of corporate governance; | ||
|
u the responsibilities and risks attached to the role of NEDs; | ||
|
u the time commitment expected of NEDs on Group and Company matters; and | ||
|
u fees paid to NEDs of comparable companies. | ||
|
ANZ compares NED fees to a comparator group of Australian listed companies with a similar size market capitalisation, with particular focus on the major financial services institutions. This is considered an appropriate group, given similarity in size, nature of work and time commitment required by NEDs.
| ||
|
The remuneration structure preserves independence whilst aligning interests of NEDs and shareholders
|
So that independence and impartiality is maintained, fees are not linked to the performance of the Company and NEDs are not eligible to participate in any of the Group’s variable remuneration arrangements. |
Components of NED Remuneration
NEDs receive a base fee for being a Director of the Board, and additional fees for either chairing or being a member of a Board Committee. The Chairman of the Board does not receive additional fees for service on a Board Committee.
NEDs also receive superannuation contributions in accordance with the current Superannuation Guarantee legislation (up to the Government’s prescribed maximum contributions limit) which satisfies the Company’s statutory superannuation contributions.
Based on an independent assessment of market practice the Board elected to increase the ANZ Chairman fee and NED base fee as shown below. All Committee Chair and Committee Member fees remained unchanged for 2015.
| Elements | Details | |||||||
| Board/Committee fees per annum | Year | Fee | ||||||
|
| ||||||||
| Board Chairman Fee1 |
2015 | $810,000 | (including superannuation) | |||||
| 2014 |
$802,000 |
(including superannuation) | ||||||
|
| ||||||||
| Board NED Base Fee |
2015 | $235,000 | (including superannuation) | |||||
| 2014 |
$230,000 |
(including superannuation) | ||||||
|
| ||||||||
| Committee Fees
|
Year
|
Committee Chair
|
Committee Member
| |||||
|
| ||||||||
| Audit |
2015 |
$65,000 |
$32,500 | |||||
|
| ||||||||
| Governance |
2015 |
$35,000 |
$15,000 | |||||
|
| ||||||||
| Human Resources |
2015 |
$55,000 |
$25,000 | |||||
|
| ||||||||
| Risk |
2015 |
$60,000 |
$30,000 | |||||
|
| ||||||||
| Technology
|
2015
|
$35,000
|
$15,000
| |||||
|
Post-employment Benefits |
The Chairman and NED base fee structure (included above) are inclusive of superannuation contributions.
| |||||||
| 1 | ANZ Board Chairman is an ex-officio member of all Board Committees and does not receive Committee member fees. |
DIRECTORS’ REPORT 45
DIRECTORS’ REPORT (continued)
NED Shareholding Guidelines
The NED shareholding guidelines require NEDs to accumulate shares, over a five year period from appointment, to the value of 100% (200% for the Chairman) of the NED base fee and to maintain this shareholding while a Director of ANZ. NEDs have agreed that where their holding is below this guideline they will direct a minimum of 25% of their fees each year toward achieving this shareholding.
All NEDs have met or, if appointed within the last five years, are on track to meet their minimum shareholding guidelines requirement.
NED Statutory Remuneration Disclosure
TABLE 4: NED REMUNERATION FOR 2015 AND 2014
| Short-Term NED Benefits | Post-Employment | |||||||||||||||||||
| Financial Year |
Fees1 $ |
Non monetary benefits $ |
Super contributions $ |
Total remuneration2,3 $ |
||||||||||||||||
| Current Non-Executive Directors |
||||||||||||||||||||
| D Gonski4 |
2015 | 791,085 | – | 18,915 | 810,000 | |||||||||||||||
| 2014 | 383,559 | – | 11,837 | 395,396 | ||||||||||||||||
| I Atlas5 |
2015 | 270,460 | – | 18,915 | 289,375 | |||||||||||||||
| 2014 | 3,995 | – | 380 | 4,375 | ||||||||||||||||
| P Dwyer |
2015 | 336,085 | – | 18,915 | 355,000 | |||||||||||||||
| 2014 | 320,524 | – | 18,027 | 338,551 | ||||||||||||||||
| H Lee |
2015 | 306,085 | – | 18,915 | 325,000 | |||||||||||||||
| 2014 | 296,973 | – | 18,027 | 315,000 | ||||||||||||||||
| G Liebelt |
2015 | 331,085 | – | 18,915 | 350,000 | |||||||||||||||
| 2014 | 300,764 | – | 18,027 | 318,791 | ||||||||||||||||
| I Macfarlane |
2015 | 323,585 | – | 18,915 | 342,500 | |||||||||||||||
| 2014 | 319,473 | – | 18,027 | 337,500 | ||||||||||||||||
| J Macfarlane6 |
2015 | 293,585 | – | 18,915 | 312,500 | |||||||||||||||
| 2014 | 103,109 | – | 7,557 | 110,666 | ||||||||||||||||
| Former Non-Executive Directors |
||||||||||||||||||||
| J Morschel7 |
2015 | – | – | – | – | |||||||||||||||
| 2014 | 453,768 | 23,187 | 13,331 | 490,286 | ||||||||||||||||
| G Clark8 |
2015 | – | – | – | – | |||||||||||||||
| 2014 | 64,402 | 4,302 | 4,444 | 73,148 | ||||||||||||||||
| P Hay9 |
2015 | – | – | – | – | |||||||||||||||
| 2014 | 176,692 | 3,065 | 11,138 | 190,895 | ||||||||||||||||
| D Meiklejohn10 |
2015 | – | – | – | – | |||||||||||||||
| 2014 | 68,696 | 9,029 | 4,444 | 82,169 | ||||||||||||||||
| A Watkins11 |
2015 | – | – | – | – | |||||||||||||||
| 2014 | 182,446 | 3,815 | 11,208 | 197,469 | ||||||||||||||||
| Total of all Non-Executive Directors |
2015 | 2,651,970 | – | 132,405 | 2,784,375 | |||||||||||||||
| 2014 | 2,674,401 | 43,398 | 136,447 | 2,854,246 | ||||||||||||||||
| 1 | Fees are the sum of Board fees and Committee fees, as included in the Annual Report. |
| 2 | Long-term benefits and share-based payments are not applicable for the Non-Executive Directors. There were no termination benefits for the Non-Executive Directors in either 2014 or 2015. |
| 3 | Amounts disclosed for remuneration of Directors exclude insurance premiums paid by the Group in respect of Directors’ and officers’ liability insurance contracts. The total premium, which cannot be disclosed because of confidentiality requirements, has not been allocated to the individuals covered by the insurance policy as, based on all available information, the Directors believe that no reasonable basis for such allocation exists. |
| 4 | D Gonski commenced as a Non-Executive Director on 27 February 2014 and as Chairman on 1 May 2014 so 2014 remuneration reflects amounts received for the partial service for the 2014 year. |
| 5 | I Atlas commenced as a Non-Executive Director on 24 September 2014 so 2014 remuneration reflects amounts received for the partial service for the 2014 year. |
| 6 | J Macfarlane commenced as a Non-Executive Director on 22 May 2014 so 2014 remuneration reflects amounts received for the partial service for the 2014 year. |
| 7 | J Morschel retired as Chairman on 30 April 2014 so 2014 remuneration reflects amounts received for the partial service for the 2014 year. Non monetary benefits relate to car parking and gifts on retirement. $90,959 was paid to J Morschel on retirement in relation to his accrued entitlements under the closed ANZ Directors’ Retirement Scheme (not included in table above). |
| 8 | G Clark retired as a Non-Executive Director on 18 December 2013 so 2014 remuneration reflects amounts received for the partial service for the 2014 year. Non monetary benefits relate to gifts on retirement. $123,990 was paid to G Clark on retirement in relation to his accrued entitlements under the closed ANZ Directors’ Retirement Scheme (not included in table above). |
| 9 | P Hay retired as a Non-Executive Director on 30 April 2014 so 2014 remuneration reflects amounts received for the partial service for the 2014 year. Non monetary benefits relate to gifts on retirement. |
| 10 | D Meiklejohn retired as a Non-Executive Director on 18 December 2013 so 2014 remuneration reflects amounts received for the partial service for the 2014 year. Non monetary benefits relate to office space, car parking and gifts on retirement. $96,545 was paid to D Meiklejohn on retirement in relation to his accrued entitlements under the closed ANZ Directors’ Retirement Scheme (not included in table above). |
| 11 | A Watkins retired as a Non-Executive Director on 30 April 2014 so 2014 remuneration reflects amounts received for the partial service for the 2014 year. Non monetary benefits relate to gifts on retirement. |
46
ANZ ANNUAL REPORT 2015
8.2 CHIEF EXECUTIVE OFFICER (CEO)
Actual remuneration provided to the CEO in 2015 is detailed below, with remuneration tables provided in Section 8.5.
Fixed remuneration: The CEO’s fixed remuneration was increased from $3.15 million to $3.4 million effective 1 October 2014. The Board determined that an increase was appropriate to reflect the skills and experience of the CEO noting that no adjustment had been made since October 2010.
AVR: The CEO has a target AVR opportunity of $3.4 million. The actual amount paid can increase or decrease from this number dependent on his performance as CEO and the performance of the organisation as a whole. Specifically, if, in the Board’s view the CEO has performed above/below his targets, the Board may exercise its discretion to increase/decrease the AVR beyond his target payment.
The Board approved the CEO’s 2015 balanced scorecard annual objectives and his longer term strategic goals at the start of the bank financial year and then assessed his performance against these at the end of the bank financial year. The CEO’s AVR payment for 2015 was then determined having regard to his delivery against these objectives including ANZ’s productivity performance and focus on capital efficiency, his demonstration of values led behaviours, as well as progress achieved in relation to ANZ’s long term strategic goals. The AVR payment for 2015 is $4 million with $2.05 million paid in cash and the balance ($1.95 million) awarded as deferred share rights, half deferred for one year and half for two years.
LTVR: At the 2014 Annual General Meeting shareholders approved an LTVR grant of performance rights to the CEO of $3.4 million (using a fair value approach), divided into two equal tranches. The performance condition for each tranche is relative TSR against a set comparator group. Performance will be assessed at the end of the three year performance period commencing 21 November 2014 (with no retesting). The total number of performance rights granted was determined by splitting the LTVR grant value into two equal tranches of $1.7 million each and then dividing these amounts by the fair value (at the start of the performance period) of each tranche. This equated to 119,382 performance rights being allocated for the first tranche and 109,890 performance rights being allocated for the second tranche. The face value of the performance rights at the start of the performance period (based on the five trading day VWAP of the Company’s shares traded on the ASX in the week up to, and including, 21 November 2014, of $31.8908) was $7.3 million.
The CEO has not been awarded an LTVR for 2015 as he will step down as CEO on 31 December 2015.
8.3 INCOMING CHIEF EXECUTIVE OFFICER (CEO)
Fixed remuneration and AVR amounts shown in the remuneration tables in Section 8.5 relate to Mr Elliott’s role as CFO.
The non statutory remuneration table includes an amount relating to the proposed LTVR for Mr Elliott in his capacity as the incoming CEO. The proposed grant has a face value at grant of $2.1 million at 50% vesting and $4.2 million at 100% vesting, subject to shareholder approval at the 2015 Annual General Meeting. LTVR reflects the importance of focusing the incoming CEO on the achievement of longer term strategic objectives and alignment with shareholders interests. The LTVR will be delivered as performance rights split into three equal tranches, two tranches with a separate relative TSR performance hurdle and the third tranche with an Absolute CAGR TSR performance hurdle. Each tranche will be measured independently. The number of performance rights granted to the incoming CEO in each tranche will be determined using an allocation value based on the five trading day VWAP of the Company’s shares traded on the ASX in the week up to, and including, the start of the performance period (18 November 2015) and will not take into account the probability of performance measures being met. The TSR hurdles will be subject to testing after three years, i.e. November 2018 (with no retesting). Further information is provided in the 2015 Annual General Meeting Notice of Meeting.
8.4 DISCLOSED EXECUTIVES
Actual remuneration provided to the Disclosed Executives in 2015 is summarised below, with remuneration tables provided in Section 8.5.
Fixed remuneration: The annual review of ANZ’s fixed remuneration levels for Disclosed Executives identified that most executives were competitively positioned within the market and therefore adjustments were only made to three executives (Mr Currie, Ms Phillips and Mr Williams).
AVR: All variable remuneration awarded in the 2015 financial year related to performance from the 2014 financial year.
In determining AVR outcomes each year the Board take into consideration overall Company performance against the balanced scorecard of measures, along with individual performance against set objectives.
Overall, the total amount of AVR payments to Disclosed Executives for the 2015 year (which are paid/granted in the 2016 financial year) are flat or slightly lower as a percentage of target than for the 2014 year reflecting a solid performance.
LTVR: LTVR performance rights granted to Disclosed Executives during the 2015 financial year were allocated in November 2014 in two tranches (using a fair value approach). Each tranche is subject to meeting the relative TSR performance hurdle of that tranche, measured over a three year performance period commencing 21 November 2014. The CRO received LTVR deferred share rights.
For awards to be allocated in November 2015, the Board elected to grant LTVR to Disclosed Executives below, at or above target. LTVR reflects the importance of focusing Disclosed Executives on the achievement of longer term strategic objectives and the alignment with shareholders interests. It also recognises the capabilities of these individuals and the need to retain their expertise over the longer term. The LTVR will be delivered as performance rights using the same approach as for the incoming CEO as detailed in Section 8.3 Incoming Chief Executive Officer (CEO), except for the CRO who will receive LTVR deferred share rights.
DIRECTORS’ REPORT 47
DIRECTORS’ REPORT (continued)
8.5 REMUNERATION TABLES – CEO AND DISCLOSED EXECUTIVES
Table 5: Non Statutory Remuneration Disclosure has been prepared to provide shareholders with a view of remuneration structure and how remuneration was paid or communicated to the CEO and Disclosed Executives for 2014 and 2015. The Board believes presenting information in this way provides the shareholder with increased clarity and transparency of the CEO and Disclosed Executives’ remuneration, clearly showing the amounts awarded for each remuneration component (fixed remuneration, AVR and LTVR) within the financial year as well as the amounts actually received. Details of prior year awards which may have vested in 2014 and 2015 are provided in the footnotes.
| Individuals included in table
|
Fixed remuneration
|
Non monetary benefits
|
Retirement benefits
| |||||
| NON STATUTORY REMUNERATION DISCLOSURE TABLE | CEO and Current Disclosed Executives
(pro-rated for period of year as a KMP) |
Total of cash salary and superannuation contributions | Non monetary benefits which typically consist of company-funded benefits and fringe benefits tax payable on these benefits | Not included | ||||
| STATUTORY REMUNERATION DISCLOSURE TABLE | CEO, Current and Former Disclosed Executives
(pro-rated for period of year as a KMP) |
Cash salary (including any reductions made in relation to the utilisation of ANZ’s Lifestyle Leave Policy) and superannuation contributions |
As above | Retirement benefit accrued during the year. This relates to a retirement allowance available to individuals employed prior to Nov 1992. | ||||
| 1 | Subject to Shareholder approval for the incoming CEO. |
| TABLE 5: | NON STATUTORY REMUNERATION DISCLOSURE – CEO AND CURRENT DISCLOSED EXECUTIVE REMUNERATION FOR 2015 AND 2014 |
Fixed |
||||||||||||||||||||||
| Financial Year
|
Remuneration $ |
Non monetary benefits $ |
Cash $ |
Deferred as equity $ |
||||||||||||||||||||
| CEO and Current Disclosed Executives |
||||||||||||||||||||||||
| M Smith3 |
2015 | 3,400,000 | 204,530 | 2,050,000 | 1,950,000 | |||||||||||||||||||
| Chief Executive Officer |
2014 | 3,150,000 | 170,019 | 2,050,000 | 1,950,000 | |||||||||||||||||||
| A Currie4 |
2015 | 1,100,000 | 16,537 | 1,000,000 | 900,000 | |||||||||||||||||||
| Chief Operating Officer |
2014 | 1,000,000 | 15,938 | 950,000 | 850,000 | |||||||||||||||||||
| S Elliott5 |
2015 | 1,250,000 | 17,037 | 1,300,000 | 1,200,000 | |||||||||||||||||||
| Chief Financial Officer |
2014 | 1,250,000 | 20,663 | 1,300,000 | 1,200,000 | |||||||||||||||||||
| A Géczy6 |
2015 | 1,250,000 | 856,640 | 850,000 | 750,000 | |||||||||||||||||||
| Chief Executive Officer, International & Institutional Banking | 2014 | 1,250,000 | 337,718 | 900,000 | 800,000 | |||||||||||||||||||
| D Hisco7 |
2015 | 1,181,243 | 439,790 | 1,162,631 | 1,062,631 | |||||||||||||||||||
| Chief Executive Officer, New Zealand | 2014 | 1,165,493 | 430,342 | 1,150,083 | 1,050,082 | |||||||||||||||||||
| G Hodges8 |
2015 | 1,050,000 | 18,448 | 800,000 | 700,000 | |||||||||||||||||||
| Deputy Chief Executive Officer |
2014 | 1,050,000 | 19,166 | 800,000 | 700,000 | |||||||||||||||||||
| J Phillips9 |
2015 | 1,050,000 | 156,957 | 900,000 | 800,000 | |||||||||||||||||||
| Chief Executive Officer, Global Wealth and Group Managing Director, Marketing, Innovation and Digital | 2014 | 1,000,000 | 5,500 | 900,000 | 800,000 | |||||||||||||||||||
| M Whelan10 |
2015 | 500,000 | 5,625 | 500,000 | 400,000 | |||||||||||||||||||
| Chief Executive Officer, Australia | ||||||||||||||||||||||||
| N Williams11 |
2015 | 1,350,000 | 21,441 | 1,000,000 | 900,000 | |||||||||||||||||||
| Chief Risk Officer |
2014 | 1,250,000 | 18,551 | 950,000 | 850,000 | |||||||||||||||||||
| 1 | The possible range of AVR is between 0 and 2 times target AVR. The actual AVR received is dependent on ANZ and individual performance. Anyone who received less than 100% of target forfeited the rest of their AVR entitlement. The minimum value is nil and the maximum value is what was actually paid. |
| 2 | Total Remuneration assumes LTVR face value at 50% vesting. |
| 3 | M Smith – Non monetary benefits include car parking, life insurance and taxation services. In 2015 equity to the value of $2,149,382 vested in respect of previously disclosed deferred AVR granted in November 2012 and November 2013. Deferred LTVR which was granted in December 2011 and previously disclosed, lapsed in December 2014. |
| 4 | A Currie – Non monetary benefits include car parking and taxation services. In 2015 equity to the value of $732,721 vested in respect of deferred AVR granted in November 2012 and November 2013, and equity to the value of $763,011 vested in respect of deferred LTVR granted in November 2011. |
| 5 | S Elliott – Non monetary benefits include car parking and taxation services. In 2015 equity to the value of $1,243,525 vested in respect of previously disclosed deferred AVR granted in November 2012 and November 2013. Deferred LTVR which was granted in November 2011 and previously disclosed, lapsed in November 2014. The 2015 LTVR relates to the proposed LTVR grant as incoming CEO, subject to approval by shareholders at the 2015 Annual General Meeting. |
| 6 | A Géczy – Non monetary benefits include relocation expenses, car parking and taxation services. |
48
ANZ ANNUAL REPORT 2015
The information provided in Table 5 is non statutory information and differs from the information provided in Table 6: Statutory Remuneration Disclosure, which has been prepared in accordance with Australian Accounting Standards. A description of the difference between the two tables in relation to the 2015 financial year information is provided below:
| Long service leave accrual | Annual Variable Remuneration (AVR) | Long Term Variable Remuneration (LTVR) |
Other equity allocations | |||
| Not included | AVR awarded in Nov 2015 for the 2015 financial year – expressed as a cash value plus a deferred equity grant value | Award value of LTVR granted in Nov/Dec1 2015 | Not included | |||
| The equity allocation value multiplied by the number of instruments granted equals the AVR/LTVR deferred equity dollar value
|
||||||
| Long service leave accrued during the year | Includes cash AVR (Nov 2015 element only) under total cash incentive and amortised AVR for deferred equity from current and prior year
Amortised AVR values relate to AVR awards made in Nov 2012, 2013, 2014 and to be granted in Nov 2015 |
Amortised LTVR values relate to LTVR awards made in Nov/Dec 2011, 2012, 2013 and 2014 | Amortised values for equity awards made in prior years, such as Employee Share Offer, excluding AVR and LTVR awards | |||
| Equity is amortised over the vesting period of the award.
| ||||||
| AVR | LTVR | Total Remuneration2 | ||||||||||||||||||||||||||||||
| Total $ |
As % of target % |
As % of maximum opportunity1 % |
Face value at $ |
Face value at 100% vesting $ |
Total $ |
Deferred as equity $ |
Received $ |
|||||||||||||||||||||||||
| 4,000,000 | 118% | 59% | – | – | 7,604,530 | 1,950,000 | 5,654,530 | |||||||||||||||||||||||||
| 4,000,000 |
127% | 3,400,000 | 7,311,667 | 10,720,019 | 5,350,000 | 5,370,019 | ||||||||||||||||||||||||||
| 1,900,000 | 144% | 72% | 750,000 | 1,500,000 | 3,766,537 | 1,650,000 | 2,116,537 | |||||||||||||||||||||||||
| 1,800,000 |
150% | 750,000 | 1,612,845 | 3,565,938 | 1,600,000 | 1,965,938 | ||||||||||||||||||||||||||
| 2,500,000 | 167% | 83% | 2,100,000 | 4,200,000 | 5,867,037 | 3,300,000 | 2,567,037 | |||||||||||||||||||||||||
| 2,500,000 |
167% | 800,000 | 1,720,349 | 4,570,663 | 2,000,000 | 2,570,663 | ||||||||||||||||||||||||||
| 1,600,000 | 107% | 53% | 800,000 | 1,600,000 | 4,506,640 | 1,550,000 | 2,956,640 | |||||||||||||||||||||||||
| 1,700,000 |
113% | 800,000 | 1,720,349 | 4,087,718 | 1,600,000 | 2,487,718 | ||||||||||||||||||||||||||
| 2,225,262 | 157% | 78% | 699,264 | 1,398,528 | 4,545,559 | 1,761,895 | 2,783,664 | |||||||||||||||||||||||||
| 2,200,165 |
157% | 699,260 | 1,503,715 | 4,495,260 | 1,749,342 | 2,745,918 | ||||||||||||||||||||||||||
| 1,500,000 | 119% | 60% | 500,000 | 1,000,000 | 3,068,448 | 1,200,000 | 1,868,448 | |||||||||||||||||||||||||
| 1,500,000 |
119% | 500,000 | 1,075,230 | 3,069,166 | 1,200,000 | 1,869,166 | ||||||||||||||||||||||||||
| 1,700,000 | 135% | 67% | 700,000 | 1,400,000 | 3,606,957 | 1,500,000 | 2,106,957 | |||||||||||||||||||||||||
| 1,700,000 |
142% | 700,000 | 1,505,310 | 3,405,500 | 1,500,000 | 1,905,500 | ||||||||||||||||||||||||||
| 900,000 | 161% | 81% | 350,000 | 700,000 | 1,755,625 | 750,000 | 1,005,625 | |||||||||||||||||||||||||
| 1,900,000 | 117% | 78% | 750,000 | 4,021,441 | 1,650,000 | 2,371,441 | ||||||||||||||||||||||||||
| 1,800,000 |
120% |
|
750,000 |
|
3,818,551 | 1,600,000 | 2,218,551 | |||||||||||||||||||||||||
| 7 | D Hisco – 2014 and 2015 remuneration value in the table represents his NZD remuneration converted to AUD at the average exchange rate for the 2014 and 2015 financial years respectively. Non monetary benefits include expenses related to his assignment to New Zealand, car parking and taxation services. In 2015 equity to the value of $1,095,173 vested in respect of previously disclosed deferred AVR granted in November 2012 and November 2013. Deferred LTVR which was granted in November 2011 and previously disclosed, lapsed in November 2014. D Hisco also received shares to the value of $740 in relation to the Employee Share Offer in December 2014 and will receive shares to the value of $736 in relation to the Employee Share Offer in December 2015. |
| 8 | G Hodges – Non monetary benefits include car parking and taxation services. In 2015 equity to the value of $646,299 vested in respect of previously disclosed deferred AVR granted in November 2012 and November 2013. Deferred LTVR which was granted in November 2011 and previously disclosed, lapsed in November 2014. |
| 9 | J Phillips – Relocated to Sydney in 2015. Non monetary benefits include relocation expenses, car parking and taxation services. In 2015 equity to the value of $658,846 vested in respect of previously disclosed deferred AVR granted in November 2012 and November 2013. Deferred LTVR which was granted in 2011 and previously disclosed, lapsed in November 2014. |
| 10 | M Whelan – Commenced in a Disclosed Executive role on 3 April 2015 so 2015 remuneration reflects amounts prorated for the partial service year. Non monetary benefits comprise car parking. |
| 11 | N Williams – Non monetary benefits include car parking and taxation services. In 2015 equity to the value of $750,313 vested in respect of deferred AVR granted in November 2012 and November 2013 and equity to the value of $763,011 vested in respect of deferred LTVR granted in November 2011. (LTVR is delivered as unhurdled deferred share rights and is not subject to meeting TSR performance hurdles). |
DIRECTORS’ REPORT 49
DIRECTORS’ REPORT (continued)
TABLE 6: STATUTORY REMUNERATION DISCLOSURE – CEO AND DISCLOSED EXECUTIVE REMUNERATION FOR 2015 AND 2014
| Short-Term Employee Benefits
|
Post-Employment
|
|||||||||||||||||||||||
| Financial
|
Cash salary1 $ |
Non monetary $ |
Total cash incentive3,4 $ |
Super contributions5 $ |
Retirement $ |
|||||||||||||||||||
| CEO and Current Disclosed Executives |
||||||||||||||||||||||||
| M Smith |
2015 | 3,308,557 | 204,530 | 2,050,000 | 91,443 | – | ||||||||||||||||||
| Chief Executive Officer |
2014 | 3,150,000 | 170,019 | 2,050,000 | – | – | ||||||||||||||||||
| A Currie |
2015 | 966,112 | 16,537 | 1,000,000 | 95,434 | – | ||||||||||||||||||
| Chief Operating Officer |
2014 | 879,723 | 15,938 | 950,000 | 85,191 | – | ||||||||||||||||||
| S Elliott |
2015 | 1,141,553 | 17,037 | 1,300,000 | 108,447 | – | ||||||||||||||||||
| Chief Financial Officer |
2014 | 1,143,512 | 20,663 | 1,300,000 | 106,488 | – | ||||||||||||||||||
| A Géczy |
2015 | 1,141,553 | 856,640 | 850,000 | 108,447 | – | ||||||||||||||||||
| Chief Executive Officer, International |
2014 | 1,143,512 | 337,718 | 900,000 | 106,488 | – | ||||||||||||||||||
| & Institutional Banking |
||||||||||||||||||||||||
| D Hisco10 |
2015 | 1,181,243 | 439,790 | 1,162,631 | – | 8,529 | ||||||||||||||||||
| Chief Executive Officer, New Zealand |
2014 | 1,165,493 | 430,342 | 1,150,083 | – | 61,805 | ||||||||||||||||||
| G Hodges |
2015 | 958,904 | 18,448 | 800,000 | 91,096 | 4,565 | ||||||||||||||||||
| Deputy Chief Executive Officer |
2014 | 960,550 | 19,166 | 800,000 | 89,450 | 7,945 | ||||||||||||||||||
| J Phillips |
2015 | 958,904 | 156,957 | 900,000 | 91,096 | – | ||||||||||||||||||
| Chief Executive Officer, Global Wealth |
2014 | 914,809 | 5,500 | 900,000 | 85,191 | – | ||||||||||||||||||
| and Group Managing Director, |
||||||||||||||||||||||||
| Marketing, Innovation and Digital |
||||||||||||||||||||||||
| M Whelan11 |
2015 | 456,621 | 5,625 | 500,000 | 43,379 | – | ||||||||||||||||||
| Chief Executive Officer, Australia |
||||||||||||||||||||||||
| N Williams |
2015 | 1,232,877 | 21,441 | 1,000,000 | 117,123 | 13,830 | ||||||||||||||||||
| Chief Risk Officer |
2014 | 1,143,512 | 18,551 | 950,000 | 106,488 | 25,251 | ||||||||||||||||||
| Former Disclosed Executives |
||||||||||||||||||||||||
| P Chronican12 |
2015 | 1,484,018 | 17,163 | 300,000 | 140,982 | – | ||||||||||||||||||
| Chief Executive Officer, Australia |
2014 | 1,189,252 | 15,938 | 925,000 | 110,748 | – | ||||||||||||||||||
| Total of all Executive KMPs13 |
2015 | 12,830,342 | 1,754,168 | 9,862,631 | 887,447 | 26,924 | ||||||||||||||||||
| 2014 | 11,690,363 | 1,033,835 | 9,925,083 | 690,044 | 95,001 | |||||||||||||||||||
| 1 | Cash salary includes adjustments made in relation to the utilisation of ANZ’s Lifestyle Leave Policy, where applicable. |
| 2 | Non monetary benefits generally consist of company-funded benefits such as car parking and taxation services. This item also includes costs met by the company in relation to relocation, gifts received on leaving ANZ for former Disclosed Executives, and life insurance for the CEO. The fringe benefits tax payable on any benefits is also included in this item. |
| 3 | The total cash incentive relates to the cash component only, with the relevant amortisation of the AVR deferred components included in share-based payments and amortised over the vesting period. The total AVR was approved by the Board on 27 October 2015. 100% of the cash component of the AVR awarded for the 2014 and 2015 years vested to the Disclosed Executive in the applicable financial year. |
| 4 | The possible range of AVR is between 0 and 2 times target AVR. The actual AVR received is dependent on ANZ and individual performance. The 2015 AVR awarded (cash and equity component) as a percentage of target AVR was: M Smith 118% (2014: 127%); A Currie 144% (2014: 150%); S Elliott 167% (2014:167%); A Géczy 107% (2014: 113%); D Hisco 157% (2014: 157%); G Hodges 119% (2014: 119%); J Phillips 135% (2014: 142%); M Whelan 161%; N Williams 117% (2014: 120%) and P Chronican 64% (2014: 112%). Anyone who received less than 100% of target forfeited the rest of their AVR entitlement. The minimum value is nil and the maximum value is what was actually paid. |
| 5 | For all Australian based Disclosed Executives, the superannuation contribution reflects the Superannuation Guarantee Contribution – individuals may elect to take this contribution as superannuation or a combination of superannuation and cash. The amount for M Smith reflects a part year superannuation contribution made during 2015. |
| 6 | Accrual relates to Retirement Allowance. As a result of being employed with ANZ prior to November 1992, D Hisco, G Hodges and N Williams are eligible to receive a Retirement Allowance on retirement, retrenchment, death, or resignation for illness, incapacity or domestic reasons. The Retirement Allowance is calculated as follows: three months of preserved notional salary (which is 65% of Fixed Remuneration) plus an additional 3% of notional salary for each year of full time service above 10 years, less the total accrual value of long service leave (including taken and untaken). |
| 7 | In accordance with the requirements of AASB 2 Share-based payments, the amortisation value includes a proportion of the fair value (taking into account market-related vesting conditions) of all equity that had not yet fully vested as at the commencement of the financial year. The fair value is determined at grant date and is allocated on a straight-line basis over the relevant vesting period. The amount included as remuneration is not related to nor indicative of the benefit (if any) that may ultimately be realised should the equity become exercisable. |
| 8 | Remuneration amounts disclosed exclude insurance premiums paid by the consolidated entity in respect of directors’ and officers’ liability insurance contracts which cover current and former KMP of the controlled entities. The total premium, which cannot be disclosed because of confidentiality requirements, has not been allocated to the individuals covered by the insurance policy as, based on all available information, the directors believe that no reasonable basis for such allocation exists. |
50
ANZ ANNUAL REPORT 2015
| Long-Term Employee Benefits |
Share-Based Payments7
|
|||||||||||||||||||||||||||
| Total amortisation value of | ||||||||||||||||||||||||||||
| AVR
|
LTVR
|
Other equity allocations
|
||||||||||||||||||||||||||
|
Long service leave the year $ |
Shares $ |
Rights $ |
Shares $ |
Rights $ |
Shares $ |
Termination benefits $ |
Grand total remuneration8,9 $ |
|||||||||||||||||||||
| 78,054 | 1,172,496 | 767,058 | – | 3,170,182 | – | – | 10,842,320 | |||||||||||||||||||||
| 47,073 | 1,893,344 | – | – | 3,133,587 | – | – | 10,444,023 | |||||||||||||||||||||
| 25,567 | 823,673 | – | 20,306 | 713,982 | – | – | 3,661,611 | |||||||||||||||||||||
| 14,983 | 717,821 | – | 195,545 | 463,757 | – | – | 3,322,958 | |||||||||||||||||||||
| 18,940 | 1,191,554 | – | – | 988,004 | – | – | 4,765,535 | |||||||||||||||||||||
| 18,752 | 1,134,313 | – | – | 922,786 | – | – | 4,646,514 | |||||||||||||||||||||
| 18,940 | 608,406 | – | – | 436,929 | – | – | 4,020,915 | |||||||||||||||||||||
| 18,938 | 313,878 | – | – | 178,321 | – | – | 2,998,855 | |||||||||||||||||||||
| 25,130 | – | 1,028,252 | – | 619,810 | 466 | – | 4,465,851 | |||||||||||||||||||||
| 62,038 | – | 790,752 | – | 548,048 | 217 | – | 4,208,778 | |||||||||||||||||||||
| 15,910 | 670,413 | – | – | 496,497 | – | – | 3,055,833 | |||||||||||||||||||||
| 32,355 | 611,759 | – | – | 495,131 | – | – | 3,016,356 | |||||||||||||||||||||
| 19,779 | 753,726 | – | – | 553,742 | – | – | 3,434,204 | |||||||||||||||||||||
| 15,010 | 658,421 | – | – | 493,171 | – | – | 3,072,102 | |||||||||||||||||||||
| 22,550 | 259,248 | – | 204,251 | 61,893 | – | – | 1,553,567 | |||||||||||||||||||||
| 65,795 | 841,966 | – | 20,306 | 664,022 | – | – | 3,977,360 | |||||||||||||||||||||
| 127,499 | 745,149 | – | 183,979 | 413,799 | – | – | 3,714,228 | |||||||||||||||||||||
| – | 719,083 | 200,000 | – | 818,698 | – | 104,145 | 3,784,089 | |||||||||||||||||||||
| 19,525 | 848,607 | – | – | 657,940 | – | – | 3,767,010 | |||||||||||||||||||||
| 290,665 | 7,040,565 | 1,995,310 | 244,863 | 8,523,759 | 466 | 104,145 | 43,561,285 | |||||||||||||||||||||
| 356,173 | 6,923,292 | 790,752 | 379,524 | 7,306,540 | 217 | – | 39,190,824 | |||||||||||||||||||||
| 9 | While the CEO is an Executive Director, he has been included in this table with the Disclosed Executives. |
| 10 | D Hisco was eligible in 2014 and 2015 to receive shares in relation to the Employee Share Offer, which provides a grant of ANZ shares in each financial year to eligible employees subject to Board approval. Refer to note 41 Employee Share and Option Plans for further details on the Employee Share Offer. Long service leave accrued during the year includes a one-off long service loyalty award. |
| 11 | M Whelan commenced in a Disclosed Executive role on 3 April 2015 so 2015 remuneration reflects amounts prorated for the partial service year. |
| 12 | P Chronican concluded in role on 2 April 2015 and will be ceasing employment 31 December 2015. Statutory remuneration table reflects his expense up to his date of termination, 31 December 2015 (i.e. shows 15 months of fixed remuneration (noting his annual fixed remuneration for 2015 remained unchanged at $1.3 million) and share-based payments expensed to 31 December 2015). |
| AVR reflects amounts received for the partial service year up to 2 April 2015, date concluded in role. Termination benefits reflect payment for accrued annual leave payable upon termination. |
| 13 | For those Disclosed Executives who were disclosed in both 2014 and 2015, the following are noted: |
| - | M Smith – uplift in year-on-year total remuneration, driven mainly by an increase in salary, non monetary benefits and long service leave accrual. |
| - | A Currie – uplift in year-on-year total remuneration, driven mainly by an increase in salary, cash incentive and amortised value of equity. |
| - | S Elliott – uplift in year-on-year total remuneration, driven by an increase in the amortised value of equity. |
| - | A Géczy – uplift in year-on-year total remuneration, driven by an increase in non monetary benefits and the amortised value of equity. |
| - | D Hisco – uplift in year-on-year total remuneration, driven by an increase in the amortised value of equity. |
| - | G Hodges – minimal change in year-on-year total remuneration. |
| - | J Phillips – uplift in year-on-year total remuneration, driven mainly by an increase in salary, non monetary benefits and amortised value of equity. |
| - | N Williams – uplift in year-on-year total remuneration, driven mainly by an increase in salary, cash incentive and amortised value of equity. |
| - | P Chronican – uplift in year-on-year total remuneration, driven by inclusion of expensing in relation to termination (fixed remuneration for 15 months, expensing of equity and annual leave payable upon termination). |
DIRECTORS’ REPORT 51
DIRECTORS’ REPORT (continued)
9. Equity
All shares underpinning equity awards may be purchased on market, or be newly issued shares or a combination of both. For the 2014 equity granted to the CEO and Disclosed Executives in November/December 2014, all AVR deferred shares were purchased on market and for LTVR performance rights, the approach to satisfying awards will be determined closer to the time of vesting.
9.1 CEO AND DISCLOSED EXECUTIVES EQUITY
Details of deferred shares and rights granted to the CEO and Disclosed Executives during the 2015 year, and granted to the CEO and Disclosed Executives in prior years which vested, were exercised/sold or which lapsed/were forfeited during the 2015 year is set out below.
TABLE 7: CEO AND DISCLOSED EXECUTIVES EQUITY GRANTED, VESTED, EXERCISED/SOLD AND LAPSED/FORFEITED
| Vested | Lapsed/Forfeited | Exercised/Sold | ||||||||||||||||||||||||||||||||||||||||||||||||||||||||||
| Name | Type of equity | Number granted1 |
Grant date |
First date exercisable |
Date of expiry |
Number | % |
Value2 $ |
Number | % |
Value2 $ |
Number | % |
Value2 $ |
Vested and exercisable as at 30 Sep 20153 |
Unexer -cisable | ||||||||||||||||||||||||||||||||||||||||||||
| CEO and Current Disclosed Executives | ||||||||||||||||||||||||||||||||||||||||||||||||||||||||||||
| M Smith4 |
AVR deferred shares | 36,334 | 12-Nov-12 | 12-Nov-14 | – | 36,334 | 100 | 1,171,466 | – | – | – | (36,334 | ) | 100 | 1,223,064 | – | – | |||||||||||||||||||||||||||||||||||||||||||
| AVR deferred shares | 30,709 | 22-Nov-13 | 22-Nov-14 | – | 30,709 | 100 | 977,916 | – | – | – | (30,709 | ) | 100 | 1,033,717 | – | – | ||||||||||||||||||||||||||||||||||||||||||||
| AVR deferred shares14 | 30,574 | 21-Nov-14 | 21-Nov-15 | – | – | – | – | – | – | – | – | – | – | – | 30,574 | |||||||||||||||||||||||||||||||||||||||||||||
| AVR deferred shares14 | 30,573 | 21-Nov-14 | 21-Nov-16 | – | – | – | – | – | – | – | – | – | – | – | 30,573 | |||||||||||||||||||||||||||||||||||||||||||||
| LTVR performance rights | 326,424 | 16-Dec-11 | 17-Dec-14 | 16-Dec-16 | – | – | – | (326,424 | ) | 100 | (10,000,619 | ) | – | – | – | – | – | |||||||||||||||||||||||||||||||||||||||||||
| LTVR performance rights15 | 119,382 | 18-Dec-14 | 18-Dec-17 | 18-Dec-19 | – | – | – | – | – | – | – | – | – | – | 119,382 | |||||||||||||||||||||||||||||||||||||||||||||
| LTVR performance rights15 |
109,890 | 18-Dec-14 | 18-Dec-17 | 18-Dec-19 | – | – | – | – | – | – | – | – | – | – | 109,890 | |||||||||||||||||||||||||||||||||||||||||||||
| A Currie5 |
AVR deferred shares | 12,616 | 12-Nov-12 | 12-Nov-14 | – | 12,616 | 100 | 406,760 | – | – | – | (12,616 | ) | 100 | 403,214 | – | – | |||||||||||||||||||||||||||||||||||||||||||
| AVR deferred shares | 10,236 | 22-Nov-13 | 22-Nov-14 | – | 10,236 | 100 | 325,961 | – | – | – | (10,236 | ) | 100 | 325,459 | – | – | ||||||||||||||||||||||||||||||||||||||||||||
| AVR deferred shares14 | 13,327 | 21-Nov-14 | 21-Nov-15 | – | – | – | – | – | – | – | – | – | – | – | 13,327 | |||||||||||||||||||||||||||||||||||||||||||||
| AVR deferred shares14 | 13,327 | 21-Nov-14 | 21-Nov-16 | – | – | – | – | – | – | – | – | – | – | – | 13,327 | |||||||||||||||||||||||||||||||||||||||||||||
| LTVR deferred shares | 23,696 | 14-Nov-11 | 14-Nov-14 | – | 23,696 | 100 | 763,011 | – | – | – | (23,696 | ) | 100 | 757,336 | – | – | ||||||||||||||||||||||||||||||||||||||||||||
| LTVR performance rights15 | 26,334 | 21-Nov-14 | 21-Nov-17 | 21-Nov-19 | – | – | – | – | – | – | – | – | – | – | 26,334 | |||||||||||||||||||||||||||||||||||||||||||||
| LTVR performance rights15 |
24,240 | 21-Nov-14 | 21-Nov-17 | 21-Nov-19 | – | – | – | – | – | – | – | – | – | – | 24,240 | |||||||||||||||||||||||||||||||||||||||||||||
| S Elliott6 |
AVR deferred shares | 20,185 | 12-Nov-12 | 19-Nov-14 | – | 20,185 | 100 | 641,726 | – | – | – | – | – | – | 20,185 | – | ||||||||||||||||||||||||||||||||||||||||||||
| AVR deferred shares | 18,898 | 22-Nov-13 | 22-Nov-14 | – | 18,898 | 100 | 601,799 | – | – | – | – | – | – | 18,898 | – | |||||||||||||||||||||||||||||||||||||||||||||
| AVR deferred shares14 | 18,815 | 21-Nov-14 | 21-Nov-15 | – | – | – | – | – | – | – | – | – | – | – | 18,815 | |||||||||||||||||||||||||||||||||||||||||||||
| AVR deferred shares14 | 18,814 | 21-Nov-14 | 21-Nov-16 | – | – | – | – | – | – | – | – | – | – | – | 18,814 | |||||||||||||||||||||||||||||||||||||||||||||
| LTVR performance rights | 71,982 | 14-Nov-11 | 14-Nov-14 | 14-Nov-16 | – | – | – | (71,982 | ) | 100 | (2,317,820 | ) | – | – | – | – | – | |||||||||||||||||||||||||||||||||||||||||||
| LTVR performance rights15 | 28,089 | 21-Nov-14 | 21-Nov-17 | 21-Nov-19 | – | – | – | – | – | – | – | – | – | – | 28,089 | |||||||||||||||||||||||||||||||||||||||||||||
| LTVR performance rights15 |
25,856 | 21-Nov-14 | 21-Nov-17 | 21-Nov-19 | – | – | – | – | – | – | – | – | – | – | 25,856 | |||||||||||||||||||||||||||||||||||||||||||||
| A Géczy7 |
AVR deferred shares14 | 12,543 | 21-Nov-14 | 21-Nov-15 | – | – | – | – | – | – | – | – | – | – | – | 12,543 | ||||||||||||||||||||||||||||||||||||||||||||
| AVR deferred shares14 | 12,543 | 21-Nov-14 | 21-Nov-16 | – | – | – | – | – | – | – | – | – | – | – | 12,543 | |||||||||||||||||||||||||||||||||||||||||||||
| LTVR performance rights15 | 28,089 | 21-Nov-14 | 21-Nov-17 | 21-Nov-19 | – | – | – | – | – | – | – | – | – | – | 28,089 | |||||||||||||||||||||||||||||||||||||||||||||
| LTVR performance rights15 |
25,856 | 21-Nov-14 | 21-Nov-17 | 21-Nov-19 | – | – | – | – | – | – | – | – | – | – | 25,856 | |||||||||||||||||||||||||||||||||||||||||||||
| D Hisco8 |
LTVR deferred shares | 23,243 | 31-Oct-08 | 31-Oct-11 | – | – | – | – | – | – | – | (7,243 | ) | 31 | 234,532 | 16,000 | – | |||||||||||||||||||||||||||||||||||||||||||
| Employee Share Offer | 23 | 04-Dec-14 | 04-Dec-17 | – | – | – | – | – | – | – | – | – | – | – | 23 | |||||||||||||||||||||||||||||||||||||||||||||
| AVR deferred share rights | 18,382 | 12-Nov-12 | 12-Nov-14 | 12-Nov-16 | 18,382 | 100 | 592,665 | – | – | – | (18,382 | ) | 100 | 654,622 | – | – | ||||||||||||||||||||||||||||||||||||||||||||
| AVR deferred share rights | 15,780 | 22-Nov-13 | 22-Nov-14 | 21-Nov-16 | 15,780 | 100 | 502,508 | – | – | – | (15,780 | ) | 100 | 561,959 | – | – | ||||||||||||||||||||||||||||||||||||||||||||
| AVR deferred share rights14 | 17,408 | 21-Nov-14 | 21-Nov-15 | 21-Nov-17 | – | – | – | – | – | – | – | – | – | – | 17,408 | |||||||||||||||||||||||||||||||||||||||||||||
| AVR deferred share rights14 | 18,370 | 21-Nov-14 | 21-Nov-16 | 21-Nov-18 | – | – | – | – | – | – | – | – | – | – | 18,370 | |||||||||||||||||||||||||||||||||||||||||||||
| LTVR performance rights | 55,370 | 14-Nov-11 | 14-Nov-14 | 14-Nov-16 | – | – | – | (55,370 | ) | 100 | (1,782,914 | ) | – | – | – | – | – | |||||||||||||||||||||||||||||||||||||||||||
| LTVR performance rights15 | 24,552 | 21-Nov-14 | 21-Nov-17 | 21-Nov-19 | – | – | – | – | – | – | – | – | – | – | 24,552 | |||||||||||||||||||||||||||||||||||||||||||||
| LTVR performance rights15 |
22,600 | 21-Nov-14 | 21-Nov-17 | 21-Nov-19 | – | – | – | – | – | – | – | – | – | – | 22,600 | |||||||||||||||||||||||||||||||||||||||||||||
52
ANZ ANNUAL REPORT 2015
| Vested | Lapsed/Forfeited | Exercised/Sold | ||||||||||||||||||||||||||||||||||||||||||||||||||||||||||
| Name | Type of equity | Number granted1 |
Grant date |
First date exercisable |
Date of expiry |
Number | % |
Value2 $ |
Number | % |
Value2 $ |
Number | % |
Value2 $ |
Vested and exercisable as at 30 Sep 20153 |
Unexer -cisable | ||||||||||||||||||||||||||||||||||||||||||||
| G Hodges9 |
AVR deferred shares | 11,102 | 12-Nov-12 | 12-Nov-14 | – | 11,102 | 100 | 357,946 | – | – | – | – | – | – | 11,102 | – | ||||||||||||||||||||||||||||||||||||||||||||
| AVR deferred shares | 9,055 | 22-Nov-13 | 22-Nov-14 | – | 9,055 | 100 | 288,353 | – | – | – | – | – | – | 9,055 | – | |||||||||||||||||||||||||||||||||||||||||||||
| AVR deferred shares14 | 10,975 | 21-Nov-14 | 21-Nov-15 | – | – | – | – | – | – | – | – | – | – | – | 10,975 | |||||||||||||||||||||||||||||||||||||||||||||
| AVR deferred shares14 | 10,975 | 21-Nov-14 | 21-Nov-16 | – | – | – | – | – | – | – | – | – | – | – | 10,975 | |||||||||||||||||||||||||||||||||||||||||||||
| LTVR performance rights | 55,370 | 14-Nov-11 | 14-Nov-14 | 14-Nov-16 | – | – | – | (55,370 | ) | 100 | (1,782,914 | ) | – | – | – | – | – | |||||||||||||||||||||||||||||||||||||||||||
| LTVR performance rights15 | 17,556 | 21-Nov-14 | 21-Nov-17 | 21-Nov-19 | – | – | – | – | – | – | – | – | – | – | 17,556 | |||||||||||||||||||||||||||||||||||||||||||||
| LTVR performance rights15 |
16,160 | 21-Nov-14 | 21-Nov-17 | 21-Nov-19 | – | – | – | – | – | – | – | – | – | – | 16,160 | |||||||||||||||||||||||||||||||||||||||||||||
| J Phillips10 |
AVR deferred shares | 11,102 | 12-Nov-12 | 12-Nov-13 | – | – | – | – | – | – | – | (11,102 | ) | 100 | 353,844 | – | – | |||||||||||||||||||||||||||||||||||||||||||
| AVR deferred shares | 11,102 | 12-Nov-12 | 12-Nov-14 | – | 11,102 | 100 | 357,946 | – | – | – | (11,102 | ) | 100 | 353,844 | – | – | ||||||||||||||||||||||||||||||||||||||||||||
| AVR deferred shares | 9,449 | 22-Nov-13 | 22-Nov-14 | – | 9,449 | 100 | 300,900 | – | – | – | – | – | – | 9,449 | – | |||||||||||||||||||||||||||||||||||||||||||||
| AVR deferred shares14 | 12,543 | 21-Nov-14 | 21-Nov-15 | – | – | – | – | – | – | – | – | – | – | – | 12,543 | |||||||||||||||||||||||||||||||||||||||||||||
| AVR deferred shares14 | 12,543 | 21-Nov-14 | 21-Nov-16 | – | – | – | – | – | – | – | – | – | – | – | 12,543 | |||||||||||||||||||||||||||||||||||||||||||||
| LTVR performance rights | 55,370 | 14-Nov-11 | 14-Nov-14 | 14-Nov-16 | – | – | – | (55,370 | ) | 100 | (1,782,914 | ) | – | – | – | – | – | |||||||||||||||||||||||||||||||||||||||||||
| LTVR performance rights15 | 24,578 | 21-Nov-14 | 21-Nov-17 | 21-Nov-19 | – | – | – | – | – | – | – | – | – | – | 24,578 | |||||||||||||||||||||||||||||||||||||||||||||
| LTVR performance rights15 |
22,624 | 21-Nov-14 | 21-Nov-17 | 21-Nov-19 | – | – | – | – | – | – | – | – | – | – | 22,624 | |||||||||||||||||||||||||||||||||||||||||||||
| M Whelan11 |
– |
– | – | – | – | – | – | – | – | – | – | – | – | – | – | – | ||||||||||||||||||||||||||||||||||||||||||||
| N Williams12 |
AVR deferred shares | 11,606 | 12-Nov-12 | 12-Nov-14 | – | 11,606 | 100 | 374,196 | – | – | – | (11,606 | ) | 100 | 374,196 | – | – | |||||||||||||||||||||||||||||||||||||||||||
| AVR deferred shares | 11,811 | 22-Nov-13 | 22-Nov-14 | – | 11,811 | 100 | 376,117 | – | – | – | (11,811 | ) | 100 | 376,441 | – | – | ||||||||||||||||||||||||||||||||||||||||||||
| AVR deferred shares14 | 13,327 | 21-Nov-14 | 21-Nov-15 | – | – | – | – | – | – | – | – | – | – | – | 13,327 | |||||||||||||||||||||||||||||||||||||||||||||
| AVR deferred shares14 | 13,327 | 21-Nov-14 | 21-Nov-16 | – | – | – | – | – | – | – | – | – | – | – | 13,327 | |||||||||||||||||||||||||||||||||||||||||||||
| LTVR deferred shares | 23,696 | 14-Nov-11 | 14-Nov-14 | – | 23,696 | 100 | 763,011 | – | – | – | (23,696 | ) | 100 | 763,011 | – | – | ||||||||||||||||||||||||||||||||||||||||||||
| LTVR deferred share rights15 | 27,685 | 21-Nov-14 | 21-Nov-17 | 21-Nov-19 | – | – | – | – | – | – | – | – | – | – | 27,685 | |||||||||||||||||||||||||||||||||||||||||||||
| Former Disclosed Executives | ||||||||||||||||||||||||||||||||||||||||||||||||||||||||||||
| P Chronican13 |
AVR deferred shares | 15,139 | 12-Nov-12 | 12-Nov-14 | – | 15,139 | 100 | 488,106 | – | – | – | (15,139 | ) | 100 | 475,427 | – | – | |||||||||||||||||||||||||||||||||||||||||||
| AVR deferred shares | 14,961 | 22-Nov-13 | 22-Nov-14 | – | 14,961 | 100 | 476,427 | – | – | – | (14,961 | ) | 100 | 469,837 | – | – | ||||||||||||||||||||||||||||||||||||||||||||
| AVR deferred shares14 | 12,935 | 21-Nov-14 | 21-Nov-15 | – | – | – | – | – | – | – | – | – | – | – | 12,935 | |||||||||||||||||||||||||||||||||||||||||||||
| AVR deferred shares14 | 12,935 | 21-Nov-14 | 21-Nov-16 | – | – | – | – | – | – | – | – | – | – | – | 12,935 | |||||||||||||||||||||||||||||||||||||||||||||
| LTVR performance rights | 71,982 | 14-Nov-11 | 14-Nov-14 | 14-Nov-16 | – | – | – | (71,982 | ) | 100 | (2,317,820 | ) | – | – | – | – | – | |||||||||||||||||||||||||||||||||||||||||||
| LTVR performance rights15 | 24,578 | 21-Nov-14 | 21-Nov-17 | 21-Nov-19 | – | – | – | – | – | – | – | – | – | – | 24,578 | |||||||||||||||||||||||||||||||||||||||||||||
| LTVR performance rights15 |
22,624 | 21-Nov-14 | 21-Nov-17 | 21-Nov-19 | – | – | – | – | – | – | – | – | – | – | 22,624 | |||||||||||||||||||||||||||||||||||||||||||||
| 1 | Executives, for the purpose of the five highest paid executive disclosures, are defined as Disclosed Executives or other members of Management Board. Rights granted to the five highest paid executives as remuneration in 2015 are included above. |
| 2 | The point in time value of shares/share rights and/or performance rights is based on the one day VWAP of the Company’s shares traded on the ASX on the date of vesting, lapsing/forfeiture or exercising/sale/transfer out of trust, multiplied by the number of shares/share rights and/or performance rights. |
| 3 | The number vested and exercisable is the number of shares, options and rights that remain vested at the end of the reporting period. No shares, options and rights were vested and unexercisable. |
| 4 | M Smith – The CEO had a proportion of his AVR amount deferred as equity. The Board determined the deferred amount for the CEO. The 2014 LTVR grant for the CEO was delivered as performance rights. LTVR performance rights granted 16 Dec 2011 lapsed on 16 Dec 2014 and the one day VWAP was $30.6369. Prior year grants of LTVR performance rights that remained unexerciseable as at 30 September 2015 include: 328,810 (December 2012); 100,832 and 100,254 (December 2013); 119,382 and 109,890 (December 2014). |
| 5 | A Currie – Prior year grants of LTVR performance rights that remained unexerciseable as at 30 September 2015 include: 73,818 (November 2012); 27,036 and 24,687 (November 2013); 26,334 and 24,240 (November 2014). |
| 6 | S Elliott – LTVR performance rights granted 14 Nov 2011 lapsed on 14 Nov 2014 and the one day VWAP was $32.20. Prior year grants of LTVR performance rights that remained unexerciseable as at 30 September 2015 include: 118,110 (November 2012); 36,049 and 32,916 (November 2013); 28,089 and 25,856 (November 2014). |
| 7 | A Géczy – Prior year grants of LTVR performance rights that remained unexerciseable as at 30 September 2015 include: 22,530 and 20,572 (November 2013); 28,089 and 25,856 (November 2014). |
| 8 | D Hisco – AVR deferred share rights granted 12 Nov 2012 and 22 Nov 2013 were exercised on 24 Apr 2015, the one day VWAP on date of exercise was $35.6121 and the exercise price was $0.00. LTVR performance rights granted 14 Nov 2011 lapsed on 14 Nov 2014 and the one day VWAP was $32.20. Prior year grants of LTVR performance rights that remained unexerciseable as at 30 September 2015 include: 49,212 (November 2012); 25,205 and 23,015 (November 2013); 24,552 and 22,600 (November 2014). |
| 9 | G Hodges – LTVR performance rights granted 14 Nov 2011 lapsed on 14 Nov 2014 and the one day VWAP was $32.20. Prior year grants of LTVR performance rights that remained unexerciseable as at 30 September 2015 include: 49,212 (November 2012); 18,024 and 16,458 (November 2013); 17,556 and 16,160 (November 2014). |
| 10 | J Phillips – LTVR performance rights granted 14 Nov 2011 lapsed on 14 Nov 2014 and the one day VWAP was $32.20. Prior year grants of LTVR performance rights that remained unexerciseable as at 30 September 2015 include: 49,212 (November 2012); 18,024 and 16,458 (November 2013); 24,578 and 22,624 (November 2014). |
| 11 | M Whelan – M Whelan commenced in a Disclosed Executive role on 3 April 2015 and there are no disclosable transactions from this date. Prior year grants of LTVR performance rights that remained unexerciseable as at 30 September 2015 relate to grants from prior roles. |
| 12 | N Williams – Prior year grants of LTVR deferred share rights that remained unexerciseable as at 30 September 2015 include: 29,225 (November 2012); 27,603 (November 2013); 27,685 (November 2014). |
| 13 | P Chronican – LTVR performance rights granted 14 Nov 2011 lapsed on 14 Nov 2014 and the one day VWAP was $32.20. Prior year grants of LTVR performance rights that remained unexerciseable as at 30 September 2015 include: 63,976 (November 2012); 25,234 and 23,041 (November 2013); 24,578 and 22,624 (November 2014). |
| 14 | The Disclosed Executives had a proportion of their AVR amount deferred as equity. In 2015 D Hisco received share rights rather than shares as locally appropriate. A share right effectively provides a right in the future to acquire a share in ANZ at nil cost to the employee. Refer to the AVR arrangements section for further details of the mandatory deferral arrangements for the Disclosed Executives. |
| 15 | The 2014 LTVR grants for Disclosed Executives were delivered as performance rights excluding for the CRO. |
DIRECTORS’ REPORT 53
DIRECTORS’ REPORT (continued)
9.2 NED, CEO AND DISCLOSED EXECUTIVES EQUITY HOLDINGS
Details of shares held directly, indirectly or beneficially by each NED, including their related parties, are provided below.
TABLE 8: NED SHAREHOLDINGS (INCLUDING MOVEMENTS DURING THE 2015 YEAR)
| Name | Type | Opening balance at 1 Oct 2014 |
Shares granted during the year as remuneration |
Received during the year on exercise of options or rights |
Resulting from any other changes during the year1 |
Closing balance at 30 Sep 20152,3 | ||||||||||||||
| Current Non-Executive Directors | ||||||||||||||||||||
| D Gonski |
Ordinary shares |
30,921 | – | – | 567 | 31,488 | ||||||||||||||
| I Atlas |
Ordinary shares |
7,360 | – | – | – | 7,360 | ||||||||||||||
| P Dwyer |
Ordinary shares |
10,000 | – | – | 567 | 10,567 | ||||||||||||||
| H Lee |
Directors’ Share Plan | 2,109 | – | – | 121 | 2,230 | ||||||||||||||
| Ordinary shares |
8,000 | – | – | – | 8,000 | |||||||||||||||
| G Liebelt |
Ordinary shares | 9,748 | – | – | 567 | 10,315 | ||||||||||||||
| Capital notes |
1,500 | – | – | – | 1,500 | |||||||||||||||
| Capital notes 2 |
2,500 | – | – | – | 2,500 | |||||||||||||||
| I Macfarlane |
Ordinary shares | 17,616 | – | – | 567 | 18,183 | ||||||||||||||
| Capital notes |
1,500 | – | – | – | 1,500 | |||||||||||||||
| Convertible preference shares (CPS2) |
500 | – | – | 500 | 1,000 | |||||||||||||||
| Convertible preference shares (CPS3) |
1,000 | – | – | – | 1,000 | |||||||||||||||
| J Macfarlane |
Ordinary shares | 12,284 | – | – | 567 | 12,851 | ||||||||||||||
| Capital notes 2 |
2,000 | – | – | – | 2,000 | |||||||||||||||
| Capital notes 3 |
– | – | – | 5,000 | 5,000 | |||||||||||||||
| 1 | Shares from any other changes during the year include the net result of any shares purchased (including under the ANZ share purchase plan), sold, or acquired under the dividend reinvestment plan. |
| 2 | The following shares (included in the holdings above) were held on behalf of the NEDs (i.e. indirect beneficially held shares) as at 30 September 2015: D Gonski – 31,488, I Atlas – 7,360, P Dwyer – 10,567, H Lee – 2,230, G Liebelt – 14,315, I Macfarlane – 21,683, J Macfarlane – 19,851. |
| 3 | There was no change in the balance as at the Director’s Report sign-off date. |
54
ANZ ANNUAL REPORT 2015
Details of shares, deferred share rights and performance rights held directly, indirectly or beneficially by the CEO and each Disclosed Executive, including their related parties, are provided below.
TABLE 9: CEO AND DISCLOSED EXECUTIVE SHAREHOLDINGS AND RIGHTS HOLDINGS (INCLUDING MOVEMENTS DURING THE 2015 YEAR)
| Name | Type | Opening balance at 1 Oct 2014 |
Shares granted during the year as remuneration1 |
Received during the year on exercise of options or rights |
Resulting from any other changes during the year2 |
Closing balance at 30 Sep 20153,4 | ||||||||||||||
| CEO and Current Disclosed Executives | ||||||||||||||||||||
| M Smith |
Deferred shares | 103,474 | 61,147 | – | (70,292) | 94,329 | ||||||||||||||
| Ordinary shares | 901,868 | – | – | 76,970 | 978,838 | |||||||||||||||
| LTVR performance rights |
856,320 | 229,272 | – | (326,424) | 759,168 | |||||||||||||||
| A Currie |
Deferred shares | 58,946 | 26,654 | – | (46,642) | 38,958 | ||||||||||||||
| Ordinary shares | 1,042 | – | – | – | 1,042 | |||||||||||||||
| LTVR performance rights |
125,541 | 50,574 | – | – | 176,115 | |||||||||||||||
| S Elliott |
Deferred shares | 60,999 | 37,629 | – | 4,514 | 103,142 | ||||||||||||||
| Ordinary shares | 42 | – | – | 2 | 44 | |||||||||||||||
| LTVR performance rights |
259,057 | 53,945 | – | (71,982) | 241,020 | |||||||||||||||
| A Géczy |
Deferred shares | – | 25,086 | – | 675 | 25,761 | ||||||||||||||
| LTVR performance rights |
43,102 | 53,945 | – | – | 97,047 | |||||||||||||||
| D Hisco |
Deferred shares | 23,243 | – | – | (7,243) | 16,000 | ||||||||||||||
| Employee Share Offer | 25 | 23 | – | – | 48 | |||||||||||||||
| Ordinary shares | 57,000 | – | 34,162 | – | 91,162 | |||||||||||||||
| AVR deferred share rights | 50,770 | 35,778 | (34,162) | – | 52,386 | |||||||||||||||
| LTVR performance rights |
152,802 | 47,152 | – | (55,370) | 144,584 | |||||||||||||||
| G Hodges |
Deferred shares | 145,038 | 21,950 | – | 5,951 | 172,939 | ||||||||||||||
| Ordinary shares | 95,639 | – | – | (25,000) | 70,639 | |||||||||||||||
| LTVR performance rights |
139,064 | 33,716 | – | (55,370) | 117,410 | |||||||||||||||
| J Phillips |
Deferred shares | 55,389 | 25,086 | – | (18,947) | 61,528 | ||||||||||||||
| Ordinary shares | 9,733 | – | – | (3,898) | 5,835 | |||||||||||||||
| LTVR performance rights |
139,064 | 47,202 | – | (55,370) | 130,896 | |||||||||||||||
| M Whelan5 |
Deferred shares | 117,976 | – | – | 787 | 118,763 | ||||||||||||||
| LTVR performance rights |
27,278 | – | – | – | 27,278 | |||||||||||||||
| N Williams |
Deferred shares | 60,945 | 26,654 | – | (46,963) | 40,636 | ||||||||||||||
| Ordinary shares | – | – | – | 567 | 567 | |||||||||||||||
| LTVR deferred share rights |
56,828 | 27,685 | – | – | 84,513 | |||||||||||||||
| Former Disclosed Executives | ||||||||||||||||||||
| P Chronican |
Deferred shares | 47,112 | 25,870 | – | (31,052) | 41,930 | ||||||||||||||
| Ordinary shares | 150,792 | – | – | 33,550 | 184,342 | |||||||||||||||
| Capital Notes | – | – | – | 1,228 | 1,228 | |||||||||||||||
| Convertible preference shares (CPS2) | 1,499 | – | – | – | 1,499 | |||||||||||||||
| LTVR performance rights |
184,233 | 47,202 | – | (71,982) | 159,453 | |||||||||||||||
| 1 | Details of options/rights granted as remuneration during 2015 are provided in Table 7. |
| 2 | Shares resulting from any other changes during the year include the net result of any shares purchased (including under the ANZ share purchase plan), forfeited, sold or acquired under the dividend reinvestment plan. |
| 3 | The following shares (included in the holdings above) were held on behalf of the CEO and Disclosed Executives (i.e. indirect beneficially held shares) as at 30 September 2015: M Smith – 1,002,033; A Currie – 38,958; S Elliott – 103,142; A Géczy – 25,761; D Hisco – 34,048; G Hodges – 215,674; J Phillips – 61,528; M Whelan – 118,763; N Williams – 40,636 and P Chronican – 41,930. |
| 4 | No options/rights were vested and exercisable or vested and unexerciseable as at 30 September 2015. There was no change in the balance as at the Director’s Report sign-off date. |
| 5 | Commencing balance is based on holdings as at the date of commencement in a Disclosed Executive role (3 April 2015). |
DIRECTORS’ REPORT 55
DIRECTORS’ REPORT (continued)
9.3 EQUITY VALUATIONS
This section outlines the valuations used throughout this report in relation to equity grants.
ANZ engages an external expert to independently value any required deferred share rights and performance rights, taking into account factors including the performance conditions, share price volatility, life of the instrument, dividend yield and share price at grant date.
The following table provides details of the valuations of the various equity instruments issued during the year and in prior years for shares and rights where vesting, lapse/forfeiture or exercise/sale has occurred during the year:
TABLE 10: EQUITY VALUATION INPUTS – SHARES AND RIGHTS
| Recipients | Type | Grant date | Exercise $ |
Equity $ |
Share $ |
ANZ expected volatility % |
Equity term (years) |
Vesting period (years) |
Expected life (years) |
Expected dividend yield % |
Risk free interest rate % | |||||||||||||||||||||||||||||
| CEO and Executives |
AVR deferred shares | 12-Nov-12 | – | 24.57 | 24.45 | – | – | 1 | – | – | – | |||||||||||||||||||||||||||||
| CEO and Executives |
AVR deferred shares | 12-Nov-12 | – | 24.57 | 24.45 | – | – | 2 | – | – | – | |||||||||||||||||||||||||||||
| CEO and Executives |
AVR deferred shares | 22-Nov-13 | – | 31.66 | 31.68 | – | – | 1 | – | – | – | |||||||||||||||||||||||||||||
| CEO and Executives |
AVR deferred shares | 21-Nov-14 | – | 31.84 | 31.82 | – | – | 1 | – | – | – | |||||||||||||||||||||||||||||
| CEO and Executives |
AVR deferred shares | 21-Nov-14 | – | 31.84 | 31.82 | – | – | 2 | – | – | – | |||||||||||||||||||||||||||||
| Executives |
LTVR deferred shares | 31-Oct-08 | – | 17.18 | 17.36 | – | – | 3 | – | – | – | |||||||||||||||||||||||||||||
| Executives |
LTVR deferred shares | 14-Nov-11 | – | 20.89 | 20.66 | – | – | 3 | – | – | – | |||||||||||||||||||||||||||||
| Executives |
Employee Share Offer shares | 4-Dec-14 | – | 32.13 | 32.22 | – | – | 3 | – | – | – | |||||||||||||||||||||||||||||
| Executives |
AVR deferred share rights | 12-Nov-12 | 0.00 | 21.76 | 24.45 | 22.5 | 4 | 2 | 2 | 6.00 | 2.66 | |||||||||||||||||||||||||||||
| Executives |
AVR deferred share rights | 22-Nov-13 | 0.00 | 30.10 | 31.68 | 20.0 | 3 | 1 | 1 | 5.25 | 2.54 | |||||||||||||||||||||||||||||
| Executives |
AVR deferred share rights | 21-Nov-14 | 0.00 | 30.16 | 31.82 | 17.5 | 3 | 1 | 1 | 5.50 | 2.53 | |||||||||||||||||||||||||||||
| Executives |
AVR deferred share rights | 21-Nov-14 | 0.00 | 28.58 | 31.82 | 17.5 | 4 | 2 | 2 | 5.50 | 2.53 | |||||||||||||||||||||||||||||
| Executives |
LTVR deferred share rights | 21-Nov-14 | 0.00 | 27.09 | 31.82 | 17.5 | 5 | 3 | 3 | 5.50 | 2.53 | |||||||||||||||||||||||||||||
| Executives |
LTVR performance rights | 14-Nov-11 | 0.00 | 9.03 | 20.66 | 25.0 | 5 | 3 | 3 | 6.50 | 3.53 | |||||||||||||||||||||||||||||
| CEO |
LTVR performance rights | 16-Dec-11 | 0.00 | 9.65 | 20.93 | 25.0 | 5 | 3 | 3 | 7.00 | 3.06 | |||||||||||||||||||||||||||||
| CEO (for allocation purposes) and Executives |
LTVR performance rights | 21-Nov-14 | 0.00 | 14.24 | 31.82 | 17.5 | 5 | 3 | 3 | 5.50 | 2.53 | |||||||||||||||||||||||||||||
| CEO (for allocation purposes) and Executives |
LTVR performance rights | 21-Nov-14 | 0.00 | 15.47 | 31.82 | 17.5 | 5 | 3 | 3 | 5.50 | 2.53 | |||||||||||||||||||||||||||||
| CEO (for expensing purposes) |
LTVR performance rights | 18-Dec-14 | 0.00 | 13.67 | 30.98 | 17.5 | 5 | 3 | 3 | 5.50 | 2.20 | |||||||||||||||||||||||||||||
| CEO (for expensing purposes) |
LTVR performance rights |
18-Dec-14 | 0.00 | 14.69 | 30.98 | 17.5 | 5 | 3 | 3 | 5.50 | 2.20 | |||||||||||||||||||||||||||||
| 1 | For shares, the volume weighted average share price of all ANZ shares sold on the ASX on the date of grant is used to calculate the fair value. No dividends are incorporated into the measurement of the fair value of shares. For rights, an independent fair value calculation is conducted to determine the fair value. |
56
ANZ ANNUAL REPORT 2015
10. NEDs, CEO and Disclosed Executives Loan and Other Transactions (non remuneration)
10.1 LOAN TRANSACTIONS
Loans made to the NEDs, the CEO and Disclosed Executives are made in the ordinary course of business on normal commercial terms and conditions no more favourable than those given to other employees or customers, including the term of the loan, security required and the interest rate.
Details of loans outstanding at the reporting date to NEDs, the CEO and Disclosed Executives including their related parties, where the individual’s aggregate loan balance exceeded $100,000 at any time during the year, are provided below. Other than the loans disclosed below no other loans were made, guaranteed or secured by any entity in the Group to the NEDs, the CEO and Disclosed Executives, including their related parties.
TABLE 11: NED LOAN TRANSACTIONS
| Name | Opening balance at 1 Oct 2014 $ |
Closing balance at 30 Sep 2015 |
Interest paid and reporting period1 $ |
Highest balance in the reporting period $ |
||||||||||||
| Non-Executive Directors |
||||||||||||||||
| J Macfarlane |
6,489,628 | 7,882,159 | 407,206 | 8,231,862 | ||||||||||||
| Total |
6,489,628 | 7,882,159 | 407,206 | 8,231,862 | ||||||||||||
| 1 | Actual interest paid after taking into consideration offset accounts. The loan balance is shown gross, however the interest paid takes into account the impact of offset amounts. |
TABLE 12: CEO AND DISCLOSED EXECUTIVE LOAN TRANSACTIONS
| Name | Opening balance at $ |
Closing balance at $ |
Interest paid and $ |
Highest balance $ |
||||||||||||
| CEO and Current Disclosed Executives |
| |||||||||||||||
| M Smith |
1,000,000 | 1,000,000 | 43,330 | 3,199,970 | ||||||||||||
| A Currie |
3,778,488 | 3,833,108 | 163,381 | 4,027,951 | ||||||||||||
| S Elliott |
1,600,000 | 1,598,516 | 56,454 | 1,610,128 | ||||||||||||
| A Géczy |
8,394,849 | 24,777,211 | 1,030,346 | 25,725,488 | ||||||||||||
| D Hisco |
3,438,788 | 2,116,292 | 169,738 | 3,704,926 | ||||||||||||
| G Hodges |
3,189,527 | 3,961,872 | 160,663 | 6,190,409 | ||||||||||||
| J Phillips |
– | 2,254,377 | 5,231 | 2,254,377 | ||||||||||||
| M Whelan |
1,841,167 | 2,690,090 | 52,192 | 2,710,950 | ||||||||||||
| N Williams |
1,668,474 | 286,000 | 17,511 | 1,890,735 | ||||||||||||
| Total |
24,911,293 | 42,517,466 | 1,698,846 | 51,314,934 | ||||||||||||
| 1 | For Disclosed Executives who commenced during the 2015 financial year, opening balances are as at date of commencement. |
| 2 | Actual interest paid after taking into consideration offset accounts. The loan balance is shown gross, however the interest paid takes into account the impact of offset amounts. |
10.2 OTHER TRANSACTIONS
All other transactions of the NEDs, the CEO and Disclosed Executives and their related parties are conducted on normal commercial terms and conditions no more favourable than those given to other employees or customers, and are deemed trivial or domestic in nature.
Signed in accordance with a resolution of the Directors.

|

|
|||||
| David M Gonski, AC | Graeme R Liebelt | |||||
| Chairman | Director | |||||
|
5 November 2015 |
DIRECTORS’ REPORT 57
FINANCIAL STATEMENTS
Income Statement for the year ended 30 September
| Consolidated | The Company1 | |||||||||||||||||||
| Note | 2015 $m |
2014 $m |
2015 $m |
2014 $m |
||||||||||||||||
| Interest income |
3 | 30,526 | 29,524 | 26,665 | 25,560 | |||||||||||||||
| Interest expense |
4 | (15,910 | ) | (15,714 | ) | (16,249 | ) | (15,550 | ) | |||||||||||
| Net interest income |
14,616 | 13,810 | 10,416 | 10,010 | ||||||||||||||||
| Other operating income |
3 | 4,094 | 4,189 | 6,575 | 5,784 | |||||||||||||||
| Net funds management and insurance income |
3 | 1,736 | 1,538 | 203 | 217 | |||||||||||||||
| Share of associates’ profit |
3 | 625 | 517 | 376 | 248 | |||||||||||||||
| Operating income |
21,071 | 20,054 | 17,570 | 16,259 | ||||||||||||||||
| Operating expenses |
4 | (9,359 | ) | (8,760 | ) | (7,350 | ) | (6,878 | ) | |||||||||||
| Profit before credit impairment and income tax |
11,712 | 11,294 | 10,220 | 9,381 | ||||||||||||||||
| Credit impairment charge |
15 | (1,179 | ) | (986 | ) | (969 | ) | (974 | ) | |||||||||||
| Profit before income tax |
10,533 | 10,308 | 9,251 | 8,407 | ||||||||||||||||
| Income tax expense |
5 | (3,026 | ) | (3,025 | ) | (1,945 | ) | (1,971 | ) | |||||||||||
| Profit for the year |
7,507 | 7,283 | 7,306 | 6,436 | ||||||||||||||||
| Comprising: |
||||||||||||||||||||
| Profit attributable to non-controlling interests |
14 | 12 | – | – | ||||||||||||||||
| Profit attributable to shareholders of the Company |
7,493 | 7,271 | 7,306 | 6,436 | ||||||||||||||||
| Earnings per ordinary share (cents) |
||||||||||||||||||||
| Basic |
7 | 271.5 | 267.1 | n/a | n/a | |||||||||||||||
| Diluted |
7 | 257.2 | 257.0 | n/a | n/a | |||||||||||||||
| Dividend per ordinary share (cents) |
6 | 181 | 178 | n/a | n/a | |||||||||||||||
| 1 | Comparative amounts have changed. Refer to note 45 for details. |
The notes appearing on pages 66 to 169 form an integral part of these financial statements.
60
ANZ ANNUAL REPORT 2015
Statement of Comprehensive Income for the year ended 30 September
| Consolidated | The Company1 | |||||||||||||||||||
| Note | 2015 $m |
2014 $m |
2015 $m |
2014 $m |
||||||||||||||||
| Profit for the year |
7,507 | 7,283 | 7,306 | 6,436 | ||||||||||||||||
| Other comprehensive income |
||||||||||||||||||||
| Items that will not be reclassified subsequently to profit or loss |
||||||||||||||||||||
| Remeasurement gain/(loss) on defined benefit plans |
31,40 | (6 | ) | 43 | 24 | 8 | ||||||||||||||
| Fair value gain/(loss) attributable to changes in own credit risk of financial liabilities designated at fair value |
52 | (35 | ) | 52 | (35 | ) | ||||||||||||||
| Income tax on items that will not be reclassified subsequently to profit or loss |
||||||||||||||||||||
| Remeasurement gain/(loss) on defined benefit plans |
4 | (11 | ) | (4 | ) | (2 | ) | |||||||||||||
| Fair value gain/(loss) attributable to changes in own credit risk of financial liabilities designated at fair value |
(15 | ) | 10 | (15 | ) | 10 | ||||||||||||||
| Items that may be reclassified subsequently to profit or loss |
||||||||||||||||||||
| Foreign currency translation reserve2 |
||||||||||||||||||||
| Exchange differences taken to equity |
31 | 1,736 | 487 | 878 | 212 | |||||||||||||||
| Exchange differences transferred to income statement |
(4 | ) | 37 | (4 | ) | 37 | ||||||||||||||
| Available-for-sale revaluation reserve |
||||||||||||||||||||
| Valuation gain/(loss) taken to equity |
31 | (40 | ) | 134 | (74 | ) | 90 | |||||||||||||
| Transferred to income statement |
(71 | ) | (47 | ) | (49 | ) | (40 | ) | ||||||||||||
| Cash flow hedge reserve |
||||||||||||||||||||
| Valuation gain/(loss) taken to equity |
31 | 160 | 165 | 149 | 168 | |||||||||||||||
| Transferred to income statement |
(15 | ) | (31 | ) | – | 8 | ||||||||||||||
| Income tax on items that may be reclassified subsequently to profit or loss |
||||||||||||||||||||
| Available-for-sale revaluation reserve |
36 | (23 | ) | 39 | (14 | ) | ||||||||||||||
| Cash flow hedge reserve |
(45 | ) | (41 | ) | (46 | ) | (53 | ) | ||||||||||||
| Share of associates’ other comprehensive income3 |
59 | (24 | ) | 44 | (23 | ) | ||||||||||||||
| Other comprehensive income net of tax |
1,851 | 664 | 994 | 366 | ||||||||||||||||
| Total comprehensive income for the year |
9,358 | 7,947 | 8,300 | 6,802 | ||||||||||||||||
| Comprising total comprehensive income attributable to: |
||||||||||||||||||||
| Non-controlling interests |
30 | 16 | – | – | ||||||||||||||||
| Shareholders of the Company |
9,328 | 7,931 | 8,300 | 6,802 | ||||||||||||||||
| 1 | Comparative amounts have changed. Refer to note 45 for details. |
| 2 | Includes a $16 million gain of foreign currency translation differences attributed to non-controlling interests (2014: $4 million gain). |
| 3 | Share of associates’ other comprehensive income includes items that may be reclassified subsequently to profit and loss comprised of Available-for-sale assets reserve gain of $53 million (2014: loss of $25 million) for the Group and gain of $44 million (2014: loss of $23 million) for the Company; Foreign currency translation reserve of $8 million gain (2014: nil) for the Group; Cash flow hedge reserve of nil (2014: gain of $1 million) for the Group and items that will not be reclassified subsequently to profit or loss comprised of Defined benefit plans loss of $2 million (2014: nil) for the Group. |
The notes appearing on pages 66 to 169 form an integral part of these financial statements.
FINANCIAL STATEMENTS 61
FINANCIAL STATEMENTS (continued)
Balance Sheet as at 30 September
| Consolidated | The Company1 | |||||||||||||||||||
| Note | 2015 $m |
2014 $m |
2015 $m |
2014 $m |
||||||||||||||||
| Assets |
||||||||||||||||||||
| Cash |
10 | 53,903 | 32,559 | 51,217 | 30,655 | |||||||||||||||
| Settlement balances owed to ANZ |
18,596 | 20,241 | 16,601 | 18,150 | ||||||||||||||||
| Collateral paid |
9,967 | 5,459 | 8,234 | 4,873 | ||||||||||||||||
| Trading securities |
11 | 49,000 | 49,692 | 37,373 | 38,049 | |||||||||||||||
| Derivative financial instruments |
12 | 85,625 | 56,369 | 75,694 | 52,882 | |||||||||||||||
| Available-for-sale assets |
13 | 43,667 | 30,917 | 37,612 | 26,151 | |||||||||||||||
| Net loans and advances |
14 | 562,173 | 521,752 | 440,383 | 415,066 | |||||||||||||||
| Regulatory deposits |
1,773 | 1,565 | 557 | 434 | ||||||||||||||||
| Due from controlled entities |
– | – | 109,920 | 99,194 | ||||||||||||||||
| Shares in controlled entities |
33 | – | – | 17,823 | 14,870 | |||||||||||||||
| Investments in associates |
35 | 5,440 | 4,582 | 3,018 | 2,166 | |||||||||||||||
| Current tax assets |
5 | 90 | 38 | 84 | 27 | |||||||||||||||
| Deferred tax assets |
5 | 402 | 417 | 712 | 778 | |||||||||||||||
| Goodwill and other intangible assets |
25 | 8,312 | 7,950 | 2,830 | 2,451 | |||||||||||||||
| Investments backing policy liabilities |
38 | 34,820 | 33,579 | – | – | |||||||||||||||
| Premises and equipment |
26 | 2,221 | 2,181 | 990 | 1,001 | |||||||||||||||
| Other assets |
27 | 5,846 | 4,791 | 2,949 | 2,243 | |||||||||||||||
| Esanda dealer finance assets held for sale |
14 | 8,065 | – | 8,065 | – | |||||||||||||||
| Total assets |
889,900 | 772,092 | 814,062 | 708,990 | ||||||||||||||||
| Liabilities |
||||||||||||||||||||
| Settlement balances owed by ANZ |
11,250 | 10,114 | 9,901 | 8,189 | ||||||||||||||||
| Collateral received |
7,829 | 5,599 | 6,886 | 4,886 | ||||||||||||||||
| Deposits and other borrowings |
16 | 570,794 | 510,079 | 472,031 | 423,172 | |||||||||||||||
| Derivative financial instruments |
12 | 81,270 | 52,925 | 71,844 | 50,474 | |||||||||||||||
| Due to controlled entities |
– | – | 105,079 | 93,796 | ||||||||||||||||
| Current tax liabilities |
5 | 267 | 449 | 94 | 301 | |||||||||||||||
| Deferred tax liabilities |
5 | 249 | 120 | 123 | 62 | |||||||||||||||
| Policy liabilities |
38 | 35,401 | 34,554 | – | – | |||||||||||||||
| External unit holder liabilities (life insurance funds) |
3,291 | 3,181 | – | – | ||||||||||||||||
| Provisions |
28 | 1,074 | 1,100 | 731 | 695 | |||||||||||||||
| Payables and other liabilities |
29 | 10,366 | 10,984 | 6,294 | 7,682 | |||||||||||||||
| Debt issuances |
17 | 93,747 | 80,096 | 75,579 | 64,161 | |||||||||||||||
| Subordinated debt |
18 | 17,009 | 13,607 | 15,812 | 12,870 | |||||||||||||||
| Total liabilities |
832,547 | 722,808 | 764,374 | 666,288 | ||||||||||||||||
| Net assets |
57,353 | 49,284 | 49,688 | 42,702 | ||||||||||||||||
| Shareholders’ equity |
||||||||||||||||||||
| Ordinary share capital |
30 | 28,367 | 24,031 | 28,611 | 24,280 | |||||||||||||||
| Preference share capital |
30 | – | 871 | – | 871 | |||||||||||||||
| Reserves |
31 | 1,571 | (239 | ) | 939 | (6 | ) | |||||||||||||
| Retained earnings |
31 | 27,309 | 24,544 | 20,138 | 17,557 | |||||||||||||||
| Share capital and reserves attributable to shareholders of the Company |
57,247 | 49,207 | 49,688 | 42,702 | ||||||||||||||||
| Non-controlling interests |
30 | 106 | 77 | – | – | |||||||||||||||
| Total shareholders’ equity |
57,353 | 49,284 | 49,688 | 42,702 | ||||||||||||||||
| 1 | Comparative amounts have changed. Refer to note 45 for details. |
The notes appearing on pages 66 to 169 form an integral part of these financial statements.
62
ANZ ANNUAL REPORT 2015
Cash Flow Statement for the year ended 30 September
| Consolidated | The Company | |||||||||||||||||||
| Note | 2015 $m |
2014 $m |
2015 $m |
2014 $m |
||||||||||||||||
| Cash flows from operating activities |
||||||||||||||||||||
| Interest received |
30,667 | 29,327 | 26,754 | 25,417 | ||||||||||||||||
| Interest paid |
(15,458 | ) | (14,886 | ) | (15,809 | ) | (14,716) | |||||||||||||
| Dividends received |
231 | 127 | 2,630 | 1,890 | ||||||||||||||||
| Other operating income received |
18,297 | 2,704 | 15,818 | 3,780 | ||||||||||||||||
| Other operating expenses paid |
(8,573 | ) | (8,123 | ) | (6,806 | ) | (6,476) | |||||||||||||
| Income taxes paid |
(3,082 | ) | (3,207 | ) | (2,388 | ) | (2,615) | |||||||||||||
| Net cash flows from funds management and insurance business |
||||||||||||||||||||
| Premiums, other income and life investment deposits received |
7,577 | 7,549 | 154 | 168 | ||||||||||||||||
| Investment income and policy deposits received |
286 | 620 | – | – | ||||||||||||||||
| Claims and policyholder liability payments |
(5,930 | ) | (5,578 | ) | – | – | ||||||||||||||
| Commission expense (paid)/received |
(648 | ) | (471 | ) | 49 | 49 | ||||||||||||||
| Cash flows from operating activities before changes in operating assets and liabilities | 23,367 | 8,062 | 20,402 | 7,497 | ||||||||||||||||
| Changes in operating assets and liabilities arising from cash flow movements | ||||||||||||||||||||
| (Increase)/decrease in operating assets |
||||||||||||||||||||
| Collateral paid |
(3,585 | ) | 1,271 | (2,427 | ) | 957 | ||||||||||||||
| Trading securities |
2,870 | (8,600 | ) | 2,161 | (7,131) | |||||||||||||||
| Loans and advances |
(32,280 | ) | (35,154 | ) | (21,759 | ) | (29,408) | |||||||||||||
| Net intra-group loans and advances |
– | – | (992 | ) | 1,856 | |||||||||||||||
| Net cash flows from investments backing policyholder liabilities |
||||||||||||||||||||
| Purchase of insurance assets |
(7,065 | ) | (4,856 | ) | – | – | ||||||||||||||
| Proceeds from sale/maturity of insurance assets |
7,239 | 4,625 | – | – | ||||||||||||||||
| Increase/(decrease) in operating liabilities |
||||||||||||||||||||
| Deposits and other borrowings |
30,050 | 36,592 | 22,210 | 31,798 | ||||||||||||||||
| Settlement balances owed by ANZ |
781 | 1,358 | 1,422 | 668 | ||||||||||||||||
| Collateral received |
1,073 | 1,435 | 854 | 1,103 | ||||||||||||||||
| Payables and other liabilities |
(974 | ) | 910 | (1,491 | ) | 1,417 | ||||||||||||||
| Change in operating assets and liabilities arising from cash flow movements | (1,891 | ) | (2,419 | ) | (22 | ) | 1,260 | |||||||||||||
| Net cash provided by operating activities |
9(a) | 21,476 | 5,643 | 20,380 | 8,757 | |||||||||||||||
| Cash flows from investing activities |
||||||||||||||||||||
| Available-for-sale assets |
||||||||||||||||||||
| Purchases |
(24,236 | ) | (12,652 | ) | (18,876 | ) | (7,849) | |||||||||||||
| Proceeds from sale or maturity |
15,705 | 11,136 | 11,256 | 6,489 | ||||||||||||||||
| Controlled entities and associates |
||||||||||||||||||||
| Purchases (net of cash acquired) |
9(c) | – | – | (1,375 | ) | (21) | ||||||||||||||
| Proceeds from sale (net of cash disposed) |
9(c) | 4 | 251 | – | 249 | |||||||||||||||
| Premises and equipment |
||||||||||||||||||||
| Purchases |
(321 | ) | (370 | ) | (204 | ) | (248) | |||||||||||||
| Other assets |
(928 | ) | (292 | ) | (280 | ) | 86 | |||||||||||||
| Net cash used in investing activities |
(9,776 | ) | (1,927 | ) | (9,479 | ) | (1,294) | |||||||||||||
| Cash flows from financing activities |
||||||||||||||||||||
| Debt issuances |
||||||||||||||||||||
| Issue proceeds |
16,637 | 17,156 | 12,969 | 13,102 | ||||||||||||||||
| Redemptions |
(15,966 | ) | (10,710 | ) | (12,250 | ) | (8,642) | |||||||||||||
| Subordinated debt |
||||||||||||||||||||
| Issue proceeds |
2,683 | 3,258 | 2,517 | 3,258 | ||||||||||||||||
| Redemptions |
– | (2,586 | ) | – | (2,586) | |||||||||||||||
| Dividends paid |
(3,763 | ) | (3,827 | ) | (3,784 | ) | (3,843) | |||||||||||||
| Share capital issues |
3,207 | 4 | 3,207 | 4 | ||||||||||||||||
| Preference shares bought back |
(755 | ) | – | (755 | ) | – | ||||||||||||||
| Share buybacks |
– | (500 | ) | – | (500) | |||||||||||||||
| Net cash provided by financing activities |
2,043 | 2,795 | 1,904 | 793 | ||||||||||||||||
| Net increase in cash and cash equivalents |
13,743 | 6,511 | 12,805 | 8,256 | ||||||||||||||||
| Cash and cash equivalents at beginning of year |
48,229 | 41,111 | 45,048 | 36,279 | ||||||||||||||||
| Effects of exchange rate changes on cash and cash equivalents |
7,306 | 607 | 6,983 | 513 | ||||||||||||||||
| Cash and cash equivalents at end of year |
9(b) | 69,278 | 48,229 | 64,836 | 45,048 | |||||||||||||||
The notes appearing on pages 66 to 169 form an integral part of these financial statements.
FINANCIAL STATEMENTS 63
FINANCIAL STATEMENTS (continued)
Statement of Changes in Equity for the year ended 30 September
| Consolidated | Ordinary share capital $m |
Preference $m |
Reserves1 $m |
Retained earnings $m |
Shareholders’ to equity the Bank $m |
Non-controlling $m |
Total shareholders’ equity $m |
|||||||||||||||||||||
| As at 1 October 2013 | 23,641 | 871 | (907) | 21,936 | 45,541 | 62 | 45,603 | |||||||||||||||||||||
| Profit or loss |
– | – | – | 7,271 | 7,271 | 12 | 7,283 | |||||||||||||||||||||
| Other comprehensive income for the year | – | – | 653 | 7 | 660 | 4 | 664 | |||||||||||||||||||||
| Total comprehensive income for the year | – | – | 653 | 7,278 | 7,931 | 16 | 7,947 | |||||||||||||||||||||
| Transactions with equity holders in their capacity as equity holders: | ||||||||||||||||||||||||||||
| Dividends paid |
– | – | – | (4,700 | ) | (4,700 | ) | (1 | ) | (4,701) | ||||||||||||||||||
| Dividend income on Treasury shares held within the Group’s life insurance statutory funds |
– | – | – | 22 | 22 | – | 22 | |||||||||||||||||||||
| Dividend reinvestment plan |
851 | – | – | – | 851 | – | 851 | |||||||||||||||||||||
| Transactions with non-controlling interests |
– | – | 10 | – | 10 | – | 10 | |||||||||||||||||||||
| Other equity movements: | ||||||||||||||||||||||||||||
| Share-based payments/(exercises) |
– | – | 13 | – | 13 | – | 13 | |||||||||||||||||||||
| Treasury shares Global Wealth adjustment |
24 | – | – | – | 24 | – | 24 | |||||||||||||||||||||
| Group share option scheme |
4 | – | – | – | 4 | – | 4 | |||||||||||||||||||||
| Group employee share acquisition scheme |
11 | – | – | – | 11 | – | 11 | |||||||||||||||||||||
| Group share buyback |
(500 | ) | – | – | – | (500 | ) | – | (500) | |||||||||||||||||||
| Transfer of options/rights lapsed |
– | – | (8) | 8 | – | – | – | |||||||||||||||||||||
| As at 30 September 2014 | 24,031 | 871 | (239) | 24,544 | 49,207 | 77 | 49,284 | |||||||||||||||||||||
| Profit or loss |
– | – | – | 7,493 | 7,493 | 14 | 7,507 | |||||||||||||||||||||
| Other comprehensive income for the year | – | – | 1,802 | 33 | 1,835 | 16 | 1,851 | |||||||||||||||||||||
| Total comprehensive income for the year | – | – | 1,802 | 7,526 | 9,328 | 30 | 9,358 | |||||||||||||||||||||
| Transactions with equity holders in their capacity as equity holders: | ||||||||||||||||||||||||||||
| Dividends paid |
– | – | – | (4,907 | ) | (4,907 | ) | (1 | ) | (4,908) | ||||||||||||||||||
| Dividend income on Treasury shares held within the Group’s life insurance statutory funds |
– | – | – | 22 | 22 | – | 22 | |||||||||||||||||||||
| Dividend reinvestment plan |
1,122 | – | – | – | 1,122 | – | 1,122 | |||||||||||||||||||||
| Preference share bought back |
– | (871 | ) | – | – | (871 | ) | – | (871) | |||||||||||||||||||
| Other equity movements: | ||||||||||||||||||||||||||||
| Share-based payments/(exercises) |
– | – | 16 | – | 16 | – | 16 | |||||||||||||||||||||
| Share placement and share purchase plan |
3,206 | – | – | – | 3,206 | – | 3,206 | |||||||||||||||||||||
| Treasury shares Global Wealth adjustment |
5 | – | – | – | 5 | – | 5 | |||||||||||||||||||||
| Group share option scheme |
2 | – | – | – | 2 | – | 2 | |||||||||||||||||||||
| Group employee share acquisition scheme |
1 | – | – | – | 1 | – | 1 | |||||||||||||||||||||
| Transfer of options/rights lapsed |
– | – | (8) | 8 | – | – | – | |||||||||||||||||||||
| Foreign exchange gains on preference shares bought back |
– | – | – | 116 | 116 | – | 116 | |||||||||||||||||||||
| As at 30 September 2015 | 28,367 | – | 1,571 | 27,309 | 57,247 | 106 | 57,353 | |||||||||||||||||||||
| 1 | Further information on reserves is disclosed in note 31 to the financial statements. |
The notes appearing on pages 66 to 169 form an integral part of these financial statements.
64
ANZ ANNUAL REPORT 2015
| The Company | Ordinary share capital $m |
Preference $m |
Reserves1,2 $m |
Retained earnings1 $m |
Shareholders’ to equity the Bank1 $m |
Non-controlling $m |
Total shareholders’ equity1 $m |
|||||||||||||||||||||
| As at 1 October 2013 | 23,914 | 871 | (396) | 15,826 | 40,215 | – | 40,215 | |||||||||||||||||||||
| Profit or loss |
– | – | – | 6,436 | 6,436 | – | 6,436 | |||||||||||||||||||||
| Other comprehensive income for the year | – | – | 385 | (19 | ) | 366 | – | 366 | ||||||||||||||||||||
| Total comprehensive income for the year | – | – | 385 | 6,417 | 6,802 | – | 6,802 | |||||||||||||||||||||
| Transactions with equity holders in their capacity as equity holders: | ||||||||||||||||||||||||||||
| Dividends paid |
– | – | – | (4,694 | ) | (4,694 | ) | – | (4,694) | |||||||||||||||||||
| Dividend reinvestment plan |
851 | – | – | – | 851 | – | 851 | |||||||||||||||||||||
| Other equity movements: | – | |||||||||||||||||||||||||||
| Share-based payments/(exercises) |
– | – | 13 | – | 13 | – | 13 | |||||||||||||||||||||
| Group share option scheme |
4 | – | – | – | 4 | – | 4 | |||||||||||||||||||||
| Group employee share acquisition scheme |
11 | – | – | – | 11 | – | 11 | |||||||||||||||||||||
| Group share buyback |
(500 | ) | – | – | – | (500 | ) | – | (500) | |||||||||||||||||||
| Transfer of options/rights lapsed |
– | – | (8) | 8 | – | – | – | |||||||||||||||||||||
| As at 30 September 2014 | 24,280 | 871 | (6) | 17,557 | 42,702 | – | 42,702 | |||||||||||||||||||||
| Profit or loss |
– | – | – | 7,306 | 7,306 | – | 7,306 | |||||||||||||||||||||
| Other comprehensive income for the year | – | – | 937 | 57 | 994 | – | 994 | |||||||||||||||||||||
| Total comprehensive income for the year | – | – | 937 | 7,363 | 8,300 | – | 8,300 | |||||||||||||||||||||
| Transactions with equity holders in their capacity as equity holders: | ||||||||||||||||||||||||||||
| Dividends paid |
– | – | – | (4,906 | ) | (4,906 | ) | – | (4,906) | |||||||||||||||||||
| Dividend reinvestment plan |
1,122 | – | – | – | 1,122 | – | 1,122 | |||||||||||||||||||||
| Preference share bought back |
– | (871 | ) | – | – | (871 | ) | – | (871) | |||||||||||||||||||
| Other equity movements: | ||||||||||||||||||||||||||||
| Share-based payments/(exercises) |
– | – | 16 | – | 16 | – | 16 | |||||||||||||||||||||
| Share placement and share purchase plan |
3,206 | – | – | – | 3,206 | – | 3,206 | |||||||||||||||||||||
| Group share option scheme |
2 | – | – | – | 2 | – | 2 | |||||||||||||||||||||
| Group employee share acquisition scheme |
1 | – | – | – | 1 | – | 1 | |||||||||||||||||||||
| Transfer of options/rights lapsed |
– | – | (8) | 8 | – | – | – | |||||||||||||||||||||
| Foreign exchange gains on preference shares bought back |
– | – | – | 116 | 116 | – | 116 | |||||||||||||||||||||
| As at 30 September 2015 | 28,611 | – | 939 | 20,138 | 49,688 | – | 49,688 | |||||||||||||||||||||
| 1 | Comparative amounts have changed. Refer to note 45 for details. |
| 2 | Further information on reserves is disclosed in note 31 to the financial statements. |
The notes appearing on pages 66 to 169 form an integral part of these financial statements.
FINANCIAL STATEMENTS 65
NOTES TO THE FINANCIAL STATEMENTS
1: Significant Accounting Policies
| 66 |
ANZ ANNUAL REPORT 2015
1: Significant Accounting Policies (continued)
| NOTES TO THE FINANCIAL STATEMENTS 67 |
NOTES TO THE FINANCIAL STATEMENTS (continued)
1: Significant Accounting Policies (continued)
| 68 |
ANZ ANNUAL REPORT 2015
1: Significant Accounting Policies (continued)
| NOTES TO THE FINANCIAL STATEMENTS 69 | ||
NOTES TO THE FINANCIAL STATEMENTS (continued)
1: Significant Accounting Policies (continued)
| 70 |
ANZ ANNUAL REPORT 2015
1: Significant Accounting Policies (continued)
| NOTES TO THE FINANCIAL STATEMENTS 71 | ||
NOTES TO THE FINANCIAL STATEMENTS (continued)
1: Significant Accounting Policies (continued)
| 72 |
ANZ ANNUAL REPORT 2015
1: Significant Accounting Policies (continued)
NOTES TO THE FINANCIAL STATEMENTS 73
NOTES TO THE FINANCIAL STATEMENTS (continued)
1: Significant Accounting Policies (continued)
| 74 |
ANZ ANNUAL REPORT 2015
1: Significant Accounting Policies (continued)
NOTES TO THE FINANCIAL STATEMENTS 75
NOTES TO THE FINANCIAL STATEMENTS (continued)
2: Critical Estimates and Judgements Used in Applying Accounting Policies (continued)
| 76 |
ANZ ANNUAL REPORT 2015
3: Income
| Consolidated | The Company1 | |||||||||||||||
| 2015 $m |
2014 $m |
2015 $m |
2014 $m |
|||||||||||||
| Interest income |
||||||||||||||||
| Loans and advances and acceptances |
27,515 | 26,752 | 20,657 | 20,620 | ||||||||||||
| Trading securities |
1,594 | 1,546 | 1,109 | 1,091 | ||||||||||||
| Available-for-sale assets |
759 | 627 | 609 | 500 | ||||||||||||
| Other |
658 | 599 | 468 | 432 | ||||||||||||
| Total external interest income |
30,526 | 29,524 | 22,843 | 22,643 | ||||||||||||
| Controlled entities |
– | – | 3,822 | 2,917 | ||||||||||||
| Total interest income |
30,526 | 29,524 | 26,665 | 25,560 | ||||||||||||
| Interest income is analysed by type of financial asset as follows: |
||||||||||||||||
| Financial assets not classified at fair value through profit or loss |
28,916 | 27,949 | 25,549 | 24,446 | ||||||||||||
| Trading securities |
1,594 | 1,546 | 1,109 | 1,091 | ||||||||||||
| Financial assets designated at fair value through profit or loss |
16 | 29 | 7 | 23 | ||||||||||||
| Total interest income |
30,526 | 29,524 | 26,665 | 25,560 | ||||||||||||
| i) Fee and commission income |
||||||||||||||||
| Lending fees2 |
833 | 779 | 727 | 676 | ||||||||||||
| Non-lending fees and commissions3 |
2,807 | 2,648 | 2,023 | 1,867 | ||||||||||||
| 3,640 | 3,427 | 2,750 | 2,543 | |||||||||||||
| Controlled entities |
– | – | 1,144 | 1,257 | ||||||||||||
| Total fee and commission income3 |
3,640 | 3,427 | 3,894 | 3,800 | ||||||||||||
| Fee and commission expense3,4 |
(1,006 | ) | (922 | ) | (806 | ) | (704 | ) | ||||||||
| Net fee and commission income3 |
2,634 | 2,505 | 3,088 | 3,096 | ||||||||||||
| ii) Other income |
||||||||||||||||
| Net foreign exchange earnings |
1,007 | 1,073 | 719 | 672 | ||||||||||||
| Net (losses)/gains from trading securities and derivatives5 |
(131 | ) | 138 | (173 | ) | 54 | ||||||||||
| Credit risk on credit intermediation trades |
8 | (22 | ) | 8 | (22 | ) | ||||||||||
| Movement on financial instruments measured at fair value through profit or loss6 |
241 | 97 | 129 | 71 | ||||||||||||
| Dividends received from controlled entities7 |
– | – | 2,571 | 1,702 | ||||||||||||
| Brokerage income |
58 | 50 | – | – | ||||||||||||
| Loss on divestment of investment in SSI |
– | (21 | ) | – | (21 | ) | ||||||||||
| Dilution gain on investment in Bank of Tianjin (BoT) |
– | 12 | – | 12 | ||||||||||||
| Insurance settlement |
– | 26 | – | – | ||||||||||||
| Gain on sale of ANZ Trustees |
– | 125 | – | 115 | ||||||||||||
| Other3 |
277 | 206 | 233 | 105 | ||||||||||||
| Total other income |
1,460 | 1,684 | 3,487 | 2,688 | ||||||||||||
| Other operating income |
4,094 | 4,189 | 6,575 | 5,784 | ||||||||||||
| Net funds management and insurance income |
||||||||||||||||
| Funds management income |
930 | 917 | 111 | 122 | ||||||||||||
| Investment income |
1,848 | 2,656 | – | – | ||||||||||||
| Insurance premium income |
1,541 | 1,314 | 43 | 46 | ||||||||||||
| Commission income/(expense) |
(452 | ) | (471 | ) | 49 | 49 | ||||||||||
| Claims |
(718 | ) | (707 | ) | – | – | ||||||||||
| Changes in policy liabilities |
(1,434 | ) | (2,147 | ) | – | – | ||||||||||
| Elimination of treasury share gain/(loss) |
21 | (24 | ) | – | – | |||||||||||
| Total net funds management and insurance income |
1,736 | 1,538 | 203 | 217 | ||||||||||||
| Total other operating income |
5,830 | 5,727 | 6,778 | 6,001 | ||||||||||||
| Total share of associates’ profit |
625 | 517 | 376 | 248 | ||||||||||||
| Total income |
36,981 | 35,768 | 33,819 | 31,809 | ||||||||||||
| 1 | Comparative amounts have changed. Refer to note 45 for details. |
| 2 | Lending fees exclude fees treated as part of the effective yield calculation and included in interest income (refer note 1 B(ii)). |
| 3 | Certain card related fees that are integral to the generation of income were reclassified within total income to better reflect the nature of the items. Comparatives have been restated and fees of $488 million for the Group and $380 million for the Company were moved from ‘non-lending fees and commissions’, and fees of $10 million for the Group and $10 million for the Company were moved from ‘Other income’, and included in ‘fee and commission expenses’. |
| 4 | Includes interchange fees paid. |
| 5 | Does not include interest income relating to trading securities and derivatives used for balance sheet risk management. |
| 6 | Includes fair value movements (excluding realised and accrued interest) on derivatives not designated as accounting hedges entered into to manage interest rate and foreign exchange risk on funding instruments, ineffective portions of cash flow hedges, and fair value movements in financial assets and financial liabilities designated at fair value. |
| 7 | Dividends received from controlled entities are subject to meeting applicable regulatory and company law requirements, including solvency requirements. |
NOTES TO THE FINANCIAL STATEMENTS 77
NOTES TO THE FINANCIAL STATEMENTS (continued)
4: Expenses
| Consolidated | The Company | |||||||||||||||
| 2015 $m |
2014 $m |
2015 $m |
2014 $m |
|||||||||||||
| Interest expense |
||||||||||||||||
| Deposits |
11,159 | 11,229 | 8,514 | 8,935 | ||||||||||||
| Borrowing corporations’ debt |
70 | 62 | – | – | ||||||||||||
| Commercial paper |
515 | 436 | 255 | 241 | ||||||||||||
| Debt issuances and subordinated debt |
3,747 | 3,543 | 2,874 | 2,780 | ||||||||||||
| Other |
419 | 444 | 358 | 359 | ||||||||||||
| Total external interest expense |
15,910 | 15,714 | 12,001 | 12,315 | ||||||||||||
| Controlled entities |
– | – | 4,248 | 3,235 | ||||||||||||
| Total interest expense |
15,910 | 15,714 | 16,249 | 15,550 | ||||||||||||
| Interest expense is analysed by types of financial liabilities as follows: |
||||||||||||||||
| Financial liabilities not classified at fair value through profit or loss |
15,572 | 15,381 | 16,171 | 15,412 | ||||||||||||
| Financial liabilities designated at fair value through profit or loss |
338 | 333 | 78 | 138 | ||||||||||||
| 15,910 | 15,714 | 16,249 | 15,550 | |||||||||||||
| Operating expenses |
||||||||||||||||
| i) Personnel |
||||||||||||||||
| Employee entitlements and taxes |
325 | 278 | 233 | 209 | ||||||||||||
| Salaries and wages |
3,719 | 3,495 | 2,678 | 2,591 | ||||||||||||
| Superannuation costs – defined benefit plan (note 40) |
7 | 10 | 2 | 4 | ||||||||||||
|
– defined contribution plans |
324 | 300 | 269 | 246 | ||||||||||||
| Equity-settled share-based payments |
216 | 215 | 185 | 183 | ||||||||||||
| Other |
888 | 790 | 648 | 590 | ||||||||||||
| Total personnel expenses (excl. restructuring) |
5,479 | 5,088 | 4,015 | 3,823 | ||||||||||||
| ii) Premises |
||||||||||||||||
| Depreciation of buildings and integrals |
192 | 198 | 128 | 136 | ||||||||||||
| Rent |
479 | 450 | 379 | 364 | ||||||||||||
| Utilities and other outgoings |
180 | 178 | 119 | 118 | ||||||||||||
| Other |
71 | 62 | 57 | 51 | ||||||||||||
| Total premises expenses (excl. restructuring) |
922 | 888 | 683 | 669 | ||||||||||||
| iii) Technology |
||||||||||||||||
| Data communication |
115 | 104 | 70 | 64 | ||||||||||||
| Depreciation |
675 | 550 | 599 | 453 | ||||||||||||
| Licences and outsourced services |
447 | 400 | 290 | 291 | ||||||||||||
| Rentals and repairs |
158 | 153 | 129 | 126 | ||||||||||||
| Software impairment |
17 | 15 | 12 | 11 | ||||||||||||
| Other |
50 | 44 | 31 | 17 | ||||||||||||
| Total technology expenses (excl. restructuring) |
1,462 | 1,266 | 1,131 | 962 | ||||||||||||
| iv) Other |
||||||||||||||||
| Advertising and public relations |
292 | 278 | 203 | 208 | ||||||||||||
| Audit fees and other fees (note 44) |
21 | 19 | 11 | 10 | ||||||||||||
| Freight, stationery, postage and telephone |
263 | 273 | 192 | 189 | ||||||||||||
| Non-lending losses, frauds and forgeries |
66 | 52 | 56 | 39 | ||||||||||||
| Professional fees |
324 | 239 | 273 | 220 | ||||||||||||
| Travel and entertainment expenses |
205 | 193 | 146 | 141 | ||||||||||||
| Amortisation and impairment of other intangible assets |
88 | 118 | 9 | 8 | ||||||||||||
| Other |
206 | 233 | 607 | 509 | ||||||||||||
| Total other expenses (excl. restructuring) |
1,465 | 1,405 | 1,497 | 1,324 | ||||||||||||
| v) Restructuring |
31 | 113 | 24 | 100 | ||||||||||||
| Total operating expenses |
9,359 | 8,760 | 7,350 | 6,878 | ||||||||||||
78
ANZ ANNUAL REPORT 2015
5: Income Tax
| Consolidated | The Company1 | |||||||||||||||
| INCOME TAX EXPENSE | 2015 $m |
2014 $m |
2015 $m |
2014 $m |
||||||||||||
| Income tax recognised in the income statement |
||||||||||||||||
| Tax expense comprises: |
||||||||||||||||
| Current tax expense |
2,932 | 2,658 | 1,866 | 1,769 | ||||||||||||
| Adjustments recognised in the current year in relation to the current tax of prior years |
– | 1 | 1 | – | ||||||||||||
| Deferred tax expense/(income) relating to the origination and reversal of temporary differences |
94 | 366 | 78 | 202 | ||||||||||||
| Total income tax expense charged in the income statement |
3,026 | 3,025 | 1,945 | 1,971 | ||||||||||||
| Reconciliation of the prima facie income tax expense on pre-tax profit with the income tax expense charged in the income statement |
||||||||||||||||
| Profit before income tax |
10,533 | 10,308 | 9,251 | 8,407 | ||||||||||||
| Prima facie income tax expense at 30% |
3,160 | 3,092 | 2,775 | 2,522 | ||||||||||||
| Tax effect of permanent differences: |
||||||||||||||||
| Overseas tax rate differential |
(95 | ) | (102 | ) | (22 | ) | (25 | ) | ||||||||
| Rebateable and non-assessable dividends |
(2 | ) | (2 | ) | (771 | ) | (570 | ) | ||||||||
| Profit from associates |
(187 | ) | (155 | ) | (113 | ) | (74 | ) | ||||||||
| Sale of ANZ Trustees and SSI |
– | (11 | ) | – | (11 | ) | ||||||||||
| Offshore Banking Units |
(1 | ) | 5 | (1 | ) | 5 | ||||||||||
| Foreign exchange translation of US hybrid loan capital |
– | – | – | 72 | ||||||||||||
| ANZ Wealth Australia – policyholder income and contributions tax |
130 | 170 | – | – | ||||||||||||
| ANZ Wealth Australia – tax consolidation benefit |
(56 | ) | – | – | – | |||||||||||
| Tax provisions no longer required |
(17 | ) | (50 | ) | (17 | ) | (40 | ) | ||||||||
| Interest on convertible instruments |
72 | 71 | 72 | 71 | ||||||||||||
| Other |
22 | 6 | 21 | 21 | ||||||||||||
| 3,026 | 3,024 | 1,944 | 1,971 | |||||||||||||
| Income tax (over) provided in previous years |
– | 1 | 1 | – | ||||||||||||
| Total income tax expense charged in the income statement |
3,026 | 3,025 | 1,945 | 1,971 | ||||||||||||
| Effective tax rate |
28.7% | 29.3% | 21.0% | 23.4% | ||||||||||||
| Australia |
2,144 | 2,136 | 1,806 | 1,811 | ||||||||||||
| Overseas |
882 | 889 | 139 | 160 | ||||||||||||
| 1 | Comparative amounts have changed as a result of changes to the income statement disclosed in note 45. |
TAX CONSOLIDATION
The Company and all its wholly owned Australian resident entities are part of a tax-consolidated group under Australian taxation law. The Company is the head entity in the tax-consolidated group. Tax expense/income and deferred tax liabilities/assets arising from temporary differences of the members of the tax-consolidated group are recognised in the separate financial statements of the members of the tax consolidated group on a ‘group allocation’ basis. Current tax liabilities and assets of the tax consolidated group are recognised by the Company (as head entity in the tax-consolidated group).
Due to the existence of a tax funding arrangement between the entities in the tax-consolidated group, amounts are recognised as payable to or receivable by the Company and each member of the tax-consolidated group in relation to the tax contribution amounts paid or payable between the Company and the other members of the tax consolidated group in accordance with the arrangement.
Members of the tax-consolidated group have also entered into a tax sharing agreement that provides for the allocation of income tax liabilities between the entities should the head entity default on its income tax payment obligations.
| NOTES TO THE FINANCIAL STATEMENTS 79 | ||
NOTES TO THE FINANCIAL STATEMENTS (continued)
5: Income Tax (continued)
| Consolidated | The Company | |||||||||||||||
| TAX ASSETS | 2015 $m |
2014 $m |
2015 $m |
2014 $m |
||||||||||||
| Australia |
||||||||||||||||
| Current tax asset |
59 | 9 | 59 | 9 | ||||||||||||
| Deferred tax asset |
208 | 280 | 585 | 676 | ||||||||||||
| 267 | 289 | 644 | 685 | |||||||||||||
| New Zealand |
||||||||||||||||
| Deferred tax asset |
– | – | 5 | 6 | ||||||||||||
| – | – | 5 | 6 | |||||||||||||
| Asia Pacific, Europe & America |
||||||||||||||||
| Current tax asset |
31 | 29 | 25 | 18 | ||||||||||||
| Deferred tax asset |
194 | 137 | 122 | 96 | ||||||||||||
| 225 | 166 | 147 | 114 | |||||||||||||
| Total current and deferred tax assets |
492 | 455 | 796 | 805 | ||||||||||||
| Total current tax assets |
90 | 38 | 84 | 27 | ||||||||||||
| Total deferred tax assets |
402 | 417 | 712 | 778 | ||||||||||||
| Deferred tax assets recognised in profit or loss |
||||||||||||||||
| Collective provision for loans and advances |
767 | 724 | 626 | 594 | ||||||||||||
| Individual provision for impaired loans and advances |
259 | 292 | 215 | 236 | ||||||||||||
| Other provisions |
285 | 272 | 205 | 184 | ||||||||||||
| Provision for employee entitlements |
158 | 152 | 120 | 119 | ||||||||||||
| Other |
170 | 203 | 66 | 102 | ||||||||||||
| 1,639 | 1,643 | 1,232 | 1,235 | |||||||||||||
| Deferred tax assets recognised directly in equity |
||||||||||||||||
| Available-for-sale revaluation reserve |
– | – | 9 | – | ||||||||||||
| Own credit risk of financial liabilities |
– | 10 | – | 10 | ||||||||||||
| – | 10 | 9 | 10 | |||||||||||||
| Set-off of deferred tax assets pursuant to set-off provisions1 |
(1,237 | ) | (1,236 | ) | (529 | ) | (467 | ) | ||||||||
| Net deferred tax assets |
402 | 417 | 712 | 778 | ||||||||||||
| Unrecognised deferred tax assets |
||||||||||||||||
| The following deferred tax assets will only be recognised if: | ||||||||||||||||
| } assessable income derived is of a nature and an amount sufficient to enable the benefit to be realised; |
||||||||||||||||
| } the conditions for deductibility imposed by tax legislation are complied with; and |
||||||||||||||||
| } no changes in tax legislation adversely affect the Group in realising the benefit. |
||||||||||||||||
| Unused realised tax losses (on revenue account) |
5 | 5 | – | – | ||||||||||||
| Total unrecognised deferred tax assets |
5 | 5 | – | – | ||||||||||||
| 1 | Deferred tax assets and liabilities are set-off where they relate to income tax levied by the same taxation authority on either the same taxable entity or different taxable entities within the same taxable group. |
| 80 |
ANZ ANNUAL REPORT 2015
5: Income Tax (continued)
| Consolidated | The Company | |||||||||||||||
| TAX LIABILITIES | 2015 $m |
2014 $m |
2015 $m |
2014 $m |
||||||||||||
| Australia |
||||||||||||||||
| Current tax payable |
– | 208 | – | 208 | ||||||||||||
| – | 208 | – | 208 | |||||||||||||
| New Zealand |
||||||||||||||||
| Current tax payable |
74 | 60 | 18 | 21 | ||||||||||||
| Deferred tax liabilities |
113 | 53 | – | – | ||||||||||||
| 187 | 113 | 18 | 21 | |||||||||||||
| Asia Pacific, Europe & America |
||||||||||||||||
| Current tax payable |
193 | 181 | 76 | 72 | ||||||||||||
| Deferred tax liabilities |
136 | 67 | 123 | 62 | ||||||||||||
| 329 | 248 | 199 | 134 | |||||||||||||
| Total current and deferred tax liabilities |
516 | 569 | 217 | 363 | ||||||||||||
| Total current tax liabilities |
267 | 449 | 94 | 301 | ||||||||||||
| Total deferred tax liabilities |
249 | 120 | 123 | 62 | ||||||||||||
| Deferred tax liabilities recognised in profit or loss |
||||||||||||||||
| Acquired portfolio of insurance and investment business |
214 | 235 | – | – | ||||||||||||
| Insurance related deferred acquisition costs |
135 | 124 | – | – | ||||||||||||
| Lease finance |
289 | 249 | 64 | 41 | ||||||||||||
| Other |
660 | 562 | 434 | 375 | ||||||||||||
| 1,298 | 1,170 | 498 | 416 | |||||||||||||
| Deferred tax liabilities recognised directly in equity |
||||||||||||||||
| Cash flow hedges |
117 | 73 | 122 | 76 | ||||||||||||
| Foreign currency translation reserve |
36 | 36 | – | – | ||||||||||||
| Available-for-sale revaluation reserve |
14 | 75 | – | 29 | ||||||||||||
| Defined benefits obligation |
16 | 2 | 27 | 8 | ||||||||||||
| Own credit risk of financial liabilities |
5 | – | 5 | – | ||||||||||||
| 188 | 186 | 154 | 113 | |||||||||||||
| Set-off of deferred tax liabilities pursuant to set-off provision1 |
(1,237 | ) | (1,236 | ) | (529 | ) | (467 | ) | ||||||||
| Net deferred tax liability |
249 | 120 | 123 | 62 | ||||||||||||
| Unrecognised deferred tax liabilities |
||||||||||||||||
| The following deferred tax liabilities have not been brought to account as liabilities: |
||||||||||||||||
| Other unrealised taxable temporary differences2 |
386 | 323 | 70 | 45 | ||||||||||||
| Total unrecognised deferred tax liabilities |
386 | 323 | 70 | 45 | ||||||||||||
| 1 | Deferred tax assets and liabilities are set-off where they relate to income tax levied by the same taxation authority on either the same taxable entity or different taxable entities within the same taxable group. |
| 2 | Represents additional potential foreign tax costs should all retained earnings in offshore branches and subsidiaries be repatriated. |
| NOTES TO THE FINANCIAL STATEMENTS 81 | ||
NOTES TO THE FINANCIAL STATEMENTS (continued)
6: Dividends
| Consolidated1 | The Company | |||||||||||||||
| 2015 $m |
2014 $m |
2015 $m |
2014 $m |
|||||||||||||
| Ordinary share dividends2 |
||||||||||||||||
| Interim dividend |
2,379 | 2,278 | 2,379 | 2,278 | ||||||||||||
| Final dividend |
2,619 | 2,497 | 2,619 | 2,497 | ||||||||||||
| Bonus option plan adjustment |
(92 | ) | (81 | ) | (92 | ) | (81 | ) | ||||||||
| Dividend on ordinary shares |
4,906 | 4,694 | 4,906 | 4,694 | ||||||||||||
| 1 | Excludes dividends paid by subsidiaries of the Group to non-controlling equity holders (2015: $1 million, 2014: $1 million). |
| 2 | Dividends are not accrued and are recorded when paid. |
A final dividend of 95 cents, fully franked for Australian tax purposes, is proposed to be paid on each eligible fully paid ANZ ordinary share on 16 December 2015 (2014: final dividend of 95 cents, paid 16 December 2014, fully franked for Australian tax purposes). It is proposed that New Zealand imputation credits of NZ 11 cents per fully paid ANZ ordinary share will also be attached to the 2015 final dividend (2014: NZ 12 cents). The 2015 interim dividend of 86 cents, paid 1 July 2015, was fully franked for Australian tax purposes (2014: interim dividend of 83 cents, paid 1 July 2014, fully franked for Australian tax purposes). New Zealand imputation credits of NZ 10 cents per fully paid ANZ ordinary share were attached to the 2015 interim dividend (2014: NZ 10 cents).
The tax rate applicable to the Australian franking credits attached to the 2015 interim dividend and to be attached to the proposed 2015 final dividend is 30% (2014: 30%).
Dividends paid in cash or satisfied by the issue of shares under the dividend reinvestment plan during the years ended 30 September 2015 and 2014 were as follows:
| Consolidated | The Company | |||||||||||||||
| 2015 $m |
2014 $m |
2015 $m |
2014 $m |
|||||||||||||
| Paid in cash1 |
3,784 | 3,843 | 3,784 | 3,843 | ||||||||||||
| Satisfied by share issue2 |
1,122 | 851 | 1,122 | 851 | ||||||||||||
| 4,906 | 4,694 | 4,906 | 4,694 | |||||||||||||
| Consolidated | The Company | |||||||||||||||
| 2015 $m |
2014 $m |
2015 $m |
2014 $m |
|||||||||||||
| Preference share dividend3 |
||||||||||||||||
| Euro Trust Securities4 |
1 | 6 | – | – | ||||||||||||
| Dividend on preference shares |
1 | 6 | – | – | ||||||||||||
| 1 | Refers to cash paid to shareholders who did not elect to participate in the dividend reinvestment plan or the bonus option plan. |
| 2 | Includes shares issued to participating shareholders under the dividend reinvestment plan. |
| 3 | Dividends are not accrued and are recorded when paid. |
| 4 | Refer to note 30 for details. |
DIVIDEND FRANKING ACCOUNT
| 2015 $m |
2014 $m |
|||||||
| Australian franking credits available for subsequent financial years at a corporate tax rate of 30% (2014: 30%) |
593 | 982 | ||||||
The above amounts represent the balances of the franking accounts as at the end of the financial year, adjusted for:
| } | franking credits that will arise from the payment of income tax payable as at the end of the financial year, and |
| } | franking credits/debits that will arise from the receipt/payment of dividends that have been recognised as tax receivables/payables as at the end of the financial year. |
| 82 |
ANZ ANNUAL REPORT 2015
6: Dividends (continued)
| NOTES TO THE FINANCIAL STATEMENTS 83 | ||
NOTES TO THE FINANCIAL STATEMENTS (continued)
7: Earnings Per Ordinary Share
| Consolidated | ||||||||
| 2015 $m |
2014 $m |
|||||||
| Basic earnings per share (cents) |
271.5 | 267.1 | ||||||
|
Earnings reconciliation ($ millions) |
||||||||
| Profit for the year |
7,507 | 7,283 | ||||||
| Less: profit attributable to minority interests |
14 | 12 | ||||||
| Less: preference share dividend paid |
1 | 6 | ||||||
| Earnings used in calculating basic earnings per share |
7,492 | 7,265 | ||||||
| Weighted average number of ordinary shares (millions)1 |
2,759.0 | 2,719.7 | ||||||
| Diluted earnings per share (cents) |
257.2 | 257.0 | ||||||
|
Earnings reconciliation ($ millions) |
||||||||
| Earnings used in calculating basic earnings per share |
7,492 | 7,265 | ||||||
| Add: US Trust Securities interest expense |
– | 7 | ||||||
| Add: ANZ Convertible Preference Shares interest expense |
128 | 155 | ||||||
| Add: ANZ Capital Notes interest expense |
134 | 81 | ||||||
| Add: ANZ NZ Capital Notes interest expense |
12 | – | ||||||
| Earnings used in calculating diluted earnings per share |
7,766 | 7,508 | ||||||
|
Weighted average number of ordinary shares (millions)1 |
||||||||
| Used in calculating basic earnings per share |
2,759.0 | 2,719.7 | ||||||
| Add: weighted average number of options/rights potentially convertible to ordinary shares |
6.2 | 5.5 | ||||||
| weighted average number of convertible US Trust Securities at current market prices |
– | 6.1 | ||||||
| weighted average number of ANZ Convertible Preference Shares |
123.4 | 127.5 | ||||||
| weighted average number of ANZ Capital Notes |
122.7 | 63.1 | ||||||
| weighted average number of ANZ NZ Capital Notes |
8.5 | – | ||||||
| Used in calculating diluted earnings per share |
3,019.8 | 2,921.9 | ||||||
| 1 | Weighted average number of ordinary shares excludes 11.8 million weighted average number of ordinary treasury shares held in ANZEST Pty Ltd (2014: 14.5 million) for the Group employee share acquisition scheme and 12.4 million weighted average number of ordinary treasury shares held in ANZ Wealth Australia (2014: 12.5 million). |
84
ANZ ANNUAL REPORT 2015
8: Segment Analysis
(i) DESCRIPTION OF SEGMENTS
(ii) OPERATING SEGMENTS
Transactions between business units across segments within ANZ are conducted on an arms length basis.
| Year ended 30 September 2015 ($m) | Australia | International and Institutional Banking |
New Zealand |
Global Wealth | GTSO and Group Centre |
Other items1 |
Group Total |
|||||||||||||||||||||
| External interest income |
15,997 | 8,312 | 5,853 | 297 | 67 | – | 30,526 | |||||||||||||||||||||
| External interest expense |
(4,540 | ) | (3,262 | ) | (3,118 | ) | (524 | ) | (4,466 | ) | – | (15,910 | ) | |||||||||||||||
| Adjustment for intersegment interest |
3,948 | 877 | 419 | (405 | ) | (4,839 | ) | – | – | |||||||||||||||||||
| Net interest income |
7,509 | 4,173 | 2,316 | 178 | 440 | – | 14,616 | |||||||||||||||||||||
| Other external operating income |
1,166 | 2,629 | 365 | 1,552 | (435 | ) | 553 | 5,830 | ||||||||||||||||||||
| Share of associates’ profit |
2 | 618 | 4 | 1 | – | – | 625 | |||||||||||||||||||||
| Segment revenue |
8,678 | 7,419 | 2,684 | 1,730 | 7 | 553 | 21,071 | |||||||||||||||||||||
| Other external expenses |
(1,808 | ) | (1,999 | ) | (663 | ) | (571 | ) | (4,318 | ) | – | (9,359 | ) | |||||||||||||||
| Adjustments for intersegment expenses |
(1,349 | ) | (1,617 | ) | (401 | ) | (404 | ) | 3,771 | – | – | |||||||||||||||||
| Operating expenses |
(3,157 | ) | (3,616 | ) | (1,064 | ) | (975 | ) | (547 | ) | – | (9,359 | ) | |||||||||||||||
| Profit before credit impairment and income tax |
5,521 | 3,803 | 1,620 | 755 | (540 | ) | 553 | 11,712 | ||||||||||||||||||||
| Credit impairment (charge)/release |
(853 | ) | (295 | ) | (55 | ) | – | (2 | ) | 26 | (1,179 | ) | ||||||||||||||||
| Segment result before tax |
4,668 | 3,508 | 1,565 | 755 | (542 | ) | 579 | 10,533 | ||||||||||||||||||||
| Income tax expense |
(1,394 | ) | (830 | ) | (438 | ) | (154 | ) | 92 | (302 | ) | (3,026 | ) | |||||||||||||||
| Non-controlling interests |
– | (14 | ) | – | – | – | – | (14 | ) | |||||||||||||||||||
| Profit after income tax attributed to shareholders of the company |
3,274 | 2,664 | 1,127 | 601 | (450 | ) | 277 | 7,493 | ||||||||||||||||||||
| Non-cash expenses |
||||||||||||||||||||||||||||
| Depreciation and amortisation |
(158 | ) | (187 | ) | (15 | ) | (109 | ) | (486 | ) | – | (955 | ) | |||||||||||||||
| Equity-settled share based payment expenses |
(14 | ) | (137 | ) | (12 | ) | (8 | ) | (45 | ) | – | (216 | ) | |||||||||||||||
| Credit impairment (charge)/release |
(853 | ) | (295 | ) | (55 | ) | – | (2 | ) | 26 | (1,179 | ) | ||||||||||||||||
| Financial position |
||||||||||||||||||||||||||||
| Goodwill |
– | 1,180 | 1,801 | 1,616 | – | – | 4,597 | |||||||||||||||||||||
| Investments in associates |
14 | 5,419 | 4 | 3 | – | – | 5,440 | |||||||||||||||||||||
| 1 | In evaluating the performance of the operating segments, certain items are removed from the operating segment result where they are not considered integral to the ongoing performance of the segment and are evaluated separately. These items are set out in part (iii) of this note (refer pages 184 to 185 for further analysis). |
NOTES TO THE FINANCIAL STATEMENTS 85
NOTES TO THE FINANCIAL STATEMENTS (continued)
8: Segment Analysis (continued)
| Year ended 30 September 2014 ($m) | Australia | International and Institutional Banking |
New Zealand |
Global Wealth |
GTSO and Group Centre |
Other items1 |
Group Total |
|||||||||||||||||||||
| External interest income |
16,069 | 7,783 | 5,251 | 307 | 114 | – | 29,524 | |||||||||||||||||||||
| External interest expense |
(5,159) | (2,965) | (2,624) | (442) | (4,538) | 14 | (15,714) | |||||||||||||||||||||
| Adjustment for intersegment interest |
(3,833) | (809) | (456) | 303 | 4,796 | (1) | – | |||||||||||||||||||||
| Net interest income |
7,077 | 4,009 | 2,171 | 168 | 372 | 13 | 13,810 | |||||||||||||||||||||
| Other external operating income |
1,113 | 2,585 | 348 | 1,577 | (359) | 463 | 5,727 | |||||||||||||||||||||
| Share of associates’ profit |
3 | 511 | 1 | – | 2 | – | 517 | |||||||||||||||||||||
| Segment revenue |
8,193 | 7,105 | 2,520 | 1,745 | 15 | 476 | 20,054 | |||||||||||||||||||||
| Other external expenses |
(1,658) | (1,790) | (644) | (602) | (4,066) | – | (8,760) | |||||||||||||||||||||
| Adjustments for intersegment expenses |
(1,357) | (1,485) | (387) | (402) | 3,631 | – | – | |||||||||||||||||||||
| Operating expenses |
(3,015) | (3,275) | (1,031) | (1,004) | (435) | – | (8,760) | |||||||||||||||||||||
| Profit before credit impairment and income tax |
5,178 | 3,830 | 1,489 | 741 | (420) | 476 | 11,294 | |||||||||||||||||||||
| Credit impairment (charge)/release |
(818) | (216) | 8 | 2 | 35 | 3 | (986) | |||||||||||||||||||||
| Segment result before tax |
4,360 | 3,614 | 1,497 | 743 | (385) | 479 | 10,308 | |||||||||||||||||||||
| Income tax expense |
(1,306) | (894) | (419) | (201) | 120 | (325) | (3,025) | |||||||||||||||||||||
| Non-controlling interests |
– | (12) | – | – | – | – | (12) | |||||||||||||||||||||
| Profit after income tax attributed to shareholders of the company |
3,054 | 2,708 | 1,078 | 542 | (265) | 154 | 7,271 | |||||||||||||||||||||
| Non-cash expenses |
||||||||||||||||||||||||||||
| Depreciation and amortisation |
(119) | (155) | (16) | (120) | (429) | – | (839) | |||||||||||||||||||||
| Equity-settled share based payment expenses |
(16) | (130) | (13) | (7) | (49) | – | (215) | |||||||||||||||||||||
| Credit impairment (charge)/release |
(818) | (216) | 8 | 2 | 35 | 3 | (986) | |||||||||||||||||||||
| Financial position |
||||||||||||||||||||||||||||
| Goodwill |
– | 1,131 | 1,766 | 1,614 | – | – | 4,511 | |||||||||||||||||||||
| Investments in associates |
11 | 4,485 | 3 | 6 | 77 | – | 4,582 | |||||||||||||||||||||
| 1 | In evaluating the performance of the operating segments, certain items are removed from the operating segment result, where they are not considered integral to the ongoing performance of the segment and are evaluated separately. These items are set out in part (iii) of this note (refer pages 184 to 185 for further analysis). |
(iii) OTHER ITEMS
The table below sets out the profit after tax impact of other items.
| Profit after tax | ||||||||||
| Item | Related segment | 2015 $m |
2014 $m |
|||||||
| Treasury shares adjustment |
Global Wealth | 16 | (24 | ) | ||||||
| Revaluation of policy liabilities |
Global Wealth | 73 | 26 | |||||||
| Economic hedging |
International and Institutional Banking | 179 | 72 | |||||||
| Revenue and net investment hedges |
GTSO and Group Centre | 3 | 101 | |||||||
| Structured credit intermediation trades |
International and Institutional Banking |
6 | (21 | ) | ||||||
| Total |
277 | 154 | ||||||||
86
ANZ ANNUAL REPORT 2015
8: Segment Analysis (continued)
(iv) EXTERNAL SEGMENT REVENUE BY PRODUCTS AND SERVICES
The table below sets out revenue from external customers for groups of similar products and services. No single customer amounts to greater than 10% of the Group’s revenue.
| Revenue1 | ||||||||
|
2015 |
2014 $m |
|||||||
| Retail |
8,104 | 7,464 | ||||||
| Commercial |
4,199 | 4,057 | ||||||
| Wealth |
1,730 | 1,745 | ||||||
| Institutional |
5,818 | 5,794 | ||||||
| Partnerships |
608 | 487 | ||||||
| Other |
612 | 507 | ||||||
| 21,071 | 20,054 | |||||||
(v) GEOGRAPHICAL INFORMATION
The following table sets out revenue and non-current assets based on the geographical locations in which the Group operates.
| Australia | APEA | New Zealand | Total | |||||||||||||||||||||||||||||
| Consolidated |
2015 |
2014 $m |
2015 $m |
2014 $m |
2015 $m |
2014 $m |
2015 $m |
2014 $m |
||||||||||||||||||||||||
| Total external revenue1 |
13,346 | 12,926 | 4,013 | 3,650 | 3,712 | 3,478 | 21,071 | 20,054 | ||||||||||||||||||||||||
| Non-current assets2 |
347,040 | 308,768 | 55,257 | 42,326 | 79,337 | 72,989 | 481,635 | 424,083 | ||||||||||||||||||||||||
| 1 | Includes net interest income. |
| 2 | Non-current assets refers to assets that are expected to be recovered more than 12 months after balance date. They do not include financial instruments, deferred tax assets, post-employment benefits assets or rights under insurance contracts. |
NOTES TO THE FINANCIAL STATEMENTS 87
NOTES TO THE FINANCIAL STATEMENTS (continued)
9: Notes to the Cash Flow Statement
a) Reconciliation of net profit after income tax to net cash provided by operating activities
| Consolidated | The Company | |||||||||||||||
| 2015 $m |
2014 |
2015 $m |
2014 $m |
|||||||||||||
| Operating profit after income tax attributable to shareholders of the Company |
7,493 | 7,271 | 7,306 | 6,436 | ||||||||||||
| Adjustment to reconcile operating profit after income tax to net cash provided by operating activities |
||||||||||||||||
| Provision for credit impairment |
1,179 | 986 | 969 | 974 | ||||||||||||
| Depreciation and amortisation |
955 | 839 | 735 | 597 | ||||||||||||
| Profit on sale of businesses |
– | (146 | ) | – | (136 | ) | ||||||||||
| Net loss on disposal of premises and equipment |
6 | 40 | 12 | 14 | ||||||||||||
| Net derivatives/foreign exchange adjustment |
14,395 | (1,257 | ) | 11,976 | 80 | |||||||||||
| Equity settled share-based payments expense1 |
18 | 27 | (13 | ) | (5 | ) | ||||||||||
| Other non-cash movements |
(499 | ) | (501 | ) | (429 | ) | (312 | ) | ||||||||
| Net (increase)/decrease in operating assets |
||||||||||||||||
| Collateral paid |
(3,585 | ) | 1,271 | (2,427 | ) | 957 | ||||||||||
| Trading securities |
2,870 | (8,600 | ) | 2,161 | (7,131 | ) | ||||||||||
| Loans and advances |
(32,280 | ) | (35,154 | ) | (21,759 | ) | (29,408 | ) | ||||||||
| Investments backing policy liabilities |
(1,787 | ) | (1,802 | ) | – | – | ||||||||||
| Net intra-group loans and advances |
– | – | (992 | ) | 1,856 | |||||||||||
| Interest receivable |
106 | (162 | ) | 54 | (108 | ) | ||||||||||
| Accrued income |
(44 | ) | 9 | (46 | ) | 28 | ||||||||||
| Net tax assets |
(56 | ) | (182 | ) | (443 | ) | (644 | ) | ||||||||
| Net (decrease)/increase in operating liabilities |
||||||||||||||||
| Deposits and other borrowings |
30,050 | 36,592 | 22,210 | 31,798 | ||||||||||||
| Settlement balances owed by ANZ |
781 | 1,358 | 1,422 | 668 | ||||||||||||
| Collateral received |
1,073 | 1,435 | 854 | 1,103 | ||||||||||||
| Life insurance contract policy liabilities |
1,507 | 2,147 | – | – | ||||||||||||
| Payables and other liabilities |
(974 | ) | 910 | (1,491 | ) | 1,417 | ||||||||||
| Interest payable |
452 | 828 | 435 | 828 | ||||||||||||
| Accrued expenses |
(148 | ) | (136 | ) | (186 | ) | (124 | ) | ||||||||
| Provisions including employee entitlements |
(36 | ) | (130 | ) | 32 | (131 | ) | |||||||||
| Total adjustments |
13,983 | (1,628 | ) | 13,074 | 2,321 | |||||||||||
| Net cash provided by operating activities |
21,476 | 5,643 | 20,380 | 8,757 | ||||||||||||
| 1 | The equity settled share-based payments expense is net of on-market share purchases of $198 million (2014: $188 million) in the Group and the Company used to satisfy the obligation. |
b) Reconciliation of cash and cash equivalents
Cash and cash equivalents at the end of the period as shown in the Cash Flow Statement is reflected in the related items in the Balance Sheet as follows:
| Consolidated | The Company | |||||||||||||||
| 2015 $m |
2014 $m |
2015 $m |
2014 $m |
|||||||||||||
| Cash |
53,903 | 32,559 | 51,217 | 30,655 | ||||||||||||
| Settlement balances owed to ANZ |
15,375 | 15,670 | 13,619 | 14,393 | ||||||||||||
| 69,278 | 48,229 | 64,836 | 45,048 | |||||||||||||
| c) Acquisitions and disposals
|
||||||||||||||||
| Cash (outflows) from acquisitions and investments (net of cash acquired) |
||||||||||||||||
| Investments in controlled entities |
– | – | (1,375 | ) | (21 | ) | ||||||||||
| – | – | (1,375 | ) | (21 | ) | |||||||||||
| Cash inflows from disposals (net of cash disposed) |
||||||||||||||||
| Disposals of controlled entities |
– | 148 | – | 156 | ||||||||||||
| Disposals of associates |
4 | 103 | – | 93 | ||||||||||||
| 4 | 251 | – | 249 | |||||||||||||
| d) Non-cash financing activities
|
||||||||||||||||
| Dividends satisfied by share issue |
1,122 | 851 | 1,122 | 851 | ||||||||||||
| Dividends satisfied by bonus share issue |
92 | 81 | 92 | 81 | ||||||||||||
| 1,214 | 932 | 1,214 | 932 | |||||||||||||
88
ANZ ANNUAL REPORT 2015
10: Cash
| Consolidated | The Company | |||||||||||||||
| 2015 $m |
2014 $m |
2015 $m |
2014 $m |
|||||||||||||
| Coins, notes and cash at bank |
1,716 | 1,487 | 1,045 | 1,005 | ||||||||||||
| Money at call, bills receivable and remittances in transit |
1 | 6 | 1 | 1 | ||||||||||||
| Securities purchased under agreements to resell in less than three months |
12,053 | 9,851 | 11,757 | 9,631 | ||||||||||||
| Balances with Central Banks |
40,133 | 21,215 | 38,414 | 20,018 | ||||||||||||
| Total cash |
53,903 | 32,559 | 51,217 | 30,655 | ||||||||||||
11: Trading Securities
| Consolidated | The Company | |||||||||||||||
| 2015 $m |
2014 $m |
2015 $m |
2014 $m |
|||||||||||||
| Government securities |
24,702 | 24,867 | 18,515 | 18,337 | ||||||||||||
| Corporate and financial institution securities |
18,389 | 20,618 | 12,947 | 15,559 | ||||||||||||
| Equity and other securities |
5,909 | 4,207 | 5,911 | 4,153 | ||||||||||||
| Total trading securities |
49,000 | 49,692 | 37,373 | 38,049 | ||||||||||||
12: Derivative Financial Instruments
| NOTES TO THE FINANCIAL STATEMENTS 89 |
NOTES TO THE FINANCIAL STATEMENTS (continued)
12: Derivative Financial Instruments (continued)
| Fair Value | ||||||||||||||||||||||||||||||||||||||||||||||||||
| Trading | Hedging | Total | ||||||||||||||||||||||||||||||||||||||||||||||||
| Notional | Fair value | Cash flow | Net investment | |||||||||||||||||||||||||||||||||||||||||||||||
| Consolidated at 30 September 2015 |
Principal $m |
Assets $m |
Liabilities $m |
Assets $m |
Liabilities $m |
Assets $m |
Liabilities $m |
Assets $m |
Liabilities $m |
Assets $m |
Liabilities $m |
|||||||||||||||||||||||||||||||||||||||
| Foreign exchange contracts |
||||||||||||||||||||||||||||||||||||||||||||||||||
| Spot and forward contracts |
1,267,164 | 15,200 | (13,964 | ) | – | – | – | – | 8 | – | 15,208 | (13,964) | ||||||||||||||||||||||||||||||||||||||
| Swap agreements |
652,681 | 20,965 | (20,257 | ) | 2 | (4 | ) | – | – | – | (9 | ) | 20,967 | (20,270) | ||||||||||||||||||||||||||||||||||||
| Options purchased |
92,330 | 2,441 | – | – | – | – | – | – | – | 2,441 | – | |||||||||||||||||||||||||||||||||||||||
| Options sold |
110,956 | – | (2,081 | ) | – | – | – | – | – | – | – | (2,081) | ||||||||||||||||||||||||||||||||||||||
| 2,123,131 | 38,606 | (36,302 | ) | 2 | (4 | ) | – | – | 8 | (9 | ) | 38,616 | (36,315) | |||||||||||||||||||||||||||||||||||||
| Commodity contracts |
||||||||||||||||||||||||||||||||||||||||||||||||||
| Derivative contracts |
43,869 | 2,750 | (2,207 | ) | – | – | – | – | – | – | 2,750 | (2,207) | ||||||||||||||||||||||||||||||||||||||
| Interest rate contracts |
||||||||||||||||||||||||||||||||||||||||||||||||||
| Forward rate agreements |
343,457 | 37 | (51 | ) | – | – | – | – | – | – | 37 | (51) | ||||||||||||||||||||||||||||||||||||||
| Swap agreements |
3,665,593 | 39,278 | (38,004 | ) | 2,329 | (1,770 | ) | 1,360 | (973 | ) | – | – | 42,967 | (40,747) | ||||||||||||||||||||||||||||||||||||
| Futures contracts |
158,579 | 27 | (79 | ) | 1 | (17 | ) | – | – | – | – | 28 | (96) | |||||||||||||||||||||||||||||||||||||
| Options purchased |
93,055 | 944 | – | – | – | – | – | – | – | 944 | – | |||||||||||||||||||||||||||||||||||||||
| Options sold |
72,462 | – | (1,573 | ) | – | – | – | – | – | – | – | (1,573) | ||||||||||||||||||||||||||||||||||||||
| 4,333,146 | 40,286 | (39,707 | ) | 2,330 | (1,787 | ) | 1,360 | (973 | ) | – | – | 43,976 | (42,467) | |||||||||||||||||||||||||||||||||||||
| Credit default swaps |
||||||||||||||||||||||||||||||||||||||||||||||||||
| Structured credit derivatives purchased |
728 | 52 | – | – | – | – | – | – | – | 52 | – | |||||||||||||||||||||||||||||||||||||||
| Other credit derivatives purchased |
22,284 | 205 | (194 | ) | – | – | – | – | – | – | 205 | (194) | ||||||||||||||||||||||||||||||||||||||
| Total credit derivatives purchased |
23,012 | 257 | (194 | ) | – | – | – | – | – | – | 257 | (194) | ||||||||||||||||||||||||||||||||||||||
| Structured credit derivatives sold |
728 | – | (67 | ) | – | – | – | – | – | – | – | (67) | ||||||||||||||||||||||||||||||||||||||
| Other credit derivatives sold |
21,474 | 26 | (20 | ) | – | – | – | – | – | – | 26 | (20) | ||||||||||||||||||||||||||||||||||||||
| Total credit derivatives sold |
22,202 | 26 | (87 | ) | – | – | – | – | – | – | 26 | (87) | ||||||||||||||||||||||||||||||||||||||
| 45,214 | 283 | (281 | ) | – | – | – | – | – | – | 283 | (281) | |||||||||||||||||||||||||||||||||||||||
| Total |
6,545,360 | 81,925 | (78,497 | ) | 2,332 | (1,791 | ) | 1,360 | (973 | ) | 8 | (9 | ) | 85,625 | (81,270) | |||||||||||||||||||||||||||||||||||
90
ANZ ANNUAL REPORT 2015
12: Derivative Financial Instruments (continued)
| Fair Value | ||||||||||||||||||||||||||||||||||||||||||||||||||
| Trading | Hedging | Total | ||||||||||||||||||||||||||||||||||||||||||||||||
| Notional | Fair value | Cash flow | Net investment | |||||||||||||||||||||||||||||||||||||||||||||||
| Consolidated at 30 September 2014 |
Principal Amount $m |
Assets $m |
Liabilities $m |
Assets $m |
Liabilities $m |
Assets $m |
Liabilities $m |
Assets $m |
Liabilities $m |
Assets $m |
Liabilities $m |
|||||||||||||||||||||||||||||||||||||||
| Foreign exchange contracts |
||||||||||||||||||||||||||||||||||||||||||||||||||
| Spot and forward contracts |
746,023 | 10,264 | (9,324 | ) | – | – | – | – | – | (4 | ) | 10,264 | (9,328) | |||||||||||||||||||||||||||||||||||||
| Swap agreements |
640,600 | 19,191 | (19,003 | ) | 66 | (40 | ) | – | – | – | – | 19,257 | (19,043) | |||||||||||||||||||||||||||||||||||||
| Options purchased |
105,985 | 2,079 | – | – | – | – | – | – | – | 2,079 | – | |||||||||||||||||||||||||||||||||||||||
| Options sold |
139,062 | – | (1,923 | ) | – | – | – | – | – | – | – | (1,923) | ||||||||||||||||||||||||||||||||||||||
| 1,631,670 | 31,534 | (30,250 | ) | 66 | (40 | ) | – | – | – | (4 | ) | 31,600 | (30,294) | |||||||||||||||||||||||||||||||||||||
| Commodity contracts |
||||||||||||||||||||||||||||||||||||||||||||||||||
| Derivative contracts |
33,886 | 1,612 | (946 | ) | – | – | – | – | – | – | 1,612 | (946) | ||||||||||||||||||||||||||||||||||||||
| Interest rate contracts |
||||||||||||||||||||||||||||||||||||||||||||||||||
| Forward rate agreements |
65,754 | 4 | (10 | ) | – | – | – | (1 | ) | – | – | 4 | (11) | |||||||||||||||||||||||||||||||||||||
| Swap agreements |
2,837,264 | 19,768 | (19,049 | ) | 1,808 | (888 | ) | 765 | (499 | ) | – | – | 22,341 | (20,436) | ||||||||||||||||||||||||||||||||||||
| Futures contracts |
128,208 | 33 | (75 | ) | – | (14 | ) | – | (4 | ) | – | – | 33 | (93) | ||||||||||||||||||||||||||||||||||||
| Options purchased |
56,573 | 505 | – | – | – | – | – | – | – | 505 | – | |||||||||||||||||||||||||||||||||||||||
| Options sold |
47,827 | – | (823 | ) | – | – | – | – | – | – | – | (823) | ||||||||||||||||||||||||||||||||||||||
| 3,135,626 | 20,310 | (19,957 | ) | 1,808 | (902 | ) | 765 | (504 | ) | – | – | 22,883 | (21,363) | |||||||||||||||||||||||||||||||||||||
| Credit default swaps |
||||||||||||||||||||||||||||||||||||||||||||||||||
| Structured credit derivatives purchased |
1,171 | 58 | – | – | – | – | – | – | – | 58 | – | |||||||||||||||||||||||||||||||||||||||
| Other credit derivatives purchased |
17,060 | 162 | (224 | ) | – | – | – | – | – | – | 162 | (224) | ||||||||||||||||||||||||||||||||||||||
| Total credit derivatives purchased |
18,231 | 220 | (224 | ) | – | – | – | – | – | – | 220 | (224) | ||||||||||||||||||||||||||||||||||||||
| Structured credit derivatives sold |
1,171 | – | (80 | ) | – | – | – | – | – | – | – | (80) | ||||||||||||||||||||||||||||||||||||||
| Other credit derivatives sold |
17,359 | 54 | (18 | ) | – | – | – | – | – | – | 54 | (18) | ||||||||||||||||||||||||||||||||||||||
| Total credit derivatives sold |
18,530 | 54 | (98 | ) | – | – | – | – | – | – | 54 | (98) | ||||||||||||||||||||||||||||||||||||||
| 36,761 | 274 | (322 | ) | – | – | – | – | – | – | 274 | (322) | |||||||||||||||||||||||||||||||||||||||
| Total |
4,837,943 | 53,730 | (51,475 | ) | 1,874 | (942 | ) | 765 | (504 | ) | – | (4 | ) | 56,369 | (52,925) | |||||||||||||||||||||||||||||||||||
NOTES TO THE FINANCIAL STATEMENTS 91
NOTES TO THE FINANCIAL STATEMENTS (continued)
12: Derivative Financial Instruments (continued)
| Fair Value | ||||||||||||||||||||||||||||||||||||||||||||||||||
| Trading | Hedging | Total | ||||||||||||||||||||||||||||||||||||||||||||||||
| Notional | Fair value | Cash flow | Net investment | |||||||||||||||||||||||||||||||||||||||||||||||
| The Company at 30 September 2015 |
Principal $m |
Assets $m |
Liabilities $m |
Assets $m |
Liabilities $m |
Assets $m |
Liabilities $m |
Assets $m |
Liabilities $m |
Assets $m |
Liabilities $m |
|||||||||||||||||||||||||||||||||||||||
| Foreign exchange contracts |
||||||||||||||||||||||||||||||||||||||||||||||||||
| Spot and forward contracts |
1,267,837 | 14,206 | (13,352 | ) | – | – | – | – | 1 | – | 14,207 | (13,352) | ||||||||||||||||||||||||||||||||||||||
| Swap agreements |
630,805 | 20,554 | (19,225 | ) | 2 | (4 | ) | – | – | – | (9 | ) | 20,556 | (19,238) | ||||||||||||||||||||||||||||||||||||
| Options purchased |
90,683 | 2,392 | – | – | – | – | – | – | – | 2,392 | – | |||||||||||||||||||||||||||||||||||||||
| Options sold |
109,805 | – | (2,066 | ) | – | – | – | – | – | – | – | (2,066) | ||||||||||||||||||||||||||||||||||||||
| 2,099,130 | 37,152 | (34,643 | ) | 2 | (4 | ) | – | – | 1 | (9 | ) | 37,155 | (34,656) | |||||||||||||||||||||||||||||||||||||
| Commodity contracts |
||||||||||||||||||||||||||||||||||||||||||||||||||
| Derivative contracts |
43,697 | 2,743 | (2,205 | ) | – | – | – | – | – | – | 2,743 | (2,205) | ||||||||||||||||||||||||||||||||||||||
| Interest rate contracts |
||||||||||||||||||||||||||||||||||||||||||||||||||
| Forward rate agreements |
334,992 | 45 | (50 | ) | – | – | – | – | – | – | 45 | (50) | ||||||||||||||||||||||||||||||||||||||
| Swap agreements |
3,263,084 | 31,361 | (30,833 | ) | 2,120 | (1,526 | ) | 1,028 | (640 | ) | – | – | 34,509 | (32,999) | ||||||||||||||||||||||||||||||||||||
| Futures contracts |
117,310 | 16 | (63 | ) | 1 | (17 | ) | – | – | – | – | 17 | (80) | |||||||||||||||||||||||||||||||||||||
| Options purchased |
93,515 | 942 | – | – | – | – | – | – | – | 942 | – | |||||||||||||||||||||||||||||||||||||||
| Options sold |
73,187 | – | (1,574 | ) | – | – | – | – | – | – | – | (1,574) | ||||||||||||||||||||||||||||||||||||||
| 3,882,088 | 32,364 | (32,520 | ) | 2,121 | (1,543 | ) | 1,028 | (640 | ) | – | – | 35,513 | (34,703) | |||||||||||||||||||||||||||||||||||||
| Credit default swaps |
||||||||||||||||||||||||||||||||||||||||||||||||||
| Structured credit derivatives purchased |
728 | 52 | – | – | – | – | – | – | – | 52 | – | |||||||||||||||||||||||||||||||||||||||
| Other credit derivatives purchased |
22,284 | 205 | (194 | ) | – | – | – | – | – | – | 205 | (194) | ||||||||||||||||||||||||||||||||||||||
| Total credit derivatives purchased |
23,012 | 257 | (194 | ) | – | – | – | – | – | – | 257 | (194) | ||||||||||||||||||||||||||||||||||||||
| Structured credit derivatives sold |
728 | – | (67 | ) | – | – | – | – | – | – | – | (67) | ||||||||||||||||||||||||||||||||||||||
| Other credit derivatives sold |
21,474 | 26 | (19 | ) | – | – | – | – | – | – | 26 | (19) | ||||||||||||||||||||||||||||||||||||||
| Total credit derivatives sold |
22,202 | 26 | (86 | ) | – | – | – | – | – | – | 26 | (86) | ||||||||||||||||||||||||||||||||||||||
| 45,214 | 283 | (280 | ) | – | – | – | – | – | – | 283 | (280) | |||||||||||||||||||||||||||||||||||||||
| Total |
6,070,129 | 72,542 | (69,648 | ) | 2,123 | (1,547 | ) | 1,028 | (640 | ) | 1 | (9 | ) | 75,694 | (71,844) | |||||||||||||||||||||||||||||||||||
92
ANZ ANNUAL REPORT 2015
12: Derivative Financial Instruments (continued)
| Fair Value | ||||||||||||||||||||||||||||||||||||||||||||||||||
| Trading | Hedging | Total | ||||||||||||||||||||||||||||||||||||||||||||||||
| Notional | Fair value | Cash flow | Net investment | |||||||||||||||||||||||||||||||||||||||||||||||
| The Company at 30 September 2014 |
Principal $m |
Assets $m |
Liabilities $m |
Assets $m |
Liabilities $m |
Assets $m |
Liabilities $m |
Assets $m |
Liabilities $m |
Assets $m |
Liabilities $m |
|||||||||||||||||||||||||||||||||||||||
| Foreign exchange contracts |
||||||||||||||||||||||||||||||||||||||||||||||||||
| Spot and forward contracts |
723,896 | 9,664 | (8,880 | ) | – | – | – | – | – | (4 | ) | 9,664 | (8,884) | |||||||||||||||||||||||||||||||||||||
| Swap agreements |
636,477 | 18,552 | (18,694 | ) | 66 | (40 | ) | – | – | – | – | 18,618 | (18,734) | |||||||||||||||||||||||||||||||||||||
| Options purchased |
104,919 | 2,061 | – | – | – | – | – | – | – | 2,061 | – | |||||||||||||||||||||||||||||||||||||||
| Options sold |
138,285 | – | (1,915 | ) | – | – | – | – | – | – | – | (1,915) | ||||||||||||||||||||||||||||||||||||||
| 1,603,577 | 30,277 | (29,489 | ) | 66 | (40 | ) | – | – | – | (4 | ) | 30,343 | (29,533) | |||||||||||||||||||||||||||||||||||||
| Commodity contracts |
||||||||||||||||||||||||||||||||||||||||||||||||||
| Derivative contracts |
33,486 | 1,606 | (925 | ) | – | – | – | – | – | – | 1,606 | (925) | ||||||||||||||||||||||||||||||||||||||
| Interest rate contracts |
||||||||||||||||||||||||||||||||||||||||||||||||||
| Forward rate agreements |
61,699 | 4 | (10 | ) | – | – | – | (1 | ) | – | – | 4 | (11) | |||||||||||||||||||||||||||||||||||||
| Swap agreements |
2,590,629 | 17,851 | (17,561 | ) | 1,587 | (807 | ) | 680 | (403 | ) | – | – | 20,118 | (18,771) | ||||||||||||||||||||||||||||||||||||
| Futures contracts |
112,227 | 31 | (72 | ) | – | (14 | ) | – | (4 | ) | – | – | 31 | (90) | ||||||||||||||||||||||||||||||||||||
| Options purchased |
55,969 | 506 | – | – | – | – | – | – | – | 506 | – | |||||||||||||||||||||||||||||||||||||||
| Options sold |
47,382 | – | (822 | ) | – | – | – | – | – | – | – | (822) | ||||||||||||||||||||||||||||||||||||||
| 2,867,906 | 18,392 | (18,465 | ) | 1,587 | (821 | ) | 680 | (408 | ) | – | – | 20,659 | (19,694) | |||||||||||||||||||||||||||||||||||||
| Credit default swaps |
||||||||||||||||||||||||||||||||||||||||||||||||||
| Structured credit derivatives purchased |
1,171 | 58 | – | – | – | – | – | – | – | 58 | – | |||||||||||||||||||||||||||||||||||||||
| Other credit derivatives purchased |
17,060 | 162 | (224 | ) | – | – | – | – | – | – | 162 | (224) | ||||||||||||||||||||||||||||||||||||||
| Total credit derivatives purchased |
18,231 | 220 | (224 | ) | – | – | – | – | – | – | 220 | (224) | ||||||||||||||||||||||||||||||||||||||
| Structured credit derivatives sold |
1,171 | – | (80 | ) | – | – | – | – | – | – | – | (80) | ||||||||||||||||||||||||||||||||||||||
| Other credit derivatives sold |
17,359 | 54 | (18 | ) | – | – | – | – | – | – | 54 | (18) | ||||||||||||||||||||||||||||||||||||||
| Total credit derivatives sold |
18,530 | 54 | (98 | ) | – | – | – | – | – | – | 54 | (98) | ||||||||||||||||||||||||||||||||||||||
| 36,761 | 274 | (322 | ) | – | – | – | – | – | – | 274 | (322) | |||||||||||||||||||||||||||||||||||||||
| Total |
4,541,730 | 50,549 | (49,201 | ) | 1,653 | (861 | ) | 680 | (408 | ) | – | (4 | ) | 52,882 | (50,474) | |||||||||||||||||||||||||||||||||||
| Consolidated | The Company | |||||||||||||||
| 2015 $m |
2014 $m |
2015 $m |
2014 $m |
|||||||||||||
| Gain/(loss) arising from fair value hedges |
||||||||||||||||
| Hedged item |
158 | (434) | 14 | (370) | ||||||||||||
| Hedging Instrument |
(146) | 429 | (2) | 369 | ||||||||||||
NOTES TO THE FINANCIAL STATEMENTS 93
NOTES TO THE FINANCIAL STATEMENTS (continued)
12: Derivative Financial Instruments (continued)
CASH FLOW HEDGE ACCOUNTING
| Consolidated | The Company | |||||||||||||||
| 2015 $m |
2014 $m |
2015 $m |
2014 $m |
|||||||||||||
| Opening |
169 | 75 | 174 | 51 | ||||||||||||
| Item recorded in net interest income |
(15 | ) | (30 | ) | – | 8 | ||||||||||
| Tax effect on items recorded in net interest income |
4 | 8 | – | (2) | ||||||||||||
| Valuation gain taken to other comprehensive income |
160 | 165 | 149 | 168 | ||||||||||||
| Tax effect on net gain on cash flow hedges |
(49 | ) | (49 | ) | (46 | ) | (51) | |||||||||
| Closing Balance |
269 | 169 | 277 | 174 | ||||||||||||
The table below shows the breakdown of the hedging reserve attributable to each type of cash flow hedging relationship:
| Consolidated | The Company | |||||||||||||||
| 2015 $m |
2014 $m |
2015 $m |
2014 $m |
|||||||||||||
| Variable rate assets |
799 | 407 | 628 | 433 | ||||||||||||
| Variable rate liabilities |
(255 | ) | (114 | ) | (191 | ) | (119) | |||||||||
| Re-issuances of short term fixed rate liabilities |
(275 | ) | (124 | ) | (160 | ) | (140) | |||||||||
| Total hedging reserve |
269 | 169 | 277 | 174 | ||||||||||||
94
ANZ ANNUAL REPORT 2015
13: Available-for-sale Assets
| Consolidated | The Company | |||||||||||||||
| 2015 $m |
2014 $m |
2015 $m |
2014 $m |
|||||||||||||
| Government securities |
25,012 | 15,063 | 20,419 | 12,310 | ||||||||||||
| Corporate and Financial institution securities |
14,506 | 11,341 | 13,381 | 10,267 | ||||||||||||
| Equity and other securities |
4,149 | 4,513 | 3,812 | 3,574 | ||||||||||||
| Total available-for-sale assets |
43,667 | 30,917 | 37,612 | 26,151 | ||||||||||||
During the year net gains (before tax) recognised in the income statement in respect of available-for-sale assets amounted to $71 million for the Group (2014: $47 million net gain before tax) and $49 million for the Company (2014: $40 million net gain before tax).
AVAILABLE-FOR-SALE ASSETS BY MATURITY AT 30 SEPTEMBER 2015
| Less than 3 months $m |
Between 3 and 12 months $m |
Between 1 and 5 years $m |
Between 5 and 10 years $m |
After 10 years $m |
No maturity specified $m |
Total fair value $m |
||||||||||||||||||||||
| Government securities |
4,878 | 2,712 | 6,238 | 10,248 | 936 | – | 25,012 | |||||||||||||||||||||
| Corporate and Financial institution securities |
932 | 1,793 | 10,281 | 1,429 | 71 | – | 14,506 | |||||||||||||||||||||
| Equity and other securities |
– | 38 | 1,200 | 2,739 | 121 | 51 | 4,149 | |||||||||||||||||||||
| Total available-for-sale assets |
5,810 | 4,543 | 17,719 | 14,416 | 1,128 | 51 | 43,667 | |||||||||||||||||||||
AVAILABLE-FOR-SALE BY MATURITIES AT 30 SEPTEMBER 2014
| Less than 3 months $m |
Between 3 and 12 months $m |
Between 1 and 5 years $m |
Between 5 and 10 years $m |
After 10 years $m |
No maturity specified $m |
Total fair value $m |
||||||||||||||||||||||
| Government securities |
3,106 | 2,541 | 4,299 | 3,686 | 1,431 | – | 15,063 | |||||||||||||||||||||
| Corporate and Financial institution securities |
523 | 2,563 | 7,923 | 327 | 5 | – | 11,341 | |||||||||||||||||||||
| Other securities and equity securities |
– | 86 | 205 | 1,165 | 3,014 | 43 | 4,513 | |||||||||||||||||||||
| Total available-for-sale assets |
3,629 | 5,190 | 12,427 | 5,178 | 4,450 | 43 | 30,917 | |||||||||||||||||||||
NOTES TO THE FINANCIAL STATEMENTS 95
NOTES TO THE FINANCIAL STATEMENTS (continued)
14: Net Loans and Advances
| Consolidated | The Company | |||||||||||||||
| 2015 $m |
2014 $m |
2015 $m |
2014 $m |
|||||||||||||
| Overdrafts |
8,955 | 8,629 | 7,472 | 7,078 | ||||||||||||
| Credit card outstandings |
11,930 | 11,440 | 9,446 | 9,244 | ||||||||||||
| Term loans – housing |
300,468 | 271,388 | 242,949 | 221,576 | ||||||||||||
| Term loans – non-housing |
232,693 | 213,324 | 174,277 | 161,913 | ||||||||||||
| Hire purchase |
1,971 | 2,238 | 1,048 | 1,409 | ||||||||||||
| Lease receivables |
1,901 | 1,905 | 1,166 | 1,190 | ||||||||||||
| Commercial bills |
14,201 | 15,027 | 13,982 | 14,766 | ||||||||||||
| Other |
251 | 432 | 34 | 4 | ||||||||||||
| Total gross loans and advances |
572,370 | 524,383 | 450,374 | 417,180 | ||||||||||||
| Less: Provision for credit impairment (refer to note 15) |
(4,017) | (3,933) | (3,081) | (3,011) | ||||||||||||
| Less: Unearned income |
(739) | (892) | (438) | (657) | ||||||||||||
| Add: Capitalised brokerage/mortgage origination fees1 |
1,253 | 1,043 | 944 | 837 | ||||||||||||
| Add: Customer liability for acceptances |
1,371 | 1,151 | 649 | 717 | ||||||||||||
| Adjustments to gross loans and advances |
(2,132) | (2,631) | (1,926) | (2,114) | ||||||||||||
| Net loans and advances (including assets classified as held for sale) |
570,238 | 521,752 | 448,448 | 415,066 | ||||||||||||
| Esanda dealer finance assets held for sale |
(8,065) | – | (8,065) | – | ||||||||||||
| Net loans and advances |
562,173 | 521,752 | 440,383 | 415,066 | ||||||||||||
| 1 | Capitalised brokerage/mortgage origination fees are amortised over the term of the loan. |
ASSETS CLASSIFIED AS HELD FOR SALE
On 4 May 2015, the Group announced its intention to sell the Esanda Dealer Finance business within the Australia Division. The assets classified as held for sale includes lending assets comprising retail point-of-sale finance and wholesale bailment facilities and other Esanda branded finance offered to motor vehicle dealers along with associated provisions and deferred acquisition costs. No impairment losses were recognised on reclassification as held for sale.
On 8 October the Group entered into an agreement to sell the Esanda Dealer Finance business to Macquarie Group Limited. The sale is expected to complete during the first half of 2016. The estimated sale price is $8.2 billion.
96
ANZ ANNUAL REPORT 2015
14: Net Loans and Advances (continued)
| LEASE RECEIVABLES | Consolidated | The Company | ||||||||||||||
| 2015 $m |
2014 $m |
2015 $m |
2014 $m |
|||||||||||||
| Lease receivables |
||||||||||||||||
| a) Finance lease receivables |
||||||||||||||||
| Gross finance lease receivables |
||||||||||||||||
| Less than 1 year |
276 | 370 | 117 | 225 | ||||||||||||
| 1 to 5 years |
912 | 527 | 590 | 350 | ||||||||||||
| Later than 5 years |
196 | 387 | 17 | 63 | ||||||||||||
| Total finance lease receivables |
1,384 | 1,284 | 724 | 638 | ||||||||||||
| b) Operating lease receivables |
||||||||||||||||
| Gross operating lease receivables |
||||||||||||||||
| Less than 1 year |
22 | 55 | 19 | 51 | ||||||||||||
| 1 to 5 years |
495 | 566 | 423 | 501 | ||||||||||||
| Later than 5 years |
– | – | – | – | ||||||||||||
| Total operating lease receivables |
517 | 621 | 442 | 552 | ||||||||||||
| Total lease receivables |
1,901 | 1,905 | 1,166 | 1,190 | ||||||||||||
| Less: unearned future finance income on finance leases |
(142) | (154) | (36) | (98) | ||||||||||||
| Net lease receivables |
1,759 | 1,751 | 1,130 | 1,092 | ||||||||||||
| Present value of net investment in finance lease receivables |
||||||||||||||||
| Less than 1 year |
248 | 332 | 112 | 206 | ||||||||||||
| 1 to 5 years |
830 | 480 | 560 | 285 | ||||||||||||
| Later than 5 years |
164 | 318 | 16 | 49 | ||||||||||||
| Total net investment in finance lease receivables |
1,242 | 1,130 | 688 | 540 | ||||||||||||
| Add back: unearned future finance income on finance leases |
142 | 154 | 36 | 98 | ||||||||||||
| Total finance lease receivables |
1,384 | 1,284 | 724 | 638 | ||||||||||||
| HIRE PURCHASE | ||||||||||||||||
| Hire purchase |
||||||||||||||||
| Less than 1 year |
678 | 758 | 310 | 456 | ||||||||||||
| 1 to 5 years |
1,282 | 1,466 | 727 | 939 | ||||||||||||
| Later than 5 years |
11 | 14 | 11 | 14 | ||||||||||||
| Total hire purchase |
1,971 | 2,238 | 1,048 | 1,409 | ||||||||||||
NOTES TO THE FINANCIAL STATEMENTS 97
NOTES TO THE FINANCIAL STATEMENTS (continued)
15: Provision for Credit Impairment
| Consolidated | The Company | |||||||||||||||
| Credit impairment charge analysis |
2015 $m |
2014 $m |
2015 $m |
2014 $m |
||||||||||||
| New and increased provisions |
||||||||||||||||
| Australia |
1,203 | 1,292 | 1,190 | 1,275 | ||||||||||||
| New Zealand |
211 | 274 | 13 | 16 | ||||||||||||
| Asia Pacific, Europe & America |
343 | 246 | 117 | 156 | ||||||||||||
| 1,757 | 1,812 | 1,320 | 1,447 | |||||||||||||
| Write-backs |
(434) | (447) | (245) | (253 | ) | |||||||||||
| 1,323 | 1,365 | 1,075 | 1,194 | |||||||||||||
| Recoveries of amounts previously written off |
(239) | (224) | (193) | (174 | ) | |||||||||||
| Individual credit impairment charge |
1,084 | 1,141 | 882 | 1,020 | ||||||||||||
| Collective credit impairment charge/(release) |
95 | (155) | 87 | (46 | ) | |||||||||||
| Credit impairment charge |
1,179 | 986 | 969 | 974 | ||||||||||||
MOVEMENT IN PROVISION FOR CREDIT IMPAIRMENT BY FINANCIAL ASSET CLASS
| Net loans and advances |
Credit related commitments |
Total provision | ||||||||||||||||||||||
| Consolidated |
2015 $m |
2014 $m |
2015 $m |
2014 $m |
2015 $m |
2014 $m |
||||||||||||||||||
| Individual provision |
||||||||||||||||||||||||
| Balance at start of year |
1,130 | 1,440 | 46 | 27 | 1,176 | 1,467 | ||||||||||||||||||
| New and increased provisions |
1,757 | 1,794 | – | 18 | 1,757 | 1,812 | ||||||||||||||||||
| Adjustment for exchange rate fluctuations and transfers |
63 | 7 | (23) | 1 | 40 | 8 | ||||||||||||||||||
| Write-backs |
(434) | (447) | – | – | (434) | (447 | ) | |||||||||||||||||
| Discount unwind |
(54) | (65) | – | – | (54) | (65 | ) | |||||||||||||||||
| Bad debts written off |
(1,424) | (1,599) | – | – | (1,424) | (1,599 | ) | |||||||||||||||||
| Total individual provision |
1,038 | 1,130 | 23 | 46 | 1,061 | 1,176 | ||||||||||||||||||
| Collective provision |
||||||||||||||||||||||||
| Balance at start of year |
2,144 | 2,292 | 613 | 595 | 2,757 | 2,887 | ||||||||||||||||||
| Adjustment for exchange rate fluctuations |
67 | 8 | 37 | 17 | 104 | 25 | ||||||||||||||||||
| Charge/(release) to income statement |
68 | (156) | 27 | 1 | 95 | (155 | ) | |||||||||||||||||
| Total collective provision |
2,279 | 2,144 | 677 | 613 | 2,956 | 2,757 | ||||||||||||||||||
| Total provision for credit impairment |
3,317 | 3,274 | 700 | 659 | 4,017 | 3,933 | ||||||||||||||||||
| Consolidated | ||||||||
| 2015 % |
2014 % |
|||||||
| Ratios (as a percentage of total gross loans and advances) |
||||||||
| Individual provision |
0.18 | 0.22 | ||||||
| Collective provision |
0.51 | 0.53 | ||||||
| Bad debts written off |
0.25 | 0.30 | ||||||
The table below contains a detailed analysis of the movements in individual provisions for net loans and advances by division.
| Australia | International and Institutional Banking |
New Zealand | Other1 |
Total |
||||||||||||||||||||||||||||||||||||
| Consolidated | 2015 $m |
2014 $m |
2015 $m |
2014 $m |
2015 $m |
2014 $m |
2015 $m |
2014 $m |
2015 $m |
2014 $m |
||||||||||||||||||||||||||||||
| Individual provision |
||||||||||||||||||||||||||||||||||||||||
| Balance at start of year |
630 | 747 | 310 | 417 | 187 | 242 | 3 | 34 | 1,130 | 1,440 | ||||||||||||||||||||||||||||||
| New and increased provisions |
1,103 | 1,114 | 463 | 418 | 190 | 260 | 1 | 2 | 1,757 | 1,794 | ||||||||||||||||||||||||||||||
| Adjustment for exchange rate fluctuations and transfers |
– | (2) | 53 | 7 | 6 | 2 | 4 | – | 63 | 7 | ||||||||||||||||||||||||||||||
| Write-backs |
(194) | (202) | (128) | (79) | (110) | (163) | (2) | (3) | (434) | (447 | ) | |||||||||||||||||||||||||||||
| Discount unwind |
(32) | (33) | (17) | (35) | (4) | 3 | (1) | – | (54) | (65 | ) | |||||||||||||||||||||||||||||
| Bad debts written off |
(918) | (994) | (371) | (418) | (131) | (157) | (4) | (30) | (1,424) | (1,599 | ) | |||||||||||||||||||||||||||||
| Total individual provision |
589 | 630 | 310 | 310 | 138 | 187 | 1 | 3 | 1,038 | 1,130 | ||||||||||||||||||||||||||||||
| 1 | Other contains Global Wealth and GTSO and Group Centre. |
98
ANZ ANNUAL REPORT 2015
15: Provision for Credit Impairment (continued)
| Net loans and advances | Credit related commitments |
Total provision | ||||||||||||||||||||||
| The Company | 2015 $m |
2014 $m |
2015 $m |
2014 $m |
2015 $m |
2014 $m |
||||||||||||||||||
| Individual provision |
||||||||||||||||||||||||
| Balance at start of year |
814 | 1,046 | 40 | 10 | 854 | 1,056 | ||||||||||||||||||
| New and increased provisions |
1,319 | 1,417 | – | 30 | 1,319 | 1,447 | ||||||||||||||||||
| Adjustment for exchange rate fluctuations |
45 | 4 | (21) | – | 24 | 4 | ||||||||||||||||||
| Write-backs |
(245) | (253) | – | – | (245) | (253) | ||||||||||||||||||
| Discount unwind |
(45) | (60) | – | – | (45) | (60) | ||||||||||||||||||
| Bad debts written off |
(1,148) | (1,340) | – | – | (1,148) | (1,340) | ||||||||||||||||||
| Total individual provision |
740 | 814 | 19 | 40 | 759 | 854 | ||||||||||||||||||
| Collective provision |
||||||||||||||||||||||||
| Balance at start of year |
1,669 | 1,729 | 488 | 457 | 2,157 | 2,186 | ||||||||||||||||||
| Adjustment for exchange rate fluctuations |
43 | 5 | 35 | 12 | 78 | 17 | ||||||||||||||||||
| Charge/(credit) to income statement |
53 | (65) | 34 | 19 | 87 | (46) | ||||||||||||||||||
| Total collective provision |
1,765 | 1,669 | 557 | 488 | 2,322 | 2,157 | ||||||||||||||||||
| Total provision for credit impairment |
2,505 | 2,483 | 576 | 528 | 3,081 | 3,011 | ||||||||||||||||||
| The Company | ||||||||
| 2015 % |
2014 % |
|||||||
| Ratios (as a percentage of total gross loans and advances) |
||||||||
| Individual provision |
0.17 | 0.20 | ||||||
| Collective provision |
0.52 | 0.52 | ||||||
| Bad debts written off |
0.25 | 0.32 | ||||||
IMPAIRED ASSETS
Presented below is a summary of impaired financial assets that are measured on the balance sheet at amortised cost. For these items, impairment losses are recorded through the provision for credit impairment. This contrasts to financial assets measured at fair value, for which any impairment loss is recognised as a component of the instrument’s overall fair value.
Detailed information on impaired financial assets is provided in note 19.
| Consolidated | The Company | |||||||||||||||
| 2015 $m |
2014 $m |
2015 $m |
2014 $m |
|||||||||||||
| Summary of impaired financial assets |
||||||||||||||||
| Impaired loans |
2,441 | 2,682 | 1,574 | 1,923 | ||||||||||||
| Restructured items1 |
184 | 67 | 94 | 26 | ||||||||||||
| Non-performing commitments and contingencies2 |
94 | 140 | 80 | 105 | ||||||||||||
| Gross impaired financial assets |
2,719 | 2,889 | 1,748 | 2,054 | ||||||||||||
| Individual provisions |
||||||||||||||||
| Impaired loans |
(1,038) | (1,130) | (740) | (814) | ||||||||||||
| Non-performing commitments and contingencies |
(23) | (46) | (19) | (40) | ||||||||||||
| Net impaired financial assets |
1,658 | 1,713 | 989 | 1,200 | ||||||||||||
| Accruing loans past due 90 days or more3 |
||||||||||||||||
| These amounts are not classified as impaired assets as they are either 90 days or more past due and well secured, or are portfolio managed facilities that can be held on a productive basis for up to 180 days past due |
2,378 | 1,982 | 2,127 | 1,778 | ||||||||||||
| 1 | Restructured items are facilities in which the original contractual terms have been modified for reasons related to the financial difficulties of the customer. Restructuring may consist of a reduction of interest, principal or other payments legally due, or an extension in maturity materially beyond those typically offered to new facilities with similar risk. |
| 2 | Includes impaired derivative financial instruments. |
| 3 | Includes unsecured credit card and personal loans 90 days past due accounts which are retained on a performing basis for up to 180 days past due amounting to $180 million (2014: $154 million) for the Group and $126 million (2014: $111 million) for the Company. |
NOTES TO THE FINANCIAL STATEMENTS 99
NOTES TO THE FINANCIAL STATEMENTS (continued)
16: Deposits and Other Borrowings
| Consolidated | The Company | |||||||||||||||
| 2015 $m |
2014 $m |
2015 $m |
2014 $m | |||||||||||||
| Certificates of deposit |
63,446 | 52,755 | 62,980 | 51,634 | ||||||||||||
| Term Deposits |
194,676 | 192,716 | 154,485 | 154,763 | ||||||||||||
| On demand and short term deposits |
229,330 | 193,203 | 187,327 | 160,867 | ||||||||||||
| Deposits not bearing interest |
19,013 | 16,404 | 9,970 | 8,688 | ||||||||||||
| Deposits from banks |
38,985 | 38,193 | 38,448 | 37,339 | ||||||||||||
| Commercial Paper |
22,988 | 15,152 | 18,477 | 9,753 | ||||||||||||
| Securities sold under repurchase agreements |
778 | 256 | 344 | 128 | ||||||||||||
| Borrowing corporations1 |
1,578 | 1,400 | – | – | ||||||||||||
| Deposits and other borrowings |
570,794 | 510,079 | 472,031 | 423,172 | ||||||||||||
| 1 | Included in this balance is debenture stock of nil (September 2014: $1 million) of Esanda Finance Corporation Limited (Esanda), together with accrued interest thereon, which is secured by a trust deed and collateral debentures, giving floating charges upon the undertaking and all the assets of the entity amounting to $42 million (September 2014: $43 million) other than land and buildings. All controlled entities of Esanda have guaranteed the payment of principal, interest and other monies in relation to all debenture stock and unsecured notes issued by Esanda. The only loans pledged as collateral are those in Esanda and its subsidiaries. Effective from 18 March 2009, Esanda ceased to write new debentures and since September 2009 stopped writing new loans. In addition, this balance also includes NZD1.7 billion (September 2014: NZD1.6 billion) of secured debenture stock of the consolidated subsidiary UDC Finance Limited (UDC) and the accrued interest thereon which are secured by a floating charge over all assets of UDC NZD2.6 billion (September 2014: NZD2.5 billion). |
17: Debt Issuances
ANZ utilises a variety of established and flexible funding programmes to issue medium term notes featuring either senior or subordinated debt status (details of subordinated debt are presented in note 18). All risks associated with originating term funding are closely managed. Refer to description of ANZ risk management practices in note 19 in relation to market risks such as interest rate and foreign currency risks, as well as liquidity risk.
The table below presents debt issuances by currency of issue which broadly is representative of the investor base location.
| Consolidated |
The Company | |||||||||||||||
|
2015 $m |
2014 $m |
2015 $m |
2014 $m | |||||||||||||
| Debt issuances by currency |
|
|||||||||||||||
| USD |
United States dollars | 42,367 | 36,549 | 36,009 | 31,682 | |||||||||||
| GBP |
Great British pounds | 6,317 | 3,068 | 5,744 | 2,576 | |||||||||||
| AUD |
Australian dollars | 7,694 | 7,796 | 7,289 | 7,051 | |||||||||||
| NZD |
New Zealand dollars | 4,947 | 4,683 | 1,639 | 1,647 | |||||||||||
| JPY |
Japanese yen | 4,499 | 4,786 | 4,412 | 4,469 | |||||||||||
| EUR |
Euro | 22,048 | 15,723 | 16,356 | 11,662 | |||||||||||
| HKD |
Hong Kong dollars | 858 | 817 | 858 | 802 | |||||||||||
| CHF |
Swiss francs | 3,063 | 3,882 | 1,450 | 1,659 | |||||||||||
| CAD |
Canadian dollar | 430 | 984 | 430 | 984 | |||||||||||
| NOK |
Norwegian krone | 465 | 609 | 465 | 609 | |||||||||||
| SGD |
Singapore dollars | 202 | 254 | 70 | 75 | |||||||||||
| TRY |
Turkish lira | 265 | 358 | 265 | 358 | |||||||||||
| ZAR |
South African rand | 151 | 147 | 151 | 147 | |||||||||||
| MXN |
Mexico peso | 255 | 255 | 255 | 255 | |||||||||||
| CNH |
Chinese yuan |
186 | 185 | 186 | 185 | |||||||||||
| Total Debt issuances |
93,747 | 80,096 | 75,579 | 64,161 | ||||||||||||
100
ANZ ANNUAL REPORT 2015
18: Subordinated Debt
Subordinated debt comprises perpetual and dated securities as follows (net of issue costs):
| Consolidated | The Company | |||||||||||||||||||||
|
2015 $m |
2014 $m |
2015 $m |
2014 $m |
|||||||||||||||||||
| Additional Tier 1 capital (perpetual subordinated securities) |
|
|||||||||||||||||||||
| ANZ Convertible Preference Shares (ANZ CPS)1 |
||||||||||||||||||||||
| AUD |
1969m | ANZ CPS2 | 1,969 | 1,967 | 1,969 | 1,967 | ||||||||||||||||
| AUD |
1340m | ANZ CPS3 | 1,336 | 1,333 | 1,336 | 1,333 | ||||||||||||||||
| ANZ Capital Notes (ANZ CN) |
||||||||||||||||||||||
| AUD |
1120m | ANZ CN1 | 1,112 | 1,109 | 1,112 | 1,109 | ||||||||||||||||
| AUD |
1610m | ANZ CN2 | 1,598 | 1595 | 1,598 | 1595 | ||||||||||||||||
| AUD |
970m | ANZ CN3 | 959 | – | 959 | – | ||||||||||||||||
| ANZ NZ Capital Notes (ANZ NZ CN) |
||||||||||||||||||||||
| NZD |
500m |
ANZ NZ Capital Notes |
449 | – | – | – | ||||||||||||||||
| 7,423 | 6,004 | 6,974 | 6,004 | |||||||||||||||||||
| Tier 2 capital |
||||||||||||||||||||||
| Perpetual subordinated notes |
||||||||||||||||||||||
| USD |
300m | floating rate notes | 429 | 343 | 429 | 343 | ||||||||||||||||
| NZD |
835m |
fixed rate notes2 |
759 | 744 | – | – | ||||||||||||||||
| 1,188 | 1,087 | 429 | 343 | |||||||||||||||||||
| Dated subordinated notes |
||||||||||||||||||||||
| EUR |
750m | fixed rate notes due 2019 | 1,355 | 1,246 | 1,355 | 1,247 | ||||||||||||||||
| AUD |
500m | floating rate notes due 20223 | 499 | 499 | 500 | 500 | ||||||||||||||||
| AUD |
1509m | floating rate notes due 20223 | 1,504 | 1,501 | 1,506 | 1,502 | ||||||||||||||||
| USD |
750m | fixed rate notes due 20223 | 1,068 | 842 | 1,071 | 843 | ||||||||||||||||
| AUD |
750m | floating rate notes due 20233 | 748 | 748 | 750 | 749 | ||||||||||||||||
| AUD |
750m | floating rate notes due 20243,4 | 750 | 750 | 750 | 750 | ||||||||||||||||
| USD |
800m | fixed rate notes due 20244 | 1,222 | 930 | 1,226 | 932 | ||||||||||||||||
| CNY |
2500m | fixed rate notes due 20253,4 | 562 | – | 562 | – | ||||||||||||||||
| SGD |
500m | fixed rate notes due 20273,4 | 491 | – | 491 | – | ||||||||||||||||
| AUD |
200m |
fixed rate notes due 20273,4 |
199 | – | 198 | – | ||||||||||||||||
| 8,398 | 6,516 | 8,409 | 6,523 | |||||||||||||||||||
| Total subordinated debt |
17,009 | 13,607 | 15,812 | 12,870 | ||||||||||||||||||
| Subordinated debt by currency |
|
|||||||||||||||||||||
| AUD |
Australian dollars | 10,674 | 9,502 | 10,678 | 9,505 | |||||||||||||||||
| NZD |
New Zealand dollars | 1,208 | 744 | – | – | |||||||||||||||||
| USD |
United States dollars | 2,719 | 2,115 | 2,726 | 2,118 | |||||||||||||||||
| CNY |
Chinese renminbi | 562 | – | 562 | – | |||||||||||||||||
| SGD |
Singapore dollars |
491 | – | 491 | – | |||||||||||||||||
| EUR |
Euro |
1,355 | 1,246 | 1,355 | 1,247 | |||||||||||||||||
| 17,009 | 13,607 | 15,812 | 12,870 | |||||||||||||||||||
| 1 | Fully franked preference share dividend cash payments on ANZ CPS2 and ANZ CPS3 made during the years ended 30 September 2015 and 30 September 2014 (which are treated as interest expense): |
| Consolidated | The Company | |||||||||||||||||||
| 2015 $m |
2014 $m |
2015 $m |
2014 $m |
|||||||||||||||||
| ANZ CPS2 |
77 | 79 | 77 | 79 | ||||||||||||||||
| ANZ CPS3 |
52 | 53 | 52 | 53 | ||||||||||||||||
| 2 | Rate reset on 18 April 2013 to the five year swap rate +2.00% until the call date on 18 April 2018, whereupon if not called, reverts to a floating rate at the three month forward rate agreement +3.00% and is callable on any interest payment date thereafter. |
| 3 | Callable five years prior to maturity. |
| 4 | The convertible subordinated notes convert into ANZ ordinary shares at the average market price of ANZ ordinary shares less a 1% discount subject to a maximum conversion number if the Company receives a notice of non-viability from APRA. |
| NOTES TO THE FINANCIAL STATEMENTS 101 |
NOTES TO THE FINANCIAL STATEMENTS (continued)
18: Subordinated Debt (continued)
| 102 |
ANZ ANNUAL REPORT 2015
18: Subordinated Debt (continued)
NOTES TO THE FINANCIAL STATEMENTS 103
NOTES TO THE FINANCIAL STATEMENTS (continued)
19: Financial Risk Management (continued)
104
ANZ ANNUAL REPORT 2015
19: Financial Risk Management (continued)
Concentrations of credit risk
Concentrations of credit risk arise when a number of customers are engaged in similar business activities or activities within the same geographic region, or when they have similar risk characteristics that would cause their ability to meet contractual obligations to be similarly affected by changes in economic or other conditions.
The Group monitors its portfolios, to identify and assess risk concentrations. The Group’s strategy is to maintain well-diversified credit portfolios focused on achieving an acceptable risk-return balance. Credit risk portfolios are actively monitored and frequently reviewed to identify, assess and guard against unacceptable risk concentrations. Concentration analysis will typically include geography, industry, credit product and risk grade. The Group also applies single customer counterparty limits to protect against unacceptably large exposures to single name risk. These limits are established based on a combination of factors including the nature of counterparty, probability of default and collateral provided.
Concentrations of credit risk analysis
Composition of financial instruments that give rise to credit risk by industry:
| Cash, settlement to ANZ and collateral paid |
Trading securities and AFS1 |
Derivatives | Loans and advances2 |
Other financial assets3 |
Credit related commitments4 |
Total | ||||||||||||||||||||||||||||||||||||||||||||||||||
| Consolidated | 2015 $m |
2014 $m |
2015 $m |
2014 $m |
2015 $m |
2014 $m |
2015 $m |
2014 $m |
2015 $m |
2014 $m |
2015 $m |
2014 $m |
2015 $m |
2014 $m |
||||||||||||||||||||||||||||||||||||||||||
| Australia |
||||||||||||||||||||||||||||||||||||||||||||||||||||||||
| Agriculture, forestry, fishing and mining |
– | 21 | 60 | 21 | 691 | 225 | 15,192 | 13,970 | 119 | 95 | 9,713 | 10,753 | 25,775 | 25,085 | ||||||||||||||||||||||||||||||||||||||||||
| Business services |
4 | 12 | – | 3 | 108 | 46 | 6,254 | 5,658 | 49 | 38 | 3,365 | 3,679 | 9,780 | 9,436 | ||||||||||||||||||||||||||||||||||||||||||
| Construction |
– | – | 23 | 3 | 20 | 94 | 5,516 | 5,688 | 43 | 38 | 4,568 | 4,353 | 10,170 | 10,176 | ||||||||||||||||||||||||||||||||||||||||||
| Electricity, gas and water supply |
– | – | 99 | 237 | 837 | 692 | 3,462 | 4,000 | 27 | 27 | 2,388 | 2,895 | 6,813 | 7,851 | ||||||||||||||||||||||||||||||||||||||||||
| Entertainment, leisure and tourism |
– | – | 37 | 1 | 323 | 89 | 8,908 | 8,087 | 70 | 55 | 2,494 | 2,751 | 11,832 | 10,983 | ||||||||||||||||||||||||||||||||||||||||||
| Financial, investment and insurance |
21,885 | 18,927 | 18,722 | 19,115 | 49,733 | 38,387 | 22,061 | 14,351 | 174 | 98 | 6,757 | 7,521 | 119,332 | 98,399 | ||||||||||||||||||||||||||||||||||||||||||
| Government and official institutions |
130 | 135 | 32,305 | 25,595 | 685 | 241 | 707 | 541 | 6 | 4 | 2,081 | 298 | 35,914 | 26,814 | ||||||||||||||||||||||||||||||||||||||||||
| Manufacturing |
4 | 4 | 1,382 | 1,528 | 2,535 | 1,057 | 6,844 | 7,129 | 54 | 48 | 7,815 | 7,537 | 18,634 | 17,303 | ||||||||||||||||||||||||||||||||||||||||||
| Personal lending |
– | – | – | – | – | – | 252,242 | 231,807 | 1,983 | 1,569 | 48,282 | 44,950 | 302,507 | 278,326 | ||||||||||||||||||||||||||||||||||||||||||
| Property services |
– | – | 79 | 48 | 677 | 433 | 27,034 | 26,234 | 212 | 178 | 10,199 | 11,774 | 38,201 | 38,667 | ||||||||||||||||||||||||||||||||||||||||||
| Retail trade |
2 | 2 | 50 | 6 | 221 | 153 | 11,273 | 10,225 | 89 | 69 | 3,639 | 4,645 | 15,274 | 15,100 | ||||||||||||||||||||||||||||||||||||||||||
| Transport and storage |
2 | – | 181 | 70 | 951 | 368 | 7,052 | 7,386 | 55 | 50 | 4,145 | 3,943 | 12,386 | 11,817 | ||||||||||||||||||||||||||||||||||||||||||
| Wholesale trade |
354 | 183 | 12 | 7 | 1,520 | 702 | 6,287 | 6,320 | 49 | 42 | 8,212 | 4,867 | 16,434 | 12,121 | ||||||||||||||||||||||||||||||||||||||||||
| Other |
30 | 21 | 251 | 208 | 453 | 258 | 10,397 | 9,426 | 82 | 64 | 5,878 | 5,501 | 17,091 | 15,478 | ||||||||||||||||||||||||||||||||||||||||||
| 22,411 | 19,305 | 53,201 | 46,842 | 58,754 | 42,745 | 383,229 | 350,822 | 3,012 | 2,375 | 119,536 | 115,467 | 640,143 | 577,556 | |||||||||||||||||||||||||||||||||||||||||||
| New Zealand |
||||||||||||||||||||||||||||||||||||||||||||||||||||||||
| Agriculture, forestry, fishing and mining |
– | – | – | – | 61 | 15 | 17,554 | 16,475 | 108 | 88 | 1,749 | 1,831 | 19,472 | 18,409 | ||||||||||||||||||||||||||||||||||||||||||
| Business services |
– | – | – | – | 5 | 4 | 996 | 1,010 | 6 | 5 | 380 | 383 | 1,387 | 1,402 | ||||||||||||||||||||||||||||||||||||||||||
| Construction |
– | – | – | – | 11 | – | 1,222 | 1,085 | 7 | 6 | 713 | 659 | 1,953 | 1,750 | ||||||||||||||||||||||||||||||||||||||||||
| Electricity, gas and water supply |
– | – | 37 | 30 | 430 | 317 | 1,122 | 945 | 7 | 5 | 1,079 | 1,179 | 2,675 | 2,476 | ||||||||||||||||||||||||||||||||||||||||||
| Entertainment, leisure and tourism |
– | – | – | – | 43 | 22 | 972 | 916 | 6 | 5 | 243 | 219 | 1,264 | 1,162 | ||||||||||||||||||||||||||||||||||||||||||
| Financial, investment and insurance |
2,217 | 1,444 | 6,322 | 4,925 | 10,118 | 5,627 | 1,132 | 865 | 9 | 4 | 874 | 688 | 20,672 | 13,553 | ||||||||||||||||||||||||||||||||||||||||||
| Government and official institutions |
1,679 | 1,167 | 5,884 | 6,111 | 1,216 | 562 | 1,052 | 1,120 | 6 | 6 | 664 | 665 | 10,501 | 9,631 | ||||||||||||||||||||||||||||||||||||||||||
| Manufacturing |
– | – | 28 | 22 | 379 | 158 | 3,155 | 2,702 | 19 | 14 | 1,597 | 1,635 | 5,178 | 4,531 | ||||||||||||||||||||||||||||||||||||||||||
| Personal lending |
– | – | – | – | – | – | 63,067 | 56,993 | 387 | 304 | 12,534 | 10,499 | 75,988 | 67,796 | ||||||||||||||||||||||||||||||||||||||||||
| Property services |
– | – | 1 | – | 16 | 11 | 8,836 | 7,464 | 54 | 40 | 1,399 | 1,354 | 10,306 | 8,869 | ||||||||||||||||||||||||||||||||||||||||||
| Retail trade |
– | – | – | – | 16 | 18 | 1,827 | 1,810 | 11 | 10 | 827 | 808 | 2,681 | 2,646 | ||||||||||||||||||||||||||||||||||||||||||
| Transport and storage |
– | – | 5 | 11 | 55 | 28 | 1,489 | 1,323 | 9 | 7 | 688 | 670 | 2,246 | 2,039 | ||||||||||||||||||||||||||||||||||||||||||
| Wholesale trade |
– | – | – | – | 15 | 13 | 1,334 | 1,233 | 8 | 7 | 1,132 | 1,160 | 2,489 | 2,413 | ||||||||||||||||||||||||||||||||||||||||||
| Other |
– | – | 52 | 61 | 40 | 49 | 670 | 692 | 4 | 4 | 1,042 | 911 | 1,808 | 1,717 | ||||||||||||||||||||||||||||||||||||||||||
| 3,896 | 2,611 | 12,329 | 11,160 | 12,405 | 6,824 | 104,428 | 94,633 | 641 | 505 | 24,921 | 22,661 | 158,620 | 138,394 | |||||||||||||||||||||||||||||||||||||||||||
| 1 | Available–for–sale assets. |
| 2 | Excludes individual and collective provisions for credit impairment held in respect of credit related commitments, and includes Esanda dealer finance assets classified as held for sale. |
| 3 | Mainly comprises regulatory deposits, investments backing policy liabilities and accrued interest. |
| 4 | Credit related commitments comprise undrawn facilities and customer contingent liabilities. |
NOTES TO THE FINANCIAL STATEMENTS 105
NOTES TO THE FINANCIAL STATEMENTS (continued)
19: Financial Risk Management (continued)
Concentrations of credit risk analysis (continued):
Composition of financial instruments that give rise to credit risk by industry (continued):
| Cash, settlement to ANZ and collateral paid |
Trading securities and AFS1 |
Derivatives | Loans and advances2 |
Other financial |
Credit related commitments4 |
Total | ||||||||||||||||||||||||||||||||||||||||||||||||||
| Consolidated | 2015 $m |
2014 $m |
2015 $m |
2014 $m |
2015 $m |
2014 $m |
2015 $m |
2014 $m |
2015 $m |
2014 $m |
2015 $m |
2014 $m |
2015 $m |
2014 $m |
||||||||||||||||||||||||||||||||||||||||||
|
Overseas Markets |
||||||||||||||||||||||||||||||||||||||||||||||||||||||||
| Agriculture, forestry, fishing and mining |
3 | 1 | 43 | 10 | 94 | 137 | 5,659 | 4,385 | 166 | 118 | 9,326 | 6,883 | 15,291 | 11,534 | ||||||||||||||||||||||||||||||||||||||||||
| Business services |
5 | 5 | – | – | 15 | 5 | 1,331 | 955 | 39 | 26 | 4,988 | 3,251 | 6,378 | 4,242 | ||||||||||||||||||||||||||||||||||||||||||
| Construction |
2 | 3 | 1 | – | 27 | 17 | 716 | 623 | 21 | 17 | 3,637 | 3,355 | 4,404 | 4,015 | ||||||||||||||||||||||||||||||||||||||||||
| Electricity, gas and water supply |
35 | – | 60 | 128 | 56 | 57 | 3,520 | 2,732 | 103 | 74 | 2,600 | 2,595 | 6,374 | 5,586 | ||||||||||||||||||||||||||||||||||||||||||
| Entertainment, leisure and tourism |
– | 3 | – | – | 16 | 7 | 1,382 | 1,107 | 40 | 30 | 853 | 337 | 2,291 | 1,484 | ||||||||||||||||||||||||||||||||||||||||||
| Financial, investment and insurance |
54,079 | 34,741 | 17,666 | 14,717 | 12,661 | 5,926 | 13,534 | 19,658 | 397 | 530 | 13,703 | 10,986 | 112,040 | 86,558 | ||||||||||||||||||||||||||||||||||||||||||
| Government and official institutions |
1 | 4 | 8,083 | 6,445 | 281 | 59 | 475 | 524 | 14 | 14 | 928 | 869 | 9,782 | 7,915 | ||||||||||||||||||||||||||||||||||||||||||
| Manufacturing |
230 | 60 | 107 | 204 | 611 | 220 | 18,831 | 16,004 | 553 | 432 | 43,000 | 34,211 | 63,332 | 51,131 | ||||||||||||||||||||||||||||||||||||||||||
| Personal lending |
2 | 5 | – | – | – | – | 12,867 | 10,070 | 377 | 269 | 8,782 | 7,448 | 22,028 | 17,792 | ||||||||||||||||||||||||||||||||||||||||||
| Property services |
1 | 1 | 8 | 90 | 112 | 97 | 5,303 | 4,550 | 155 | 123 | 2,495 | 2,117 | 8,074 | 6,978 | ||||||||||||||||||||||||||||||||||||||||||
| Retail trade |
1 | – | 26 | 42 | 21 | 18 | 2,344 | 1,475 | 69 | 40 | 3,597 | 1,330 | 6,058 | 2,905 | ||||||||||||||||||||||||||||||||||||||||||
| Transport and storage |
– | 1 | 87 | 107 | 81 | 31 | 4,679 | 3,796 | 137 | 102 | 2,575 | 1,506 | 7,559 | 5,543 | ||||||||||||||||||||||||||||||||||||||||||
| Wholesale trade |
64 | 28 | 60 | 30 | 437 | 186 | 12,084 | 11,332 | 354 | 306 | 27,006 | 18,786 | 40,005 | 30,668 | ||||||||||||||||||||||||||||||||||||||||||
| Other |
20 | 4 | 945 | 797 | 54 | 40 | 3,359 | 2,868 | 98 | 77 | 3,182 | 2,257 | 7,658 | 6,043 | ||||||||||||||||||||||||||||||||||||||||||
| 54,443 | 34,856 | 27,086 | 22,570 | 14,466 | 6,800 | 86,084 | 80,079 | 2,523 | 2,158 | 126,672 | 95,931 | 311,274 | 242,394 | |||||||||||||||||||||||||||||||||||||||||||
|
Consolidated - aggregate |
||||||||||||||||||||||||||||||||||||||||||||||||||||||||
| Agriculture, forestry, fishing and mining |
3 | 22 | 103 | 31 | 846 | 377 | 38,405 | 34,830 | 393 | 301 | 20,788 | 19,467 | 60,538 | 55,028 | ||||||||||||||||||||||||||||||||||||||||||
| Business services |
9 | 17 | – | 3 | 128 | 55 | 8,581 | 7,623 | 94 | 69 | 8,733 | 7,313 | 17,545 | 15,080 | ||||||||||||||||||||||||||||||||||||||||||
| Construction |
2 | 3 | 24 | 3 | 58 | 111 | 7,454 | 7,396 | 71 | 61 | 8,918 | 8,367 | 16,527 | 15,941 | ||||||||||||||||||||||||||||||||||||||||||
| Electricity, gas and water supply |
35 | – | 196 | 395 | 1,323 | 1,066 | 8,104 | 7,677 | 137 | 106 | 6,067 | 6,669 | 15,862 | 15,913 | ||||||||||||||||||||||||||||||||||||||||||
| Entertainment, leisure and tourism |
– | 3 | 37 | 1 | 382 | 118 | 11,262 | 10,110 | 116 | 90 | 3,590 | 3,307 | 15,387 | 13,629 | ||||||||||||||||||||||||||||||||||||||||||
| Financial, investment and insurance |
78,181 | 55,112 | 42,710 | 38,757 | 72,512 | 49,940 | 36,727 | 34,874 | 580 | 632 | 21,334 | 19,195 | 252,044 | 198,510 | ||||||||||||||||||||||||||||||||||||||||||
| Government and official institutions |
1,810 | 1,306 | 46,272 | 38,151 | 2,182 | 862 | 2,234 | 2,185 | 26 | 24 | 3,673 | 1,832 | 56,197 | 44,360 | ||||||||||||||||||||||||||||||||||||||||||
| Manufacturing |
234 | 64 | 1,517 | 1,754 | 3,525 | 1,435 | 28,830 | 25,835 | 626 | 494 | 52,412 | 43,383 | 87,144 | 72,965 | ||||||||||||||||||||||||||||||||||||||||||
| Personal lending |
2 | 5 | – | – | – | – | 328,176 | 298,870 | 2,747 | 2,142 | 69,598 | 62,897 | 400,523 | 363,914 | ||||||||||||||||||||||||||||||||||||||||||
| Property services |
1 | 1 | 88 | 138 | 805 | 541 | 41,173 | 38,248 | 421 | 341 | 14,093 | 15,245 | 56,581 | 54,514 | ||||||||||||||||||||||||||||||||||||||||||
| Retail trade |
3 | 2 | 76 | 48 | 258 | 189 | 15,444 | 13,510 | 169 | 119 | 8,063 | 6,783 | 24,013 | 20,651 | ||||||||||||||||||||||||||||||||||||||||||
| Transport and storage |
2 | 1 | 273 | 188 | 1,087 | 427 | 13,220 | 12,505 | 201 | 159 | 7,408 | 6,119 | 22,191 | 19,399 | ||||||||||||||||||||||||||||||||||||||||||
| Wholesale trade |
418 | 211 | 72 | 37 | 1,972 | 901 | 19,705 | 18,885 | 411 | 355 | 36,350 | 24,813 | 58,928 | 45,202 | ||||||||||||||||||||||||||||||||||||||||||
| Other |
50 | 25 | 1,248 | 1,066 | 547 | 347 | 14,426 | 12,986 | 184 | 145 | 10,102 | 8,669 | 26,557 | 23,238 | ||||||||||||||||||||||||||||||||||||||||||
| Gross Total |
80,750 | 56,772 | 92,616 | 80,572 | 85,625 | 56,369 | 573,741 | 525,534 | 6,176 | 5,038 | 271,129 | 234,059 | 1,110,037 | 958,344 | ||||||||||||||||||||||||||||||||||||||||||
|
Individual provision for credit impairment |
– | – | – | – | – | – | (1,038 | ) | (1,130 | ) | – | – | (23 | ) | (46 | ) | (1,061 | ) | (1,176 | ) | ||||||||||||||||||||||||||||||||||||
| Collective provision for credit impairment |
– | – | – | – | – | – | (2,279 | ) | (2,144 | ) | – | – | (677 | ) | (613 | ) | (2,956 | ) | (2,757 | ) | ||||||||||||||||||||||||||||||||||||
| 80,750 | 56,772 | 92,616 | 80,572 | 85,625 | 56,369 | 570,424 | 522,260 | 6,176 | 5,038 | 270,429 | 233,400 | 1,106,020 | 954,411 | |||||||||||||||||||||||||||||||||||||||||||
| Unearned income |
– | – | – | – | – | – | (739 | ) | (892 | ) | – | – | – | – | (739 | ) | (892 | ) | ||||||||||||||||||||||||||||||||||||||
| Capitalised brokerage/ mortgage origination fees |
– | – | – | – | – | – | 1,253 | 1,043 | – | – | – | – | 1,253 | 1,043 | ||||||||||||||||||||||||||||||||||||||||||
| 80,750 | 56,772 | 92,616 | 80,572 | 85,625 | 56,369 | 570,938 | 522,411 | 6,176 | 5,038 | 270,429 | 233,400 | 1,106,534 | 954,562 | |||||||||||||||||||||||||||||||||||||||||||
| Excluded from analysis above5 |
1,716 | 1,487 | 51 | 37 | – | – | – | – | 34,820 | 33,579 | – | – | 36,587 | 35,103 | ||||||||||||||||||||||||||||||||||||||||||
| Net Total |
82,466 | 58,259 | 92,667 | 80,609 | 85,625 | 56,369 | 570,938 | 522,411 | 40,996 | 38,617 | 270,429 | 233,400 | 1,143,121 | 989,665 | ||||||||||||||||||||||||||||||||||||||||||
| 1 | Available–for–sale assets. |
| 2 | Excludes individual and collective provisions for credit impairment held in respect of credit related commitments, and includes Esanda dealer finance assets classified as held for sale. |
| 3 | Mainly comprises regulatory deposits, investments backing policy liabilities and accrued interest. |
| 4 | Credit related commitments comprise undrawn facilities and customer contingent liabilities. |
| 5 | Comprises bank notes and cash at bank within cash, equity instruments within available-for-sale financial assets and investments relating to the insurance business where the credit risk is passed on to the policy holder. |
106
ANZ ANNUAL REPORT 2015
19: Financial Risk Management (continued)
Concentrations of credit risk analysis (continued):
Composition of financial instruments that give rise to credit risk by industry (continued):
| Cash, settlement balances owed to ANZ and collateral paid |
Trading securities and AFS1 |
Derivatives | Loans and advances2 |
Other financial assets3 |
Credit related commitments4 |
Total |
||||||||||||||||||||||||||||||||||||||||||||||||||
| The Company | 2015 $m |
2014 $m |
2015 $m |
2014 $m |
2015 $m |
2014 $m |
2015 $m |
2014 $m |
2015 $m |
2014 $m |
2015 $m |
2014 $m |
2015 $m |
2014 $m |
||||||||||||||||||||||||||||||||||||||||||
| Australia |
||||||||||||||||||||||||||||||||||||||||||||||||||||||||
| Agriculture, forestry, fishing and mining |
– | 21 | 59 | 21 | 691 | 225 | 15,185 | 13,854 | 79 | 56 | 9,573 | 10,525 | 25,587 | 24,702 | ||||||||||||||||||||||||||||||||||||||||||
| Business services |
4 | 12 | – | 3 | 108 | 46 | 6,254 | 5,654 | 32 | 23 | 3,340 | 3,625 | 9,738 | 9,363 | ||||||||||||||||||||||||||||||||||||||||||
| Construction |
– | – | 23 | 3 | 20 | 94 | 5,516 | 5,688 | 29 | 23 | 4,537 | 4,266 | 10,125 | 10,074 | ||||||||||||||||||||||||||||||||||||||||||
| Electricity, gas and water supply |
– | – | 99 | 132 | 837 | 692 | 3,455 | 3,988 | 18 | 16 | 2,266 | 2,836 | 6,675 | 7,664 | ||||||||||||||||||||||||||||||||||||||||||
| Entertainment, leisure and tourism |
– | – | 37 | 1 | 323 | 89 | 8,888 | 8,061 | 46 | 33 | 2,494 | 2,695 | 11,788 | 10,879 | ||||||||||||||||||||||||||||||||||||||||||
| Financial, investment and insurance5 |
22,601 | 20,481 | 18,547 | 20,577 | 59,663 | 44,627 | 22,086 | 14,464 | 115 | 58 | 6,499 | 9,671 | 129,511 | 109,878 | ||||||||||||||||||||||||||||||||||||||||||
| Government and official institutions |
130 | 135 | 32,008 | 25,599 | 685 | 241 | 706 | 539 | 4 | 2 | 2,081 | 292 | 35,614 | 26,808 | ||||||||||||||||||||||||||||||||||||||||||
| Manufacturing |
4 | 4 | 1,369 | 1,528 | 2,535 | 1,057 | 6,844 | 7,129 | 36 | 29 | 7,333 | 7,387 | 18,121 | 17,134 | ||||||||||||||||||||||||||||||||||||||||||
| Personal lending |
– | – | – | – | – | – | 251,707 | 231,114 | 1,306 | 931 | 48,282 | 44,038 | 301,295 | 276,083 | ||||||||||||||||||||||||||||||||||||||||||
| Property services |
– | – | 78 | 48 | 677 | 433 | 26,991 | 26,171 | 140 | 106 | 10,194 | 11,535 | 38,080 | 38,293 | ||||||||||||||||||||||||||||||||||||||||||
| Retail trade |
2 | 2 | 50 | 6 | 221 | 153 | 11,269 | 10,211 | 59 | 41 | 3,567 | 4,559 | 15,168 | 14,972 | ||||||||||||||||||||||||||||||||||||||||||
| Transport and storage |
2 | – | 180 | 70 | 951 | 368 | 7,052 | 7,386 | 37 | 30 | 4,114 | 3,871 | 12,336 | 11,725 | ||||||||||||||||||||||||||||||||||||||||||
| Wholesale trade |
354 | 183 | 12 | 7 | 1,520 | 702 | 6,287 | 6,320 | 33 | 25 | 7,544 | 4,770 | 15,750 | 12,007 | ||||||||||||||||||||||||||||||||||||||||||
| Other |
30 | 21 | 248 | 208 | 453 | 258 | 10,374 | 9,396 | 54 | 38 | 5,693 | 5,389 | 16,852 | 15,310 | ||||||||||||||||||||||||||||||||||||||||||
| 23,127 | 20,859 | 52,710 | 48,203 | 68,684 | 48,985 | 382,614 | 349,975 | 1,988 | 1,411 | 117,517 | 115,459 | 646,640 | 584,892 | |||||||||||||||||||||||||||||||||||||||||||
| New Zealand |
||||||||||||||||||||||||||||||||||||||||||||||||||||||||
| Agriculture, forestry, fishing and mining |
– | – | – | – | – | – | – | – | – | – | – | – | – | – | ||||||||||||||||||||||||||||||||||||||||||
| Business services |
– | – | – | – | – | – | – | – | – | – | – | – | – | – | ||||||||||||||||||||||||||||||||||||||||||
| Construction |
– | – | – | – | – | – | – | – | – | – | – | – | – | – | ||||||||||||||||||||||||||||||||||||||||||
| Electricity, gas and water supply |
– | – | – | – | – | – | – | – | – | – | – | – | – | – | ||||||||||||||||||||||||||||||||||||||||||
| Entertainment, leisure and tourism |
– | – | – | – | – | – | – | – | – | – | – | – | – | – | ||||||||||||||||||||||||||||||||||||||||||
| Financial, investment and insurance5 |
– | – | – | – | 64 | 9 | – | – | – | – | – | – | 64 | 9 | ||||||||||||||||||||||||||||||||||||||||||
| Government and official institutions |
– | – | – | – | – | – | – | – | – | – | – | – | – | – | ||||||||||||||||||||||||||||||||||||||||||
| Manufacturing |
– | – | – | – | – | – | – | – | – | – | – | – | – | – | ||||||||||||||||||||||||||||||||||||||||||
| Personal lending |
– | – | – | – | – | – | 7,289 | 8,193 | – | – | 19 | 29 | 7,308 | 8,222 | ||||||||||||||||||||||||||||||||||||||||||
| Property services |
– | – | – | – | – | – | – | – | – | – | – | – | – | – | ||||||||||||||||||||||||||||||||||||||||||
| Retail trade |
– | – | – | – | – | – | – | – | – | – | – | – | – | – | ||||||||||||||||||||||||||||||||||||||||||
| Transport and storage |
– | – | – | – | – | – | – | – | – | – | – | – | – | – | ||||||||||||||||||||||||||||||||||||||||||
| Wholesale trade |
– | – | – | – | – | – | – | – | – | – | – | – | – | – | ||||||||||||||||||||||||||||||||||||||||||
| Other |
– | – | – | – | – | – | – | – | – | – | 1 | – | 1 | – | ||||||||||||||||||||||||||||||||||||||||||
| – | – | – | – | 64 | 9 | 7,289 | 8,193 | – | – | 20 | 29 | 7,373 | 8,231 | |||||||||||||||||||||||||||||||||||||||||||
| 1 | Available–for–sale assets. |
| 2 | Excludes individual and collective provisions for credit impairment held in respect of credit related commitments, and includes Esanda dealer finance assets classified as held for sale. |
| 3 | Mainly comprises regulatory deposits, investments backing policy liabilities and accrued interest. |
| 4 | Credit related commitments comprise undrawn facilities and customer contingent liabilities. |
| 5 | Includes amounts due from other Group entities. |
NOTES TO THE FINANCIAL STATEMENTS 107
NOTES TO THE FINANCIAL STATEMENTS (continued)
19: Financial Risk Management (continued)
Concentrations of credit risk analysis (continued):
Composition of financial instruments that give rise to credit risk by industry (continued):
| Cash, settlement balances owed to ANZ and collateral paid |
Trading securities and AFS1 |
Derivatives | Loans and advances2 |
Other financial assets3 |
Credit related commitments4 |
Total | ||||||||||||||||||||||||||||||||||||||||||||||||||
| The Company | 2015 $m |
2014 $m |
2015 $m |
2014 $m |
2015 $m |
2014 $m |
2015 $m |
2014 $m |
2015 $m |
2014 $m |
2015 $m |
2014 $m |
2015 $m |
2014 $m |
||||||||||||||||||||||||||||||||||||||||||
| Overseas Markets |
||||||||||||||||||||||||||||||||||||||||||||||||||||||||
| Agriculture, forestry, fishing and mining |
– | 1 | 42 | 8 | 47 | 83 | 4,839 | 3,829 | 84 | 50 | 8,174 | 6,025 | 13,186 | 9,996 | ||||||||||||||||||||||||||||||||||||||||||
| Business services |
5 | 2 | – | – | 7 | 3 | 1,073 | 770 | 19 | 10 | 4,436 | 2,697 | 5,540 | 3,482 | ||||||||||||||||||||||||||||||||||||||||||
| Construction |
2 | 3 | 1 | – | 14 | 10 | 519 | 432 | 9 | 6 | 3,047 | 3,147 | 3,592 | 3,598 | ||||||||||||||||||||||||||||||||||||||||||
| Electricity, gas and water supply |
34 | – | 28 | 83 | 20 | 28 | 2,948 | 2,309 | 51 | 30 | 2,170 | 2,250 | 5,251 | 4,700 | ||||||||||||||||||||||||||||||||||||||||||
| Entertainment, leisure and tourism |
– | – | – | – | 8 | 4 | 1,165 | 874 | 20 | 11 | 677 | 243 | 1,870 | 1,132 | ||||||||||||||||||||||||||||||||||||||||||
| Financial, investment and insurance5 |
51,586 | 31,770 | 15,566 | 11,427 | 6,216 | 3,455 | 9,687 | 16,616 | 168 | 219 | 11,785 | 9,050 | 95,008 | 72,537 | ||||||||||||||||||||||||||||||||||||||||||
| Government and official institutions |
1 | 1 | 5,586 | 3,474 | 145 | 36 | 446 | 417 | 8 | 5 | 919 | 820 | 7,105 | 4,753 | ||||||||||||||||||||||||||||||||||||||||||
| Manufacturing |
193 | 21 | 17 | 95 | 216 | 91 | 11,050 | 9,597 | 191 | 125 | 31,817 | 24,736 | 43,484 | 34,665 | ||||||||||||||||||||||||||||||||||||||||||
| Personal lending |
1 | – | – | – | – | – | 7,581 | 5,876 | 131 | 77 | 4,351 | 3,764 | 12,064 | 9,717 | ||||||||||||||||||||||||||||||||||||||||||
| Property services |
– | 1 | 7 | 79 | 58 | 54 | 4,519 | 3,636 | 78 | 48 | 2,142 | 1,726 | 6,804 | 5,544 | ||||||||||||||||||||||||||||||||||||||||||
| Retail trade |
1 | – | 7 | 18 | 10 | 11 | 1,570 | 855 | 27 | 11 | 1,216 | 769 | 2,831 | 1,664 | ||||||||||||||||||||||||||||||||||||||||||
| Transport and storage |
– | 1 | 84 | 93 | 27 | 18 | 3,832 | 3,008 | 66 | 39 | 1,947 | 1,036 | 5,956 | 4,195 | ||||||||||||||||||||||||||||||||||||||||||
| Wholesale trade |
37 | 11 | 24 | 3 | 155 | 73 | 9,505 | 9,366 | 165 | 122 | 22,672 | 15,402 | 32,558 | 24,977 | ||||||||||||||||||||||||||||||||||||||||||
| Other |
20 | 3 | 883 | 695 | 23 | 22 | 2,386 | 2,144 | 41 | 28 | 2,650 | 1,748 | 6,003 | 4,640 | ||||||||||||||||||||||||||||||||||||||||||
| 51,880 | 31,814 | 22,245 | 15,975 | 6,946 | 3,888 | 61,120 | 59,729 | 1,058 | 781 | 98,003 | 73,413 | 241,252 | 185,560 | |||||||||||||||||||||||||||||||||||||||||||
| The Company – aggregate |
||||||||||||||||||||||||||||||||||||||||||||||||||||||||
| Agriculture, forestry, fishing and mining |
– | 22 | 101 | 29 | 738 | 308 | 20,024 | 17,683 | 163 | 106 | 17,747 | 16,550 | 38,773 | 34,698 | ||||||||||||||||||||||||||||||||||||||||||
| Business services |
9 | 14 | – | 3 | 115 | 49 | 7,327 | 6,424 | 51 | 33 | 7,776 | 6,322 | 15,278 | 12,845 | ||||||||||||||||||||||||||||||||||||||||||
| Construction |
2 | 3 | 24 | 3 | 34 | 104 | 6,035 | 6,120 | 38 | 29 | 7,584 | 7,413 | 13,717 | 13,672 | ||||||||||||||||||||||||||||||||||||||||||
| Electricity, gas and water supply |
34 | – | 127 | 215 | 857 | 720 | 6,403 | 6,297 | 69 | 46 | 4,436 | 5,086 | 11,926 | 12,364 | ||||||||||||||||||||||||||||||||||||||||||
| Entertainment, leisure and tourism |
– | – | 37 | 1 | 331 | 93 | 10,053 | 8,935 | 66 | 44 | 3,171 | 2,938 | 13,658 | 12,011 | ||||||||||||||||||||||||||||||||||||||||||
| Financial, investment and insurance5 |
74,187 | 52,251 | 34,113 | 32,004 | 65,943 | 48,091 | 31,773 | 31,080 | 283 | 277 | 18,284 | 18,721 | 224,583 | 182,424 | ||||||||||||||||||||||||||||||||||||||||||
| Government and official institutions |
131 | 136 | 37,594 | 29,073 | 830 | 277 | 1,152 | 956 | 12 | 7 | 3,000 | 1,112 | 42,719 | 31,561 | ||||||||||||||||||||||||||||||||||||||||||
| Manufacturing |
197 | 25 | 1,386 | 1,623 | 2,751 | 1,148 | 17,894 | 16,726 | 227 | 154 | 39,150 | 32,123 | 61,605 | 51,799 | ||||||||||||||||||||||||||||||||||||||||||
| Personal lending |
1 | – | – | – | – | – | 266,577 | 245,183 | 1,437 | 1,008 | 52,652 | 47,831 | 320,667 | 294,022 | ||||||||||||||||||||||||||||||||||||||||||
| Property services |
– | 1 | 85 | 127 | 735 | 487 | 31,510 | 29,807 | 218 | 154 | 12,336 | 13,261 | 44,884 | 43,837 | ||||||||||||||||||||||||||||||||||||||||||
| Retail trade |
3 | 2 | 57 | 24 | 231 | 164 | 12,839 | 11,066 | 86 | 52 | 4,783 | 5,328 | 17,999 | 16,636 | ||||||||||||||||||||||||||||||||||||||||||
| Transport and storage |
2 | 1 | 264 | 163 | 978 | 386 | 10,884 | 10,394 | 103 | 69 | 6,061 | 4,907 | 18,292 | 15,920 | ||||||||||||||||||||||||||||||||||||||||||
| Wholesale trade |
391 | 194 | 36 | 10 | 1,675 | 775 | 15,792 | 15,686 | 198 | 147 | 30,216 | 20,172 | 48,308 | 36,984 | ||||||||||||||||||||||||||||||||||||||||||
| Other |
50 | 24 | 1,131 | 903 | 476 | 280 | 12,760 | 11,540 | 95 | 66 | 8,344 | 7,137 | 22,856 | 19,950 | ||||||||||||||||||||||||||||||||||||||||||
| Gross Total |
75,007 | 52,673 | 74,955 | 64,178 | 75,694 | 52,882 | 451,023 | 417,897 | 3,046 | 2,192 | 215,540 | 188,901 | 895,265 | 778,723 | ||||||||||||||||||||||||||||||||||||||||||
|
Individual provision for credit impairment |
– | – | – | – | – | – | (740 | ) | (814 | ) | – | – | (19 | ) | (40 | ) | (759 | ) | (854 | ) | ||||||||||||||||||||||||||||||||||||
| Collective provision for credit impairment |
– | – | – | – | – | – | (1,765 | ) | (1,669 | ) | – | – | (557 | ) | (488 | ) | (2,322 | ) | (2,157 | ) | ||||||||||||||||||||||||||||||||||||
| 75,007 | 52,673 | 74,955 | 64,178 | 75,694 | 52,882 | 448,518 | 415,414 | 3,046 | 2,192 | 214,964 | 188,373 | 892,184 | 775,712 | |||||||||||||||||||||||||||||||||||||||||||
| Unearned income |
– | – | – | – | – | – | (438 | ) | (657 | ) | – | – | – | – | (438 | ) | (657 | ) | ||||||||||||||||||||||||||||||||||||||
| Capitalised brokerage/mortgage origination fees |
– | – | – | – | – | – | 944 | 837 | – | – | – | – | 944 | 837 | ||||||||||||||||||||||||||||||||||||||||||
| 75,007 | 52,673 | 74,955 | 64,178 | 75,694 | 52,882 | 449,024 | 415,594 | 3,046 | 2,192 | 214,964 | 188,373 | 892,690 | 775,892 | |||||||||||||||||||||||||||||||||||||||||||
| Excluded from analysis above6 |
1,045 | 1,005 | 30 | 22 | – | – | – | – | – | – | – | – | 1,075 | 1,027 | ||||||||||||||||||||||||||||||||||||||||||
| Net total |
76,052 | 53,678 | 74,985 | 64,200 | 75,694 | 52,882 | 449,024 | 415,594 | 3,046 | 2,192 | 214,964 | 188,373 | 893,765 | 776,919 | ||||||||||||||||||||||||||||||||||||||||||
| 1 | Available–for–sale assets. |
| 2 | Excludes individual and collective provisions for credit impairment held in respect of credit related commitments, and includes Esanda dealer finance assets classified as held for sale. |
| 3 | Mainly comprises regulatory deposits, investments backing policy liabilities and accrued interest. |
| 4 | Credit related commitments comprise undrawn facilities and customer contingent liabilities. |
| 5 | Includes amounts due from other Group entities. |
| 6 | Comprises bank notes and cash at bank within cash and equity instruments within available-for-sale financial assets. |
108
ANZ ANNUAL REPORT 2015
19: Financial Risk Management (continued)
Credit quality
Maximum exposure to credit risk
For financial assets recognised on the balance sheet, the maximum exposure to credit risk is the carrying amount. In certain circumstances, there may be differences between the carrying amounts reported on the balance sheet and the amounts reported in the tables below. Principally, these differences arise in respect of financial assets that are subject to risks other than credit risk, such as equity investments which are primarily subject to market risk, or bank notes and coins. For contingent exposures, the maximum exposure to credit risk is the maximum amount the Group would have to pay if the instrument is called upon. For undrawn facilities, the maximum exposure to credit risk is the full amount of the committed facilities.
The following tables present the maximum exposure to credit risk of on-balance sheet and off-balance sheet financial assets before taking account of any collateral held or other credit enhancements.
| Reported on Balance Sheet |
Excluded1 | Maximum exposure to credit risk |
||||||||||||||||||||||
| Consolidated | 2015 $m |
2014 $m |
2015 $m |
2014 $m |
2015 $m |
2014 $m |
||||||||||||||||||
| On-balance sheet positions |
||||||||||||||||||||||||
| Cash |
53,903 | 32,559 | 1,716 | 1,487 | 52,187 | 31,072 | ||||||||||||||||||
| Settlement balances owed to ANZ |
18,596 | 20,241 | – | – | 18,596 | 20,241 | ||||||||||||||||||
| Collateral paid |
9,967 | 5,459 | – | – | 9,967 | 5,459 | ||||||||||||||||||
| Trading securities |
49,000 | 49,692 | – | – | 49,000 | 49,692 | ||||||||||||||||||
| Derivative financial instruments2 |
85,625 | 56,369 | – | – | 85,625 | 56,369 | ||||||||||||||||||
| Available-for-sale assets |
43,667 | 30,917 | 51 | 37 | 43,616 | 30,880 | ||||||||||||||||||
|
Net loans and advances3 |
||||||||||||||||||||||||
| – Australia |
313,164 | 287,350 | – | – | 313,164 | 287,350 | ||||||||||||||||||
| – International and Institutional Banking |
154,741 | 141,986 | – | – | 154,741 | 141,986 | ||||||||||||||||||
| – New Zealand |
95,211 | 86,063 | – | – | 95,211 | 86,063 | ||||||||||||||||||
| – Global Wealth |
7,122 | 6,353 | – | – | 7,122 | 6,353 | ||||||||||||||||||
| Regulatory deposits |
1,773 | 1,565 | – | – | 1,773 | 1,565 | ||||||||||||||||||
| Investments backing policy liabilities |
34,820 | 33,579 | 34,820 | 33,579 | – | – | ||||||||||||||||||
| Other financial assets4 |
4,403 | 3,473 | – | – | 4,403 | 3,473 | ||||||||||||||||||
| 871,992 | 755,606 | 36,587 | 35,103 | 835,405 | 720,103 | |||||||||||||||||||
| Off-balance sheet positions |
||||||||||||||||||||||||
| Undrawn facilities |
230,794 | 193,984 | – | – | 230,794 | 193,984 | ||||||||||||||||||
| Contingent facilities |
40,335 | 40,075 | – | – | 40,335 | 40,075 | ||||||||||||||||||
| 271,129 | 234,059 | – | – | 271,129 | 234,059 | |||||||||||||||||||
| Total |
1,143,121 | 989,665 | 36,587 | 35,103 | 1,106,534 | 954,162 | ||||||||||||||||||
| Reported on balance Sheet |
Excluded1 | Maximum exposure to credit risk |
||||||||||||||||||||||
| The Company | 2015 $m |
2014 $m |
2015 $m |
2014 $m |
2015 $m |
2014 $m |
||||||||||||||||||
| On-balance sheet positions |
||||||||||||||||||||||||
| Cash |
51,217 | 30,655 | 1,045 | 1,005 | 50,172 | 29,650 | ||||||||||||||||||
| Settlement balances owed to ANZ |
16,601 | 18,150 | – | – | 16,601 | 18,150 | ||||||||||||||||||
| Collateral paid |
8,234 | 4,873 | – | – | 8,234 | 4,873 | ||||||||||||||||||
| Trading securities |
37,373 | 38,049 | – | – | 37,373 | 38,049 | ||||||||||||||||||
| Derivative financial instruments2 |
75,694 | 52,882 | – | – | 75,694 | 52,882 | ||||||||||||||||||
| Available-for-sale assets |
37,612 | 26,151 | 30 | 22 | 37,582 | 26,129 | ||||||||||||||||||
| Net loans and advances3 |
448,448 | 415,066 | – | – | 448,448 | 415,066 | ||||||||||||||||||
| Regulatory deposits |
557 | 434 | – | – | 557 | 434 | ||||||||||||||||||
| Other financial assets4 |
2,489 | 1,758 | – | – | 2,489 | 1,758 | ||||||||||||||||||
| 678,225 | 588,018 | 1,075 | 1,027 | 677,150 | 586,991 | |||||||||||||||||||
| Off-balance sheet positions |
||||||||||||||||||||||||
| Undrawn facilities |
180,847 | 153,985 | – | – | 180,847 | 153,985 | ||||||||||||||||||
| Contingent facilities |
34,693 | 34,916 | – | – | 34,693 | 34,916 | ||||||||||||||||||
| 215,540 | 188,901 | – | – | 215,540 | 188,901 | |||||||||||||||||||
| Total |
893,765 | 776,919 | 1,075 | 1,027 | 892,690 | 775,892 | ||||||||||||||||||
| 1 | Includes bank notes and coins and cash at bank within cash, equity instruments within available-for-sale financial assets and investments relating to the insurance business where the credit risk is passed onto the policy holder. |
| 2 | Derivative financial instruments are net of credit valuation adjustments. |
| 3 | Includes individual and collective provisions for credit impairment held in respect of credit related commitments, and includes Esanda dealer finance assets classified as held for sale. |
| 4 | Mainly comprises accrued interest. |
NOTES TO THE FINANCIAL STATEMENTS 109
NOTES TO THE FINANCIAL STATEMENTS (continued)
19: Financial Risk Management (continued)
Distribution of financial assets by credit quality
The Group has a comprehensive rating system that is used to quantify credit risk. The use of masterscales ensures consistency across exposure types at the Group, providing a consistent framework for reporting and analysis.
All customers with whom ANZ has a credit relationship, including guarantors, are assigned a Customer Credit Rating (CCR) or score at origination either by programmed credit assessment or by judgemental assessment. In addition, the CCR or score is reviewed on an ongoing basis to ensure it accurately reflects the credit risk of the customer and the prevailing economic conditions.
The Group’s risk grade profile therefore changes dynamically through new lending, repayment and/or existing counterparty movements in either risk or volume.
Restructured items
Restructured items are facilities in which the original contractual terms have been modified for reasons related to the financial difficulties of the customer. Restructuring may consist of reduction of interest, principal or other payments legally due or an extension in maturity materially beyond those typically offered to new facilities with similar risk.
| Neither past due nor impaired |
Past due but not impaired |
Restructured | Impaired | Total | ||||||||||||||||||||||||||||||||||||
| Consolidated | 2015 $m |
2014 $m |
2015 $m |
2014 $m |
2015 $m |
2014 $m |
2015 $m |
2014 $m |
2015 $m |
2014 $m |
||||||||||||||||||||||||||||||
| Cash |
52,187 | 31,072 | – | – | – | – | – | – | 52,187 | 31,072 | ||||||||||||||||||||||||||||||
| Settlement balances owed to ANZ |
18,596 | 20,241 | – | – | – | – | – | – | 18,596 | 20,241 | ||||||||||||||||||||||||||||||
| Collateral paid |
9,967 | 5,459 | – | – | – | – | – | – | 9,967 | 5,459 | ||||||||||||||||||||||||||||||
| Trading securities |
49,000 | 49,692 | – | – | – | – | – | – | 49,000 | 49,692 | ||||||||||||||||||||||||||||||
| Derivative financial instruments1 |
85,588 | 56,332 | – | – | – | – | 37 | 37 | 85,625 | 56,369 | ||||||||||||||||||||||||||||||
| Available-for-sale assets |
43,616 | 30,880 | – | – | – | – | – | – | 43,616 | 30,880 | ||||||||||||||||||||||||||||||
| Net loans and advances2 |
||||||||||||||||||||||||||||||||||||||||
| – Australia |
302,307 | 277,325 | 10,485 | 9,626 | 5 | – | 586 | 607 | 313,383 | 287,558 | ||||||||||||||||||||||||||||||
| – International and Institutional Banking |
153,735 | 141,071 | 623 | 623 | 166 | 53 | 631 | 624 | 155,155 | 142,371 | ||||||||||||||||||||||||||||||
| – New Zealand |
93,342 | 83,885 | 1,739 | 1,912 | 13 | 14 | 182 | 315 | 95,276 | 86,126 | ||||||||||||||||||||||||||||||
| – Global Wealth |
7,009 | 6,259 | 111 | 91 | – | – | 4 | 6 | 7,124 | 6,356 | ||||||||||||||||||||||||||||||
| Regulatory deposits |
1,773 | 1,565 | – | – | – | – | – | – | 1,773 | 1,565 | ||||||||||||||||||||||||||||||
| Other financial assets3 |
4,403 | 3,473 | – | – | – | – | – | – | 4,403 | 3,473 | ||||||||||||||||||||||||||||||
| Credit related commitments4 |
270,395 | 233,343 | – | – | – | – | 34 | 57 | 270,429 | 233,400 | ||||||||||||||||||||||||||||||
| Total |
1,091,918 | 940,597 | 12,958 | 12,252 | 184 | 67 | 1,474 | 1,646 | 1,106,534 | 954,562 | ||||||||||||||||||||||||||||||
| Neither past due nor impaired |
Past due but not impaired |
Restructured | Impaired | Total | ||||||||||||||||||||||||||||||||||||
| The Company | 2015 $m |
2014 $m |
2015 $m |
2014 $m |
2015 $m |
2014 $m |
2015 $m |
2014 $m |
2015 $m |
2014 $m |
||||||||||||||||||||||||||||||
| Cash |
50,172 | 29,650 | – | – | – | – | – | – | 50,172 | 29,650 | ||||||||||||||||||||||||||||||
| Settlement balances owed to ANZ |
16,601 | 18,150 | – | – | – | – | – | – | 16,601 | 18,150 | ||||||||||||||||||||||||||||||
| Collateral paid |
8,234 | 4,873 | – | – | – | – | – | – | 8,234 | 4,873 | ||||||||||||||||||||||||||||||
| Trading securities |
37,373 | 38,049 | – | – | – | – | – | – | 37,373 | 38,049 | ||||||||||||||||||||||||||||||
| Derivative financial instruments1 |
75,657 | 52,845 | – | – | – | – | 37 | 37 | 75,694 | 52,882 | ||||||||||||||||||||||||||||||
| Available-for-sale assets |
37,582 | 26,129 | – | – | – | – | – | – | 37,582 | 26,129 | ||||||||||||||||||||||||||||||
| Net loans and advances2 |
437,153 | 404,611 | 10,943 | 9,849 | 94 | 26 | 834 | 1,108 | 449,024 | 415,594 | ||||||||||||||||||||||||||||||
| Regulatory deposits |
557 | 434 | – | – | – | – | – | – | 557 | 434 | ||||||||||||||||||||||||||||||
| Other financial assets3 |
2,489 | 1,758 | – | – | – | – | – | – | 2,489 | 1,758 | ||||||||||||||||||||||||||||||
| Credit related commitments4 |
214,940 | 188,344 | – | – | – | – | 24 | 29 | 214,964 | 188,373 | ||||||||||||||||||||||||||||||
| Total |
880,758 | 764,843 | 10,943 | 9,849 | 94 | 26 | 895 | 1,174 | 892,690 | 775,892 | ||||||||||||||||||||||||||||||
| 1 | Derivative financial instruments are net of credit valuation adjustments. |
| 2 | Includes Esanda dealer finance assets classified as held for sale. Individual and collective provisions for credit impairment held in respect of credit related commitments have been reallocated to credit related commitments in this table. |
| 3 | Mainly comprises accrued interest. |
| 4 | Credit related commitments comprise undrawn facilities and customer contingent liabilities net of collective and individual provisions. |
110
ANZ ANNUAL REPORT 2015
19: Financial Risk Management (continued)
Credit quality of financial assets neither past due nor impaired
The credit quality of financial assets is managed by the Group using internal CCRs based on their current probability of default. The Group’s masterscales are mapped to external rating agency scales, to enable wider comparisons.
| Internal rating | ||
| Strong credit profile | Customers that have demonstrated superior stability in their operating and financial performance over the long-term, and whose debt servicing capacity is not significantly vulnerable to foreseeable events. This rating broadly corresponds to ratings ‘Aaa’ to ‘Baa3’ and ‘AAA’ to ‘BBB-’ of Moody’s and Standard & Poor’s respectively. | |
| Satisfactory risk | Customers that have consistently demonstrated sound operational and financial stability over the medium to long-term, even though some may be susceptible to cyclical trends or variability in earnings. This rating broadly corresponds to ratings ‘Ba2’ to ‘Ba3’ and ‘BB’ to ‘BB-’ of Moody’s and Standard & Poor’s respectively. | |
| Sub-standard but not past due or impaired | Customers that have demonstrated some operational and financial instability, with variability and uncertainty in profitability and liquidity projected to continue over the short and possibly medium term. This rating broadly corresponds to ratings ‘B1’ to ‘Caa’ and ‘B+’ to ‘CCC’ of Moody’s and Standard & Poor’s respectively. |
| Strong credit profile | Satisfactory risk | Sub-standard but not past due or impaired |
Total | |||||||||||||||||||||||||||||
| Consolidated | 2015 $m |
2014 $m |
2015 $m |
2014 $m |
2015 $m |
2014 $m |
2015 $m |
2014 $m |
||||||||||||||||||||||||
| Cash |
52,139 | 30,907 | 48 | 148 | – | 17 | 52,187 | 31,072 | ||||||||||||||||||||||||
| Settlement balances owed to ANZ |
17,845 | 19,671 | 665 | 422 | 86 | 148 | 18,596 | 20,241 | ||||||||||||||||||||||||
| Collateral paid |
9,957 | 5,417 | 6 | 42 | 4 | – | 9,967 | 5,459 | ||||||||||||||||||||||||
| Trading securities |
48,898 | 49,372 | 79 | 296 | 23 | 24 | 49,000 | 49,692 | ||||||||||||||||||||||||
| Derivative financial instruments1 |
84,074 | 55,390 | 1,351 | 831 | 163 | 111 | 85,588 | 56,332 | ||||||||||||||||||||||||
| Available-for-sale assets |
42,097 | 29,319 | 1,519 | 1,530 | – | 31 | 43,616 | 30,880 | ||||||||||||||||||||||||
| Net loans and advances2 |
||||||||||||||||||||||||||||||||
| – Australia |
227,465 | 208,070 | 60,154 | 55,771 | 14,688 | 13,484 | 302,307 | 277,325 | ||||||||||||||||||||||||
| – International and Institutional Banking |
125,603 | 115,138 | 25,163 | 23,875 | 2,969 | 2,058 | 153,735 | 141,071 | ||||||||||||||||||||||||
| – New Zealand |
65,563 | 58,167 | 25,602 | 23,857 | 2,177 | 1,861 | 93,342 | 83,885 | ||||||||||||||||||||||||
| – Global Wealth |
4,941 | 4,112 | 1,903 | 2,122 | 165 | 25 | 7,009 | 6,259 | ||||||||||||||||||||||||
| Regulatory deposits |
1,083 | 1,010 | 657 | 509 | 33 | 46 | 1,773 | 1,565 | ||||||||||||||||||||||||
| Other financial assets3 |
3,948 | 3,104 | 404 | 319 | 51 | 50 | 4,403 | 3,473 | ||||||||||||||||||||||||
| Credit related commitments4 |
220,815 | 196,558 | 46,681 | 34,425 | 2,899 | 2,360 | 270,395 | 233,343 | ||||||||||||||||||||||||
| Total |
904,428 | 776,235 | 164,232 | 144,147 | 23,258 | 20,215 | 1,091,918 | 940,597 | ||||||||||||||||||||||||
| Strong credit profile | Satisfactory risk | Sub-standard but not past due or impaired |
Total | |||||||||||||||||||||||||||||
| The Company | 2015 $m |
2014 $m |
2015 $m |
2014 $m |
2015 $m |
2014 $m |
2015 $m |
2014 $m |
||||||||||||||||||||||||
| Cash |
50,126 | 29,612 | 46 | 38 | – | – | 50,172 | 29,650 | ||||||||||||||||||||||||
| Settlement balances owed to ANZ |
16,253 | 17,937 | 277 | 90 | 71 | 123 | 16,601 | 18,150 | ||||||||||||||||||||||||
| Collateral paid |
8,224 | 4,831 | 6 | 42 | 4 | – | 8,234 | 4,873 | ||||||||||||||||||||||||
| Trading securities |
37,322 | 37,928 | 28 | 98 | 23 | 23 | 37,373 | 38,049 | ||||||||||||||||||||||||
| Derivative financial instruments1 |
74,394 | 52,741 | 1,114 | 73 | 149 | 31 | 75,657 | 52,845 | ||||||||||||||||||||||||
| Available-for-sale assets |
37,567 | 25,331 | 15 | 692 | – | 106 | 37,582 | 26,129 | ||||||||||||||||||||||||
| Net loans and advances2 |
339,549 | 313,681 | 80,488 | 75,964 | 17,116 | 14,966 | 437,153 | 404,611 | ||||||||||||||||||||||||
| Regulatory deposits |
393 | 300 | 145 | 118 | 19 | 16 | 557 | 434 | ||||||||||||||||||||||||
| Other financial assets3 |
2,159 | 1,520 | 293 | 201 | 37 | 37 | 2,489 | 1,758 | ||||||||||||||||||||||||
| Credit related commitments4 |
177,997 | 162,260 | 35,132 | 24,159 | 2,485 | 1,925 | 215,614 | 188,344 | ||||||||||||||||||||||||
| Total |
743,984 | 646,141 | 117,544 | 101,475 | 19,904 | 17,227 | 881,432 | 764,843 | ||||||||||||||||||||||||
| 1 | Derivative financial instruments are net of credit valuation adjustments. |
| 2 | Includes Esanda dealer finance assets classified as held for sale. Individual and collective provisions for credit impairment held in respect of credit related commitments have been reallocated to credit related commitments in this table. |
| 3 | Mainly comprises accrued interest. |
| 4 | Credit related commitments comprise undrawn facilities and customer contingent liabilities net of collective and individual provisions. |
NOTES TO THE FINANCIAL STATEMENTS 111
NOTES TO THE FINANCIAL STATEMENTS (continued)
19: Financial Risk Management (continued)
Ageing analysis of financial assets that are past due but not impaired
Ageing analysis of past due loans is used by the Group to measure and manage emerging credit risks. Financial assets that are past due but not impaired include those which are assessed, approved and managed on a portfolio basis within a centralised environment (for example credit cards and personal loans) that can be held on a productive basis until they are 180 days past due, as well as those which are managed on an individual basis.
A large portion of retail credit exposures, such as residential mortgages, are generally well secured. That is, the value of associated security is sufficient to cover amounts outstanding.
| Consolidated | The Company | |||||||||||||||||||||||||||||||||||||||||||||||||
| As at 30 Sep 15 | 1-5 days $m |
6-29 days $m |
30-59 days $m |
60-89 days $m |
>90 days $m |
Total $m |
1-5 days $m |
6-29 days $m |
30-59 days $m |
60-89 days $m |
>90 days $m |
Total $m |
||||||||||||||||||||||||||||||||||||||
| Net loans and advances1 |
||||||||||||||||||||||||||||||||||||||||||||||||||
| – Australia |
1,813 | 4,359 | 1,426 | 813 | 2,074 | 10,485 | 1,831 | 4,646 | 1,461 | 878 | 2,127 | 10,943 | ||||||||||||||||||||||||||||||||||||||
| – International and Institutional Banking |
14 | 387 | 8 | 117 | 97 | 623 | – | – | – | – | – | – | ||||||||||||||||||||||||||||||||||||||
| – New Zealand |
781 | 407 | 235 | 115 | 201 | 1,739 | – | – | – | – | – | – | ||||||||||||||||||||||||||||||||||||||
| – Global Wealth |
13 | 82 | 5 | 5 | 6 | 111 | – | – | – | – | – | – | ||||||||||||||||||||||||||||||||||||||
| Total |
2,621 | 5,235 | 1,674 | 1,050 | 2,378 | 12,958 | 1,831 | 4,646 | 1,461 | 878 | 2,127 | 10,943 | ||||||||||||||||||||||||||||||||||||||
| Consolidated | The Company | |||||||||||||||||||||||||||||||||||||||||||||||||
| As at 30 Sep 14 | 1-5 days $m |
6-29 days $m |
30-59 days $m |
60-89 days $m |
>90 days $m |
Total $m |
1-5 days $m |
6-29 days $m |
30-59 days $m |
60-89 days $m |
>90 days $m |
Total $m |
||||||||||||||||||||||||||||||||||||||
| Net loans and advances1 |
||||||||||||||||||||||||||||||||||||||||||||||||||
| – Australia |
2,119 | 3,701 | 1,335 | 743 | 1,728 | 9,626 | 2,141 | 3,805 | 1,366 | 759 | 1,778 | 9,849 | ||||||||||||||||||||||||||||||||||||||
| – International and Institutional Banking |
52 | 383 | 1 | 91 | 96 | 623 | – | – | – | – | – | – | ||||||||||||||||||||||||||||||||||||||
| – New Zealand |
893 | 442 | 287 | 136 | 154 | 1,912 | – | – | – | – | – | – | ||||||||||||||||||||||||||||||||||||||
| – Global Wealth |
18 | 33 | 1 | 35 | 4 | 91 | – | – | – | – | – | – | ||||||||||||||||||||||||||||||||||||||
| Total |
3,082 | 4,559 | 1,624 | 1,005 | 1,982 | 12,252 | 2,141 | 3,805 | 1,366 | 759 | 1,778 | 9,849 | ||||||||||||||||||||||||||||||||||||||
| 1 | Includes Esanda dealer finance assets classified as held for sale. Individual and collective provisions for credit impairment held in respect of credit related commitments have been reallocated to credit related commitments in this table. |
Estimated value of collateral for all financial assets
| Total value of collateral |
Credit exposure | Unsecured portion of credit exposure |
||||||||||||||||||||||
| Consolidated | 2015 $m |
2014 $m |
2015 $m |
2014 $m |
2015 $m |
2014 $m |
||||||||||||||||||
| Cash |
11,770 | 13,711 | 52,187 | 31,072 | 40,417 | 17,361 | ||||||||||||||||||
| Settlement balances owed to ANZ |
300 | 184 | 18,596 | 20,241 | 18,296 | 20,057 | ||||||||||||||||||
| Collateral paid |
– | – | 9,967 | 5,459 | 9,967 | 5,459 | ||||||||||||||||||
| Trading securities |
1,081 | 991 | 49,000 | 49,692 | 47,919 | 48,701 | ||||||||||||||||||
| Derivative financial instruments |
7,829 | 5,599 | 85,625 | 56,369 | 77,796 | 50,770 | ||||||||||||||||||
| Available-for-sale assets |
1,603 | 887 | 43,616 | 30,880 | 42,013 | 29,993 | ||||||||||||||||||
| Net loans and advances1,2 |
||||||||||||||||||||||||
| – Australia |
283,392 | 258,854 | 313,383 | 287,558 | 29,991 | 28,704 | ||||||||||||||||||
| – International and Institutional Banking |
53,887 | 46,162 | 155,155 | 142,371 | 101,268 | 96,209 | ||||||||||||||||||
| – New Zealand |
89,033 | 80,323 | 95,276 | 86,126 | 6,243 | 5,803 | ||||||||||||||||||
| – Global Wealth |
6,421 | 5,415 | 7,124 | 6,356 | 703 | 941 | ||||||||||||||||||
| Regulatory deposits |
– | – | 1,773 | 1,565 | 1,773 | 1,565 | ||||||||||||||||||
| Other financial assets3 |
1,351 | 1,308 | 4,403 | 3,473 | 3,052 | 2,165 | ||||||||||||||||||
| Credit related commitments4 |
50,401 | 49,014 | 270,429 | 233,400 | 220,028 | 184,386 | ||||||||||||||||||
| Total |
507,068 | 462,448 | 1,106,534 | 954,562 | 599,466 | 492,114 | ||||||||||||||||||
| 1 | Individual and collective provisions for credit impairment held in respect of credit related commitments have been reallocated to credit related commitments in this table. |
| 2 | Includes Esanda dealer finance assets classified as held for sale. Individual and collective provisions for credit impairment held in respect of credit related commitments have been reallocated to credit related commitments in this table. |
| 3 | Mainly comprises accrued interest. |
| 4 | Credit related commitments comprise undrawn facilities and customer contingent liabilities net of collective and individual provisions. |
112
ANZ ANNUAL REPORT 2015
19: Financial Risk Management (continued)
Estimated value of collateral for all financial assets
| Total value of collateral |
Credit exposure | Unsecured portion of credit exposure |
||||||||||||||||||||||
| The Company |
2015 $m |
2014 $m |
2015 $m |
2014 $m |
2015 $m |
2014 $m |
||||||||||||||||||
| Cash |
11,479 | 13,349 | 50,172 | 29,650 | 38,693 | 16,301 | ||||||||||||||||||
| Settlement balances owed to ANZ |
271 | 163 | 16,601 | 18,150 | 16,330 | 17,987 | ||||||||||||||||||
| Collateral paid |
– | – | 8,234 | 4,873 | 8,234 | 4,873 | ||||||||||||||||||
| Trading securities |
838 | 660 | 37,373 | 38,049 | 36,535 | 37,389 | ||||||||||||||||||
| Derivative financial instruments |
6,886 | 4,886 | 75,694 | 52,882 | 68,808 | 47,996 | ||||||||||||||||||
| Available-for-sale assets |
1,603 | 778 | 37,582 | 26,129 | 35,979 | 25,351 | ||||||||||||||||||
| Net loans and advances1 |
340,139 | 309,407 | 449,024 | 415,594 | 108,885 | 106,187 | ||||||||||||||||||
| Regulatory deposits |
– | – | 557 | 434 | 557 | 434 | ||||||||||||||||||
| Other financial assets2 |
1,000 | 930 | 2,489 | 1,758 | 1,489 | 828 | ||||||||||||||||||
| Credit related commitments3 |
35,414 | 32,965 | 214,964 | 188,373 | 179,550 | 155,408 | ||||||||||||||||||
| Total |
397,630 | 363,138 | 892,690 | 775,892 | 495,060 | 412,754 | ||||||||||||||||||
| 1 | Includes Esanda dealer finance assets classified as held for sale. Individual and collective provisions for credit impairment held in respect of credit related commitments have been reallocated to credit related commitments in this table. |
| 2 | Mainly comprises accrued interest. |
| 3 | Credit related commitments comprise undrawn facilities and customer contingent liabilities net of collective and individual provisions. |
Financial assets that are individually impaired
| Consolidated | The Company | |||||||||||||||||||||||||||||||||
| Impaired assets1 | Individual provision balance |
Impaired assets1 | Individual provision balance |
|||||||||||||||||||||||||||||||
| 2015 $m |
2014 $m |
2015 $m |
2014 $m |
2015 $m |
2014 $m |
2015 $m |
2014 $m |
|||||||||||||||||||||||||||
| Australia |
||||||||||||||||||||||||||||||||||
| Derivative financial instruments |
33 | 29 | – | – | 33 | 29 | – | – | ||||||||||||||||||||||||||
| Loans and advances |
1,446 | 1,632 | 679 | 700 | 1,356 | 1,572 | 667 | 671 | ||||||||||||||||||||||||||
| Credit related commitments2 |
44 | 70 | 19 | 40 | 43 | 70 | 19 | 40 | ||||||||||||||||||||||||||
| Subtotal |
1,523 | 1,731 | 698 | 740 | 1,432 | 1,671 | 686 | 711 | ||||||||||||||||||||||||||
| New Zealand |
||||||||||||||||||||||||||||||||||
| Derivative financial instruments |
– | 2 | – | – | – | – | – | – | ||||||||||||||||||||||||||
| Loans and advances |
354 | 582 | 143 | 194 | 20 | 30 | 7 | 9 | ||||||||||||||||||||||||||
| Credit related commitments2 |
13 | 33 | 4 | 6 | – | – | – | – | ||||||||||||||||||||||||||
| Subtotal |
367 | 617 | 147 | 200 | 20 | 30 | 7 | 9 | ||||||||||||||||||||||||||
| Asia Pacific, Europe & America |
||||||||||||||||||||||||||||||||||
| Derivative financial instruments |
4 | 6 | – | – | 4 | 6 | – | – | ||||||||||||||||||||||||||
| Loans and advances |
641 | 468 | 216 | 236 | 198 | 321 | 66 | 134 | ||||||||||||||||||||||||||
| Credit related commitments2 |
– | – | – | – | – | – | – | – | ||||||||||||||||||||||||||
| Subtotal |
645 | 474 | 216 | 236 | 202 | 327 | 66 | 134 | ||||||||||||||||||||||||||
| Aggregate |
||||||||||||||||||||||||||||||||||
| Derivative financial instruments |
37 | 37 | – | – | 37 | 35 | – | – | ||||||||||||||||||||||||||
| Loans and advances |
2,441 | 2,682 | 1,038 | 1,130 | 1,574 | 1,923 | 740 | 814 | ||||||||||||||||||||||||||
| Credit related commitments2 |
57 | 103 | 23 | 46 | 43 | 70 | 19 | 40 | ||||||||||||||||||||||||||
| Total |
2,535 | 2,822 | 1,061 | 1,176 | 1,654 | 2,028 | 759 | 854 | ||||||||||||||||||||||||||
| 1 | Excludes restructured items. |
| 2 | Credit related commitments comprise undrawn facilities and customer contingent liabilities. |
NOTES TO THE FINANCIAL STATEMENTS 113
NOTES TO THE FINANCIAL STATEMENTS (continued)
19: Financial Risk Management (continued)
114
ANZ ANNUAL REPORT 2015
19: Financial Risk Management (continued)
Traded Market Risk
Below are the aggregate Value at Risk (VaR) exposures at a 99% confidence level covering both physical and derivatives trading positions for the Bank’s principal trading centres.
| 30 September 2015 | 30 September 2014 | |||||||||||||||||||||||||||||||||
| Consolidated | As at $m |
High for $m |
Low for year $m |
Average for $m |
As at $m |
High for $m |
Low for year $m |
Average for $m |
||||||||||||||||||||||||||
| Value at risk at 99% confidence |
||||||||||||||||||||||||||||||||||
| Foreign exchange |
5.0 | 18.2 | 2.8 | 7.9 | 11.9 | 18.5 | 1.7 | 8.9 | ||||||||||||||||||||||||||
| Interest rate |
10.1 | 20.2 | 4.8 | 9.3 | 10.4 | 16.6 | 3.8 | 8.1 | ||||||||||||||||||||||||||
| Credit |
3.5 | 5.4 | 2.9 | 3.8 | 5.8 | 5.8 | 2.7 | 3.8 | ||||||||||||||||||||||||||
| Commodity |
1.6 | 3.6 | 1.3 | 2.4 | 2.0 | 2.8 | 0.9 | 1.4 | ||||||||||||||||||||||||||
| Equity |
2.5 | 6.3 | 0.1 | 1.1 | 1.3 | 2.5 | 0.4 | 1.0 | ||||||||||||||||||||||||||
| Diversification benefit |
(6 | ) | n/a | n/a | (13.2 | ) | (18.6 | ) | n/a | n/a | (10.5 | ) | ||||||||||||||||||||||
| 16.7 | 19.7 | 6.9 | 11.3 | 12.8 | 22.9 | 5.5 | 12.7 | |||||||||||||||||||||||||||
| 30 September 2015 | 30 September 2014 | |||||||||||||||||||||||||||||||||
| The Company | As at $m |
High for $m |
Low for year $m |
Average for $m |
As at $m |
High for $m |
Low for year $m |
Average for $m |
||||||||||||||||||||||||||
| Value at risk at 99% confidence |
||||||||||||||||||||||||||||||||||
| Foreign exchange |
5.2 | 18.3 | 2.8 | 8.0 | 12.0 | 18.3 | 1.7 | 8.8 | ||||||||||||||||||||||||||
| Interest rate |
8.5 | 19.7 | 4.7 | 8.8 | 10.0 | 15.4 | 3.8 | 7.7 | ||||||||||||||||||||||||||
| Credit |
3.1 | 4.7 | 2.6 | 3.6 | 6.0 | 6.0 | 2.5 | 3.6 | ||||||||||||||||||||||||||
| Commodity |
1.6 | 3.6 | 1.3 | 2.4 | 2.0 | 2.8 | 0.9 | 1.4 | ||||||||||||||||||||||||||
| Equity |
2.5 | 6.3 | 0.1 | 1.1 | 1.3 | 2.5 | 0.4 | 1.0 | ||||||||||||||||||||||||||
| Diversification benefit |
(5.8 | ) | n/a | n/a | (12.8 | ) | (18.9 | ) | n/a | n/a | (10.3 | ) | ||||||||||||||||||||||
| 15.1 | 19.3 | 6.7 | 11.1 | 12.4 | 21.0 | 5.3 | 12.2 | |||||||||||||||||||||||||||
VaR is calculated separately for foreign exchange, interest rate, credit, commodity and equities and for the Group. The diversification benefit reflects the historical correlation between these products. Electricity commodities risk is measured under the standard approach for regulatory purposes.
To supplement the VaR methodology, ANZ applies a wide range of stress tests, both on individual portfolios and at a Group level. ANZ‘s stress-testing regime provides senior management with an assessment of the financial impact of identified extreme events on market risk exposures of ANZ. Standard stress tests are applied on a daily basis and measure the potential loss arising from applying extreme market movements to individual and groups of individual price factors. Extraordinary stress tests are applied monthly and measure the potential loss arising as a result of scenarios generated from major financial market events.
Non-traded Market Risk (Balance Sheet Risk)
The principal objectives of balance sheet management are to maintain acceptable levels of interest rate and liquidity risk to mitigate the negative impact of movements in interest rates on the earnings and market value of the Group’s banking book, while ensuring the Group maintains sufficient liquidity to meet its obligations as they fall due.
NOTES TO THE FINANCIAL STATEMENTS 115
NOTES TO THE FINANCIAL STATEMENTS (continued)
19: Financial Risk Management (continued)
Interest rate risk
The objective of balance sheet interest rate risk management is to secure stable and optimal net interest income over both the short (next 12 months) and long-term. Non-traded interest rate risk relates to the potential adverse impact of changes in market interest rates on the Group’s future net interest income. This risk arises from two principal sources: mismatches between the repricing dates of interest bearing assets and liabilities; and the investment of capital and other non-interest bearing liabilities in interest bearing assets. Interest rate risk is reported using various techniques including: VaR and scenario analysis (to a 1% shock).
a) VaR non-traded interest rate risk
The repricing assumptions used to determine the VaR and 1% rate shock have been independently validated. Below are aggregate VaR figures covering non-traded interest rate risk.
| 30 September 2015 | 30 September 2014 | |||||||||||||||||||||||||||||||||
| Consolidated | As at $m |
High for $m |
Low for year $m |
Avg for year $m |
As at $m |
High for $m |
Low for year $m |
Avg for year $m |
||||||||||||||||||||||||||
| Value at risk at 99% confidence |
||||||||||||||||||||||||||||||||||
| Australia |
25.4 | 38.5 | 21.2 | 27.2 | 41.8 | 64.5 | 39.1 | 50.1 | ||||||||||||||||||||||||||
| New Zealand |
9.7 | 11.4 | 8.9 | 10.2 | 8.9 | 11.4 | 8.9 | 10.4 | ||||||||||||||||||||||||||
| Asia Pacific, Europe & America |
14.4 | 14.4 | 7.9 | 10.4 | 9.1 | 10.6 | 8.9 | 9.8 | ||||||||||||||||||||||||||
| Diversification benefit |
(16.8 | ) | n/a | n/a | (14.8 | ) | (13.4 | ) | n/a | n/a | (13.7 | ) | ||||||||||||||||||||||
| 32.7 | 37.4 | 28.6 | 33.0 | 46.4 | 76.3 | 43.3 | 56.6 | |||||||||||||||||||||||||||
| 30 September 2015 | 30 September 2014 | |||||||||||||||||||||||||||||||||
| The Company | As at $m |
High for $m |
Low for year $m |
Avg for year $m |
As at $m |
High for $m |
Low for $m |
Avg for $m |
||||||||||||||||||||||||||
| Value at risk at 99% confidence |
||||||||||||||||||||||||||||||||||
| Australia |
25.4 | 38.5 | 21.2 | 27.2 | 41.8 | 64.5 | 39.1 | 50.1 | ||||||||||||||||||||||||||
| New Zealand |
0.0 | 0.2 | 0.0 | 0.1 | 0.1 | 0.3 | 0.0 | 0.1 | ||||||||||||||||||||||||||
| Asia Pacific, Europe & America |
13.9 | 13.9 | 6.8 | 9.9 | 8.3 | 10.0 | 8.3 | 9.2 | ||||||||||||||||||||||||||
| Diversification benefit |
(11.2 | ) | n/a | n/a | (7.9 | ) | (4.2 | ) | n/a | n/a | (0.9 | ) | ||||||||||||||||||||||
| 28.1 | 39.2 | 21.3 | 29.3 | 46.0 | 71.6 | 42.0 | 58.5 | |||||||||||||||||||||||||||
VaR is calculated separately for the Australia, New Zealand and APEA geographies, as well as for the Group.
To supplement the VaR methodology, ANZ applies a wide range of stress tests, both on individual portfolios and at Group level. ANZ’s stress testing regime provides senior management with an assessment of the financial impact of identified extreme events on market risk exposures of ANZ.
b) Scenario Analysis – a 1% shock on the next 12 months’ net interest income
A 1% overnight parallel positive shift in the yield curve is modelled to determine the potential impact on net interest income over the succeeding 12 months. This is a standard risk measure which assumes the parallel shift is reflected in all wholesale and customer rates.
The figures in the table below indicate the outcome of this risk measure for the current and previous financial years – expressed as a percentage of reported net interest income. The sign indicates the nature of the rate sensitivity with a positive number signifying that a rate increase is positive for net interest income over the next 12 months.
| Consolidated | The Company | |||||||
| 2015 | 2014 | 2015 | 2014 | |||||
| Impact of 1% rate shock |
||||||||
| As at period end |
0.61% | 0.97% | 0.86% | 1.06% | ||||
| Maximum exposure |
1.36% | 1.48% | 1.74% | 1.68% | ||||
| Minimum exposure |
0.45% |
0.74% |
0.86% |
0.68% | ||||
| Average exposure (in absolute terms) |
0.93% |
1.12% |
1.19% |
1.22% | ||||
The extent of mismatching between the repricing characteristics and timing of interest bearing assets and liabilities at any point has implications for future net interest income. On a global basis, the Group quantifies the potential variation in future net interest income as a result of these repricing mismatches.
The repricing gaps themselves are constructed based on contractual repricing information. However, for those assets and liabilities where the contractual term to repricing is not considered to be reflective of the actual interest rate sensitivity (for example, products priced at the Group’s discretion), a profile based on historically observed and/or anticipated rate sensitivity is used. This treatment excludes the effect of basis risk between customer pricing and wholesale market pricing.
116
ANZ ANNUAL REPORT 2015
19: Financial Risk Management (continued)
| NOTES TO THE FINANCIAL STATEMENTS 117 | ||
NOTES TO THE FINANCIAL STATEMENTS (continued)
19: Financial Risk Management (continued)
| 2015 $b |
2014 $b |
|||||||
| Market Values Post Discount1 |
||||||||
| HQLA12 |
115.4 | 81.0 | ||||||
| HQLA2 |
3.2 | 2.7 | ||||||
| Internal Residential Mortgage Backed Securities (Australia) |
43.5 | 43.5 | ||||||
| Internal Residential Mortgage Backed Securities (New Zealand) |
5.5 | 5.1 | ||||||
| Other ALA3 |
16.9 | 17.3 | ||||||
| Total Liquid Assets |
184.5 | 149.6 | ||||||
| Cash flows modelled under stress scenario |
||||||||
| Cash outflows2,4 |
175.2 | 157.1 | ||||||
| Cash inflows4 |
24.4 | 22.4 | ||||||
| Net cash outflows |
150.8 | 134.7 | ||||||
| Liquidity Coverage Ratio (%)5 |
122 | % | 111 | % | ||||
| 1 | Market value post discount as defined in APRA Prudential Standard APS 210 Liquidity. |
| 2 | RBA open-repo arrangement netted down by exchange settlement account cash balance. |
| 3 | Comprises assets qualifying as collateral for the Committed Liquidity Facility (CLF), excluding internal RMBS, up to approved facility limit; and any liquid assets contained in the RBNZ’s Liquidity Policy – Annex: Liquidity Assets – Prudential Supervision Department Document BS13A12. |
| 4 | Derivative cash flows are included on a net basis. |
| 5 | All currency Group LCR. |
118
ANZ ANNUAL REPORT 2015
19: Financial Risk Management (continued)
| NOTES TO THE FINANCIAL STATEMENTS 119 | ||
NOTES TO THE FINANCIAL STATEMENTS (continued)
19: Financial Risk Management (continued)
The following tables show the Group’s funding composition:
| Funding composition | 2015 $m |
2014 $m |
||||||
| Customer deposits and other liabilities1 |
||||||||
| Australia |
169,280 | 160,683 | ||||||
| International & Institutional Banking |
202,495 | 183,126 | ||||||
| New Zealand |
59,703 | 51,360 | ||||||
| Global Wealth |
18,467 | 13,844 | ||||||
| GTSO and Group Centre |
(5,361 | ) | (5,294 | ) | ||||
| Customer deposits |
444,584 | 403,719 | ||||||
| Other Funding liabilities2 |
14,346 | 14,502 | ||||||
| Total customer liabilities (funding) |
458,930 | 418,221 | ||||||
| Wholesale funding3 |
||||||||
| Debt issuances4 |
93,347 | 79,291 | ||||||
| Subordinated debt |
17,009 | 13,607 | ||||||
| Certificates of deposit |
63,446 | 52,754 | ||||||
| Commercial paper |
22,989 | 15,152 | ||||||
| Other wholesale borrowings5, 6 |
44,556 | 42,460 | ||||||
| Total wholesale funding |
241,347 | 203,264 | ||||||
| Shareholders’ equity (excl preference shares) |
57,353 | 48,413 | ||||||
| Total Funding |
757,630 | 669,898 | ||||||
| 2015 $m |
2014 $m |
|||||||
| Funded Assets |
||||||||
| Other short term assets & trade finance assets7 |
78,879 | 74,925 | ||||||
| Liquids6 |
135,496 | 100,951 | ||||||
| Short term funded assets |
214,375 | 175,876 | ||||||
| Lending & fixed assets8 |
543,255 | 494,022 | ||||||
| Total Funded Assets |
757,630 | 669,898 | ||||||
| Funding Liabilities3,4,6 |
||||||||
| Other short term liabilities |
27,863 | 22,676 | ||||||
| Short term funding |
59,850 | 46,466 | ||||||
| Term funding < 12 months |
41,549 | 23,888 | ||||||
| Other customer deposits1,9 |
88,288 | 89,825 | ||||||
| Total short term funding liabilities |
217,550 | 182,855 | ||||||
| Stable customer deposits1,10 |
387,988 | 347,237 | ||||||
| Term funding > 12 months |
87,316 | 84,519 | ||||||
| Shareholders’ equity and hybrid debt |
64,776 | 55,287 | ||||||
| Total Stable Funding |
540,080 | 487,043 | ||||||
| Total Funding |
757,630 | 669,898 | ||||||
| 1 | Includes term deposits, other deposits and an adjustment recognised in Group Centre to eliminate Global Wealth investments in ANZ deposit products. |
| 2 | Includes interest accruals, payables and other liabilities, provisions and net tax provisions, excluding other liabilities in Global Wealth. |
| 3 | Excludes liability for acceptances as they do not provide net funding. |
| 4 | Excludes term debt issued externally by Global Wealth. |
| 5 | Includes borrowings from banks, net derivative balances, special purpose vehicles, other borrowings and Euro Trust securities (preference shares). The Euro Trust Securities were bought back by ANZ for cash at face value and cancelled on 15 December 2014. |
| 6 | RBA open-repo arrangement netted down by the exchange settlement account cash balance. |
| 7 | Includes short-dated assets such as trading securities, available-for-sale securities, trade dated assets and trade finance loans. |
| 8 | Excludes trade finance loans. |
| 9 | Total customer liabilities (funding) plus Central Bank deposits less Stable customer deposits. |
| 10 | Stable customer deposits represent operational type deposits or those sourced from retail / business / corporate customers and the stable component of Other funding liabilities. |
120
ANZ ANNUAL REPORT 2015
19: Financial Risk Management (continued)
Contractual maturity analysis of the Group’s liabilities
The table below analyses the Group and Company’s contractual liabilities, within relevant maturity groupings based on the earliest date on which the Group or Company may be required to pay. The amounts represent principal and interest cash flows and hence may differ compared to the amounts reported on the balance sheet.
It should be noted that this is not how the Group manages its liquidity risk. The management of this risk is detailed above.
Contractual maturity analysis of financial liabilities at 30 September:
| Consolidated at 30 September 2015 | Less than 3 months1 |
3 to 12 months $m |
1 to 5 years |
After 5 years |
No maturity $m |
Total $m |
||||||||||||||||||
| Collateral received |
7,829 | – | – | – | – | 7,829 | ||||||||||||||||||
| Settlement balances owed by ANZ |
11,250 | – | – | – | – | 11,250 | ||||||||||||||||||
| Deposits and other borrowings |
||||||||||||||||||||||||
| Deposits from banks |
35,422 | 3,591 | 36 | – | – | 39,049 | ||||||||||||||||||
| Certificates of deposit |
31,333 | 16,515 | 16,551 | 95 | – | 64,494 | ||||||||||||||||||
| Term deposits |
142,342 | 47,843 | 7,105 | 48 | – | 197,338 | ||||||||||||||||||
| Other deposits interest bearing |
227,685 | 404 | 1,246 | – | – | 229,335 | ||||||||||||||||||
| Deposits not bearing interest |
19,014 | – | – | – | – | 19,014 | ||||||||||||||||||
| Commercial paper |
13,130 | 9,868 | – | – | – | 22,998 | ||||||||||||||||||
| Borrowing corporations’ debt |
571 | 782 | 300 | – | – | 1,653 | ||||||||||||||||||
| Other borrowing |
790 | – | – | – | – | 790 | ||||||||||||||||||
| Liability for acceptances |
1,371 | – | – | – | – | 1,371 | ||||||||||||||||||
| Debt issuances3 |
8,119 | 22,796 | 57,936 | 10,653 | – | 99,504 | ||||||||||||||||||
| Subordinated debt3,4 |
70 | 296 | 8,456 | 9,064 | 1,188 | 19,074 | ||||||||||||||||||
| Policyholder liabilities |
34,965 | 3 | 40 | 21 | 372 | 35,401 | ||||||||||||||||||
| External unit holder liabilities (life insurance funds) |
3,291 | – | – | – | – | 3,291 | ||||||||||||||||||
| Derivative liabilities (trading)5 |
68,309 | – | – | – | – | 68,309 | ||||||||||||||||||
| Derivative assets and liabilities (balance sheet management) |
||||||||||||||||||||||||
| – funding |
||||||||||||||||||||||||
| Receive leg |
(24,585 | ) | (35,207 | ) | (95,440 | ) | (19,556 | ) | – | (174,788 | ) | |||||||||||||
| Pay leg |
22,439 | 31,710 | 85,900 | 18,179 | – | 158,228 | ||||||||||||||||||
| – other balance sheet management |
||||||||||||||||||||||||
| Receive leg |
(8,445 | ) | (8,456 | ) | (11,667 | ) | (4,654 | ) | – | (33,222 | ) | |||||||||||||
| Pay leg |
8,512 | 8,882 | 12,944 | 5,956 | – | 36,294 | ||||||||||||||||||
| Consolidated at 30 September 2014 | Less than 3 months1 |
3 to 12 months $m |
1 to 5 years |
After 5 years |
No maturity $m |
Total $m |
||||||||||||||||||
| Collateral received |
5,599 | – | – | – | – | 5,599 | ||||||||||||||||||
| Settlement balances owed by ANZ |
10,114 | – | – | – | – | 10,114 | ||||||||||||||||||
| Deposits and other borrowings |
||||||||||||||||||||||||
| Deposits from banks |
35,483 | 2,715 | 32 | – | – | 38,230 | ||||||||||||||||||
| Certificates of deposit |
29,775 | 9,478 | 14,972 | 100 | – | 54,325 | ||||||||||||||||||
| Term deposits |
139,549 | 47,877 | 6,919 | 130 | – | 194,475 | ||||||||||||||||||
| Other deposits interest bearing |
193,220 | – | – | – | – | 193,220 | ||||||||||||||||||
| Deposits not bearing interest |
16,404 | – | – | – | – | 16,404 | ||||||||||||||||||
| Commercial paper |
5,803 | 9,351 | – | – | – | 15,154 | ||||||||||||||||||
| Borrowing corporations’ debt |
521 | 572 | 306 | – | – | 1,399 | ||||||||||||||||||
| Other borrowing |
260 | – | – | – | – | 260 | ||||||||||||||||||
| Liability for acceptances |
1,151 | – | – | – | – | 1,151 | ||||||||||||||||||
| Debt issuances3 |
4,585 | 12,268 | 55,049 | 12,989 | – | 84,891 | ||||||||||||||||||
| Subordinated debt3,4 |
45 | 228 | 6,868 | 7,129 | 1,087 | 15,357 | ||||||||||||||||||
| Policyholder liabilities |
34,038 | – | – | – | 516 | 34,554 | ||||||||||||||||||
| External unit holder liabilities (life insurance funds) |
3,181 | – | – | – | – | 3,181 | ||||||||||||||||||
| Derivative liabilities (trading)5 |
46,831 | – | – | – | – | 46,831 | ||||||||||||||||||
| Derivative assets and liabilities (balance sheet management) |
||||||||||||||||||||||||
| – funding |
||||||||||||||||||||||||
| Receive leg |
(21,655 | ) | (23,313 | ) | (81,464 | ) | (26,370 | ) | – | (152,802 | ) | |||||||||||||
| Pay leg |
21,433 | 23,696 | 80,951 | 24,976 | – | 151,056 | ||||||||||||||||||
| – other balance sheet management |
||||||||||||||||||||||||
| Receive leg |
(10,663 | ) | (10,793 | ) | (16,258 | ) | (7,041 | ) | – | (44,755 | ) | |||||||||||||
| Pay leg |
10,691 | 10,994 | 16,337 | 7,270 | – | 45,292 | ||||||||||||||||||
| 1 | Includes at call instruments. |
| 2 | Includes perpetual investments brought in at face value only. |
| 3 | Any callable wholesale debt instruments have been included at their next call date. |
| 4 | Includes instruments that may be settled in cash or in equity, at the option of the Company. |
| 5 | The full mark-to-market of derivative liabilities held for trading purposes has been included in the ‘less than 3 months’ category. |
| NOTES TO THE FINANCIAL STATEMENTS 121 | ||
NOTES TO THE FINANCIAL STATEMENTS (continued)
19: Financial Risk Management (continued)
| The Company at 30 September 2015 | Less than 3 months1 $m |
3 to 12 months $m |
1 to 5 years |
After 5 years |
No maturity specified2 $m |
Total $m |
||||||||||||||||||
| Collateral received |
6,886 | – | – | – | – | 6,886 | ||||||||||||||||||
| Settlement balances owed by ANZ |
9,901 | – | – | – | – | 9,901 | ||||||||||||||||||
| Deposits and other borrowings |
||||||||||||||||||||||||
| Deposits from banks |
34,981 | 3,506 | 23 | – | – | 38,510 | ||||||||||||||||||
| Certificates of deposit |
30,967 | 16,395 | 16,576 | 95 | – | 64,033 | ||||||||||||||||||
| Term deposits |
122,123 | 29,927 | 3,640 | 49 | – | 155,739 | ||||||||||||||||||
| Other deposits interest bearing |
186,387 | 311 | 644 | – | – | 187,342 | ||||||||||||||||||
| Deposits not bearing interest |
9,971 | – | – | – | – | 9,971 | ||||||||||||||||||
| Commercial paper |
10,419 | 8,063 | – | – | – | 18,482 | ||||||||||||||||||
| Other borrowing |
344 | – | – | – | – | 344 | ||||||||||||||||||
| Liability for acceptances |
649 | – | – | – | – | 649 | ||||||||||||||||||
| Debt issuances3 |
5,457 | 19,871 | 45,619 | 9,385 | – | 80,332 | ||||||||||||||||||
| Subordinated debt3,4 |
42 | 210 | 7,604 | 8,946 | 429 | 17,231 | ||||||||||||||||||
| Derivative liabilities (trading)5 |
61,853 | – | – | – | – | 61,853 | ||||||||||||||||||
| Derivative assets and liabilities (balance sheet management) |
||||||||||||||||||||||||
| – funding |
||||||||||||||||||||||||
| Receive leg |
(16,618 | ) | (25,127 | ) | (66,311 | ) | (15,707 | ) | – | (123,763 | ) | |||||||||||||
| Pay leg |
14,935 | 22,118 | 58,353 | 14,527 | – | 109,933 | ||||||||||||||||||
| – other balance sheet management |
||||||||||||||||||||||||
| Receive leg |
(6,820 | ) | (4,962 | ) | (6,673 | ) | (3,876 | ) | – | (22,331 | ) | |||||||||||||
| Pay leg |
6,885 | 5,204 | 7,611 | 5,163 | – | 24,863 | ||||||||||||||||||
| The Company at 30 September 2014 | Less than 3 months1 $m |
3 to 12 months $m |
1 to 5 years |
After 5 years |
No maturity specified2 $m |
Total $m |
||||||||||||||||||
| Collateral received |
4,886 | – | – | – | – | 4,886 | ||||||||||||||||||
| Settlement balances owed by ANZ |
8,189 | – | – | – | – | 8,189 | ||||||||||||||||||
| Deposits and other borrowings |
||||||||||||||||||||||||
| Deposits from banks |
34,637 | 2,715 | 21 | – | – | 37,373 | ||||||||||||||||||
| Certificates of deposit |
28,801 | 9,331 | 14,972 | 100 | – | 53,204 | ||||||||||||||||||
| Term deposits |
120,289 | 32,237 | 3,781 | 71 | – | 156,378 | ||||||||||||||||||
| Other deposits interest bearing |
160,889 | – | – | – | – | 160,889 | ||||||||||||||||||
| Deposits not bearing interest |
8,688 | – | – | – | – | 8,688 | ||||||||||||||||||
| Commercial paper |
3,669 | 6,086 | – | – | – | 9,755 | ||||||||||||||||||
| Other borrowing |
128 | – | – | – | – | 128 | ||||||||||||||||||
| Liability for acceptances |
717 | – | – | – | – | 717 | ||||||||||||||||||
| Debt issuances3 |
2,903 | 9,671 | 43,935 | 12,447 | – | 68,956 | ||||||||||||||||||
| Subordinated debt3,4 |
45 | 228 | 6,868 | 7,139 | 343 | 14,623 | ||||||||||||||||||
| Derivative liabilities (trading)5 |
45,598 | – | – | – | – | 45,598 | ||||||||||||||||||
| Derivative assets and liabilities (balance sheet management) |
||||||||||||||||||||||||
| – funding |
||||||||||||||||||||||||
| Receive leg |
(14,664 | ) | (15,732 | ) | (65,771 | ) | (25,616 | ) | – | (121,783 | ) | |||||||||||||
| Pay leg |
14,883 | 15,585 | 64,875 | 24,219 | – | 119,562 | ||||||||||||||||||
| – other balance sheet management |
||||||||||||||||||||||||
| Receive leg |
(9,182 | ) | (8,001 | ) | (10,517 | ) | (6,274 | ) | – | (33,974 | ) | |||||||||||||
| Pay leg |
9,227 | 8,174 | 10,573 | 6,503 | – | 34,477 | ||||||||||||||||||
| 1 | Includes at call instruments. |
| 2 | Includes perpetual investments brought in at face value only. |
| 3 | Any callable wholesale debt instruments have been included at their next call date. |
| 4 | Includes instruments that may be settled in cash or in equity, at the option of the Company. |
| 5 | The full mark-to-market of derivative liabilities held for trading purposes has been included in the ‘less than 3 months’ category. |
Credit related contingencies
Undrawn facilities and issued guarantees comprise the nominal principal amounts of commitments, contingencies and other undrawn facilities and represents the maximum liquidity at risk position should all facilities extended be drawn.
The majority of undrawn facilities are subject to customers maintaining specific credit and other requirements or conditions. Many of these facilities are expected to be partially used, whereas others may never be required to be drawn upon. As such, the total of the nominal principal amounts is not necessarily representative of future liquidity risks or future cash requirements.
122
ANZ ANNUAL REPORT 2015
19: Financial Risk Management (continued)
The tables below analyse the Group’s and Company’s undrawn facilities and issued guarantees into relevant maturity groupings based on the earliest date on which ANZ may be required to pay.
| Consolidated | The Company | |||||||||||||||||||||||||
| 30 September 2015 | Less than $m |
More than $m |
Total $m |
Less than $m |
More than $m |
Total $m |
||||||||||||||||||||
| Undrawn facilities |
230,794 | – | 230,794 | 180,847 | – | 180,847 | ||||||||||||||||||||
| Issued guarantees |
40,335 | – | 40,335 | 34,693 | – | 34,693 | ||||||||||||||||||||
| Consolidated | The Company | |||||||||||||||||||||||||
| 30 September 2014 | Less than $m |
More than $m |
Total $m |
Less than $m |
More than $m |
Total $m |
||||||||||||||||||||
| Undrawn facilities |
193,984 | – | 193,984 | 153,985 | – | 153,985 | ||||||||||||||||||||
| Issued guarantees |
40,075 | – | 40,075 | 34,916 | – | 34,916 | ||||||||||||||||||||
| NOTES TO THE FINANCIAL STATEMENTS 123 | ||
NOTES TO THE FINANCIAL STATEMENTS (continued)
20: Fair value of financial assets and financial liabilities
A significant number of financial instruments are carried on the balance sheet at fair value. The following disclosures set out the classification of financial assets and financial liabilities and in respect of the fair value either recognised or disclosed, the various levels within which fair value measurements are categorised, and the valuation methodologies and techniques used. The fair value disclosure does not cover those instruments that are not considered financial instruments from an accounting perspective, such as intangible assets.
Fair value is the price that would be received to sell an asset or paid to transfer a liability in an orderly transaction between market participants at the measurement date. The determination of the fair value of financial instruments is fundamental to the financial reporting framework as all financial instruments are recognised initially at fair value and, with the exception of those financial instruments carried at amortised cost, are remeasured at fair value in subsequent periods.
On initial recognition, the best evidence of a financial instrument’s fair value is the transaction price. However, in certain circumstances the initial fair value may be based on other observable current market transactions in the same instrument, without modification or repackaging, or on a valuation technique whose variables include only data from observable markets. For those financial instruments where the fair value at initial recognition would be based on unobservable inputs, the difference between the transaction price and the amount which would have been determined using a valuation technique (being the day one gain or loss) is not immediately recognised in the income statement.
Subsequent to initial recognition, the fair value of financial instruments measured at fair value is based on quoted market prices, where available. In cases where quoted market prices are not available, fair value is determined using market accepted valuation techniques that employ observable data. In limited cases where observable market data is not available, the input is estimated based on other observable market data, historical trends and other factors that may be relevant.
In the tables below, financial instruments have been allocated based on their accounting classification. The significant accounting policies in note 1 describe how the categories of financial assets and financial liabilities are measured and how income and expenses, including fair value gains and losses, are recognised.
(i) CLASSIFICATION OF FINANCIAL ASSETS AND FINANCIAL LIABILITIES
The following tables set out the classification of financial asset and liability categories according to measurement bases together with their carrying amounts as reported on the balance sheet.
| At amortised cost |
At fair value through profit or loss | Hedging | Available-for- sale assets |
Total | ||||||||||||||||||||||||
| Consolidated 30 September 2015 | $m | Designated on initial recognition $m |
Held for trading $m |
Sub-total $m |
$m | $m | $m | |||||||||||||||||||||
| Financial assets |
||||||||||||||||||||||||||||
| Cash |
53,903 | – | – | – | – | – | 53,903 | |||||||||||||||||||||
| Settlement balances owed to ANZ |
18,596 | – | – | – | – | – | 18,596 | |||||||||||||||||||||
| Collateral paid |
9,967 | – | – | – | – | – | 9,967 | |||||||||||||||||||||
| Trading securities |
– | – | 49,000 | 49,000 | – | – | 49,000 | |||||||||||||||||||||
| Derivative financial instruments1 |
– | – | 81,925 | 81,925 | 3,700 | – | 85,625 | |||||||||||||||||||||
| Available-for-sale assets |
– | – | – | – | – | 43,667 | 43,667 | |||||||||||||||||||||
| Net loans and advances2,3 |
569,539 | 683 | 16 | 699 | – | – | 570,238 | |||||||||||||||||||||
| Regulatory deposits |
1,773 | – | – | – | – | – | 1,773 | |||||||||||||||||||||
| Investments backing policy liabilities |
– | 34,820 | – | 34,820 | – | – | 34,820 | |||||||||||||||||||||
| Other financial assets |
5,137 | – | – | – | – | – | 5,137 | |||||||||||||||||||||
| 658,915 | 35,503 | 130,941 | 166,444 | 3,700 | 43,667 | 872,726 | ||||||||||||||||||||||
| Financial liabilities |
||||||||||||||||||||||||||||
| Settlement balances owed by ANZ |
11,250 | – | – | – | – | n/a | 11,250 | |||||||||||||||||||||
| Collateral received |
7,829 | – | – | – | – | n/a | 7,829 | |||||||||||||||||||||
| Deposits and other borrowings |
566,218 | 4,576 | – | 4,576 | – | n/a | 570,794 | |||||||||||||||||||||
| Derivative financial instruments1 |
– | – | 78,497 | 78,497 | 2,773 | n/a | 81,270 | |||||||||||||||||||||
| Policy liabilities4 |
372 | 35,029 | – | 35,029 | – | n/a | 35,401 | |||||||||||||||||||||
| External unit holder liabilities (life insurance funds) |
– | 3,291 | – | 3,291 | – | n/a | 3,291 | |||||||||||||||||||||
| Payables and other liabilities |
7,798 | – | 2,568 | 2,568 | – | n/a | 10,366 | |||||||||||||||||||||
| Debt issuances |
90,582 | 3,165 | – | 3,165 | – | n/a | 93,747 | |||||||||||||||||||||
| Subordinated debt |
17,009 | – | – | – | – | n/a | 17,009 | |||||||||||||||||||||
| 701,058 | 46,061 | 81,065 | 127,126 | 2,773 | n/a | 830,957 | ||||||||||||||||||||||
| 1 | Derivative financial instruments classified as ‘held for trading’ include derivatives entered into as economic hedges which are not designated as accounting hedges. |
| 2 | Fair value hedging is applied to financial assets within net loans and advances. The resulting fair value adjustments mean that the carrying value differs from the amortised cost. |
| 3 | Net loans and advances includes Easanda dealer finance assets classified as held for sale (refer note 14). |
| 4 | Includes life insurance contract liabilities of $372 million (2014: $516 million) measured in accordance with AASB 1038 and life investment contract liabilities of $35,029 million (2014: $34,038 million) which have been designated at fair value through profit or loss under AASB 139. None of the fair value is attributable to changes in the credit risk of the life investment contract liabilities. |
124
ANZ ANNUAL REPORT 2015
20: Fair value of financial assets and financial liabilities (continued)
| At amortised cost |
At fair value through profit or loss | Hedging | Available-for- sale assets |
Total | ||||||||||||||||||||||||
| Consolidated 30 September 2014 | $m | Designated on initial recognition $m |
Held for trading $m |
Sub-total $m |
$m | $m | $m | |||||||||||||||||||||
| Financial assets |
||||||||||||||||||||||||||||
| Cash |
32,559 | – | – | – | – | – | 32,559 | |||||||||||||||||||||
| Settlement balances owed to ANZ |
20,241 | – | – | – | – | – | 20,241 | |||||||||||||||||||||
| Collateral paid |
5,459 | – | – | – | – | – | 5,459 | |||||||||||||||||||||
| Trading securities |
– | – | 49,692 | 49,692 | – | – | 49,692 | |||||||||||||||||||||
| Derivative financial instruments1 |
– | – | 53,730 | 53,730 | 2,639 | – | 56,369 | |||||||||||||||||||||
| Available-for-sale assets |
– | – | – | – | – | 30,917 | 30,917 | |||||||||||||||||||||
| Net loans and advances2 |
521,384 | 368 | – | 368 | – | – | 521,752 | |||||||||||||||||||||
| Regulatory deposits |
1,565 | – | – | – | – | – | 1,565 | |||||||||||||||||||||
| Investments backing policy liabilities |
– | 33,579 | – | 33,579 | – | – | 33,579 | |||||||||||||||||||||
| Other assets |
3,473 | – | – | – | – | – | 3,473 | |||||||||||||||||||||
| 584,681 | 33,947 | 103,422 | 137,369 | 2,639 | 30,917 | 755,606 | ||||||||||||||||||||||
| Financial liabilities |
||||||||||||||||||||||||||||
| Settlement balances owed by ANZ |
10,114 | – | – | – | – | n/a | 10,114 | |||||||||||||||||||||
| Collateral received |
5,599 | – | – | – | – | n/a | 5,599 | |||||||||||||||||||||
| Deposits and other borrowings |
504,585 | 5,494 | – | 5,494 | – | n/a | 510,079 | |||||||||||||||||||||
| Derivative financial instruments1 |
– | – | 51,475 | 51,475 | 1,450 | n/a | 52,925 | |||||||||||||||||||||
| Policy liabilities3 |
516 | 34,038 | – | 34,038 | – | n/a | 34,554 | |||||||||||||||||||||
| External unit holder liabilities (life insurance funds) |
– | 3,181 | – | 3,181 | – | n/a | 3,181 | |||||||||||||||||||||
| Payables and other liabilities |
7,075 | – | 3,870 | 3,870 | – | n/a | 10,945 | |||||||||||||||||||||
| Debt issuances |
76,655 | 3,441 | – | 3,441 | – | n/a | 80,096 | |||||||||||||||||||||
| Subordinated debt |
13,607 | – | – | – | – | n/a | 13,607 | |||||||||||||||||||||
| 618,151 | 46,154 | 55,345 | 101,499 | 1,450 | n/a | 721,100 | ||||||||||||||||||||||
| 1 | Derivative financial instruments classified as ‘held for trading’ include derivatives entered into as economic hedges which are not designated as accounting hedges. |
| 2 | Fair value hedging is applied to financial assets within net loans and advances. The resulting fair value adjustments mean that the carrying value differs from the amortised cost. |
| 3 | Includes life insurance contract liabilities of $372 million (2014: $516 million) measured in accordance with AASB 1038 and life investment contract liabilities of $35,029 million (2014: $34,038 million) which have been designated at fair value through profit or loss under AASB 139. None of the fair value is attributable to changes in the credit risk of the life investment contract liabilities. |
| At amortised cost |
At fair value through profit or loss | Hedging | Available-for- sale assets |
Total | ||||||||||||||||||||||||
| The Company 30 September 2015 | $m | Designated on initial recognition $m |
Held for trading $m |
Sub-total $m |
$m | $m | $m | |||||||||||||||||||||
| Financial assets |
||||||||||||||||||||||||||||
| Cash |
51,217 | – | – | – | – | – | 51,217 | |||||||||||||||||||||
| Settlement balances owed to ANZ |
16,601 | – | – | – | – | – | 16,601 | |||||||||||||||||||||
| Collateral paid |
8,234 | – | – | – | – | – | 8,234 | |||||||||||||||||||||
| Trading securities |
– | – | 37,373 | 37,373 | – | – | 37,373 | |||||||||||||||||||||
| Derivative financial instruments1 |
– | – | 72,542 | 72,542 | 3,152 | – | 75,694 | |||||||||||||||||||||
| Available-for-sale assets |
– | – | – | – | – | 37,612 | 37,612 | |||||||||||||||||||||
| Net loans and advances2,3 |
448,288 | 144 | 16 | 160 | – | – | 448,448 | |||||||||||||||||||||
| Regulatory deposits |
557 | – | – | – | – | – | 557 | |||||||||||||||||||||
| Due from controlled entities |
109,920 | – | – | – | – | – | 109,920 | |||||||||||||||||||||
| Other financial assets |
2,489 | – | – | – | – | – | 2,489 | |||||||||||||||||||||
| 637,306 | 144 | 109,931 | 110,075 | 3,152 | 37,612 | 788,145 | ||||||||||||||||||||||
| Financial liabilities |
||||||||||||||||||||||||||||
| Settlement balances owed by ANZ |
9,901 | – | – | – | – | n/a | 9,901 | |||||||||||||||||||||
| Collateral received |
6,886 | – | – | – | – | n/a | 6,886 | |||||||||||||||||||||
| Deposits and other borrowings |
471,966 | 65 | – | 65 | – | n/a | 472,031 | |||||||||||||||||||||
| Derivative financial instruments1 |
– | – | 69,648 | 69,648 | 2,196 | n/a | 71,844 | |||||||||||||||||||||
| Due to controlled entities |
105,079 | – | – | – | – | n/a | 105,079 | |||||||||||||||||||||
| Payables and other liabilities |
4,316 | – | 1,978 | 1,978 | – | n/a | 6,294 | |||||||||||||||||||||
| Debt issuances |
72,414 | 3,165 | – | 3,165 | – | n/a | 75,579 | |||||||||||||||||||||
| Subordinated debt |
15,812 | – | – | – | – | n/a | 15,812 | |||||||||||||||||||||
| 686,374 | 3,230 | 71,626 | 74,856 | 2,196 | n/a | 763,426 | ||||||||||||||||||||||
| 1 | Derivative financial instruments classified as ‘held for trading’ include derivatives entered into as economic hedges which are not designated as accounting hedges. |
| 2 | Fair value hedging is applied to financial assets within net loans and advances. The resulting fair value adjustments mean that the carrying value differs from the amortised cost. |
| 3 | Net loans and advances includes Esanda dealer finance assets classified as held for sale (refer note 14). |
| NOTES TO THE FINANCIAL STATEMENTS 125 | ||
NOTES TO THE FINANCIAL STATEMENTS (continued)
20: Fair value of financial assets and financial liabilities (continued)
| At amortised cost |
At fair value through profit or loss | Hedging | Available-for- sale assets |
Total | ||||||||||||||||||||||||
| The Company 30 September 2014 | $m | Designated on initial recognition $m |
Held for trading $m |
Sub-total $m |
$m | $m | $m | |||||||||||||||||||||
| Financial assets |
||||||||||||||||||||||||||||
| Cash |
30,655 | – | – | – | – | – | 30,655 | |||||||||||||||||||||
| Settlement balances owed to ANZ |
18,150 | – | – | – | – | – | 18,150 | |||||||||||||||||||||
| Collateral paid |
4,873 | – | – | – | – | – | 4,873 | |||||||||||||||||||||
| Trading securities |
– | – | 38,049 | 38,049 | – | – | 38,049 | |||||||||||||||||||||
| Derivative financial instruments1 |
– | – | 50,549 | 50,549 | 2,333 | – | 52,882 | |||||||||||||||||||||
| Available-for-sale assets |
– | – | – | – | – | 26,151 | 26,151 | |||||||||||||||||||||
| Net loans and advances2 |
414,989 | 77 | – | 77 | – | – | 415,066 | |||||||||||||||||||||
| Regulatory deposits |
434 | – | – | – | – | – | 434 | |||||||||||||||||||||
| Due from controlled entities |
99,194 | – | – | – | – | – | 99,194 | |||||||||||||||||||||
| Other financial assets |
1,758 | – | – | – | – | – | 1,758 | |||||||||||||||||||||
| 570,053 | 77 | 88,598 | 88,675 | 2,333 | 26,151 | 687,212 | ||||||||||||||||||||||
| Financial liabilities |
||||||||||||||||||||||||||||
| Settlement balances owed by ANZ |
8,189 | – | – | – | – | n/a | 8,189 | |||||||||||||||||||||
| Collateral received |
4,886 | – | – | – | – | n/a | 4,886 | |||||||||||||||||||||
| Deposits and other borrowings |
423,076 | 96 | – | 96 | – | n/a | 423,172 | |||||||||||||||||||||
| Derivative financial instruments1 |
– | – | 49,201 | 49,201 | 1,273 | n/a | 50,474 | |||||||||||||||||||||
| Due to controlled entities |
93,796 | – | – | – | – | n/a | 93,796 | |||||||||||||||||||||
| Payables and other liabilities |
4,111 | – | 3,556 | 3,556 | – | n/a | 7,667 | |||||||||||||||||||||
| Debt issuances |
61,531 | 2,630 | – | 2,630 | – | n/a | 64,161 | |||||||||||||||||||||
| Subordinated debt |
12,870 | – | – | – | – | n/a | 12,870 | |||||||||||||||||||||
| 608,459 | 2,726 | 52,757 | 55,483 | 1,273 | n/a | 665,215 | ||||||||||||||||||||||
| 1 | Derivative financial instruments classified as ‘held for trading’ include derivatives entered into as economic hedges which are not designated as accounting hedges. |
| 2 | Fair value hedging is applied to financial assets within net loans and advances. The resulting fair value adjustments mean that the carrying value differs from the amortised cost. |
(ii) MEASUREMENT OF FAIR VALUE
(a) Valuation methodologies
ANZ has an established control framework that ensures fair value is either determined or validated by a function independent of the party that undertakes the transaction. The control framework ensures that all models are calibrated periodically to test that outputs reflect prices from observable current market transactions in the same instrument or other available observable market data.
Where quoted market prices are used, prices are independently verified from other sources. For fair values determined using a valuation model, the control framework may include, as applicable, independent development or validation of valuation models, any inputs to those models, any adjustments required outside of the valuation model and, where possible, independent validation of model outputs. In this way, continued appropriateness of the valuations is ensured.
In instances where the Group holds offsetting risk positions, the Group uses the portfolio exemption in AASB 13 to measure the fair value of such groups of financial assets and financial liabilities on the basis of the price that would be received to sell a net long position (that is, an asset) for a particular risk exposure or to transfer a net short position (that is, a liability) for a particular risk exposure.
The Group categorises its fair value measurements on the basis of inputs used in measuring fair value using the fair value hierarchy below:
| } Level 1 | – | Financial instruments that have been valued by reference to unadjusted quoted prices in active markets for identical financial instruments. This category includes financial instruments valued using quoted yields where available for specific debt securities. | ||
| } Level 2 | – | Financial instruments that have been valued through valuation techniques incorporating inputs other than quoted prices within Level 1 that are observable for a similar financial asset or liability, either directly or indirectly. | ||
| } Level 3 | – | Financial instruments that have been valued using valuation techniques which incorporate significant inputs that are not based on observable market data (unobservable inputs). | ||
126
ANZ ANNUAL REPORT 2015
20: Fair value of financial assets and financial liabilities (continued)
(b) Valuation techniques and inputs used
In the event that there is no quoted market price for the instrument, fair value is based on valuation techniques. The valuation models incorporate the impact of bid/ask spreads, counterparty credit spreads, funding costs and other factors that would influence the fair value determined by market participants.
The majority of valuation techniques employ only observable market data. However, for certain financial instruments the valuation technique may employ some data (valuation inputs or components) which is not readily observable in the current market. In these cases valuation inputs (or components of the overall value) are derived and extrapolated from other relevant market data and tested against historic transactions and observed market trends. To the extent that valuation is based on models or inputs that are not observable in the market, the determination of fair value can be more subjective, dependent on the significance of the unobservable input to the overall valuation.
The following valuation techniques have been applied to determine the fair values of financial instruments where there is no quoted price for the instrument:
| } | For instruments classified as Trading security assets and Securities short sold, Derivative financial assets and liabilities, Available-for-sale financial assets, and Investments backing policy liabilities, fair value measurements are derived by using modelled valuations techniques (including discounted cash flow models) that incorporate market prices/yields for securities with similar credit risk, maturity and yield characteristics; and/or current market yields for similar instruments. |
| } | For Net loans and advances, Deposits and other borrowings and Debt issuances, discounted cash flow techniques are used where contractual future cash flows of the instrument are discounted using discount rates incorporating wholesale market rates or market borrowing rates of debt with similar maturities or a yield curve appropriate for the remaining term to maturity. |
| } | The fair value of external unit holder liabilities (life insurance funds) represents the external unit holder’s share of the net assets of the consolidated investment funds, which are carried at fair value. The fair value of policy liabilities being liabilities of the insurance business is directly linked to the performance and value of the assets backing the liabilities. These liabilities are carried at fair value using observable inputs. |
Further details of valuation techniques and significant unobservable inputs used in measuring fair values are described in (iii)(a) below.
There have been no substantial changes in the valuation techniques applied to different classes of financial instruments during the year.
(iii) FINANCIAL ASSETS AND FINANCIAL LIABILITIES THAT ARE MEASURED AT FAIR VALUE IN THE BALANCE SHEET
The table below provides an analysis of financial instruments carried at fair value at reporting date categorised according to the lowest level input into a valuation model or a valuation component that is significant to the reported fair value. The significance of the input is assessed against the reported fair value of the financial instrument and considers various factors specific to the financial instrument. The fair value has been allocated in full to the category in the fair value hierarchy which most appropriately reflects the determination of the fair value.
| Fair value measurements | ||||||||||||||||||||||||||||||||
| Quoted market price | Using observable inputs |
|
With significant non–observable inputs |
|
||||||||||||||||||||||||||||
| (Level 1) | (Level 2) | (Level 3) | Total | |||||||||||||||||||||||||||||
| Consolidated | 2015 $m |
2014 $m |
2015 $m |
2014 $m |
2015 $m |
2014 $m |
2015 $m |
2014 $m |
||||||||||||||||||||||||
| Financial assets |
||||||||||||||||||||||||||||||||
| Trading securities1 |
45,227 | 45,857 | 3,769 | 3,835 | 4 | – | 49,000 | 49,692 | ||||||||||||||||||||||||
| Derivative financial instruments |
388 | 472 | 85,155 | 55,791 | 82 | 106 | 85,625 | 56,369 | ||||||||||||||||||||||||
| Available-for-sale assets1 |
37,086 | 25,147 | 6,347 | 5,730 | 234 | 40 | 43,667 | 30,917 | ||||||||||||||||||||||||
| Net loans and advances (designated at fair value) |
– | – | 683 | 368 | 16 | – | 699 | 368 | ||||||||||||||||||||||||
| Investments backing policy liabilities1 |
17,983 | 18,850 | 16,298 | 14,184 | 539 | 545 | 34,820 | 33,579 | ||||||||||||||||||||||||
| 100,684 | 90,326 | 112,252 | 79,908 | 875 | 691 | 213,811 | 170,925 | |||||||||||||||||||||||||
| Financial liabilities |
||||||||||||||||||||||||||||||||
| Deposits and other borrowings |
||||||||||||||||||||||||||||||||
| (designated at fair value) |
– | – | 4,576 | 5,494 | – | – | 4,576 | 5,494 | ||||||||||||||||||||||||
| Derivative financial instruments |
782 | 376 | 80,387 | 52,444 | 101 | 105 | 81,270 | 52,925 | ||||||||||||||||||||||||
| Policy liabilities2 |
– | – | 35,029 | 34,038 | – | – | 35,029 | 34,038 | ||||||||||||||||||||||||
| External unit holder liabilities |
||||||||||||||||||||||||||||||||
| (life insurance funds) |
– | – | 3,291 | 3,181 | – | – | 3,291 | 3,181 | ||||||||||||||||||||||||
| Payables and other liabilities3 |
2,443 | 3,851 | 125 | 19 | – | – | 2,568 | 3,870 | ||||||||||||||||||||||||
| Debt issuances (designated at fair value) |
– | 3,165 | 3,441 | – | – | 3,165 | 3,441 | |||||||||||||||||||||||||
| Total |
3,225 | 4,227 | 126,573 | 98,617 | 101 | 105 | 129,899 | 102,949 | ||||||||||||||||||||||||
| 1 | During the period there were transfers from Level 1 to Level 2 of $190 million (2014: $357 million) for the Group following a reassessment of available pricing information causing the classification to be assessed as level 2. During the period there were also transfers from Level 2 to Level 1 of $114 million (2014:$33 million) for the Group following increased trading activity to support the quoted prices. Transfers into and out of Level 1 and Level 2 are deemed to have occurred as of the beginning of the reporting period in which the transfer occurred. |
| 2 | Policy liabilities relate to life investment contract liabilities only as these are designated at fair value through profit or loss. |
| 3 | Represents securities short sold. |
| NOTES TO THE FINANCIAL STATEMENTS 127 | ||
NOTES TO THE FINANCIAL STATEMENTS (continued)
20: Fair value of financial assets and financial liabilities (continued)
| Fair value measurements | ||||||||||||||||||||||||||||||||
| Quoted market price | Using observable inputs | With significant non–observable inputs |
||||||||||||||||||||||||||||||
| (Level 1)
|
(Level 2)
|
(Level 3)
|
Total
|
|||||||||||||||||||||||||||||
| The Company | 2015 $m |
2014 $m |
2015 $m |
2014 $m |
2015 $m |
2014 $m |
2015 $m |
2014 $m |
||||||||||||||||||||||||
| Financial assets |
||||||||||||||||||||||||||||||||
| Trading securities |
33,912 | 34,356 | 3,456 | 3,693 | 4 | – | 37,372 | 38,049 | ||||||||||||||||||||||||
| Derivative financial instruments |
378 | 470 | 75,242 | 52,316 | 73 | 96 | 75,693 | 52,882 | ||||||||||||||||||||||||
| Available-for-sale assets1 |
33,452 | 22,265 | 4,110 | 3,864 | 50 | 22 | 37,612 | 26,151 | ||||||||||||||||||||||||
| Net loans and advances (measured at fair value) |
– | – | 144 | 77 | 16 | – | 160 | 77 | ||||||||||||||||||||||||
| 67,742 | 57,091 | 82,952 | 59,950 | 143 | 118 | 150,837 | 117,159 | |||||||||||||||||||||||||
| Financial liabilities |
||||||||||||||||||||||||||||||||
| Deposits and other borrowings (designated at fair value) |
– | – | 65 | 96 | – | – | 65 | 96 | ||||||||||||||||||||||||
| Derivative financial instruments |
766 | 373 | 70,991 | 49,998 | 91 | 103 | 71,848 | 50,474 | ||||||||||||||||||||||||
| Payables and other liabilities2 |
1,854 | 3,537 | 125 | 19 | – | – | 1,979 | 3,556 | ||||||||||||||||||||||||
| Debt issuances (designated at fair value) |
– | – | 3,165 | 2,630 | – | – | 3,165 | 2,630 | ||||||||||||||||||||||||
| Total |
2,620 | 3,910 | 74,346 | 52,743 | 91 | 103 | 77,057 | 56,756 | ||||||||||||||||||||||||
| 1 | During the period there were transfers from Level 1 to Level 2 of $136 million (2014: $357 million) for the Company following a reassessment of available pricing information causing the classification to be assessed as level 2. During the period there were also transfers from Level 2 to Level 1 of $104 million (2014:$33 million) for the Group following increased trading activity to support the quoted prices. Transfers into and out of Level 1 and Level 2 are deemed to have occurred as of the beginning of the reporting period in which the transfer occurred. |
| 2 | Represents securities short sold. |
(iv) DETAILS OF FAIR VALUE MEASUREMENTS THAT INCORPORATE UNOBSERVABLE MARKET DATA
(a) Composition of Level 3 fair value measurements
The following table presents the composition of financial instruments measured at fair value with significant unobservable inputs (Level 3 fair value measurements).
| Financial assets | Financial liabilities | |||||||||||||||||||||||||||||||||||||||||||||||||
| Net loans | Investments backing | |||||||||||||||||||||||||||||||||||||||||||||||||
| Trading securities | Derivatives | Available-for-sale | and advances | policy liabilities | Derivatives | |||||||||||||||||||||||||||||||||||||||||||||
| 2015 | 2014 | 2015 | 2014 | 2015 | 2014 | 2015 | 2014 | 2015 | 2014 | 2015 | 2014 | |||||||||||||||||||||||||||||||||||||||
| Consolidated | $m | $m | $m | $m | $m | $m | $m | $m | $m | $m | $m | $m | ||||||||||||||||||||||||||||||||||||||
| Asset backed securities |
– | – | – | – | 2 | 1 | – | – | 188 | – | – | – | ||||||||||||||||||||||||||||||||||||||
| Illiquid corporate bonds |
4 | – | – | – | 198 | 12 | 16 | – | – | – | – | – | ||||||||||||||||||||||||||||||||||||||
| Structured credit products |
– | – | 52 | 58 | – | – | – | – | – | – | (67 | ) | (80 | ) | ||||||||||||||||||||||||||||||||||||
| Managed funds (suspended) |
– | – | – | – | – | – | – | – | – | 12 | – | – | ||||||||||||||||||||||||||||||||||||||
| Alternative assets |
– | – | – | – | 34 | 27 | – | – | 351 | 533 | – | – | ||||||||||||||||||||||||||||||||||||||
| Other derivatives |
– | – | 30 | 48 | – | – | – | – | – | – | (34 | ) | (25 | ) | ||||||||||||||||||||||||||||||||||||
| Total |
4 | – | 82 | 106 | 234 | 40 | 16 | – | 539 | 545 | (101 | ) | (105 | ) | ||||||||||||||||||||||||||||||||||||
| Financial assets | Financial liabilities | |||||||||||||||||||||||||||||||||||||||||||||||||
| Net loans | Investments backing | |||||||||||||||||||||||||||||||||||||||||||||||||
| Trading securities | Derivatives | Available-for-sale | and advances | policy liabilities | Derivatives | |||||||||||||||||||||||||||||||||||||||||||||
| 2015 | 2014 | 2015 | 2014 | 2015 | 2014 | 2015 | 2014 | 2015 | 2014 | 2015 | 2014 | |||||||||||||||||||||||||||||||||||||||
| The Company | $m | $m | $m | $m | $m | $m | $m | $m | $m | $m | $m | $m | ||||||||||||||||||||||||||||||||||||||
| Asset backed securities |
– | – | – | – | – | – | – | – | n/a | n/a | – | – | ||||||||||||||||||||||||||||||||||||||
| Illiquid corporate bonds |
4 | – | – | – | 20 | – | 16 | – | n/a | n/a | – | – | ||||||||||||||||||||||||||||||||||||||
| Structured credit products |
– | – | 52 | 58 | – | – | – | – | n/a | n/a | (67 | ) | (80 | ) | ||||||||||||||||||||||||||||||||||||
| Managed funds (suspended) |
– | – | – | – | – | – | – | – | n/a | n/a | – | – | ||||||||||||||||||||||||||||||||||||||
| Alternative assets |
– | – | – | – | 30 | 22 | – | – | n/a | n/a | – | – | ||||||||||||||||||||||||||||||||||||||
| Other derivatives |
– | – | 21 | 38 | – | – | – | – | n/a | n/a | (24 | ) | (23 | ) | ||||||||||||||||||||||||||||||||||||
| Total |
4 | – | 73 | 96 | 50 | 22 | 16 | – | n/a | n/a | (91 | ) | (103 | ) | ||||||||||||||||||||||||||||||||||||
Structured credit products comprise the structured credit intermediation trades that the Group entered into from 2004 to 2007 whereby it sold protection using credit default swaps over certain structures, and mitigated risk by purchasing protection via credit default swaps from US financial guarantors over the same structures. These trades are valued using complex models with certain inputs relating to the reference assets and derivative counterparties not being observable in the market. Such unobservable inputs include credit spreads and default probabilities contributing from 13% to 57% of the valuation. The assets underlying the structured credit products are diverse instruments with a wide range of credit spreads and default probabilities relevant to the valuation.
128
ANZ ANNUAL REPORT 2015
20: Fair value of financial assets and financial liabilities (continued)
The remaining Level 3 balances include Asset backed securities and Illiquid corporate bonds where the effect on fair value of issuer credit cannot be directly or indirectly observed in the market; managed funds (suspended) comprising of fixed income and mortgage investments in managed funds that are illiquid and are not currently redeemable; Alternative assets that largely comprise investments in funds which are illiquid and are not currently redeemable, as well as various investments in unlisted equity securities for which no active market exists; and Other derivatives which predominantly include reverse mortgage swaps where the mortality rate cannot be observed and options over emissions certificates where the volatility input cannot be observed.
(b) Movements in Level 3 fair value measurements
The following table sets out movements in Level 3 fair value measurements. Derivatives are categorised on a portfolio basis and classified as either financial assets or financial liabilities based on whether the closing balance is an unrealised gain or loss. This could be different to the opening balance.
| Financial assets | Financial liabilities | |||||||||||||||||||||||||||||||||||||||||||||||||
| Net loans | Investments backing | |||||||||||||||||||||||||||||||||||||||||||||||||
| Trading securities | Derivatives | Available-for-sale | and advances | policy liabilities | Derivatives | |||||||||||||||||||||||||||||||||||||||||||||
| 2015 | 2014 | 2015 | 2014 | 2015 | 2014 | 2015 | 2014 | 2015 | 2014 | 2015 | 2014 | |||||||||||||||||||||||||||||||||||||||
| Consolidated | $m | $m | $m | $m | $m | $m | $m | $m | $m | $m | $m | $m | ||||||||||||||||||||||||||||||||||||||
| Opening balance |
– | – | 106 | 200 | 40 | 36 | – | – | 545 | 105 | (105 | ) | (437 | ) | ||||||||||||||||||||||||||||||||||||
| New purchases |
– | – | – | – | 8 | 4 | 21 | – | 161 | 447 | – | – | ||||||||||||||||||||||||||||||||||||||
| Disposals (sales) |
– | – | (8 | ) | (9 | ) | (20 | ) | (12 | ) | – | – | (266 | ) | (34 | ) | – | – | ||||||||||||||||||||||||||||||||
| Cash settlements |
– | – | – | – | – | – | – | – | – | – | 7 | 19 | ||||||||||||||||||||||||||||||||||||||
| – Transfers into Level 3 category1 |
10 | – | 2 | 14 | 198 | 8 | – | – | 161 | – | (2 | ) | (13 | ) | ||||||||||||||||||||||||||||||||||||
| – Transfers out of Level 3 category1 |
– | – | (17 | ) | (32 | ) | – | – | – | – | (148 | ) | (2 | ) | 9 | 254 | ||||||||||||||||||||||||||||||||||
| Fair value gain/(loss) recorded in other operating income in the income statement2 |
(6 | ) | – | (1 | ) | (67 | ) | 5 | – | (5 | ) | – | 86 | 29 | (10 | ) | 72 | |||||||||||||||||||||||||||||||||
| Fair value gain/(loss) recognised in reserves in equity |
– | – | – | – | 3 | 4 | – | – | – | – | – | – | ||||||||||||||||||||||||||||||||||||||
| Closing balance |
4 | – | 82 | 106 | 234 | 40 | 16 | – | 539 | 545 | (101 | ) | (105 | ) | ||||||||||||||||||||||||||||||||||||
| Financial assets | Financial liabilities | |||||||||||||||||||||||||||||||||||||||||||||||||
| Net loans | Investments backing | |||||||||||||||||||||||||||||||||||||||||||||||||
| Trading securities | Derivatives | Available-for-sale | and advances | policy liabilities | Derivatives | |||||||||||||||||||||||||||||||||||||||||||||
| 2015 | 2014 | 2015 | 2014 | 2015 | 2014 | 2015 | 2014 | 2015 | 2014 | 2015 | 2014 | |||||||||||||||||||||||||||||||||||||||
| The Company | $m | $m | $m | $m | $m | $m | $m | $m | $m | $m | $m | $m | ||||||||||||||||||||||||||||||||||||||
| Opening balance |
– | – | 96 | 200 | 22 | 29 | – | – | n/a | n/a | (103 | ) | (437 | ) | ||||||||||||||||||||||||||||||||||||
| New purchases |
– | – | – | – | 8 | 4 | 21 | – | n/a | n/a | – | – | ||||||||||||||||||||||||||||||||||||||
| Disposals (sales) |
– | – | (8 | ) | (9 | ) | (14 | ) | (11 | ) | – | – | n/a | n/a | – | – | ||||||||||||||||||||||||||||||||||
| Cash settlements |
– | – | – | – | – | – | – | – | n/a | n/a | 7 | 19 | ||||||||||||||||||||||||||||||||||||||
| – Transfers into Level 3 category |
10 | – | – | 6 | 30 | – | – | – | n/a | n/a | – | (9 | ) | |||||||||||||||||||||||||||||||||||||
| – Transfers out of Level 3 category |
– | – | (14 | ) | (31 | ) | – | – | – | – | n/a | n/a | 8 | 254 | ||||||||||||||||||||||||||||||||||||
| Fair value gain/(loss) recorded in other operating income in the income statement2 |
(6 | ) | – | 1 | (70 | ) | 4 | 1 | (5 | ) | – | n/a | n/a | (3 | ) | 70 | ||||||||||||||||||||||||||||||||||
| Fair value gain/(loss) recognised in reserves in equity |
– | – | – | – | – | (1 | ) | – | – | n/a | n/a | – | – | |||||||||||||||||||||||||||||||||||||
| Closing balance |
4 | – | 75 | 96 | 50 | 22 | 16 | – | n/a | n/a | (91 | ) | (103 | ) | ||||||||||||||||||||||||||||||||||||
| 1 | Transfers into Level 3 for the Group relate principally to illiquid corporate bonds and asset backed securities where market activity has reduced resulting in pricing to no longer be observable. Transfers out of Level 3 for the Group relate principally to managed funds (suspended) where the commencement of previously unavailable regular redemption windows has provided observable pricing. Transfers into and out of Level 3 are deemed to have occurred as of the beginning of the reporting period in which the transfer occurred. |
| 2 | Relating to assets and liabilities held at the end of the period. |
(c) Sensitivity to Level 3 data inputs
Where valuation techniques are employed and assumptions are required due to significant data inputs not being directly observable in the market place (Level 3 inputs), changing these assumptions changes the resultant estimate of fair value. The majority of transactions in this category are ‘back-to-back’ in nature where ANZ either acts as a financial intermediary or hedges the market risks. Similarly, the valuation of Investments backing policy liabilities directly impacts the associated life investment contracts they relate to. In these circumstances, changes in the assumptions generally have minimal impact on the income statement and net assets of ANZ. An exception to this is the ‘back-to-back’ structured credit intermediation trades which create significant exposure to credit risk.
Principal inputs used in the determination of fair value of financial instruments included in the structured credit portfolio include counterparty credit spreads, market-quoted CDS prices, recovery rates, default probabilities, correlation curves and other inputs, some of which may not be directly observable in the market. The potential effect of changing prevailing unobservable inputs to reasonably possible alternative assumptions for valuing those financial instruments could result in less than a (+/-) $5 million (2014: (+/-) $10 million) impact on profit. The ranges of reasonably possible alternative assumptions are established by application of professional judgement and analysis of the data available to support each assumption.
| NOTES TO THE FINANCIAL STATEMENTS 129 | ||
NOTES TO THE FINANCIAL STATEMENTS (continued)
20: Fair value of financial assets and financial liabilities (continued)
(d) Deferred fair value gains and losses
Where the fair value of a financial instrument at initial recognition is determined using unobservable data that is significant to the valuation of the instrument, the difference between the transaction price and the amount determined based on the valuation technique (day one gain or loss) is not immediately recognised in the income statement. Subsequently, the day one gain or loss is recognised in the income statement over the life of the transaction on a straight line basis or over the period until all inputs become observable.
The table below summarises the aggregate amount of day one gains not yet recognised in the income statement and amounts which have been subsequently recognised.
| Consolidated | The Company | |||||||||||||||
| 2015 $m |
2014 $m |
2015 $m |
2014 $m |
|||||||||||||
| Opening balance |
3 | 4 | 2 | 2 | ||||||||||||
| Deferral on new transactions |
– | 1 | – | 1 | ||||||||||||
| Amounts recognised in income statement during the period |
(1 | ) | (2 | ) | (1 | ) | (1 | ) | ||||||||
| Closing balance |
2 | 3 | 1 | 2 | ||||||||||||
The closing balance of unrecognised gains is predominantly related to derivative financial instruments.
(v) ADDITIONAL INFORMATION FOR FINANCIAL INSTRUMENTS DESIGNATED AT FAIR VALUE THROUGH PROFIT OR LOSS
(a) Financial assets designated at fair value through profit or loss
The category loans and advances includes certain loans designated at fair value through profit or loss in order to eliminate an accounting mismatch which would arise if the asset were otherwise carried at amortised cost. This mismatch arises as the derivative financial instruments which were acquired to mitigate interest rate risk of the loans and advances, are measured at fair value through profit or loss. By designating the economically hedged loans, the movements in the fair value attributable to changes in interest rate risk will be recognised in the income statement in the same periods.
At balance date, the credit exposure of the Group on these assets was $683 million (2014: $368 million) and for the Company was $144 million (2014: $77 million). For the Group $509 million (2014: $195 million) and the Company $144 million (2014: $77 million) was mitigated by collateral held.
For the Group, the cumulative change in fair value attributable to change in credit risk was a reduction to the assets of $1 million (2014: reduction to the assets of $2 million). For the Company the cumulative change to the assets was $nil (2014: $nil). The amount recognised in the income statement attributable to changes in credit risk for the Group was $1 million (2014: $nil) and for the Company $nil (2014: $nil).
The change in fair value of the designated financial assets attributable to changes in credit risk has been calculated by determining the change in credit rating and credit spread implicit in the loans and advances issued by entities with similar credit characteristics.
(b) Financial liabilities designated at fair value through profit or loss
Parts of Subordinated debt, Debt issuances and Deposits and other borrowings have been designated as financial liabilities at fair value through profit or loss in order to eliminate an accounting mismatch which would arise if the liabilities were otherwise carried at amortised cost. This mismatch arises as the derivatives acquired to mitigate interest rate risk within the financial liabilities are measured at fair value through profit or loss. Policy liabilities are designated at fair value through profit or loss in accordance with AASB 1038. External unitholder liabilities which are not included in the table below, represent the external unitholder share of the ‘Investments backing policy liabilities’ which are designated at fair value through profit or loss.
The table below compares the carrying amount of financial liabilities carried at full fair value, to the contractual amount payable at maturity and fair value gains and losses recognised during the period on liabilities carried at full fair value that are attributable to changes in ANZ’s own credit rating.
| Policy liabilities | Deposits and other borrowings |
Debt issuances |
Subordinated debt | |||||||||||||||||||||||||||||
| Consolidated | 2015 $m |
2014 $m |
2015 $m |
2014 $m |
2015 $m |
2014 $m |
2015 $m |
2014 $m |
||||||||||||||||||||||||
| Carrying amount |
35,029 | 34,038 | 4,576 | 5,494 | 3,165 | 3,441 | – | – | ||||||||||||||||||||||||
| Amount by which the consideration payable at maturity is greater/(less) than the carrying value |
– | – | 6 | 4 | (15 | ) | (62 | ) | – | – | ||||||||||||||||||||||
| Cumulative change in liability value attributable to own credit risk: |
||||||||||||||||||||||||||||||||
| – opening cumulative increase/(decrease) |
– | – | – | – | 34 | (13 | ) | – | 12 | |||||||||||||||||||||||
| – increase/(decrease) recognised during the year |
– | – | – | – | (52 | ) | 47 | – | (12 | ) | ||||||||||||||||||||||
| – closing cumulative increase/(decrease) |
– | – | – | – | (18 | ) | 34 | – | – | |||||||||||||||||||||||
130
ANZ ANNUAL REPORT 2015
20: Fair value of financial assets and financial liabilities (continued)
| Deposits and other borrowings |
Debt issuances |
Subordinated debt | ||||||||||||||||||||||
| The Company | 2015 $m |
2014 $m |
2015 $m |
2014 $m |
2015 $m |
2014 $m |
||||||||||||||||||
| Carrying amount |
65 | 96 | 3,165 | 2,630 | – | – | ||||||||||||||||||
| Amount by which the consideration payable at maturity is greater/(less) than the carrying value |
6 | 4 | (15 | ) | (66 | ) | – | – | ||||||||||||||||
| Cumulative change in liability value attributable to own credit risk: |
||||||||||||||||||||||||
| – opening cumulative increase/(decrease) |
– | – | 34 | (13 | ) | – | 12 | |||||||||||||||||
| – increase/(decrease) recognised during the year |
– | – | (52 | ) | 47 | – | (12 | ) | ||||||||||||||||
| – closing cumulative increase/(decrease) |
– | – | (18 | ) | 34 | – | – | |||||||||||||||||
For each of Subordinated debt, Debt issuances and Deposits and other borrowings, the change in fair value attributable to changes in credit risk has been determined as the amount of change in fair value that is not attributable to changes in market conditions that give rise to market risks (benchmark interest rate and foreign exchange rates). This approach is deemed appropriate as the changes in fair value arising from factors other than changes in own credit risk or changes in observed (benchmark) interest rates and foreign exchange rates are considered to be insignificant.
(vi) FINANCIAL ASSETS AND FINANCIAL LIABILITIES NOT MEASURED AT FAIR VALUE
The table below reflects the carrying amounts of financial instruments not measured at fair value on the Group’s balance sheet and where the carrying amount is not considered a close approximation of fair value. The table also provides a comparison of the carrying amount of these financial instruments to the Group’s estimate of their fair value. The categorisation of the fair value into the levels within the fair value hierarchy is determined in accordance with the methodology set out on page 126 (section ii).
| Carrying amount |
Categorised into fair value hierarchy | Fair value (total) |
||||||||||||||||||||||||||||||||||||||
| Quoted market price (Level 1) |
Using observable |
With significant non-observable inputs (Level 3) |
||||||||||||||||||||||||||||||||||||||
| 2015 | 2014 | 2015 | 2014 | 2015 | 2014 | 2015 | 2014 | 2015 | 2014 | |||||||||||||||||||||||||||||||
| Consolidated | $m | $m | $m | $m | $m | $m | $m | $m | $m | $m | ||||||||||||||||||||||||||||||
| Financial assets |
||||||||||||||||||||||||||||||||||||||||
| Net loans and advances1 |
569,539 | 521,384 | – | – | 545,538 | 498,545 | 25,402 | 23,339 | 570,940 | 521,884 | ||||||||||||||||||||||||||||||
| 569,539 | 521,384 | – | – | 545,538 | 498,545 | 25,402 | 23,339 | 570,940 | 521,884 | |||||||||||||||||||||||||||||||
| Financial liabilities |
||||||||||||||||||||||||||||||||||||||||
| Deposits and other borrowings |
566,218 | 504,585 | – | – | 566,636 | 504,760 | – | – | 566,636 | 504,760 | ||||||||||||||||||||||||||||||
| Debt issuances |
90,582 | 76,655 | 37,880 | 29,893 | 52,826 | 47,821 | – | – | 90,706 | 77,714 | ||||||||||||||||||||||||||||||
| Subordinated debt |
17,009 | 13,607 | 13,842 | 10,805 | 3,241 | 2,959 | – | – | 17,083 | 13,764 | ||||||||||||||||||||||||||||||
| Total |
673,809 | 594,847 | 51,722 | 40,698 | 622,703 | 555,540 | – | – | 674,425 | 596,238 | ||||||||||||||||||||||||||||||
| 1 | Included within Net loans and advances (Level 2) is $8,065m of lending assets of the Esanda dealer finance business classified as held for sale (refer note 14). |
| Carrying amount |
Categorised into fair value hierarchy | Fair value (total) |
||||||||||||||||||||||||||||||||||||||
| Quoted market price (Level 1) |
Using observable |
With significant non-observable inputs (Level 3) |
||||||||||||||||||||||||||||||||||||||
| 2015 | 2014 | 2015 | 2014 | 2015 | 2014 | 2015 | 2014 | 2015 | 2014 | |||||||||||||||||||||||||||||||
| The Company | $m | $m | $m | $m | $m | $m | $m | $m | $m | $m | ||||||||||||||||||||||||||||||
| Financial assets |
||||||||||||||||||||||||||||||||||||||||
| Net loans and advances1 |
448,288 | 414,989 | – | – | 428,949 | 396,264 | 20,276 | 19,127 | 449,225 | 415,391 | ||||||||||||||||||||||||||||||
| 448,288 | 414,989 | – | – | 428,949 | 396,264 | 20,276 | 19,127 | 449,225 | 415,391 | |||||||||||||||||||||||||||||||
| Financial liabilities |
||||||||||||||||||||||||||||||||||||||||
| Deposits and other borrowings |
471,966 | 423,076 | – | – | 472,235 | 423,222 | – | – | 472,235 | 423,222 | ||||||||||||||||||||||||||||||
| Debt issuances |
72,414 | 61,531 | 24,428 | 18,861 | 48,008 | 43,558 | – | – | 72,436 | 62,419 | ||||||||||||||||||||||||||||||
| Subordinated debt |
15,812 | 12,870 | 11,357 | 10,072 | 3,249 | 2,964 | – | – | 14,606 | 13,036 | ||||||||||||||||||||||||||||||
| Total |
560,192 | 497,477 | 35,785 | 28,933 | 523,492 | 469,744 | – | – | 559,277 | 498,677 | ||||||||||||||||||||||||||||||
| 1 | Included within Net loans and advances (Level 2) is $8,065m of lending assets of the Esanda dealer finance business classified as held for sale (refer note 14). |
The following sets out the Group’s basis of establishing fair value of financial instruments not measured at fair value on the balance sheet. The valuation techniques employed are consistent with those used to calculate fair values of financial instruments carried at fair value. Certain Net loans and advances, Deposits and other borrowings and Debt issuances have been designated at fair value and are therefore excluded from the tables above.
| NOTES TO THE FINANCIAL STATEMENTS 131 | ||
NOTES TO THE FINANCIAL STATEMENTS (continued)
20: Fair value of financial assets and financial liabilities (continued)
Net loans and advances
The fair value has been determined through discounting future cash flows.
For Net loans and advances to banks, the fair value is derived by discounting cash flows using prevailing market rates for lending with similar credit quality.
For Net loans and advances to customers, the fair value is the present value of future cash flows, discounted using a curve which incorporates changes in wholesale market rates, the Group’s cost of wholesale funding and the customer margin, as appropriate.
Deposits and other borrowings
For interest bearing fixed maturity deposits and other borrowings and acceptances with quoted market prices, market borrowing rates of interest for debt with a similar maturity are used to discount contractual cash flows to derive the fair value. The fair value of a deposit liability without a specified maturity or at call is deemed to be the amount payable on demand at the reporting date. The fair value is not adjusted for any value expected to be derived from retaining the deposit for a future period of time.
Debt issuances and Subordinated debt
The aggregate fair value of Debt issuances and Subordinated debt is calculated based on quoted market prices or observable inputs where applicable. For those debt issuances where quoted market prices were not available, a discounted cash flow model using a yield curve appropriate for the remaining term to maturity of the debt instrument used. The fair value includes the effects of the appropriate credit spreads applicable to ANZ for that instrument.
21: Maturity Analysis of Assets and Liabilities
The following is an analysis of asset and liability line items in the balance sheet that combine amounts expected to be realised or due to be settled within one year and after more than one year.1
| 2015 | 2014 | |||||||||||||||||||||||||
| Consolidated | Within one year $m |
After more than one year $m |
Total $m |
Within one year $m |
After more than one year $m |
Total $m |
||||||||||||||||||||
| Available-for-sale assets |
10,353 | 33,314 | 43,667 | 8,819 | 22,098 | 30,917 | ||||||||||||||||||||
| Net loans and advances2 |
128,771 | 441,467 | 570,238 | 124,985 | 396,767 | 521,752 | ||||||||||||||||||||
| Investments backing policy liabilities |
27,966 | 6,854 | 34,820 | 28,361 | 5,218 | 33,579 | ||||||||||||||||||||
| Deposits and other borrowings |
546,626 | 24,168 | 570,794 | 488,862 | 21,217 | 510,079 | ||||||||||||||||||||
| Policy liabilities3 |
35,340 | 61 | 35,401 | 34,554 | – | 34,554 | ||||||||||||||||||||
| Debt issuances |
29,327 | 62,420 | 93,747 | 15,720 | 64,376 | 80,096 | ||||||||||||||||||||
| Subordinated debt4 |
– | 17,009 | 17,009 | – | 13,607 | 13,607 | ||||||||||||||||||||
| 1 | Excludes asset and liability line items where the entire amount is considered as “within one year”, “after more than one year” or having no specific maturities. |
| 2 | Includes Esanda dealer finance assets classified as held for sale (refer note 14). |
| 3 | Includes $372 million (2014: $516 million) that relates to life insurance contract liabilities classified as “within one year”. |
| 4 | Includes $1,188 million (2014: $1,087 million) that relates to perpetual notes. |
132
ANZ ANNUAL REPORT 2015
22: Assets Charged as Security for Liabilities and Collateral Accepted as Security for Assets
ASSETS CHARGED AS SECURITY FOR LIABILITIES1
The following assets are pledged as collateral:
| } | Mandatory reserve deposits with local central banks in accordance with statutory requirements. These deposits are not available to finance the Group’s day to day operations. |
| } | Securities provided as collateral for repurchase transactions. These transactions are governed by standard industry agreements. |
| } | Debenture undertakings covering the assets of Esanda Finance Corporation Limited (Esanda), and its subsidiaries, and UDC Finance Limited (UDC). The debenture stock of Esanda, and its subsidiaries, and UDC is secured by a trust deed and collateral debentures, giving floating charges over the undertakings and all the tangible assets of the entity, other than land and buildings (of Esanda only). All controlled entities of Esanda and UDC have guaranteed the payment of principal, interest and other monies in relation to all debenture stock and unsecured notes issued by Esanda and UDC respectively. The only loans pledged as collateral are those in Esanda, and its subsidiaries, and UDC. |
| } | Specified residential mortgages provided as security for notes and bonds issued to investors as part of ANZ’s covered bond programs. |
| } | Collateral provided to central banks. |
| } | Collateral provided to clearing houses. |
The carrying amounts of assets pledged as security are as follows:
| Consolidated | The Company | |||||||||||||||||||||||||||||||
| Carrying Amount | Related Liability | Carrying Amount | Related Liability | |||||||||||||||||||||||||||||
| 2015 | 2014 | 2015 | 2014 | 2015 | 2014 | 2015 | 2014 | |||||||||||||||||||||||||
| $m | $m | $m | $m | $m | $m | $m | $m | |||||||||||||||||||||||||
| Regulatory deposits |
1,773 | 1,565 | n/a | n/a | 557 | 434 | n/a | n/a | ||||||||||||||||||||||||
| Securities sold under arrangements to repurchase |
13,975 | 8,736 | 13,731 | 8,641 | 13,476 | 8,568 | 13,255 | 8,473 | ||||||||||||||||||||||||
| Assets pledged as collateral under debenture undertakings |
2,218 | 2,141 | 1,578 | 1,400 | – | – | – | – | ||||||||||||||||||||||||
| Covered bonds1 |
30,368 | 27,241 | 27,013 | 20,561 | 23,508 | 20,738 | 23,508 | 20,738 | ||||||||||||||||||||||||
| Other |
225 | 219 | 222 | 208 | 179 | 170 | 178 | 170 | ||||||||||||||||||||||||
| 1 | The consolidated related liability represents covered bonds issued to external investors and the related liability for the Company represents the liability to the covered bond structured entities. |
COLLATERAL ACCEPTED AS SECURITY FOR ASSETS1
ANZ has received collateral in relation to reverse repurchase agreements. These transactions are governed by standard industry agreements.
The fair value of collateral received and sold or repledged is as follows:
| Consolidated | The Company | |||||||||||||||
| 2015 | 2014 | 2015 | 2014 | |||||||||||||
| $m | $m | $m | $m | |||||||||||||
| Collateral received on standard reverse repurchase agreements |
||||||||||||||||
| Fair value of assets which can be sold |
17,506 | 14,354 | 16,738 | 13,878 | ||||||||||||
| Fair value of assets sold or repledged |
2,475 | 4,201 | 1,933 | 4,090 | ||||||||||||
| 1 | Excludes the amounts disclosed as collateral paid and received in the balance sheet that relate to derivative liabilities and derivative assets respectively. The terms and conditions of the collateral agreements are included in the standard Credit Support Annex that forms part of the International Swaps and Derivatives Association Master Agreement. |
NOTES TO THE FINANCIAL STATEMENTS 133
NOTES TO THE FINANCIAL STATEMENTS (continued)
23: Offsetting
The following tables identify financial assets and liabilities which have been offset in the balance sheet (in accordance with AASB 132 – Financial Instruments: Presentation (AASB 132)) and those which have not been offset in the balance sheet but are subject to enforceable master netting agreements (or similar arrangements) with our trading counterparties. The effect of over collaterisation has not been taken into account. A description of the rights of set-off associated with financial assets and financial liabilities subject to master netting agreements or similar, including the nature of those rights, are described in note 19.
| Amount subject to master netting agreement or similar | ||||||||||||||||||||||||||||||
| Related amounts not offset in the statement of financial position |
||||||||||||||||||||||||||||||
| Total amounts recognised in the balance sheet1 |
Amounts not subject to master netting agreement or similar |
Total | Financial instruments |
Financial collateral (received)/ pledged |
Net amount | |||||||||||||||||||||||||
| Consolidated 30 September 2015 | $m | $m | $m | $m | $m |
$m | ||||||||||||||||||||||||
| Derivative assets |
85,625 | (6,846 | ) | 78,779 | (62,782 | ) | (7,165 | ) | 8,832 | |||||||||||||||||||||
| Reverse repurchase, securities borrowing and similar agreements2 |
17,308 | (7,470 | ) | 9,838 | (265 | ) | (9,573 | ) | – | |||||||||||||||||||||
| Total financial assets |
102,933 | (14,316 | ) | 88,617 | (63,047 | ) | (16,738 | ) | 8,832 | |||||||||||||||||||||
| Derivative liabilities |
(81,270 | ) | 5,566 | (75,704 | ) | 62,782 | 8,517 | (4,405 | ) | |||||||||||||||||||||
| Repurchase, securities lending and similar agreements3 |
(13,731 | ) | 12,674 | (1,057 | ) | 265 | 792 | – | ||||||||||||||||||||||
| Total financial liabilities |
(95,001 | ) | 18,240 | (76,761 | ) | 63,047 | 9,309 | (4,405 | ) | |||||||||||||||||||||
| Amount subject to master netting agreement or similar | ||||||||||||||||||||||||||||||
| Related amounts not offset in the statement of financial position |
||||||||||||||||||||||||||||||
| Total amounts recognised in the balance sheet1 |
Amounts not subject to master netting agreement or similar |
Total | Financial instruments |
Financial collateral (received)/ pledged |
Net amount | |||||||||||||||||||||||||
| Consolidated 30 September 2014 | $m |
$m |
$m |
$m |
$m |
$m | ||||||||||||||||||||||||
| Derivative assets |
56,369 | (5,236 | ) | 51,133 | (41,871 | ) | (5,048 | ) | 4,214 | |||||||||||||||||||||
| Reverse repurchase, securities borrowing and similar agreements2 |
13,384 | (5,928 | ) | 7,456 | (20 | ) | (7,436 | ) | – | |||||||||||||||||||||
| Total financial assets |
69,753 | (11,164 | ) | 58,589 | (41,891 | ) | (12,484 | ) | 4,214 | |||||||||||||||||||||
| Derivative liabilities |
(52,925 | ) | 4,148 | (48,777 | ) | 41,871 | 4,586 | (2,320 | ) | |||||||||||||||||||||
| Repurchase, securities lending and similar agreements3 |
(8,641 | ) | 8,588 | (53 | ) | 20 | 33 | – | ||||||||||||||||||||||
| Total financial liabilities |
(61,566 | ) | 12,736 | (48,830 | ) | 41,891 | 4,619 | (2,320 | ) | |||||||||||||||||||||
| 1 | The Group/Company does not have any arrangements that satisfy the conditions of AASB 132 to offset within the balance sheet. |
| 2 | Reverse repurchase agreements are presented in the balance sheet within cash if duration is less than 90 days. If maturity is greater than 90 days they are presented in net loans and advances. |
| 3 | Repurchase agreements are presented in the balance sheet within deposits and other borrowings. |
134
ANZ ANNUAL REPORT 2015
23: Offsetting (continued)
| Amount subject to master netting agreement or similar | ||||||||||||||||||||||||||||||
|
Related amounts not offset in the statement of financial position |
||||||||||||||||||||||||||||||
| Total amounts recognised in the balance sheet1 |
Amounts not subject to master netting agreement or similar |
Total | Financial instruments |
Financial pledged |
Net amount | |||||||||||||||||||||||||
| The Company 30 September 2015 | $m | $m | $m | $m | $m | $m | ||||||||||||||||||||||||
| Derivative assets |
75,694 | (5,140 | ) | 70,554 | (55,881 | ) | (6,435 | ) | 8,238 | |||||||||||||||||||||
| Reverse repurchase, securities borrowing and similar agreements2 |
16,604 | (6,766 | ) | 9,838 | (265 | ) | (9,573 | ) | – | |||||||||||||||||||||
| Total financial assets |
92,298 | (11,906 | ) | 80,392 | (56,146 | ) | (16,008 | ) | 8,238 | |||||||||||||||||||||
| Derivative liabilities |
(71,844 | ) | 4,247 | (67,597 | ) | 55,881 | 7,681 | (4,035 | ) | |||||||||||||||||||||
| Repurchase, securities lending and similar agreements3 |
(13,255 | ) | 12,198 | (1,057 | ) | 265 | 792 | – | ||||||||||||||||||||||
| Total financial liabilities |
(85,099 | ) | 16,445 | (68,654 | ) | 56,146 | 8,473 | (4,035 | ) | |||||||||||||||||||||
| Amount subject to master netting agreement or similar | ||||||||||||||||||||||||||||||
| Related amounts not offset in the statement of financial position |
||||||||||||||||||||||||||||||
| Total amounts recognised in the balance sheet1 |
Amounts subject to |
Total | Financial instruments |
Financial pledged |
Net amount | |||||||||||||||||||||||||
| The Company 30 September 2014 | $m | $m | $m | $m | $m | $m | ||||||||||||||||||||||||
| Derivative assets |
52,882 | (4,230 | ) | 48,652 | (40,541 | ) | (4,458 | ) | 3,653 | |||||||||||||||||||||
| Reverse repurchase, securities borrowing and similar agreements2 |
12,907 | (5,451 | ) | 7,456 | (20 | ) | (7,436 | ) | – | |||||||||||||||||||||
| Total financial assets |
65,789 | (9,681 | ) | 56,108 | (40,561 | ) | (11,894 | ) | 3,653 | |||||||||||||||||||||
| Derivative liabilities |
(50,474 | ) | 3,615 | (46,859 | ) | 40,541 | 4,247 | (2,071 | ) | |||||||||||||||||||||
| Repurchase, securities lending and similar agreements3 |
(8,473 | ) | 8,420 | (53 | ) | 20 | 33 | – | ||||||||||||||||||||||
| Total financial liabilities |
(58,947 | ) | 12,035 | (46,912 | ) | 40,561 | 4,280 | (2,071 | ) | |||||||||||||||||||||
| 1 | The Group/Company does not have any arrangements that satisfy the conditions of AASB 132 to offset within the balance sheet. |
| 2 | Reverse repurchase agreements are presented in the balance sheet within cash if duration is less than 90 days. If maturity is greater than 90 days they are presented in net loans and advances. |
| 3 | Repurchase agreements are presented in the balance sheet within deposits and other borrowings. |
NOTES TO THE FINANCIAL STATEMENTS 135
NOTES TO THE FINANCIAL STATEMENTS (continued)
24: Credit Related Commitments, Guarantees and Contingent Liabilities
Credit related commitments – facilities provided
| Consolidated | The Company | |||||||||||||||
| 2015 $m |
2014 $m |
2015 $m |
2014 $m |
|||||||||||||
| Contract amount of: |
||||||||||||||||
| Undrawn facilities |
230,794 | 193,984 | 180,847 | 153,985 | ||||||||||||
| Australia |
101,898 | 97,781 | 99,880 | 97,773 | ||||||||||||
| New Zealand |
22,960 | 20,870 | 20 | 29 | ||||||||||||
| Overseas markets |
105,936 | 75,333 | 80,947 | 56,183 | ||||||||||||
| Total |
230,794 | 193,984 | 180,847 | 153,985 | ||||||||||||
Guarantees and contingent liabilities
These guarantees and contingent liabilities relate to transactions that the Group has entered into as principal, including guarantees, standby letters of credit and documentary letters of credit.
Documentary letters of credit involve the issue of letters of credit guaranteeing payment in favour of an exporter secured against an underlying shipment of goods or backed by a confirmatory letter of credit from another bank.
Performance related contingencies are liabilities that oblige the Group to make payments to a third party should the customer fail to fulfil the non-monetary terms of the contract.
To reflect the risk associated with these transactions, they are subjected to the same credit origination, portfolio management and collateral requirements as customers that apply for loans. The contract amount represents the maximum potential amount that could be lost if the counterparty fails to meet its financial obligations. As the facilities may expire without being drawn upon, the notional amounts do not necessarily reflect future cash requirements.
| Consolidated | The Company | |||||||||||||||
| 2015 $m |
2014 $m |
2015 $m |
2014 $m |
|||||||||||||
| Contract amount of: |
||||||||||||||||
| Guarantees and letters of credit |
18,809 | 17,235 | 16,101 | 14,142 | ||||||||||||
| Performance related contingencies |
21,526 | 22,840 | 18,592 | 20,774 | ||||||||||||
| Total |
40,335 | 40,075 | 34,693 | 34,916 | ||||||||||||
| Australia |
17,638 | 17,686 | 17,637 | 17,686 | ||||||||||||
| New Zealand |
1,961 | 1,790 | – | – | ||||||||||||
| Asia Pacific, Europe & America |
20,736 | 20,599 | 17,056 | 17,230 | ||||||||||||
| Total |
40,335 | 40,075 | 34,693 | 34,916 | ||||||||||||
136
ANZ ANNUAL REPORT 2015
25: Goodwill and Other Intangible Assets
| Consolidated | The Company | |||||||||||||||||
|
2015 $m |
2014 $m |
2015 $m |
2014 $m |
|||||||||||||||
| Goodwill1 |
||||||||||||||||||
| Gross carrying amount |
||||||||||||||||||
| Balances at start of the year |
4,511 | 4,499 | 90 | 77 | ||||||||||||||
| Reclassifications |
– | – | – | 9 | ||||||||||||||
| Impairment/write off expense |
(1) | – | – | – | ||||||||||||||
| Foreign currency exchange differences |
87 | 12 | 19 | 4 | ||||||||||||||
| Balance at end of year |
4,597 | 4,511 | 109 | 90 | ||||||||||||||
| Software |
||||||||||||||||||
| Balances at start of the year |
2,533 | 2,170 | 2,336 | 2,007 | ||||||||||||||
| Software capitalisation during the period |
807 | 777 | 782 | 683 | ||||||||||||||
| Amortisation expense |
(542) | (426) | (500) | (368) | ||||||||||||||
| Impairment expense/write-offs |
(17) | (15) | (12) | (11) | ||||||||||||||
| Foreign currency exchange differences |
112 | 27 | 105 | 25 | ||||||||||||||
| Balance at end of year |
2,893 | 2,533 | 2,711 | 2,336 | ||||||||||||||
| Cost |
5,860 | 5,005 | 5,620 | 4,568 | ||||||||||||||
| Accumulated amortisation |
(2,763) | (2,263) | (2,710) | (2,031) | ||||||||||||||
| Accumulated impairment |
(204) | (209) | (199) | (201) | ||||||||||||||
| Carrying amount |
2,893 | 2,533 | 2,711 | 2,336 | ||||||||||||||
| Acquired Portfolio of Insurance and Investment Business |
||||||||||||||||||
| Balances at start of the year |
784 | 856 | – | – | ||||||||||||||
| Amortisation expense |
(70) | (71) | – | – | ||||||||||||||
| Foreign currency exchange differences |
1 | (1) | – | – | ||||||||||||||
| Balance at end of year |
715 | 784 | – | – | ||||||||||||||
| Cost |
1,188 | 1,187 | – | – | ||||||||||||||
| Accumulated amortisation |
(473) | (403) | – | – | ||||||||||||||
| Carrying amount |
715 | 784 | – | – | ||||||||||||||
| Other intangible assets2 |
||||||||||||||||||
| Balances at start of the year |
122 | 165 | 25 | 40 | ||||||||||||||
| Other additions |
(1) | 3 | – | – | ||||||||||||||
| Reclassification |
– | – | (7) | (9) | ||||||||||||||
| Amortisation expense |
(18) | (18) | (9) | (8) | ||||||||||||||
| Impairment expense |
– | (28) | – | – | ||||||||||||||
| Foreign currency exchange differences |
4 | – | 1 | 2 | ||||||||||||||
| Balance at end of year |
107 | 122 | 10 | 25 | ||||||||||||||
| Cost |
207 | 227 | 68 | 68 | ||||||||||||||
| Accumulated amortisation/impairment |
(100) | (105) | (58) | (43) | ||||||||||||||
| Carrying amount |
107 | 122 | 10 | 25 | ||||||||||||||
| Goodwill and other intangible assets |
||||||||||||||||||
| Net book value |
||||||||||||||||||
| Balances at start of the year |
7,950 | 7,690 | 2,451 | 2,124 | ||||||||||||||
| Balance at end of year |
8,312 | 7,950 | 2,830 | 2,451 | ||||||||||||||
| 1 | Excludes notional goodwill in equity accounted investments. |
| 2 | The consolidated other intangible assets comprises aligned advisor relationships, distribution agreements and management fee rights, credit card relationships and other intangibles. The Company other intangible assets comprises distribution agreements and management fee rights, credit card relationships and other intangibles. |
NOTES TO THE FINANCIAL STATEMENTS 137
NOTES TO THE FINANCIAL STATEMENTS (continued)
25: Goodwill and Other Intangible Assets (continued)
GOODWILL ALLOCATED TO CASH–GENERATING UNITS
26: Premises and Equipment
| Consolidated | The Company | |||||||||||||||||
| 2015 $m |
2014 $m |
2015 $m |
2014 $m |
|||||||||||||||
| At cost1 |
4,769 | 4,280 | 2,694 | 2,325 | ||||||||||||||
| Accumulated depreciation1 |
(2,548) | (2,099) | (1,704) | (1,324) | ||||||||||||||
| 2,221 | 2,181 | 990 | 1,001 | |||||||||||||||
| Carrying amount at beginning of year |
2,181 | 2,164 | 1,001 | 983 | ||||||||||||||
| Additions2 |
361 | 375 | 232 | 247 | ||||||||||||||
| Disposals |
(43) | (44) | (38) | (17) | ||||||||||||||
| Amortisation and depreciation3 |
(325) | (324) | (227) | (221) | ||||||||||||||
| Foreign currency exchange difference |
47 | 10 | 22 | 9 | ||||||||||||||
| Carrying amount at end of year |
2,221 | 2,181 | 990 | 1,001 | ||||||||||||||
| Net book value |
||||||||||||||||||
| Freehold and leasehold land and buildings |
901 | 878 | 59 | 50 | ||||||||||||||
| Integrals and equipment |
1,183 | 1,162 | 856 | 904 | ||||||||||||||
| Capital works in progress |
137 | 141 | 75 | 47 | ||||||||||||||
| 2,221 | 2,181 | 990 | 1,001 | |||||||||||||||
| 1 | The current year cost and accumulated depreciation was reduced to remove assets with a nil net book value that are no longer in use. Comparative information was not adjusted. |
| 2 | Includes Transfers. |
| 3 | Includes Freehold and leasehold land and buildings, Leasehold improvements, Furniture and equipment and Technology equipment. |
COMMITMENTS
| Consolidated | The Company | |||||||||||||||
| 2015 $m |
2014 $m |
2015 $m |
2014 $m |
|||||||||||||
| Property capital expenditure |
||||||||||||||||
| Contracts for outstanding capital expenditure |
109 | 88 | 92 | 68 | ||||||||||||
| Total capital expenditure commitments for property |
109 | 88 | 92 | 68 | ||||||||||||
| Lease rentals |
||||||||||||||||
| Land and buildings |
2,251 | 2,163 | 2,283 | 2,345 | ||||||||||||
| Furniture and equipment |
276 | 216 | 190 | 168 | ||||||||||||
| Total lease rental commitments1 |
2,527 | 2,379 | 2,473 | 2,513 | ||||||||||||
| Due within one year |
485 | 475 | 438 | 413 | ||||||||||||
| Due later than one year but not later than five years |
1,273 | 1,130 | 1,083 | 1,103 | ||||||||||||
| Due later than five years |
769 | 774 | 952 | 997 | ||||||||||||
| Total lease rental commitments1 |
2,527 | 2,379 | 2,473 | 2,513 | ||||||||||||
| 1 | Total future minimum sublease payments expected to be received under non-cancellable subleases at 30 September is $90 million (2014: $90 million) for the Group and $80 million (2014: $78 million) for the Company. During the year, sublease payments received amounted to $22 million (2014: $19 million) for the Group and $19 million (2014: $16 million) for the Company and were netted against rent expense. |
138
ANZ ANNUAL REPORT 2015
27: Other Assets
| Consolidated | The Company | |||||||||||||||||
| 2015 $m |
2014 $m |
2015 $m |
2014 $m |
|||||||||||||||
| Accrued interest/prepaid discounts |
1,405 | 1,472 | 944 | 998 | ||||||||||||||
| Accrued commissions |
137 | 129 | 76 | 75 | ||||||||||||||
| Prepaid expenses |
427 | 356 | 178 | 152 | ||||||||||||||
| Insurance contract liabilities ceded |
699 | 591 | – | – | ||||||||||||||
| Outstanding premiums |
228 | 200 | – | – | ||||||||||||||
| Defined benefit superannuation plan surplus |
144 | 47 | 144 | 47 | ||||||||||||||
| Operating leases residual value |
282 | 334 | 282 | 334 | ||||||||||||||
| Other |
2,524 | 1,662 | 1,325 | 637 | ||||||||||||||
| Total other assets |
5,846 | 4,791 | 2,949 | 2,243 | ||||||||||||||
|
28: Provisions
|
||||||||||||||||||
| Consolidated | The Company | |||||||||||||||||
| 2015 $m |
2014 $m |
2015 $m |
2014 $m |
|||||||||||||||
| Employee entitlements1 |
554 | 526 | 411 | 404 | ||||||||||||||
| Restructuring costs and surplus leased space2 |
23 | 56 | 15 | 48 | ||||||||||||||
| Non-lending losses, frauds and forgeries |
169 | 134 | 141 | 104 | ||||||||||||||
| Other |
328 | 384 | 164 | 139 | ||||||||||||||
| Total provisions |
1,074 | 1,100 | 731 | 695 | ||||||||||||||
| Provisions, excluding employee entitlements |
||||||||||||||||||
| Carrying amount at beginning of the year |
574 | 695 | 291 | 422 | ||||||||||||||
| Provisions made during the year |
307 | 572 | 164 | 185 | ||||||||||||||
| Payments made during the year |
(206) | (514) | (72) | (172) | ||||||||||||||
| Transfer/release of provision |
(155) | (179) | (63) | (144) | ||||||||||||||
| Carrying amount at the end of the year |
520 | 574 | 320 | 291 | ||||||||||||||
|
1 The aggregate liability for employee entitlements largely comprises provisions for annual leave and long service leave.
2 Restructuring costs and surplus leased space provisions arise from activities related to material changes in the scope of business undertaken by the Group or the manner in which that business is undertaken and includes termination benefits. Costs relating to on-going activities are not provided for. Provision is made when the Group is demonstrably committed, it is probable that the costs will be incurred, though their timing is uncertain, and the costs can be reliably estimated.
3 Other provisions comprise various other provisions including loyalty programs, workers’ compensation, make-good provisions on leased premises and contingent liabilities recognised as part of a business combination.
29: Payables and Other Liabilities
|
| |||||||||||||||||
| Consolidated | The Company | |||||||||||||||||
|
2015 $m |
2014 $m |
2015 $m |
2014 $m |
|||||||||||||||
| Creditors |
1,661 | 1,335 | 871 | 477 | ||||||||||||||
| Accrued interest and unearned discounts |
1,938 | 2,096 | 1,448 | 1,592 | ||||||||||||||
| Defined benefits plan obligations |
59 | 39 | 14 | 15 | ||||||||||||||
| Accrued expenses |
1,368 | 1,394 | 889 | 1,022 | ||||||||||||||
| Securities sold short (classified as held for trading) |
2,568 | 3,870 | 1,978 | 3,556 | ||||||||||||||
| Liability for acceptances |
1,371 | 1,151 | 649 | 717 | ||||||||||||||
| Other liabilities |
1,401 | 1,099 | 445 | 303 | ||||||||||||||
| Total payables and other liabilities |
10,366 | 10,984 | 6,294 | 7,682 | ||||||||||||||
30: Share Capital
| The Company | ||||||||
| Numbers of issued shares | 2015 | 2014 | ||||||
| Ordinary shares each fully paid |
2,902,714,361 | 2,756,627,771 | ||||||
| Preference shares each fully paid |
– | 500,000 | ||||||
| Total number of issued shares |
2,902,714,361 | 2,757,127,771 | ||||||
NOTES TO THE FINANCIAL STATEMENTS 139
NOTES TO THE FINANCIAL STATEMENTS (continued)
30: Share Capital (continued)
ORDINARY SHARES
Ordinary shares have no par value and entitle holders to receive dividends payable to ordinary shareholders and to participate in the proceeds available to ordinary shareholders on winding up of the Company in proportion to the number of fully paid ordinary shares held.
On a show of hands every holder of fully paid ordinary shares present at a meeting in person or by proxy is entitled to one vote, and upon a poll one vote for each share held.
| The Company | ||||||||
| Numbers of issued shares | 2015 | 2014 | ||||||
| Balance at start of the year |
2,756,627,771 | 2,743,655,310 | ||||||
| Bonus option plan1,2 |
2,899,350 | 2,479,917 | ||||||
| Dividend reinvestment plan1,2 |
35,105,134 | 26,209,958 | ||||||
| Group share option scheme3 |
32,192 | 171,742 | ||||||
| Group employee share acquisition scheme3,4 |
– | – | ||||||
| Share placement and share purchase plan5 |
108,049,914 | – | ||||||
| Group share buyback6 |
– | (15,889,156) | ||||||
| Balance at end of year |
2,902,714,361 | 2,756,627,771 | ||||||
| Consolidated | The Company | |||||||||||||||||||||
| 2015 $m |
2014 $m |
2015 $m |
2014 $m |
|||||||||||||||||||
| Ordinary share capital |
||||||||||||||||||||||
| Balance at start of the year |
24,031 | 23,641 | 24,280 | 23,914 | ||||||||||||||||||
| Dividend reinvestment plan1,2 |
1,122 | 851 | 1,122 | 851 | ||||||||||||||||||
| Group share option scheme3 |
2 | 4 | 2 | 4 | ||||||||||||||||||
| Group employee share acquisition scheme3,4 |
1 | 11 | 1 | 11 | ||||||||||||||||||
| Share placement and share purchase plan5 |
3,206 | – | 3,206 | – | ||||||||||||||||||
| Group share buyback6 |
– | (500 | ) | – | (500) | |||||||||||||||||
| Treasury shares in Global Wealth7 |
5 | 24 | – | – | ||||||||||||||||||
| Balance at end of year |
28,367 | 24,031 | 28,611 | 24,280 | ||||||||||||||||||
| 1 | Refer to note 6 for details of plan. |
| 2 | The Company issued 28.7 million shares under the dividend reinvestment plan and bonus option plan for the 2015 interim dividend and 9.3 million shares for the 2014 final dividend (Sep14: 28.7 million shares for the respective interim and final dividends). |
| 3 | Refer to note 41 for details of plan. |
| 4 | Includes on-market purchase of shares for settlement of amounts due under share-based compensation plans. In addition, nil shares were issued during the year ended 30 September 2015 to the Group’s Employee Share Trust for settlement of amounts due under share-based compensation plans (2014: nil). As at 30 September 2015, there were 11,378,648 Treasury Shares outstanding (2014: 13,754,867). |
| 5 | The Company issued 80.8 million ordinary shares under the institutional share placement and 27.3 million ordinary shares under the share purchase plan. |
| 6 | Following the announcement of the 2013 final dividend the Company repurchased $500 million of ordinary shares via an on-market share buy-back resulting in 15.9 million ordinary shares being cancelled. |
| 7 | Treasury Shares in Global Wealth are shares held in statutory funds as assets backing policyholder liabilities. AWA Treasury Shares outstanding as at 30 September 2015 were 11,623,304 (2014: 11,761,993). |
PREFERENCE SHARES
Euro Trust Securities
| Consolidated | The Company | |||||||||||||||
| 2015 $m |
2014 $m |
2015 $m |
2014 $m |
|||||||||||||
| Preference share balance at start of year |
871 | 871 | 871 | 871 | ||||||||||||
| – Euro Trust Securities bought back |
(871 | ) | – | (871) | – | |||||||||||
| Preference share balance at end of the year |
– | 871 | – | 871 | ||||||||||||
|
NON-CONTROLLING INTERESTS |
||||||||||||||||
| Consolidated | ||||||||||||||||
| 2015 $m |
2014 $m |
|||||||||||||||
| Share capital |
55 | 46 | ||||||||||||||
| Retained earnings |
51 | 31 | ||||||||||||||
| Total non-controlling interests |
106 | 77 | ||||||||||||||
140
ANZ ANNUAL REPORT 2015
31: Reserves and Retained Earnings
| Consolidated | The Company1 | |||||||||||||||||||
| 2015 $m |
2014 $m |
2015 $m |
2014 $m | |||||||||||||||||
| a) Foreign currency translation reserve |
||||||||||||||||||||
| Balance at beginning of the year |
(605 | ) | (1,125 | ) | (290) | (539) | ||||||||||||||
| Transferred to income statement |
(4 | ) | 37 | (4) | 37 | |||||||||||||||
| Currency translation adjustments net of hedges |
1,728 | 483 | 878 | 212 | ||||||||||||||||
| Total foreign currency translation reserve |
1,119 | (605 | ) | 584 | (290) | |||||||||||||||
| b) Share option reserve2 |
||||||||||||||||||||
| Balance at beginning of the year |
60 | 55 | 60 | 55 | ||||||||||||||||
| Share-based payments/(exercises) |
16 | 13 | 16 | 13 | ||||||||||||||||
| Transfer of options/rights lapsed to retained earnings3 |
(8 | ) | (8 | ) | (8) | (8) | ||||||||||||||
| Total share option reserve |
68 | 60 | 68 | 60 | ||||||||||||||||
| c) Available-for-sale revaluation reserve |
||||||||||||||||||||
| Balance at beginning of the year |
160 | 121 | 50 | 37 | ||||||||||||||||
| Gain/(loss) recognised |
27 | 69 | (6) | 39 | ||||||||||||||||
| Transferred to income statement |
(49 | ) | (30 | ) | (34) | (26) | ||||||||||||||
| Total available-for-sale revaluation reserve |
138 | 160 | 10 | 50 | ||||||||||||||||
| d) Cash flow hedge reserve |
||||||||||||||||||||
| Balance at beginning of the year |
169 | 75 | 174 | 51 | ||||||||||||||||
| Gains/(loss) recognised |
111 | 117 | 103 | 117 | ||||||||||||||||
| Transferred to income statement |
(11 | ) | (23 | ) | – | 6 | ||||||||||||||
| Total cash flow hedging reserve |
269 | 169 | 277 | 174 | ||||||||||||||||
| e) Transactions with non-controlling interests reserve |
||||||||||||||||||||
| Balance at beginning of the year |
(23 | ) | (33 | ) | – | – | ||||||||||||||
| Transactions with non-controlling interests4 |
– | 10 | – | – | ||||||||||||||||
| Total transactions with non-controlling interests reserve |
(23 | ) | (23 | ) | – | – | ||||||||||||||
| Total reserves |
1,571 | (239 | ) | 939 | (6) | |||||||||||||||
| 1 | Comparatives have changed (refer note 45). |
| 2 | Further information about share-based payments to employees is disclosed in note 41. |
| 3 | The transfer of balances from the share option reserve to retained earnings represents items of a distributable nature. |
| 4 | The premium in excess of the book value paid by an associate to acquire an additional interest in its controlled entity from the non-controlling shareholder recognised in 2013 was released in 2014 as the associate no longer controls that entity. |
| Consolidated | The Company1 | |||||||||||||||||||
| 2015 $m |
2014 $m |
2015 $m |
2014 $m | |||||||||||||||||
|
Retained earnings |
||||||||||||||||||||
| Balance at beginning of the year |
24,544 | 21,936 | 17,557 | 15,826 | ||||||||||||||||
| Profit attributable to shareholders of the Company |
7,493 | 7,271 | 7,306 | 6,436 | ||||||||||||||||
| Transfer of options/rights lapsed from share option reserve2,3 |
8 | 8 | 8 | 8 | ||||||||||||||||
| Remeasurement gain/(loss) on defined benefit plans after tax |
(4 | ) | 32 | 20 | 6 | |||||||||||||||
| Fair value gain/loss attributable to changes in own credit risk of financial liabilities designated at fair value |
37 | (25 | ) | 37 | (25) | |||||||||||||||
| Dividend income on Treasury shares held within the Group’s life insurance statutory funds |
22 | 22 | – | – | ||||||||||||||||
| Ordinary share dividends paid |
(4,906 | ) | (4,694 | ) | (4,906) | (4,694) | ||||||||||||||
| Preference share dividends paid |
(1 | ) | (6 | ) | – | – | ||||||||||||||
| Foreign exchange gains on preference shares bought back4 |
116 | – | 116 | – | ||||||||||||||||
| Retained earnings at end of year |
27,309 | 24,544 | 20,138 | 17,557 | ||||||||||||||||
| Total reserves and retained earnings |
28,880 | 24,305 | 21,077 | 17,551 | ||||||||||||||||
| 1 | Comparatives have changed (refer note 45). |
| 2 | Further information about share-based payments to employees is disclosed in note 41. |
| 3 | The transfer of balances from the share option reserve to retained earnings represents items of a distributable nature. |
| 4 | The Euro Trust Securities were bought back by ANZ for cash at face value and cancelled on 15 December 2014. The foreign exchange gain between the issue date and 15 December 2014 was recognised directly in retained earnings. |
NOTES TO THE FINANCIAL STATEMENTS 141
NOTES TO THE FINANCIAL STATEMENTS (continued)
32: Capital Management
142
ANZ ANNUAL REPORT 2015
32: Capital Management (continued)
NOTES TO THE FINANCIAL STATEMENTS 143
NOTES TO FINANCIAL STATEMENTS (continued)
32: Capital Management (continued)
CAPITAL ADEQUACY
The table below provides the composition of capital used for regulatory purposes and capital adequacy ratios.
| 2015 $m |
2014 $m |
|||||||
|
Qualifying capital |
||||||||
| Tier 1 |
||||||||
| Shareholders’ equity and non-controlling interests |
57,353 | 49,284 | ||||||
| Prudential adjustments to shareholders equity |
(387) | (1,211) | ||||||
| Gross Common Equity Tier 1 Capital |
56,966 | 48,073 | ||||||
| Deductions |
(18,440) | (16,297) | ||||||
|
Common Equity Tier 1 Capital |
38,526 | 31,776 | ||||||
| Additional Tier 1 capital |
6,958 | 6,825 | ||||||
| Tier 1 capital |
45,484 | 38,601 | ||||||
| Tier 2 capital |
7,951 | 7,138 | ||||||
| Total qualifying capital |
53,435 | 45,739 | ||||||
|
Capital adequacy ratios |
||||||||
| Common Equity Tier 1 |
9.6% | 8.8% | ||||||
| Tier 1 |
11.3% | 10.7% | ||||||
| Tier 2 |
2.0% | 2.0% | ||||||
| Total |
13.3% | 12.7% | ||||||
| Risk Weighted Assets |
401,937 | 361,529 | ||||||
REGULATORY ENVIRONMENT – INSURANCE AND FUNDS MANAGEMENT BUSINESS
144
ANZ ANNUAL REPORT 2015
33: Shares in Controlled Entities
| Consolidated | The Company | |||||||||||||||
| 2015 $m |
2014 $m |
2015 $m |
2014 $m |
|||||||||||||
| Total shares in controlled entities |
– | – | 17,823 | 14,870 | ||||||||||||
DISPOSAL OF CONTROLLED ENTITIES
There were no material entities disposed of during the year ended 30 September, 2015.
On 4 July 2014 the Group disposed of its ownership interest in ANZ Trustees Limited. The contribution to Group profit after tax for the period (1 October 2013 to 4 July 2014) from ordinary activities was $3.7 million. Details of aggregate assets and liabilities of material controlled entities disposed of by the Group are as follows:
| Consolidated | The Company | |||||||||||||||
| 2015 $m |
2014 $m |
2015 $m |
2014 $m |
|||||||||||||
| Cash consideration received |
– | 156 | – | 156 | ||||||||||||
| Less: Balances of disposed cash and cash equivalents |
– | 11 | – | – | ||||||||||||
| Net cash consideration received |
– | 145 | – | 156 | ||||||||||||
| Less: Net assets disposed |
||||||||||||||||
| Shares in controlled entities |
– | – | – | (22) | ||||||||||||
| Other assets, including allocated goodwill |
– | (2) | – | – | ||||||||||||
| Payables and other liabilities |
– | 1 | – | – | ||||||||||||
| – | (1) | – | (22) | |||||||||||||
| Less: Provisions for warranties, indemnities and direct costs relating to disposal |
– | (19) | – | (19) | ||||||||||||
| Gain on disposal |
– | 125 | – | 115 | ||||||||||||
ACQUISITION OF CONTROLLED ENTITIES
ANZ Bank (Thai) Public Company Limited was incorporated in Thailand on 27 November 2014 for the purpose of conducting banking activities.
There were no material controlled entities acquired during the year ended 30 September 2015 or the year ended 30 September 2014.
NOTES TO THE FINANCIAL STATEMENTS 145
NOTES TO THE FINANCIAL STATEMENTS (continued)
34: Controlled Entities
| Incorporated in | Nature of business | |||||||
| Ultimate parent of the Group |
||||||||
| Australia and New Zealand Banking Group Limited |
Australia | Banking | ||||||
| All controlled entities are 100% owned unless otherwise noted. |
||||||||
| The material controlled entities of the Group are: |
||||||||
| ANZ Bank (Lao) Limited1 |
Laos | Banking | ||||||
| ANZ Bank (Taiwan) Limited1 |
Taiwan | Banking | ||||||
| ANZ Bank (Vietnam) Limited1 |
Vietnam | Banking | ||||||
| ANZ Capel Court Limited |
Australia | Securitisation Manager | ||||||
| ANZ Capital Hedging Pty Ltd |
Australia | Hedging | ||||||
| ANZ Commodity Trading Pty Ltd |
Australia | Finance | ||||||
| ANZ Funds Pty Ltd |
Australia | Holding Company | ||||||
| ANZ Bank (Europe) Limited1 |
United Kingdom | Banking | ||||||
| ANZ Bank (Kiribati) Limited1,2 |
Kiribati | Banking | ||||||
| ANZ Bank (Samoa) Limited1 |
Samoa | Banking | ||||||
| ANZ Bank (Thai) Public Company Limited1 |
Thailand | Banking | ||||||
| ANZcover Insurance Private Ltd1 |
Singapore | Captive-Insurance | ||||||
| ANZ Holdings (New Zealand) Limited1 |
New Zealand | Holding Company | ||||||
| ANZ Bank New Zealand Limited1 |
New Zealand | Banking | ||||||
| ANZ Investment Services (New Zealand) Limited1 |
New Zealand | Funds Management | ||||||
| ANZ New Zealand (Int’l) Limited1 |
New Zealand | Finance | ||||||
| ANZNZ Covered Bond Trust1 |
New Zealand | Finance | ||||||
| ANZ Wealth New Zealand Limited1 |
New Zealand | Holding Company | ||||||
| ANZ New Zealand Investments Ltd |
New Zealand | Funds Management | ||||||
| OnePath Life (NZ) Limited1 |
New Zealand | Insurance | ||||||
| Arawata Assets Limited1 |
New Zealand | Property Holding Company | ||||||
| UDC Finance Limited1 |
New Zealand | Finance | ||||||
| ANZ International (Hong Kong) Limited1 |
Hong Kong | Holding Company | ||||||
| ANZ Asia Limited1 |
Hong Kong | Banking | ||||||
| ANZ Bank (Vanuatu) Limited3 |
Vanuatu | Banking | ||||||
| ANZ International Private Limited1 |
Singapore | Holding Company | ||||||
| ANZ Singapore Limited1 |
Singapore | Merchant Banking | ||||||
| ANZ Royal Bank (Cambodia) Limited1,2 |
Cambodia | Banking | ||||||
| Votraint No. 1103 Pty Ltd |
Australia | Investment | ||||||
| ANZ Lenders Mortgage Insurance Pty Ltd |
Australia | Mortgage Insurance | ||||||
| ANZ Residential Covered Bond Trust |
Australia | Finance | ||||||
| ANZ Wealth Australia Limited |
Australia | Holding Company | ||||||
| OnePath Custodians Pty Limited |
Australia | Trustee | ||||||
| OnePath Funds Management Limited |
Australia | Funds Management | ||||||
| OnePath General Insurance Pty Limited |
Australia | Insurance | ||||||
| OnePath Life Australia Holdings Pty Limited |
Australia | Holding Company | ||||||
| OnePath Life Limited |
Australia | Insurance | ||||||
| Australia and New Zealand Banking Group (PNG) Limited1 |
Papua New Guinea | Banking | ||||||
| Australia and New Zealand Bank (China) Company Limited1 |
China | Banking | ||||||
| Chongqing Liangping ANZ Rural Bank Company Limited1 |
China | Banking | ||||||
| Citizens Bancorp4 |
Guam | Holding Company | ||||||
| ANZ Guam Inc.4 |
Guam | Banking | ||||||
| ANZ Finance Guam, Inc.4 |
Guam | Finance | ||||||
| Esanda Finance Corporation Limited |
Australia | General Finance | ||||||
| E*TRADE Australia Limited |
Australia | Holding Company | ||||||
| E*TRADE Australia Securities Limited |
Australia | Online Stockbroking | ||||||
| PT Bank ANZ Indonesia1,2 |
Indonesia | Banking | ||||||
| 1 | Audited by overseas KPMG firms. |
| 2 | Non-controlling interests hold ordinary shares or units in the controlled entities listed above as follows: ANZ Bank (Kiribati) Limited – 150,000 $1 ordinary shares (25%) (2014: 150,000 $1 ordinary shares (25%)); PT Bank ANZ Indonesia – 16,500 IDR 1 million shares (1%) (2014: 16,500 IDR 1 million shares (1%)); ANZ Royal Bank (Cambodia) Limited – 319,500 USD100 ordinary shares (45%) (2014: 319,500 USD100 ordinary shares (45%)). |
| 3 | Audited by Hawkes Law. |
| 4 | Audited by Deloitte Guam. |
146
ANZ ANNUAL REPORT 2015
35: Investments in associates
Significant associates of the Group are as follows:
| Consolidated | The Company1 | |||||||||||||||
| 2015 $m |
2014 $m |
2015 $m |
2014 $m |
|||||||||||||
| AMMB Holdings Berhad2 |
1,424 | 1,465 | – | – | ||||||||||||
| PT Bank Pan Indonesia3 |
904 | 795 | – | – | ||||||||||||
| Shanghai Rural Commercial Bank4 |
1,981 | 1,443 | 1,981 | 1,443 | ||||||||||||
| Bank of Tianjin5 |
1,021 | 710 | 1,021 | 710 | ||||||||||||
| Other individually immaterial associates (in aggregate) |
110 | 169 | 16 | 13 | ||||||||||||
| Total carrying value of associates |
5,440 | 4,582 | 3,018 | 2,166 | ||||||||||||
| 1 | Comparatives have changed. Refer to note 45. |
| 2 | AMMB Holdings Berhad (AmBank Group) provides a full suite of banking and insurance products and services in Malaysia and is listed on the Bursa Malaysia. This investment relates directly to the Group’s Asia Pacific growth strategy. |
| 3 | PT Bank Pan Indonesia is a consumer and business bank in Indonesia and is listed on the Jakarta stock exchange. This investment relates directly to the Group’s Asia Pacific growth strategy. |
| 4 | Shanghai Rural Commercial Bank is a rural commercial bank in China. This investment relates directly to the Group’s Asia Pacific growth strategy. |
| 5 | Bank of Tianjin operates as a commercial bank in China offering products such as deposit accounts and loans. This investment relates directly to the Group’s Asia Pacific growth strategy. Significant influence is established via representation on the Board of Directors. |
a) Financial information on material associates
Set out below is the summarised financial information of each associate that is material to the Group. The summarised financial information is based on the associates’ IFRS financial information.
| AMMB Holdings Berhad |
PT Bank Pan Indonesia |
Shanghai Rural Commercial Bank |
Bank of Tianjin | |||||||||||||||||||||||||||||
| Principal place of business and country of incorporation | Malaysia | Indonesia | Peoples’ Republic of China |
Peoples’ Republic of China |
||||||||||||||||||||||||||||
| Method of measurement in the Group’s balance sheet | Equity method | Equity method | Equity method | Equity method | ||||||||||||||||||||||||||||
| 2015 $m |
2014 $m |
2015 $m |
2014 $m |
2015 $m |
2014 $m |
2015 $m |
2014 $m |
|||||||||||||||||||||||||
| Summarised results |
||||||||||||||||||||||||||||||||
| Revenue |
2,840 | 3,356 | 822 | 688 | 3,058 | 2,331 | 2,168 | 1,637 | ||||||||||||||||||||||||
| Profit/(loss) |
583 | 670 | 225 | 238 | 1,117 | 731 | 1,094 | 619 | ||||||||||||||||||||||||
| Other comprehensive income/(loss) |
54 | (14 | ) | 2 | 6 | 175 | (78 | ) | 85 | (62 | ) | |||||||||||||||||||||
| Total comprehensive income |
637 | 656 | 227 | 244 | 1,292 | 653 | 1,179 | 557 | ||||||||||||||||||||||||
| Less: Total comprehensive income attributable to non–controlling interests |
30 | 20 | 16 | 20 | 33 | 18 | 2 | 3 | ||||||||||||||||||||||||
| Total comprehensive income attributable to owners of associate |
607 | 636 | 211 | 224 | 1,259 | 635 | 1,177 | 554 | ||||||||||||||||||||||||
| Summarised financial position |
||||||||||||||||||||||||||||||||
| Total assets1 |
43,668 | 45,090 | 17,244 | 16,011 | 128,511 | 85,056 | 117,073 | 85,683 | ||||||||||||||||||||||||
| Total liabilities1 |
37,374 | 38,591 | 14,684 | 13,776 | 118,324 | 77,634 | 109,803 | 80,627 | ||||||||||||||||||||||||
| Total Net assets1 |
6,294 | 6,499 | 2,560 | 2,235 | 10,187 | 7,422 | 7,270 | 5,056 | ||||||||||||||||||||||||
| Less: Non–controlling interests of associate |
307 | 338 | 233 | 186 | 283 | 208 | 50 | 40 | ||||||||||||||||||||||||
| Net assets attributable to owners of associate |
5,987 | 6,161 | 2,327 | 2,049 | 9,904 | 7,214 | 7,220 | 5,016 | ||||||||||||||||||||||||
| Reconciliation to carrying amount of Group’s interest in associate |
||||||||||||||||||||||||||||||||
| Proportion of ownership interest held by the Group |
24% | 24% | 39% | 39% | 20% | 20% | 14% | 14% | ||||||||||||||||||||||||
| Carrying amount at the beginning of the year |
1,465 | 1,282 | 795 | 692 | 1,443 | 1,261 | 710 | 601 | ||||||||||||||||||||||||
| Group’s share of total comprehensive income |
152 | 151 | 82 | 87 | 251 | 127 | 167 | 86 | ||||||||||||||||||||||||
| Dividends received from associate |
(66 | ) | (59 | ) | – | – | (38 | ) | (24 | ) | (21 | ) | (19 | ) | ||||||||||||||||||
| Group’s share of other reserve movements of associate and FCTR adjustments |
(127 | ) | 91 | 27 | 16 | 325 | 79 | 165 | 42 | |||||||||||||||||||||||
| Carrying amount at the end of the year |
1,424 | 1,465 | 904 | 795 | 1,981 | 1,443 | 1,021 | 710 | ||||||||||||||||||||||||
| Market Value of Group’s investment in associate2 |
1,048 | 1,720 | 805 | 855 | n/a | n/a | n/a | n/a | ||||||||||||||||||||||||
| 1 | Includes market value adjustments (including goodwill) made by the Group at the time of acquisition and adjustments for any differences in accounting policies. |
| 2 | Applicable to those investments in associates where there are published price quotations. Market Value is based on a price per share and does not include any adjustments for holding size. |
At 30 September 2015, although AMMB Holdings Berhad and PT Bank Pan Indonesia market value (based on share price) was below its carrying value, no impairment was recognised as the carrying amount was supported by its value in use.
NOTES TO THE FINANCIAL STATEMENTS 147
NOTES TO THE FINANCIAL STATEMENTS (continued)
35: Associates (continued)
The value in use calculation is sensitive to a number of key assumptions, including future profitability levels, capital levels, long term growth rates and discount rates. The key assumptions used in the value in use calculation are outlined below:
| As at 30 Sep 2015 | ||||||||
| AMMB | PT Panin | |||||||
| Pre-tax discount rate |
11.0% | 12.7% | ||||||
| Terminal growth rate |
5.5% | 5.7% | ||||||
| Expected NPAT growth (5 years average) |
2.1% | 5.1% | ||||||
| Core Equity tier 1 rate |
10.0% | 10.0% | ||||||
b) Other associates1
The following table summarises, in aggregate, the Group’s interest in associates that are considered individually immaterial for separate disclosure.
| 2015 | 2014 | |||||||
| $m | $m | |||||||
| Group’s share of profit/(loss) |
36 | 39 | ||||||
| Group’s share of other comprehensive income |
(4 | ) | 2 | |||||
| Group’s share of total comprehensive income |
32 | 41 | ||||||
| Carrying amount |
110 | 169 | ||||||
| 1 | Includes an interest in joint ventures of $2 million at 30 September 2015. |
36: Structured Entities
| 148 |
ANZ ANNUAL REPORT 2015
36: Structured Entities (continued)
Interest in unconsolidated structured entities
| Securitisation | Structured finance | Investment funds | Total | |||||||||||||||||||||||||||||
| Consolidated at 30 September 2015 | 2015 $m |
2014 $m |
2015 $m |
2014 $m |
2015 $m |
2014 $m |
2015 $m |
2014 $m |
||||||||||||||||||||||||
| Available-for-sale assets |
3,849 | 3,603 | – | – | – | – | 3,849 | 3,603 | ||||||||||||||||||||||||
| Investment backing policy liabilities |
– | – | – | – | 165 | 227 | 165 | 227 | ||||||||||||||||||||||||
| Loans and advances |
6,825 | 4,958 | 37 | 39 | – | – | 6,862 | 4,997 | ||||||||||||||||||||||||
| Total on-balance sheet |
10,674 | 8,561 | 37 | 39 | 165 | 227 | 10,876 | 8,827 | ||||||||||||||||||||||||
| Off-balance sheet interests |
||||||||||||||||||||||||||||||||
| Commitments (facilities undrawn) |
2,610 | 3,520 | – | – | – | – | 2,610 | 3,520 | ||||||||||||||||||||||||
| Total off-balance sheet |
2,610 | 3,520 | – | – | – | – | 2,610 | 3,520 | ||||||||||||||||||||||||
| Maximum exposure to loss |
13,284 | 12,081 | 37 | 39 | 165 | 227 | 13,486 | 12,347 | ||||||||||||||||||||||||
NOTES TO THE FINANCIAL STATEMENTS 149
NOTES TO THE FINANCIAL STATEMENTS (continued)
37: Transfers of Financial Assets
| Consolidated | The Company | |||||||||||||||
| 2015 $m |
2014 $m |
2015 $m |
2014 $m |
|||||||||||||
| Securitisations1,2 |
||||||||||||||||
| Current carrying amount of assets transferred |
– | – | 73,559 | 67,974 | ||||||||||||
| Carrying amount of associated liabilities |
– | – | 73,559 | 67,974 | ||||||||||||
| Covered bonds1,3 |
||||||||||||||||
| Current carrying amount of assets transferred |
– | – | 23,508 | 20,738 | ||||||||||||
| Carrying amount of associated liabilities3 |
– | – | 23,508 | 20,738 | ||||||||||||
| Repurchase agreements |
||||||||||||||||
| Current carrying amount of assets transferred |
13,975 | 8,736 | 13,476 | 8,568 | ||||||||||||
| Carrying amount of associated liabilities |
13,731 | 8,641 | 13,255 | 8,473 | ||||||||||||
| Structured Finance Arrangements |
||||||||||||||||
| Current carrying amount of assets transferred |
766 | 169 | 627 | 31 | ||||||||||||
| Carrying amount of associated liabilities |
759 | 158 | 627 | 31 | ||||||||||||
| 1 | The consolidated balances are nil as the Company balances relate to transfers to internal structured entities. |
| 2 | The securitisation noteholders have recourse only to the pool of residential mortgages which have been securitised. The carrying value of securitised assets and the associated liabilities approximates their fair value. |
| 3 | The total covered bonds issued by the Group to external investors at 30 September 2015 was $27,013 million (2014: $20,561 million), secured by $30,368 million (2014 $27,241 million) of specified residential mortgages. The associated liability represents the Company’s liability to the covered bond SE. Covered bonds issued by the Company to external investors at 30 September 2015 were $22,164 million (2014: $16,969 million). |
150
ANZ ANNUAL REPORT 2015
38: Life Insurance Business
The Group conducts its life insurance business through OnePath Life Limited and OnePath Life (NZ) Limited. This note is intended to provide disclosures in relation to the life insurance businesses conducted through these controlled entities.
CAPITAL ADEQUACY OF LIFE INSURER
Australian life insurers are required to hold reserves in excess of policy liabilities to support capital requirements under the Life Insurance Act (Life Act).
The life insurance business in New Zealand is not governed by the Life Act as this is a foreign domiciled life insurance company. The company is however required to meet similar capital requirements.
The summarised capital information below, in respect of capital requirements under the Life Act, has been extracted from the financial statements prepared by OnePath Life Limited. For detailed capital adequacy information on a statutory fund basis, users of this annual financial report should refer to the separate financial statements prepared by OnePath Life Limited.
| OnePath Life Limited | ||||||||
| 2015 $m |
2014 $m |
|||||||
| Capital Base |
538 | 524 | ||||||
| Prescribed Capital Amount (PCA) |
316 | 295 | ||||||
| Capital Adequacy Multiple (times) |
1.69 | 1.78 | ||||||
LIFE INSURANCE BUSINESS PROFIT ANALYSIS
| Life insurance contracts |
Life investment contracts |
Consolidated | ||||||||||||||||||||||
| 2015 $m |
2014 $m |
2015 $m |
2014 $m |
2015 $m |
2014 $m |
|||||||||||||||||||
| Net shareholder profit after income tax |
386 | 235 | 143 | 114 | 529 | 349 | ||||||||||||||||||
| Net shareholder profit after income tax is represented by: |
||||||||||||||||||||||||
| Emergence of planned profit margins |
198 | 181 | 93 | 87 | 291 | 268 | ||||||||||||||||||
| Difference between actual and assumed experience |
7 | (21 | ) | 29 | 12 | 36 | (9 | ) | ||||||||||||||||
| (Loss recognition)/reversal of previous losses on groups of related products |
– | – | – | – | – | – | ||||||||||||||||||
| Investment earnings on retained profits and capital |
181 | 75 | 21 | 15 | 202 | 90 | ||||||||||||||||||
| Changes in assumptions |
– | – | – | – | – | |||||||||||||||||||
| Net policyholder profit in statutory funds after income tax |
18 | 16 | – | – | 18 | 16 | ||||||||||||||||||
| Net policyholder profit in statutory funds after income tax is represented by: |
||||||||||||||||||||||||
| Emergence of planned profits |
14 | 12 | – | – | 14 | 12 | ||||||||||||||||||
| Investment earnings on retained profits and experience profits |
4 | 4 | – | – | 4 | 4 | ||||||||||||||||||
INVESTMENTS RELATING TO LIFE INSURANCE BUSINESS
| Consolidated | ||||||||
| 2015 $m |
2014 $m |
|||||||
| Equity securities |
10,898 | 10,528 | ||||||
| Debt securities |
6,460 | 6,503 | ||||||
| Investments in managed investment schemes |
16,781 | 15,954 | ||||||
| Derivative financial assets/(liability) |
(81 | ) | (203 | ) | ||||
| Cash and cash equivalents |
762 | 797 | ||||||
| Total investments backing policy liabilities designated at fair value through profit or loss1 |
34,820 | 33,579 | ||||||
| 1 | This includes $3,291 million (2014: $3,181 million) in respect of investments relating to external unit holders. In addition, the investment balance has been reduced by $4,636 million (2014: $4,779 million) in respect of the elimination of intercompany balances and Treasury Shares. |
Investments held in statutory funds can only be used to meet the liabilities and expenses of that fund, or to make profit distributions when solvency and capital adequacy requirements of the Life Act and Insurance (Prudential Supervision) Act 2010 are met. Accordingly, with the exception of permitted profit distributions, the investments held in the statutory funds are not available for use by other parties of the Group.
NOTES TO THE FINANCIAL STATEMENTS 151
NOTES TO THE FINANCIAL STATEMENTS (continued)
38: Life Insurance Business (continued)
INSURANCE POLICY LIABILITIES
a) Policy liabilities
| Consolidated | ||||||||
| 2015 $m |
2014 $m |
|||||||
| Life insurance contract liabilities |
||||||||
| Best estimate liabilities |
||||||||
| Value of future policy benefits |
9,290 | 6,854 | ||||||
| Value of future expenses |
2,204 | 2,024 | ||||||
| Value of future premium |
(14,086 | ) | (10,697 | ) | ||||
| Value of declared bonuses |
15 | 15 | ||||||
| Value of future profits |
||||||||
| Policyholder bonus |
23 | 27 | ||||||
| Shareholder profit margin |
2,232 | 1,655 | ||||||
| Business valued by non-projection method |
4 | 5 | ||||||
| Total insurance contract liabilities |
(318 | ) | (117 | ) | ||||
| Unvested policyholder benefits |
41 | 42 | ||||||
| Liabilities ceded under reinsurance contracts |
649 | 591 | ||||||
| Total life insurance contract liabilities |
372 | 516 | ||||||
| Life investment contract liabilities1,2 |
35,029 | 34,038 | ||||||
| Total policy liabilities |
35,401 | 34,554 | ||||||
| 1 | Designated at fair value through profit or loss. |
| 2 | Life investment contract liabilities that relate to a capital guaranteed element is $1,354 million (2014: $1,526 million). Life investment contract liabilities subject to investment performance guarantees is $842 million (2014: $960 million). |
b) Reconciliation of movements in policy liabilities
| Life investment contracts |
Life insurance contracts |
Consolidated | ||||||||||||||||||||||
| 2015 $m |
2014 $m |
2015 $m |
2014 $m |
2015 $m |
2014 $m |
|||||||||||||||||||
| Policy liabilities |
||||||||||||||||||||||||
| Gross liability brought forward |
34,038 | 31,703 | 516 | 685 | 34,554 | 32,388 | ||||||||||||||||||
| Movements in policy liabilities reflected in the income statement |
1,520 | 2,388 | (144 | ) | (169 | ) | 1,376 | 2,219 | ||||||||||||||||
| Deposit premium recognised as a change in life investment contract liabilities |
5,165 | 5,311 | – | – | 5,165 | 5,311 | ||||||||||||||||||
| Fees recognised as a change in life investment contract liabilities |
(463 | ) | (462 | ) | – | – | (463 | ) | (462 | ) | ||||||||||||||
| Withdrawal recognised as a change in other life investment contract liabilities |
(5,231 | ) | (4,902 | ) | – | – | (5,231 | ) | (4,902 | ) | ||||||||||||||
| Gross policy liabilities closing balance |
35,029 | 34,038 | 372 | 516 | 35,401 | 34,554 | ||||||||||||||||||
| Liabilities ceded under reinsurance1 |
||||||||||||||||||||||||
| Balance brought forward |
– | – | 591 | 519 | 591 | 519 | ||||||||||||||||||
| Movements in reinsurance assets reflected in the income statement |
– | – | 58 | 72 | 58 | 72 | ||||||||||||||||||
| Closing balance |
– | – | 649 | 591 | 649 | 591 | ||||||||||||||||||
| Total policy liabilities net of reinsurance asset |
35,029 | 34,038 | (277 | ) | (75 | ) | 34,752 | 33,963 | ||||||||||||||||
| 1 | Liabilities ceded under reinsurance contracts are shown as ‘other assets’. |
| 152 |
ANZ ANNUAL REPORT 2015
38: Life Insurance Business (continued)
Policy liabilities have been calculated in accordance with Prudential Standard LPS 340 Valuation of Policy Liabilities issued by the APRA in accordance with the requirements of the Life Act. For life insurance contracts the Standard requires the policy liabilities to be calculated in a way which allows for the systematic release of planned margins as services are provided to policyholders.
The profit carriers used to achieve the systematic release of planned margins are based on the product groups.
Critical assumptions
The valuation of the policy liabilities is dependant on a number of variables including interest rate, equity prices, future expenses, mortality, morbidity and inflation. The critical estimates and judgements used in determining the policy liabilities is set out in note 2 (vi) on page 76.
Sensitivity analysis – life insurance contracts
The Group conducts sensitivity analysis to quantify the exposure of the life insurance contracts to risk of changes in the key underlying variables such as interest rate, equity prices, mortality, morbidity and inflation. The valuations included in the reported results and the Group’s best estimate of future performance is calculated using certain assumptions about these variables. The movement in any key variable will impact the performance and net assets of the Group and as such represents a risk. The table below illustrates how changes in key assumptions would impact the reported profit, insurance contract policy liabilities and equity at 30 September 2015.
| Variable
|
Impact of movement in underlying variable
|
Change in
|
Profit/(loss)
|
Insurance
|
Equity
|
|||||||||||||
| % change | $m | $m | $m | |||||||||||||||
| Market interest rates |
A change in market interest rates affects the value placed on future cash flows. This changes profit and shareholder equity. |
|
-1% +1% |
|
|
69 (55 |
) |
|
(97 77 |
)
|
|
69 (55) |
| |||||
| Expense risk |
An increase in the level or inflationary growth of expenses over assumed levels will decrease profit and shareholder equity. |
|
-10% +10% |
|
|
– – |
|
|
– – |
|
|
– – |
| |||||
| Mortality risk |
Greater mortality rates would lead to higher levels of claims occurring, increasing associated claims cost and therefore reducing profit and shareholder equity. |
|
-10% +10% |
|
|
(4 – |
)
|
|
5 – |
|
|
(4) – |
| |||||
| Morbidity risk |
The cost of health-related claims depends on both the incidence of policyholders becoming ill and the duration which they remain ill. Higher than expected incidence and duration would increase claim costs, reducing profit and shareholder equity. |
|
-10% +10% |
|
|
– (30 |
) |
|
– 43 |
|
|
– (30) |
| |||||
| Discontinuance risk |
An increase in discontinuance rates at earlier durations has a negative effect as it affects the ability to recover acquisition expenses and commissions. |
|
-10% +10% |
|
|
– – |
|
|
– – |
|
|
– – |
| |||||
LIFE INSURANCE RISK
NOTES TO THE FINANCIAL STATEMENTS 153
NOTES TO THE FINANCIAL STATEMENTS (continued)
38: Life Insurance Business (continued)
39: Fiduciary Activities
The Group provides fiduciary services to third parties including custody, nominee, trustee, administration and investment management services predominantly through the Global Wealth segment. This involves the Group holding assets on behalf of third parties and making decisions regarding the purchase and sale of financial instruments. In circumstances where ANZ is not the beneficial owner or does not control the assets, they are not recognised in these financial statements.
40: Superannuation and Post Employment Benefit Obligations
The Group participates in a number of pension, superannuation and post-retirement medical benefit schemes throughout the world. The Group may be obliged to contribute to the schemes as a consequence of legislation and/or provisions of the trust deeds. Set out below is a summary of amounts recognised in these financial statements in respect of the defined benefit sections of these schemes:
| Consolidated | The Company | |||||||||||||||
| 2015 $m |
2014 $m |
2015 $m |
2014 $m |
|||||||||||||
| Amount recognised in the income statement |
||||||||||||||||
| Current service cost |
7 | 6 | 3 | 3 | ||||||||||||
| Administration costs |
1 | 1 | 1 | 1 | ||||||||||||
| Net interest cost |
(2 | ) | 1 | (2 | ) | – | ||||||||||
| Adjustment for contributions tax |
1 | 2 | – | – | ||||||||||||
| Total included in personnel expenses |
7 | 10 | 2 | 4 | ||||||||||||
| Amounts recognised in other comprehensive income (pre-tax) |
||||||||||||||||
| Remeasurement (gains)/losses incurred during the year and recognised directly in retained earnings |
6 | (43 | ) | (24 | ) | (8) | ||||||||||
| Cumulative remeasurement (gains)/losses recognised directly in retained earnings |
218 | 212 | 193 | 217 | ||||||||||||
| Defined benefit obligation and scheme assets |
||||||||||||||||
| Present value of funded defined benefit obligation1 |
(1,538 | ) | (1,327 | ) | (1,322 | ) | (1,151) | |||||||||
| Fair value of scheme assets |
1,623 | 1,335 | 1,452 | 1,183 | ||||||||||||
| Total |
85 | 8 | 130 | 32 | ||||||||||||
| As represented in the balance sheet |
||||||||||||||||
| Net liabilities arising from defined benefit obligations included in payables and other liabilities |
(59 | ) | (39 | ) | (14 | ) | (15) | |||||||||
| Net assets arising from defined benefit obligations included in other assets |
144 | 47 | 144 | 47 | ||||||||||||
| Total |
85 | 8 | 130 | 32 | ||||||||||||
| 1 | The Group’s defined benefit obligation relates solely to funded arrangements. The liability relates predominantly to pension payments to retired members or their dependants. The basis of calculation is set out in note 1 F(vii). |
154
ANZ ANNUAL REPORT 2015
40: Superannuation and Post Employment Benefit Obligations (continued)
| Consolidated | The Company | |||||||||||||||
| 2015 $m |
2014 $m |
2015 $m |
2014 $m |
|||||||||||||
| Movements in the present value of the defined benefit obligation |
||||||||||||||||
| Opening defined benefit obligation |
1,327 | 1,265 | 1,151 | 1,047 | ||||||||||||
| Current service cost |
7 | 6 | 3 | 3 | ||||||||||||
| Interest cost |
54 | 54 | 48 | 45 | ||||||||||||
| Contributions from scheme participants |
– | – | – | – | ||||||||||||
| Remeasurements: |
||||||||||||||||
| Actuarial (gains)/losses – experience |
(22 | ) | (4 | ) | (20 | ) | 1 | |||||||||
| Actuarial (gains)/losses – change in demographic assumptions |
9 | (7 | ) | – | – | |||||||||||
| Actuarial (gains)/losses – change in financial assumptions |
36 | 33 | 18 | 35 | ||||||||||||
| Actuarial (gains)/losses – change in ESCT |
10 | (10 | ) | – | – | |||||||||||
| Curtailments |
– | – | – | – | ||||||||||||
| Settlements |
– | – | – | – | ||||||||||||
| Exchange difference on foreign schemes |
187 | 74 | 182 | 71 | ||||||||||||
| Benefits paid |
(70 | ) | (84 | ) | (60 | ) | (51) | |||||||||
| Closing defined benefit obligation |
1,538 | 1,327 | 1,322 | 1,151 | ||||||||||||
| Movements in the fair value of the scheme assets |
||||||||||||||||
| Opening fair value of scheme assets |
1,335 | 1,174 | 1,183 | 1,018 | ||||||||||||
| Interest income |
56 | 53 | 50 | 45 | ||||||||||||
| Return on scheme assets excluding amounts included in interest income |
27 | 55 | 22 | 44 | ||||||||||||
| Contributions from the employer |
79 | 66 | 68 | 57 | ||||||||||||
| Contributions from scheme participants |
– | – | – | – | ||||||||||||
| Benefits paid |
(70 | ) | (84 | ) | (60 | ) | (51) | |||||||||
| Administrative costs paid |
(1 | ) | (1 | ) | (1 | ) | (1) | |||||||||
| Settlements |
– | – | – | – | ||||||||||||
| Exchange difference on foreign schemes |
197 | 72 | 190 | 71 | ||||||||||||
| Closing fair value of scheme assets1 |
1,623 | 1,335 | 1,452 | 1,183 | ||||||||||||
| 1 | Scheme assets include the following financial instruments issued by the Group: cash and short-term instruments $1.7 million (September 2014: $1.7 million), fixed interest securities $0.5 million (September 2014: $0.4 million) and equities nil (September 2014: $0.1 million). |
| Consolidated | The Company | |||||||||||||||||||||||
| Quoted $m |
Unquoted $m |
Value $m |
Quoted $m |
Unquoted $m |
Value $m |
|||||||||||||||||||
| Composition of scheme assets |
||||||||||||||||||||||||
| 2015 |
||||||||||||||||||||||||
| Equities |
198 | – | 198 | 193 | – | 193 | ||||||||||||||||||
| Debt securities |
– | 35 | 35 | – | 34 | 34 | ||||||||||||||||||
| Pooled investment funds |
249 | 1,133 | 1,382 | 157 | 1,060 | 1,217 | ||||||||||||||||||
| Property |
– | 1 | 1 | – | 1 | 1 | ||||||||||||||||||
| Cash and equivalents |
6 | – | 6 | 6 | – | 6 | ||||||||||||||||||
| Other |
1 | – | 1 | 1 | – | 1 | ||||||||||||||||||
| Total at the end of the year |
454 | 1,169 | 1,623 | 357 | 1,095 | 1,452 | ||||||||||||||||||
| 2014 |
||||||||||||||||||||||||
| Equities |
184 | – | 184 | 180 | – | 180 | ||||||||||||||||||
| Debt securities |
– | 276 | 276 | – | 270 | 270 | ||||||||||||||||||
| Pooled investment funds |
240 | 612 | 852 | 153 | 558 | 711 | ||||||||||||||||||
| Property |
– | 1 | 1 | – | 1 | 1 | ||||||||||||||||||
| Cash and equivalents |
13 | – | 13 | 13 | – | 13 | ||||||||||||||||||
| Other |
9 | – | 9 | 8 | – | 8 | ||||||||||||||||||
| Total at the end of the year |
446 | 889 | 1,335 | 354 | 829 | 1,183 | ||||||||||||||||||
NOTES TO THE FINANCIAL STATEMENTS 155
NOTES TO THE FINANCIAL STATEMENTS (continued)
40: Superannuation and Post Employment Benefit Obligations (continued)
| Consolidated | The Company | |||||||||||||||||
| 2015 | 2014 | 2015 | 2014 | |||||||||||||||
| Actuarial assumptions used to determine the present value of the defined benefit obligation for the main defined benefit sections |
||||||||||||||||||
| Discount rate (% p.a.) |
3.2 – 3.7 | 3.6 – 4.3 | 3.7 | 3.6 – 4.0 | ||||||||||||||
| Future salary increases (% p.a.) |
2.5 – 3.5 | 2.5 – 3.7 | 3.5 | 3.7 | ||||||||||||||
| Future pension indexation |
||||||||||||||||||
| – In payment (% p.a.) |
2.2 – 3.0 | 2.2 – 3.2 | 2.5 – 3.0 | 2.5 – 3.2 | ||||||||||||||
| – In deferment (% p.a.) |
2.0 | 2.3 | 2.0 | 2.3 | ||||||||||||||
| Life expectancy at age 60 for current pensioners |
||||||||||||||||||
| – Males (years) |
22.6 – 28.4 | 22.6 – 28.4 | 22.6 – 28.4 | 22.6 – 28.4 | ||||||||||||||
| – Females (years) |
26.3 – 30.7 | 26.3 – 30.5 | 26.3 – 30.5 | 26.3 – 30.5 | ||||||||||||||
The weighted average duration of the benefit payments reflected in the defined benefit obligation is 16.5 years (2014: 16.2 years) for Consolidated and 16.3 years (2014: 16.3 years) for the Company.
| Consolidated | The Company | |||||||||||||||||||||||||||||||
| Impact on defined
|
Impact on defined
|
Impact on defined
|
Impact on defined
|
|||||||||||||||||||||||||||||
| Increase/(decrease) | Increase/(decrease) | Increase/(decrease) | Increase/(decrease) | |||||||||||||||||||||||||||||
| Sensitivity analysis | % | $m | % | $m | % | $m | % | $m | ||||||||||||||||||||||||
| Changes in actuarial assumptions |
||||||||||||||||||||||||||||||||
| 0.5% increase in discount rate |
(7.7 | ) | (119 | ) | (7.6 | ) | (101 | ) | (8.3 | ) | (109 | ) | (8.2 | ) | (94 | ) | ||||||||||||||||
| 0.5% increase in pension indexation |
7.7 | 118 | 7.5 | 100 | 8.3 | 109 | 8.2 | 94 | ||||||||||||||||||||||||
| 1 year increase to life expectancy |
2.7 | 41 | 2.7 | 35 | 2.7 | 35 | 2.7 | 31 | ||||||||||||||||||||||||
| 156 |
ANZ ANNUAL REPORT 2015
40: Superannuation and Post Employment Benefit Obligations (continued)
NOTES TO THE FINANCIAL STATEMENTS 157
NOTES TO THE FINANCIAL STATEMENTS (continued)
41: Employee Share and Option Plans (continued)
158
ANZ ANNUAL REPORT 2015
41: Employee Share and Option Plans (continued)
Deferred Share Rights (no performance hurdles)
Deferred share rights provide the right to acquire ANZ shares at nil cost after a specified vesting period. The fair value of rights is adjusted for the absence of dividends during the restriction period. Treatment of rights in respect of cessation relates to the purpose of the grant (refer to Deferred Share Plan section above).
For deferred share rights grants made after 1 November 2012, any portion of the award which vests may be satisfied by a cash equivalent payment rather than shares at the Board’s discretion. All share rights were satisfied through a share allocation other than 21,737 deferred share rights (2014 year: 9,480 deferred share rights) where Board discretion was exercised.
In accordance with the downward adjustment provisions detailed in Section 6.2, Variable Remuneration of the 2015 Remuneration Report, Board discretion was exercised to adjust downward no deferred share rights in 2015 and none in 2014.
During the 2015 year 1,104,107 deferred share rights (no performance hurdles) were granted (2014: 837,011).
Legacy Option Plans
There were no legacy option plans expensed in the 2014 and 2015 years.
Options, deferred share rights and performance rights on issue
As at 4 November 2015, there were 2 holders of 18,062 options on issue, 1,341 holders of 2,233,829 deferred share rights on issue and 167 holders of 3,949,105 performance rights on issue.
Option/Rights Movements
Details of options/rights over unissued ANZ shares and their related weighted average exercise prices as at the beginning and end of 2015 and movements during 2015 follow:
| Opening balance 1 Oct 2014 |
Options/rights granted |
Options/rights forfeited |
Options/rights expired |
Options/rights exercised |
Closing balance 30 Sep 2015 |
|||||||||||||||||||
|
|
||||||||||||||||||||||||
| Number of options/rights |
5,431,903 | 2,723,269 | (961,871) | (4,871) | (947,273) | 6,241,157 | ||||||||||||||||||
| Weighted average exercise price |
$0.24 | $0.00 | $0.00 | $18.63 | $0.81 | $0.07 | ||||||||||||||||||
|
|
||||||||||||||||||||||||
The weighted average closing share price during the year ended 30 September 2015 was $31.94 (2014: $32.41).
The weighted average remaining contractual life of options/rights outstanding at 30 September 2015 was 3.1 years (2014: 3.1 years).
The weighted average exercise price of all exercisable options/rights outstanding at 30 September 2015 was $1.51 (2014: $9.73).
A total of 283,283 exercisable options/rights were outstanding at 30 September 2015 (2014: 131,793).
Details of options/rights over unissued ANZ shares and their related weighted average exercise prices as at the beginning and end of 2014 and movements during 2014 are set out below:
| Opening balance 1 Oct 2013 |
Options/rights granted |
Options/rights forfeited |
Options/rights expired |
Options/rights exercised |
Closing balance 30 Sep 2014 |
|||||||||||||||||||
|
|
||||||||||||||||||||||||
| Number of options/rights |
4,870,518 | 2,490,553 | (785,136) | – | (1,144,032) | 5,431,903 | ||||||||||||||||||
| Weighted average exercise price |
$1.07 | $0.00 | $0.00 | – | $3.43 | $0.24 | ||||||||||||||||||
|
|
||||||||||||||||||||||||
No options/rights over ordinary shares have been granted since the end of 2015 up to the signing of the Directors’ Report on 4 November 2015.
NOTES TO THE FINANCIAL STATEMENTS 159
NOTES TO THE FINANCIAL STATEMENTS (continued)
41: Employee Share and Option Plans (continued)
Details of shares issued as a result of the exercise of options/rights during 2015 are as follows:
| Exercise price $ |
No. of shares issued | Proceeds received $ |
Exercise price $ |
No. of shares issued | Proceeds received $ |
|||||||||||||||||||
| 0.00 | 2,892 | – | 0.00 | 556 | – | |||||||||||||||||||
| 0.00 | 19,694 | – | 0.00 | 4,388 | – | |||||||||||||||||||
| 0.00 | 4,859 | – | 0.00 | 585 | – | |||||||||||||||||||
| 23.71 | 16,096 | 381,636 | 0.00 | 1,652 | – | |||||||||||||||||||
| 23.71 | 16,096 | 381,636 | 0.00 | 1,739 | – | |||||||||||||||||||
| 0.00 | 1,712 | – | 0.00 | 184 | – | |||||||||||||||||||
| 0.00 | 1,030 | – | 0.00 | 1,868 | – | |||||||||||||||||||
| 0.00 | 39 | – | 0.00 | 30,025 | – | |||||||||||||||||||
| 0.00 | 1,098 | – | 0.00 | 4,624 | – | |||||||||||||||||||
| 0.00 | 4,597 | – | 0.00 | 3,545 | – | |||||||||||||||||||
| 0.00 | 340,479 | – | 0.00 | 12,562 | – | |||||||||||||||||||
| 0.00 | 55,604 | – | 0.00 | 2,459 | – | |||||||||||||||||||
| 0.00 | 15,055 | – | 0.00 | 67,514 | – | |||||||||||||||||||
| 0.00 | 21,968 | – | 0.00 | 27,655 | – | |||||||||||||||||||
| 0.00 | 6,371 | – | 0.00 | 4,816 | – | |||||||||||||||||||
| 0.00 | 2,650 | – | 0.00 | 918 | – | |||||||||||||||||||
| 0.00 | 2,882 | – | 0.00 | 1,061 | – | |||||||||||||||||||
| 0.00 | 10,587 | – | 0.00 | 606 | – | |||||||||||||||||||
| 0.00 | 5,928 | – | 0.00 | 3,262 | – | |||||||||||||||||||
| 0.00 | 4,885 | – | 0.00 | 2,978 | – | |||||||||||||||||||
| 0.00 | 123,317 | – | 0.00 | 558 | – | |||||||||||||||||||
| 0.00 | 38,297 | – | 0.00 | 194 | – | |||||||||||||||||||
| 0.00 | 1,404 | – | 0.00 | 1,108 | – | |||||||||||||||||||
| 0.00 | 2,167 | – | 0.00 | 610 | – | |||||||||||||||||||
| 0.00 | 21,774 | – | 0.00 | 994 | – | |||||||||||||||||||
| 0.00 | 26,414 | – | 0.00 | 724 | – | |||||||||||||||||||
| 0.00 | 2,295 | – | 0.00 | 432 | – | |||||||||||||||||||
| 0.00 | 804 | – | 0.00 | 1,000 | – | |||||||||||||||||||
| 0.00 | 600 | – | 0.00 | 421 | – | |||||||||||||||||||
| 0.00 | 1,713 | – | 0.00 | 387 | – | |||||||||||||||||||
| 0.00 | 2,139 | – | 0.00 | 396 | – | |||||||||||||||||||
| 0.00 | 9,658 | – | 0.00 | 125 | – | |||||||||||||||||||
| 0.00 | 2,223 | – | ||||||||||||||||||||||
Details of shares issued as a result of the exercise of options/rights since the end of 2015 up to the signing of the Directors’ Report on 4 November 2015 are as follows:
| Exercise price $ |
No. of shares issued | Proceeds received $ |
Exercise price $ |
No. of shares issued | Proceeds received $ |
|||||||||||||||||||
| 0.00 | 7,748 | – | 0.00 | 1,121 | – | |||||||||||||||||||
| 0.00 | 5,421 | – | 0.00 | 730 | – | |||||||||||||||||||
| 0.00 | 5,747 | – | 0.00 | 48 | – | |||||||||||||||||||
| 0.00 | 2,117 | – | 0.00 | 18 | – | |||||||||||||||||||
| 0.00 | 1,459 | – | 0.00 | 16 | – | |||||||||||||||||||
| 0.00 | 942 | – | ||||||||||||||||||||||
160
ANZ ANNUAL REPORT 2015
41: Employee Share and Option Plans (continued)
Details of shares issued as a result of the exercise of options/rights during 2014 are as follows:
| Exercise price $ |
No. of shares issued | Proceeds received $ |
Exercise price $ |
No. of shares issued | Proceeds received $ |
|||||||||||||||||||
| 0.00 | 2,329 | – | 0.00 | 20,628 | – | |||||||||||||||||||
| 0.00 | 121,459 | – | 0.00 | 12,269 | – | |||||||||||||||||||
| 0.00 | 40,997 | – | 0.00 | 839 | – | |||||||||||||||||||
| 0.00 | 1,324 | – | 0.00 | 2,123 | – | |||||||||||||||||||
| 0.00 | 19,550 | – | 0.00 | 9,332 | – | |||||||||||||||||||
| 0.00 | 8,450 | – | 0.00 | 9,940 | – | |||||||||||||||||||
| 0.00 | 24,915 | – | 0.00 | 7,491 | – | |||||||||||||||||||
| 0.00 | 2,164 | – | 0.00 | 1,056 | – | |||||||||||||||||||
| 0.00 | 1,628 | – | 0.00 | 768 | – | |||||||||||||||||||
| 0.00 | 9,174 | – | 0.00 | 12,081 | – | |||||||||||||||||||
| 0.00 | 7,572 | – | 0.00 | 798 | – | |||||||||||||||||||
| 0.00 | 262 | – | 17.18 | 15,804 | 271,513 | |||||||||||||||||||
| 0.00 | 11,585 | – | 22.80 | 17,515 | 399,342 | |||||||||||||||||||
| 0.00 | 11,682 | – | 22.80 | 3,915 | 89,262 | |||||||||||||||||||
| 0.00 | 2,200 | – | 22.80 | 17,512 | 399,274 | |||||||||||||||||||
| 0.00 | 654 | – | 22.80 | 11,344 | 258,643 | |||||||||||||||||||
| 0.00 | 3,163 | – | 23.71 | 16,407 | 389,010 | |||||||||||||||||||
| 0.00 | 232,431 | – | 23.71 | 19,858 | 470,833 | |||||||||||||||||||
| 0.00 | 19,081 | – | 23.71 | 16,562 | 392,685 | |||||||||||||||||||
| 0.00 | 3,988 | – | 23.71 | 16,407 | 389,010 | |||||||||||||||||||
| 0.00 | 1,972 | – | 23.71 | 19,857 | 470,809 | |||||||||||||||||||
| 0.00 | 3,115 | – | 23.71 | 16,561 | 392,661 | |||||||||||||||||||
| 0.00 | 2,445 | – | 0.00 | 173,130 | – | |||||||||||||||||||
| 0.00 | 6,908 | – | 0.00 | 35,724 | – | |||||||||||||||||||
| 0.00 | 35,470 | – | 0.00 | 726 | – | |||||||||||||||||||
| 0.00 | 88,186 | – | 0.00 | 14,804 | – | |||||||||||||||||||
| 0.00 | 3,120 | – | 0.00 | 396 | – | |||||||||||||||||||
| 0.00 | 3,454 | – | 0.00 | 90 | – | |||||||||||||||||||
| 0.00 | 817 | – | ||||||||||||||||||||||
NOTES TO THE FINANCIAL STATEMENTS 161
NOTES TO THE FINANCIAL STATEMENTS (continued)
41: Employee Share and Option Plans (continued)
In determining the fair value below, the standard market techniques for valuation, including Monte Carlo and/or Black Scholes pricing models, were applied in accordance with the requirements of AASB 2 Share-based payments. The models take into account early exercise of vested equity, non-transferability and market based performance hurdles (if any). The significant assumptions used to measure the fair value of instruments granted during 2015 are contained in the table below:
| Type | Grant date |
Number of options/ rights |
Exercise $ |
Equity fair $ |
Share $ |
ANZ expected volatility1 % |
Equity term (years) |
Vesting period (years) |
Expected life (years) |
Expected % |
Risk free % |
|||||||||||||||||||||||||||||||||
|
|
||||||||||||||||||||||||||||||||||||||||||||
| STI/TIPP deferred share rights |
21-Nov-14 | 234,600 | 0.00 | 30.16 | 31.82 | 17.5 | 3 | 1 | 1 | 5.50 | 2.53 | |||||||||||||||||||||||||||||||||
| 21-Nov-14 | 90,883 | 0.00 | 30.39 | 31.82 | 17.5 | 2.9 | 0.9 | 0.9 | 5.50 | 2.53 | ||||||||||||||||||||||||||||||||||
| 21-Nov-14 | 247,421 | 0.00 | 28.58 | 31.82 | 17.5 | 4 | 2 | 2 | 5.50 | 2.53 | ||||||||||||||||||||||||||||||||||
| 21-Nov-14 | 34,768 | 0.00 | 29.37 | 31.82 | 17.5 | 3.5 | 1.5 | 1.5 | 5.50 | 2.53 | ||||||||||||||||||||||||||||||||||
| 21-Nov-14 | 36,681 | 0.00 | 27.84 | 31.82 | 17.5 | 4.5 | 2.5 | 2.5 | 5.50 | 2.53 | ||||||||||||||||||||||||||||||||||
| 21-Nov-14 | 37,662 | 0.00 | 26.38 | 31.82 | 17.5 | 5.5 | 3.5 | 3.5 | 5.50 | 2.66 | ||||||||||||||||||||||||||||||||||
| 21-Nov-14 | 184,029 | 0.00 | 27.09 | 31.82 | 17.5 | 5 | 3 | 3 | 5.50 | 2.53 | ||||||||||||||||||||||||||||||||||
|
|
||||||||||||||||||||||||||||||||||||||||||||
| LTI deferred share rights |
21-Nov-14 | 154,179 | 0.00 | 27.09 | 31.82 | 17.5 | 5 | 3 | 3 | 5.50 | 2.53 | |||||||||||||||||||||||||||||||||
|
|
||||||||||||||||||||||||||||||||||||||||||||
| LTI performance rights |
21-Nov-14 | 695,358 | 0.00 | 14.24 | 31.82 | 17.5 | 5 | 3 | 3 | 5.50 | 2.53 | |||||||||||||||||||||||||||||||||
| 21-Nov-14 | 640,076 | 0.00 | 15.47 | 31.82 | 17.5 | 5 | 3 | 3 | 5.50 | 2.53 | ||||||||||||||||||||||||||||||||||
| 21-Nov-14 | 21,382 | 0.00 | 13.97 | 31.82 | 17.5 | 5.5 | 3.5 | 3.5 | 5.50 | 2.66 | ||||||||||||||||||||||||||||||||||
| 21-Nov-14 | 19,588 | 0.00 | 15.25 | 31.82 | 17.5 | 5.5 | 3.5 | 3.5 | 5.50 | 2.66 | ||||||||||||||||||||||||||||||||||
| 18-Dec-14 | 119,382 | 0.00 | 13.67 | 30.98 | 17.5 | 5 | 3 | 3 | 5.50 | 2.20 | ||||||||||||||||||||||||||||||||||
| 18-Dec-14 | 109,890 | 0.00 | 14.69 | 30.98 | 17.5 | 5 | 3 | 3 | 5.50 | 2.20 | ||||||||||||||||||||||||||||||||||
| 25-Feb-15 | 7,022 | 0.00 | 15.24 | 35.31 | 17.5 | 5 | 3 | 3 | 5.25 | 1.86 | ||||||||||||||||||||||||||||||||||
| 25-Feb-15 | 6,464 | 0.00 | 16.46 | 35.31 | 17.5 | 5 | 3 | 3 | 5.25 | 1.86 | ||||||||||||||||||||||||||||||||||
|
|
||||||||||||||||||||||||||||||||||||||||||||
| Other deferred share rights |
21-Nov-14 | 9,777 | 0.00 | 30.58 | 31.82 | 17.5 | 2.7 | 0.7 | 0.7 | 5.50 | 2.53 | |||||||||||||||||||||||||||||||||
| 21-Nov-14 | 3,459 | 0.00 | 30.16 | 31.82 | 17.5 | 3 | 1 | 1 | 5.50 | 2.53 | ||||||||||||||||||||||||||||||||||
| 21-Nov-14 | 3,486 | 0.00 | 29.60 | 31.82 | 17.5 | 3.4 | 1.4 | 1.4 | 5.50 | 2.53 | ||||||||||||||||||||||||||||||||||
| 21-Nov-14 | 7,073 | 0.00 | 28.98 | 31.82 | 17.5 | 3.8 | 1.8 | 1.8 | 5.50 | 2.53 | ||||||||||||||||||||||||||||||||||
| 21-Nov-14 | 3,650 | 0.00 | 28.58 | 31.82 | 17.5 | 4 | 2 | 2 | 5.50 | 2.53 | ||||||||||||||||||||||||||||||||||
| 21-Nov-14 | 3,690 | 0.00 | 27.96 | 31.82 | 17.5 | 4.4 | 2.4 | 2.4 | 5.50 | 2.53 | ||||||||||||||||||||||||||||||||||
| 21-Nov-14 | 3,276 | 0.00 | 27.47 | 31.82 | 17.5 | 4.8 | 2.8 | 2.8 | 5.50 | 2.53 | ||||||||||||||||||||||||||||||||||
| 21-Nov-14 | 1,680 | 0.00 | 27.09 | 31.82 | 17.5 | 5 | 3 | 3 | 5.50 | 2.53 | ||||||||||||||||||||||||||||||||||
| 21-Nov-14 | 3,894 | 0.00 | 26.50 | 31.82 | 17.5 | 5.4 | 3.4 | 3.4 | 5.50 | 2.66 | ||||||||||||||||||||||||||||||||||
| 4-Dec-14 | 20,302 | 0.00 | 27.43 | 32.22 | 17.5 | 3 | 3 | 3 | 5.50 | 2.36 | ||||||||||||||||||||||||||||||||||
| 27-Feb-15 | 1,185 | 0.00 | 33.58 | 35.34 | 17.5 | 3 | 1 | 1 | 5.25 | 1.91 | ||||||||||||||||||||||||||||||||||
| 27-Feb-15 | 1,247 | 0.00 | 31.90 | 35.34 | 17.5 | 4 | 2 | 2 | 5.25 | 1.79 | ||||||||||||||||||||||||||||||||||
| 1-Jun-15 | 4,021 | 0.00 | 31.50 | 32.72 | 17.5 | 2.7 | 0.7 | 0.7 | 5.25 | 1.89 | ||||||||||||||||||||||||||||||||||
| 1-Jun-15 | 1,271 | 0.00 | 31.08 | 32.72 | 17.5 | 3 | 1 | 1 | 5.25 | 1.89 | ||||||||||||||||||||||||||||||||||
| 1-Jun-15 | 7,664 | 0.00 | 29.92 | 32.72 | 17.5 | 3.7 | 1.7 | 1.7 | 5.25 | 1.94 | ||||||||||||||||||||||||||||||||||
| 1-Jun-15 | 1,067 | 0.00 | 29.53 | 32.72 | 17.5 | 4 | 2 | 2 | 5.25 | 1.94 | ||||||||||||||||||||||||||||||||||
| 1-Jun-15 | 2,334 | 0.00 | 28.43 | 32.72 | 17.5 | 4.7 | 2.7 | 2.7 | 5.25 | 1.94 | ||||||||||||||||||||||||||||||||||
| 20-Aug-15 | 2,342 | 0.00 | 27.54 | 29.13 | 17.5 | 3 | 1 | 1 | 5.75 | 1.97 | ||||||||||||||||||||||||||||||||||
| 20-Aug-15 | 2,477 | 0.00 | 26.04 | 29.13 | 17.5 | 4 | 2 | 2 | 5.75 | 1.89 | ||||||||||||||||||||||||||||||||||
|
|
||||||||||||||||||||||||||||||||||||||||||||
| 1 | Expected volatility represents a measure of the amount by which ANZ’s share price is expected to fluctuate over the life of the rights. The measure of volatility used in the model is the annualised standard deviation of the continuously compounded rates of return on the historical share price over a defined period of time preceding the date of grant. This historical average annualised volatility is then used to estimate a reasonable expected volatility over the expected life of the rights. |
162
ANZ ANNUAL REPORT 2015
41: Employee Share and Option Plans (continued)
The significant assumptions used to measure the fair value of instruments granted during 2014 are contained in the table below:
| Type | Grant date |
Number of options/ rights |
Exercise $ |
Equity fair $ |
Share $ |
ANZ expected volatility1 % |
Equity term (years) |
Vesting period (years) |
Expected life (years) |
Expected % |
Risk free % |
|||||||||||||||||||||||||||||||||
|
|
||||||||||||||||||||||||||||||||||||||||||||
| STI/TIPP deferred |
22–Nov–13 | 39,269 | 0.00 | 31.68 | 31.68 | n/a | 2.4 | 0.4 | 0.4 | 5.80 | n/a | |||||||||||||||||||||||||||||||||
| 22–Nov–13 | 192,539 | 0.00 | 30.10 | 31.68 | 20.0 | 3 | 1 | 1 | 5.25 | 2.54 | ||||||||||||||||||||||||||||||||||
| 22–Nov–13 | 202,523 | 0.00 | 28.60 | 31.68 | 20.0 | 4 | 2 | 2 | 5.25 | 2.75 | ||||||||||||||||||||||||||||||||||
| 22–Nov–13 | 148,315 | 0.00 | 27.17 | 31.68 | 20.0 | 5 | 3 | 3 | 5.25 | 3.13 | ||||||||||||||||||||||||||||||||||
|
|
||||||||||||||||||||||||||||||||||||||||||||
| LTI deferred share |
22–Nov–13 | 149,626 | 0.00 | 27.17 | 31.68 | 20.0 | 5 | 3 | 3 | 5.25 | 3.13 | |||||||||||||||||||||||||||||||||
|
|
||||||||||||||||||||||||||||||||||||||||||||
| LTI performance |
22–Nov–13 | 759,220 | 0.00 | 13.87 | 31.68 | 20.0 | 5 | 3 | 3 | 5.25 | 3.13 | |||||||||||||||||||||||||||||||||
| 22–Nov–13 | 693,236 | 0.00 | 15.19 | 31.68 | 20.0 | 5 | 3 | 3 | 5.25 | 3.13 | ||||||||||||||||||||||||||||||||||
| 18–Dec–13 | 100,832 | 0.00 | 15.62 | 30.70 | 20.0 | 5 | 3 | 3 | 5.50 | 2.90 | ||||||||||||||||||||||||||||||||||
| 18–Dec–13 | 100,254 | 0.00 | 15.71 | 30.70 | 20.0 | 5 | 3 | 3 | 5.50 | 2.90 | ||||||||||||||||||||||||||||||||||
|
|
||||||||||||||||||||||||||||||||||||||||||||
| Other deferred |
22–Nov–13 | 15,530 | 0.00 | 31.68 | 31.68 | n/a | 2.3 | 0.3 | 0.3 | 5.80 | n/a | |||||||||||||||||||||||||||||||||
| 22–Nov–13 | 918 | 0.00 | 30.50 | 31.68 | 20.0 | 2.7 | 0.7 | 0.7 | 5.25 | 2.54 | ||||||||||||||||||||||||||||||||||
| 22–Nov–13 | 1,438 | 0.00 | 30.10 | 31.68 | 20.0 | 3 | 1 | 1 | 5.25 | 2.54 | ||||||||||||||||||||||||||||||||||
| 22–Nov–13 | 3,671 | 0.00 | 29.69 | 31.68 | 20.0 | 3.3 | 1.3 | 1.3 | 5.25 | 2.54 | ||||||||||||||||||||||||||||||||||
| 22–Nov–13 | 983 | 0.00 | 28.98 | 31.68 | 20.0 | 3.7 | 1.7 | 1.7 | 5.25 | 2.75 | ||||||||||||||||||||||||||||||||||
| 22–Nov–13 | 5,009 | 0.00 | 28.60 | 31.68 | 20.0 | 4 | 2 | 2 | 5.25 | 2.75 | ||||||||||||||||||||||||||||||||||
| 22–Nov–13 | 1,595 | 0.00 | 28.21 | 31.68 | 20.0 | 4.3 | 2.3 | 2.3 | 5.25 | 2.75 | ||||||||||||||||||||||||||||||||||
| 22–Nov–13 | 217 | 0.00 | 27.53 | 31.68 | 20.0 | 4.7 | 2.7 | 2.7 | 5.25 | 3.13 | ||||||||||||||||||||||||||||||||||
| 22–Nov–13 | 1,591 | 0.00 | 27.17 | 31.68 | 20.0 | 5 | 3 | 3 | 5.25 | 3.13 | ||||||||||||||||||||||||||||||||||
| 4–Dec–13 | 25,710 | 0.00 | 27.24 | 31.76 | 20.0 | 3 | 3 | 3 | 5.25 | 3.08 | ||||||||||||||||||||||||||||||||||
| 27–Feb–14 | 7,988 | 0.00 | 30.47 | 32.15 | 20.0 | 3 | 1 | 1 | 5.50 | 2.44 | ||||||||||||||||||||||||||||||||||
| 27–Feb–14 | 6,036 | 0.00 | 28.89 | 32.15 | 20.0 | 4 | 2 | 2 | 5.50 | 2.69 | ||||||||||||||||||||||||||||||||||
| 27–Feb–14 | 4,809 | 0.00 | 27.38 | 32.15 | 20.0 | 5 | 3 | 3 | 5.50 | 2.85 | ||||||||||||||||||||||||||||||||||
| 1–Jun–14 | 5,116 | 0.00 | 32.64 | 33.49 | 17.5 | 3 | 0.5 | 0.5 | 5.50 | 2.54 | ||||||||||||||||||||||||||||||||||
| 1–Jun–14 | 994 | 0.00 | 32.18 | 33.49 | 17.5 | 3 | 0.7 | 0.7 | 5.50 | 2.54 | ||||||||||||||||||||||||||||||||||
| 1–Jun–14 | 1,298 | 0.00 | 31.73 | 33.49 | 17.5 | 3 | 1 | 1 | 5.50 | 2.54 | ||||||||||||||||||||||||||||||||||
| 1–Jun–14 | 3,944 | 0.00 | 30.93 | 33.49 | 17.5 | 4 | 1.5 | 1.5 | 5.50 | 2.63 | ||||||||||||||||||||||||||||||||||
| 1–Jun–14 | 1,049 | 0.00 | 30.50 | 33.49 | 17.5 | 4 | 1.7 | 1.7 | 5.50 | 2.63 | ||||||||||||||||||||||||||||||||||
| 1–Jun–14 | 1,369 | 0.00 | 30.08 | 33.49 | 17.5 | 4 | 2 | 2 | 5.50 | 2.63 | ||||||||||||||||||||||||||||||||||
| 1–Jun–14 | 1,807 | 0.00 | 29.32 | 33.49 | 17.5 | 5 | 2.5 | 2.5 | 5.50 | 2.74 | ||||||||||||||||||||||||||||||||||
| 1–Jun–14 | 5,190 | 0.00 | 28.90 | 33.49 | 17.5 | 5 | 2.7 | 2.7 | 5.50 | 2.74 | ||||||||||||||||||||||||||||||||||
| 1–Jun–14 | 771 | 0.00 | 28.51 | 33.49 | 17.5 | 5 | 3 | 3 | 5.50 | 2.74 | ||||||||||||||||||||||||||||||||||
| 1–Jun–14 | 1,934 | 0.00 | 27.40 | 33.49 | 17.5 | 6 | 3.7 | 3.7 | 5.50 | 2.92 | ||||||||||||||||||||||||||||||||||
| 20–Aug–14 | 524 | 0.00 | 32.35 | 33.27 | 17.5 | 3 | 0.5 | 0.5 | 5.50 | 2.47 | ||||||||||||||||||||||||||||||||||
| 20–Aug–14 | 2,328 | 0.00 | 31.54 | 33.27 | 17.5 | 3 | 1 | 1 | 5.50 | 2.47 | ||||||||||||||||||||||||||||||||||
| 20–Aug–14 | 292 | 0.00 | 30.66 | 33.27 | 17.5 | 4 | 1.5 | 1.5 | 5.50 | 2.54 | ||||||||||||||||||||||||||||||||||
| 20–Aug–14 | 2,457 | 0.00 | 29.89 | 33.27 | 17.5 | 4 | 2 | 2 | 5.50 | 2.54 | ||||||||||||||||||||||||||||||||||
| 20–Aug–14 | 171 | 0.00 | 29.06 | 33.27 | 17.5 | 5 | 2.5 | 2.5 | 5.50 | 2.64 | ||||||||||||||||||||||||||||||||||
|
|
||||||||||||||||||||||||||||||||||||||||||||
| 1 | Expected volatility represents a measure of the amount by which ANZ’s share price is expected to fluctuate over the life of the rights. The measure of volatility used in the model is the annualised standard deviation of the continuously compounded rates of return on the historical share price over a defined period of time preceding the date of grant. This historical average annualised volatility is then used to estimate a reasonable expected volatility over the expected life of the rights. |
SATISFYING EQUITY AWARDS
All shares underpinning equity awards may be purchased on market, or be newly issued shares or a combination of both.
In relation to equity purchased on market during the 2015 financial year either under the ANZ Employee Share Acquisition Plan and the ANZ Share Option Plan, or to satisfy options or rights, for all employees 6,164,925 shares were purchased at an average price of $32.11 per share (2014 year: 5,909,763 shares at an average price of $31.93).
NOTES TO THE FINANCIAL STATEMENTS 163
NOTES TO THE FINANCIAL STATEMENTS (continued)
42: Related Party Disclosures
A: KEY MANAGEMENT PERSONNEL COMPENSATION
Key Management Personnel (KMP) are defined as directors and those executives that report directly to the CEO with responsibility for the strategic direction and management of a major revenue generating division or who control material revenue and expenses. KMP compensation included in the personnel disclosure expenses is as follows:
| Consolidated | ||||||||
| 20151 $000 |
2014 $000 |
|||||||
| Short-term benefits |
24,447 | 25,367 | ||||||
| Post-employment benefits |
914 | 921 | ||||||
| Other long-term benefits |
291 | 356 | ||||||
| Termination benefits |
104 | – | ||||||
| Share-based payments |
17,805 | 15,400 | ||||||
| 43,561 | 42,044 | |||||||
| 1 | Current period includes former CEO Australia notice period from 3 April 2014 until cessation of employment. |
B: KEY MANAGEMENT PERSONNEL LOAN TRANSACTIONS
Loans made to directors of the Company and other KMP of the Group are made in the ordinary course of business on normal commercial terms and conditions no more favourable than those given to other employees or customers, including the term of the loan, security required and the interest rate. The aggregate of loans made, guaranteed or secured by any entity in the Group to KMP, including their related parties, were as follows:
| Consolidated | The Company | |||||||||||||||
| 2015 $000 |
2014 $000 |
2015 $000 |
2014 $000 |
|||||||||||||
| Loans advanced1 |
50,400 | 29,560 | 41,401 | 20,622 | ||||||||||||
| Interest charged2 |
2,106 | 1,314 | 1,601 | 849 | ||||||||||||
| 1 | Balances are for KMP who were in office as of the balance sheet date. |
| 2 | Interest is for all KMP during the period. |
C: KEY MANAGEMENT PERSONNEL HOLDINGS OF ANZ SECURITIES
KMP, including their related parties, held subordinated debt, shares, share rights and options over shares in the Group directly, indirectly or beneficially as shown below:
| Consolidated | ||||||||
| 2015 Number1 |
2014 Number1 |
|||||||
| Ordinary shares |
4,137,367 | 3,876,106 | ||||||
| Subordinated debt |
17,227 | 10,499 | ||||||
| 1 | Balances are for KMP who were in office as of the balance sheet date. |
D: OTHER TRANSACTIONS OF KEY MANAGEMENT PERSONNEL AND THEIR RELATED PARTIES
All other transactions with KMP and their related parties are made on terms equivalent to those that prevail in arm’s length transactions. These transactions generally involve the provision of financial and investment services including services to eligible international assignees ensuring they are neither financially advantaged nor disadvantaged by their relocation. All such transactions that have occurred with KMP and their related parties have been trivial or domestic in nature. In this context, transactions are only disclosed when they are considered of interest to the users of the financial report in making and evaluating decisions about the allocation of scarce resources.
E: ASSOCIATES
Significant associates are disclosed in note 35. During the course of the financial year the Company and its subsidiaries conducted transactions with all associates as shown below on terms equivalent to those on an arm’s length basis.
| Consolidated | The Company | |||||||||||||||
| 2015 $000 |
2014 $000 |
2015 $000 |
2014 $000 |
|||||||||||||
| Amounts receivable from associates |
7,436 | 81,193 | 5,283 | 80,628 | ||||||||||||
| Amounts payable to associates |
6,614 | 77,977 | 5,703 | 2,210 | ||||||||||||
| Interest revenue |
322 | 694 | 244 | 657 | ||||||||||||
| Interest expense |
2,443 | 2,378 | 40 | – | ||||||||||||
| Dividend revenue |
232,289 | 125,400 | 59,220 | 45,935 | ||||||||||||
| Costs recovered from associates |
2,394 | 1,865 | 1,279 | 476 | ||||||||||||
There have been no guarantees given or received. No outstanding amounts have been written down or recorded as allowances, as they are considered fully collectible.
164
ANZ ANNUAL REPORT 2015
42: Related Party Disclosures (continued)
F: SUBSIDIARIES
NOTES TO THE FINANCIAL STATEMENTS 165
NOTES TO THE FINANCIAL STATEMENTS (continued)
43: Other Contingent Liabilities and Contingent Assets (continued)
| 1 | Relief originally granted on 21 August 2001. |
| 2 | Relief originally granted on 13 August 2002. |
| 3 | Relief originally granted on 9 September 2003. |
| 4 | Relief originally granted on 2 September 2008. |
| 5 | Relief originally granted on 11 February 2009. |
166
ANZ ANNUAL REPORT 2015
43: Other Contingent Liabilities and Contingent Assets (continued)
The consolidated statement of comprehensive income and consolidated balance sheet of the Company and its wholly owned controlled entities which have entered into the Deed of Cross Guarantee in the relevant financial years are:
| Consolidated | ||||||||
| 2015 $m |
2014 $m |
|||||||
| Profit before tax |
9,263 | 9,116 | ||||||
| Income tax expense |
(1,925) | (1,945) | ||||||
| Profit after income tax |
7,338 | 7,171 | ||||||
| Foreign exchange differences taken to equity, net of tax |
807 | 175 | ||||||
| Change in fair value of available-for-sale financial assets, net of tax |
(31) | 34 | ||||||
| Change in fair value of cash flow hedges, net of tax |
103 | 125 | ||||||
| Actuarial gains/(loss) on defined benefit plans, net of tax |
19 | 6 | ||||||
| Other comprehensive income, net of tax |
898 | 340 | ||||||
| Total comprehensive income |
8,236 | 7,511 | ||||||
| Retained profits at start of year |
18,990 | 16,499 | ||||||
| Profit after income tax |
7,338 | 7,171 | ||||||
| Ordinary share dividends provided for or paid |
(4,905) | (4,694) | ||||||
| Transfer from reserves |
7 | 8 | ||||||
| Actuarial gains/(loss) on defined benefit plans after tax |
19 | 6 | ||||||
| Retained profits at end of year |
21,449 | 18,990 | ||||||
| Assets |
||||||||
| Cash |
51,217 | 30,655 | ||||||
| Settlement balances owed to ANZ |
16,601 | 18,150 | ||||||
| Collateral paid |
8,234 | 4,873 | ||||||
| Available-for-sale assets/investment securities |
37,612 | 26,151 | ||||||
| Net loans and advances |
447,799 | 414,349 | ||||||
| Other assets |
267,579 | 209,318 | ||||||
| Premises and equipment |
1,047 | 1,065 | ||||||
| Total assets |
830,089 | 704,561 | ||||||
| Liabilities |
||||||||
| Settlement balances owed by ANZ |
9,901 | 8,189 | ||||||
| Collateral received |
6,886 | 4,886 | ||||||
| Deposits and other borrowings |
472,031 | 423,172 | ||||||
| Income tax liability |
249 | 366 | ||||||
| Payables and other liabilities |
307,390 | 234,807 | ||||||
| Provisions |
731 | 695 | ||||||
| Total liabilities |
797,188 | 672,115 | ||||||
| Net assets |
32,901 | 32,446 | ||||||
| Shareholders’ equity1 |
32,901 | 32,446 | ||||||
| 1 | Shareholders’ equity excludes retained profits and reserves of controlled entities within the class order. |
NOTES TO THE FINANCIAL STATEMENTS 167
NOTES TO THE FINANCIAL STATEMENTS (continued)
44: Compensation of Auditors
| Consolidated | The Company | |||||||||||||||
| 2015 $’000 |
2014 $’000 |
2015 $’000 |
2014 $’000 |
|||||||||||||
| KPMG Australia1 |
||||||||||||||||
| Audit or review of financial reports of the Company or Group entities |
8,824 | 9,031 | 5,377 | 5,346 | ||||||||||||
| Audit-related services2 |
4,093 | 3,166 | 3,026 | 2,444 | ||||||||||||
| Non-audit services3 |
126 | 630 | 126 | 530 | ||||||||||||
| 13,043 | 12,827 | 8,529 | 8,320 | |||||||||||||
| Overseas related practices of KPMG Australia |
||||||||||||||||
| Audit or review of financial reports of the Company or Group entities |
6,022 | 5,396 | 1,537 | 1,227 | ||||||||||||
| Audit-related services2 |
1,394 | 1,195 | 682 | 516 | ||||||||||||
| Non-audit services3 |
256 | 4 | – | – | ||||||||||||
| 7,672 | 6,595 | 2,219 | 1,743 | |||||||||||||
| Total compensation of auditors |
20,715 | 19,422 | 10,748 | 10,063 | ||||||||||||
| 1 | Inclusive of goods and services tax. |
| 2 | For the Group, comprises prudential and regulatory services of $4.000 million (2014: $3.217 million), comfort letters $0.745 million (2014: $0.814 million) and other $0.742 million (2014: $0.330 million). For the Company, comprises prudential and regulatory services of $2.556 million (2014: $1.927 million), comfort letters of $0.565 million (2014: $0.585 million) and other $0.587 million (2014: $0.448 million). |
| 3 | The nature of the non-audit services include reviews of compliance with legal and regulatory requirements, benchmarking reviews and a branch optimisation analysis performed during the year. Further details are provided in the Directors’ Report. |
Group Policy allows KPMG Australia or any of its related practices to provide assurance and other audit-related services that, while outside the scope of the statutory audit, are consistent with the role of external auditor. These include regulatory and prudential reviews requested by the Company’s regulators such as APRA. Any other services that are not audit or audit-related services are non-audit services. Group Policy allows certain non-audit services to be provided where the service would not contravene auditor independence requirements. KPMG Australia or any of its related practices may not provide services that are perceived to be in conflict with the role of the external auditor. These include consulting advice and subcontracting of operational activities normally undertaken by management, and engagements where the auditor may ultimately be required to express an opinion on its own work.
45: Changes to comparatives
Certain amounts reported as comparative information have changed as a result of the adoption of new accounting standards or being reclassified to conform with current period financial statement presentations.
Merchant Services and Commercial Cards (impacting segment analysis)
During 2015 the Merchant Services and Commercial Credit Cards business were transferred out of the Cards and Payments business unit in Australia Retail and split between Australia C&CB and IIB based on customer ownership. Comparatives in note 8 have changed.
Fee commissions and expenses (impacting income)
Certain card related fees that are integral to the generation of income were reclassified within total income to better reflect the nature of the items and comparatives were restated. Comparatives in note 3 have changed.
168
ANZ ANNUAL REPORT 2015
45: Changes to comparatives (continued)
Equity accounting of associates
During the year the Company elected to early adopt AASB 2014-9 Amendments to Australian Accounting Standards – Equity Method in Separate Financial Statements in order to account for investments in associates using the equity method, rather than at cost. This change has been retrospectively applied and the impact on comprehensive income and the balance sheet as at 30 September 2014 and 1 October 2013 is presented below.
| 2014 | |||||||||||||||
| Previously reported | Adjustments | Currently reported | |||||||||||||
| The Company | $m | $m | $m | ||||||||||||
| Share of associates’ profit |
– | 248 | 248 | ||||||||||||
| Other operating income1 |
5,868 | (84 | ) | 5,784 | |||||||||||
| Operating income |
16,095 | 164 | 16,259 | ||||||||||||
| Profit before credit impairment and income tax |
9,217 | 164 | 9,381 | ||||||||||||
| Profit before income tax |
8,243 | 164 | 8,407 | ||||||||||||
| Profit attributable to shareholders of the Company |
6,272 | 164 | 6,436 | ||||||||||||
| Other comprehensive income net of tax attributable to shareholders of the Company |
234 | 132 | 366 | ||||||||||||
| Total comprehensive income attributable to shareholders of the Company |
6,506 | 296 | 6,802 | ||||||||||||
|
1 The adjustment to other operating incomes comprises the removal of dividends from associates, and the recognition of a dilution gain on investment in BoT and the loss on divestment of SSI. |
| ||||||||||||||
| 2014 | 2013 | |||||||||||||||||||||||||
| Previously reported |
Adjustments | Currently reported |
Previously reported |
Adjustments | Currently reported |
|||||||||||||||||||||
| Company | $m | $m | $m | $m | $m | $m | ||||||||||||||||||||
| Assets |
||||||||||||||||||||||||||
| Investments in associates |
720 | 1,446 | 2,166 | 841 | 1,150 | 1,991 | ||||||||||||||||||||
| All other assets |
706,824 | – | 706,824 | 618,156 | – | 618,156 | ||||||||||||||||||||
| Total assets |
707,544 | 1,446 | 708,990 | 618,997 | 1,150 | 620,147 | ||||||||||||||||||||
| Total liabilities |
666,288 | – | 666,288 | 579,932 | – | 579,932 | ||||||||||||||||||||
| Net Assets |
41,256 | 1,446 | 42,702 | 39,065 | 1,150 | 40,215 | ||||||||||||||||||||
| Ordinary and prefered share capital |
25,151 | – | 25,151 | 24,785 | – | 24,785 | ||||||||||||||||||||
| Foreign currency translation reserve |
(522) | 232 | (290) | (616) | 77 | (539) | ||||||||||||||||||||
| Other reserves |
307 | (23) | 284 | 143 | – | 143 | ||||||||||||||||||||
| Retained earnings |
16,320 | 1,237 | 17,557 | 14,753 | 1,073 | 15,826 | ||||||||||||||||||||
| Total Equity |
41,256 | 1,446 | 42,702 | 39,065 | 1,150 | 40,215 | ||||||||||||||||||||
46: Events Since the End of the Financial Year
CEO Appointment
On 1st October the Board of ANZ announced that Shayne Elliott will succeed Mike Smith as Chief Executive Officer and join the Board on 1 January 2016. Mr Smith will step down as Chief Executive Officer and as Director on 31 December 2015. Mr Smith will be retained as a non-executive advisor to the Board, initially for one year, commencing after his period of leave on 11 July 2016. Further details of Mr Elliott’s remuneration arrangements and Mr Smith’s leaving arrangements can be found in the Remuneration Report.
Sale of Esanda Dealer Finance Portfolio
On 8th October the Group entered into an agreement to sell the Esanda Dealer Finance business to Macquarie Group Limited. The sale is expected to complete during the first half of 2016. The estimated sale price is $8.2 billion.
Other than the matters noted above there have been no other material events from 30 September to the date of this report.
NOTES TO THE FINANCIAL STATEMENTS 169
DIRECTORS’ DECLARATION AND RESPONSIBILITY STATEMENT
Directors’ Declaration
The Directors of Australia and New Zealand Banking Group Limited declare that:
| a) | in the Directors’ opinion, the financial statements and notes of the Company and the consolidated entity are in accordance with the Corporations Act 2001, including: |
| i) | section 296, that they comply with the Australian Accounting Standards and any further requirements of the Corporations Regulations 2001; and |
| ii) | section 297, that they give a true and fair view of the financial position of the Company and of the consolidated entity as at 30 September 2015 and of their performance for the year ended on that date; |
| b) | the notes to the financial statements of the Company and the consolidated entity include a statement that the financial statements and notes of the Company and the consolidated entity comply with International Financial Reporting Standards; |
| c) | the Directors have been given the declarations required by section 295A of the Corporations Act 2001; |
| d) | in the Directors’ opinion, there are reasonable grounds to believe that the Company will be able to pay its debts as and when they become due and payable; and |
| e) | the Company and certain of its wholly owned controlled entities (listed in note 43) have executed a Deed of Cross Guarantee enabling them to take advantage of the accounting and audit relief offered by class order 98/1418 (as amended), issued by the Australian Securities and Investments Commission. The nature of the Deed of Cross Guarantee is to guarantee to each creditor payment in full of any debt in accordance with the terms of the Deed of Cross Guarantee. At the date of this declaration, there are reasonable grounds to believe that the Company and its controlled entities which executed the Deed of Cross Guarantee are able, as an economic entity, to meet any obligations or liabilities to which they are, or may become, subject by virtue of the Deed of Cross Guarantee. |
Signed in accordance with a resolution of the Directors.

|

| |
|
David M Gonski, AC |
Michael R P Smith, OBE | |
| Chairman | Director | |
| 4 November 2015 |
Responsibility statement of the Directors in accordance with Rule 4.1.12 (3)(b) of the Disclosure Rules and Transparency Rules of the United Kingdom Financial Conduct Authority.
The Directors of Australia and New Zealand Banking Group Limited confirm to the best of their knowledge that:
The Group’s Annual Report includes:
| i) | a fair review of the development and performance of the business and the position of the Group and the undertakings included in the consolidation taken as a whole; together with |
| ii) | a description of the principal risks and uncertainties faced by the Group. |
Signed in accordance with a resolution of the Directors.
|
|
| |
| David M Gonski, AC | Michael R P Smith, OBE | |
| Chairman | Director | |
| 4 November 2015 | ||
170
ANZ ANNUAL REPORT 2015
INDEPENDENT AUDITOR’S REPORT TO THE MEMBERS OF AUSTRALIA AND NEW ZEALAND BANKING GROUP LIMITED


DIRECTORS’ DECLARATION AND INDEPENDENT AUDITOR’S REPORT 171

FIVE YEAR SUMMARY
| 2015 $m |
2014 $m |
2013 $m |
2012 $m |
2011 $m |
||||||||||||||||
| Financial performance1 |
||||||||||||||||||||
| Net interest income |
14,616 | 13,797 | 12,772 | 12,110 | 11,500 | |||||||||||||||
| Other operating income |
5,902 | 5,781 | 5,619 | 5,738 | 5,385 | |||||||||||||||
| Operating expenses |
(9,359 | ) | (8,760 | ) | (8,257 | ) | (8,519 | ) | (8,023) | |||||||||||
| Profit before credit impairment and income tax |
11,159 | 10,818 | 10,134 | 9,329 | 8,862 | |||||||||||||||
| Credit impairment charge |
(1,205 | ) | (989 | ) | (1,197 | ) | (1,258 | ) | (1,220) | |||||||||||
| Income tax expense |
(2,724 | ) | (2,700 | ) | (2,435 | ) | (2,235 | ) | (2,167) | |||||||||||
| Non-controlling interests |
(14 | ) | (12 | ) | (10 | ) | (6 | ) | (8) | |||||||||||
| Cash/underlying profit1 |
7,216 | 7,117 | 6,492 | 5,830 | 5,467 | |||||||||||||||
| Adjustments to arrive at statutory profit1 |
277 | 154 | (182 | ) | (169 | ) | (112) | |||||||||||||
| Profit attributable to shareholders of the Company |
7,493 | 7,271 | 6,310 | 5,661 | 5,355 | |||||||||||||||
| Financial position |
||||||||||||||||||||
| Total assets |
889,900 | 772,092 | 702,995 | 642,127 | 604,213 | |||||||||||||||
| Total equity |
57,353 | 49,284 | 45,603 | 41,220 | 37,954 | |||||||||||||||
| Common Equity Tier 12 |
9.6% | 8.8% | 8.5% | 8.0% | 8.5% | |||||||||||||||
| Common Equity Tier 1 – Internationally Comparable Basel 33 |
13.2% | 12.5% | 12.7% | 11.6% | n/a | |||||||||||||||
| Return on average ordinary equity4,5 |
14.5% | 15.8% | 15.0% | 14.6% | 15.3% | |||||||||||||||
| Return on average assets5 |
0.9% | 1.0% | 0.9% | 0.9% | 0.9% | |||||||||||||||
| Cost to income ratio (cash/underlying)1 |
45.6% | 44.7% | 44.9% | 47.7% | 47.5% | |||||||||||||||
| Shareholder value – ordinary shares |
||||||||||||||||||||
| Total return to shareholders (share price movement plus dividends) |
(7.5% | ) | 5.9% | 31.5% | 35.4% | (12.6%) | ||||||||||||||
| Market capitalisation |
78,606 | 85,235 | 84,450 | 67,255 | 51,319 | |||||||||||||||
| Dividend |
181c | 178c | 164c | 145c | 140c | |||||||||||||||
| Franked portion – interim |
100% | 100% | 100% | 100% | 100% | |||||||||||||||
| – final |
100% | 100% | 100% | 100% | 100% | |||||||||||||||
| Share price – high |
$37.25 | $35.07 | $32.09 | $25.12 | $25.96 | |||||||||||||||
| – low |
$26.38 | $28.84 | $23.42 | $18.60 | $17.63 | |||||||||||||||
| – closing |
$27.08 | $30.92 | $30.78 | $24.75 | $19.52 | |||||||||||||||
| Share information |
||||||||||||||||||||
| (per fully paid ordinary share) |
||||||||||||||||||||
| Earnings per share |
271.5c | 267.1c | 232.7c | 213.4c | 208.2c | |||||||||||||||
| Dividend payout ratio |
68.6% | 67.4% | 71.4% | 69.4% | 68.6% | |||||||||||||||
| Net tangible assets per ordinary share6 |
$16.86 | $14.65 | $13.48 | $12.22 | $11.44 | |||||||||||||||
| No. of fully paid ordinary shares issued (millions) |
2,902.7 | 2,756.6 | 2,743.7 | 2,717.4 | 2,629.0 | |||||||||||||||
| Dividend reinvestment plan (DRP) issue price |
||||||||||||||||||||
| – interim |
$31.93 | $33.30 | $28.96 | $20.44 | $21.69 | |||||||||||||||
| – final |
– | $32.02 | $31.83 | $23.64 | $19.09 | |||||||||||||||
| Other information |
||||||||||||||||||||
| Points of representation7 |
1,229 | 1,220 | 1,274 | 1,337 | 1,381 | |||||||||||||||
| No. of employees (full time equivalents) |
50,152 | 50,328 | 49,866 | 48,239 | 50,297 | |||||||||||||||
| No. of shareholders8 |
546,558 | 498,309 | 468,343 | 438,958 | 442,943 | |||||||||||||||
| 1 | Since 1 October 2012, the Group has used cash profit as a measure of the result of the ongoing business activities of the Group enabling shareholders to assess Group and divisional performance against prior periods and against peer institutions. For 2012 - 2014 statutory profit has been adjusted for non-core items to arrive at cash profit. For 2011 statutory profit has been adjusted for non-core items to arrive at underlying profit, which like cash profit, is a measure of the ongoing business performance of the Group but used different criteria for the adjusting items. Neither cash profit nor underlying profit are audited; however, the external auditor has informed the Audit Committee that the adjustments have been determined on a consistent basis across each period presented. |
| 2 | Calculated in accordance with APRA Basel 3 requirements for 2012-2015. Comparatives for 2011 are calculated on a Basel 2 basis. |
| 3 | ANZ’s interpretation of the regulations documented in the Basel Committee publications; “Basel 3: A global regulatory framework for more resilient banks and banking systems” (June 2011) and “International Convergence of Capital Measurement and Capital Standards” (June 2006). Also includes differences identifies in APRA’s information paper entitled International Capital Comparison Study (13 July 2015). |
| 4 | Average ordinary equity excludes non-controlling interests and preference shares. |
| 5 | Return on average ordinary equity and average assets have been calculated on statutory basis, in consistent with the last five years. |
| 6 | Equals shareholders’ equity less preference share capital, goodwill, software and other intangible assets divided by the number of ordinary shares. |
| 7 | Includes branches, offices, representative offices and agencies. |
| 8 | Excludes employees whose only ANZ shares are held in trust under ANZ employee share schemes. |
174
ANZ ANNUAL REPORT 2015
PRINCIPAL RISKS AND UNCERTAINTIES
| PRINCIPAL RISKS AND UNCERTAINTIES 175 | ||
PRINCIPAL RISKS AND UNCERTAINTIES (continued)
176
ANZ ANNUAL REPORT 2015
| PRINCIPAL RISKS AND UNCERTAINTIES 177 | ||
PRINCIPAL RISKS AND UNCERTAINTIES (continued)
| 178 |
ANZ ANNUAL REPORT 2015
| PRINCIPAL RISKS AND UNCERTAINTIES 179 | ||
PRINCIPAL RISKS AND UNCERTAINTIES (continued)
180
ANZ ANNUAL REPORT 2015
| PRINCIPAL RISKS AND UNCERTAINTIES 181 | ||
PRINCIPAL RISKS AND UNCERTAINTIES (continued)
182
ANZ ANNUAL REPORT 2015
| PRINCIPAL RISKS AND UNCERTAINTIES 183 | ||
SUPPLEMENTARY INFORMATION
1: Exchange Rates
The exchange rates used in the translation of the results and the assets and liabilities of major overseas branches and controlled entities are:
| 2015
|
2014
|
|||||||||||||||
| Closing | Average | Closing | Average | |||||||||||||
| Chinese Renminbi |
4.4573 | 4.8803 | 5.3787 | 5.6547 | ||||||||||||
| Euro |
0.6229 | 0.6838 | 0.6895 | 0.6779 | ||||||||||||
| Pound Sterling |
0.4625 | 0.5074 | 0.5383 | 0.5552 | ||||||||||||
| Indian Rupee |
46.142 | 49.522 | 53.941 | 56.166 | ||||||||||||
| Indonesian Rupiah |
10,281 | 10,199 | 10,660 | 10,787 | ||||||||||||
| Japanese Yen |
84.072 | 93.515 | 95.677 | 94.133 | ||||||||||||
| Malaysian Ringgit |
3.1176 | 2.8761 | 2.8632 | 2.9749 | ||||||||||||
| New Taiwan Dollar |
23.066 | 24.543 | 26.639 | 27.587 | ||||||||||||
| New Zealand Dollar |
1.1003 | 1.0785 | 1.1219 | 1.0931 | ||||||||||||
| Papua New Guinea Kina |
2.0123 | 2.0940 | 2.1717 | 2.2353 | ||||||||||||
| United States Dollar |
0.7013 | 0.7839 | 0.8752 | 0.9201 | ||||||||||||
2. Explanation of adjustments between statutory profit and cash profit
186
ANZ ANNUAL REPORT 2015
| 2015 | 2014 | |||||||
| $m | $m | |||||||
| Adjustments to the income statement |
||||||||
| Timing differences where IFRS results in asymmetry between the hedge and hedged items |
||||||||
| Economic hedging |
(255 | ) | (103 | ) | ||||
| Revenue and net investment hedges |
(4 | ) | (143 | ) | ||||
| Increase/(decrease) to cash profit before tax |
(259 | ) | (246 | ) | ||||
| Increase/(decrease) to cash profit after tax |
(182 | ) | (173 | ) | ||||
|
As at |
||||||||
| 2015 | 2014 | |||||||
| $m | $m | |||||||
| Cumulative increase/(decrease) to cash profit pre-tax relating to economic hedging |
||||||||
| Timing differences where IFRS results in asymmetry between the hedge and hedged items (before tax) |
||||||||
| Economic hedging |
295 | 550 | ||||||
| Revenue and net investment hedges |
32 | 36 | ||||||
| 327 | 586 | |||||||
| 2015 | 2014 | |||||||
| $m | $m | |||||||
| Increase/(decrease) to cash profit |
||||||||
| Profit before income tax |
(8 | ) | 22 | |||||
| Income tax expense |
2 | (1 | ) | |||||
| Profit after income tax |
(6 | ) | 21 | |||||
|
As at
|
||||||||
| 2015 | 2014 | |||||||
| $m | $m | |||||||
| Financial impacts on credit intermediation trades |
||||||||
| Mark-to-market exposure to financial guarantors |
69 | 82 | ||||||
| Cumulative costs relating to financial guarantors1 |
||||||||
| CVA for outstanding transactions |
17 | 24 | ||||||
| Realised close out and hedge costs |
372 | 373 | ||||||
| Cumulative life to date charges |
389 | 397 | ||||||
| 1 | The cumulative costs in managing the positions include realised losses relating to restructuring of trades in order to reduce risks and realised losses on termination of sold protection trades. It also includes foreign exchange hedging losses. |
SUPPLEMENTARY INFORMATION 187
SHAREHOLDER INFORMATION
Ordinary Shares
At 9 October 2015, the twenty largest holders of ANZ ordinary shares held 1,611,541,422 ordinary shares, equal to 55.52% of the total issued ordinary capital.
| Name | Number of shares |
% of shares |
||||||||
|
|
||||||||||
| 1 | HSBC CUSTODY NOMINEES (AUSTRALIA) LIMITED | 550,524,181 | 18.97 | |||||||
| 2 | J P MORGAN NOMINEES AUSTRALIA LIMITED | 366,481,654 | 12.63 | |||||||
| 3 | NATIONAL NOMINEES LIMITED | 291,223,298 | 10.03 | |||||||
| 4 | CITICORP NOMINEES PTY LIMITED | 167,694,445 | 5.78 | |||||||
| 5 | BNP PARIBAS NOMS PTY LTD <DRP> | 70,907,594 | 2.44 | |||||||
| 6 | CITICORP NOMINEES PTY LIMITED <COLONIAL FIRST STATE INV A/C> | 29,370,434 | 1.01 | |||||||
| 7 | CITICORP NOMINEES PTY LIMITED <CITIBANK NY ADR DEP A/C> | 19,277,183 | 0.66 | |||||||
| 8 | AMP LIFE LIMITED | 18,220,633 | 0.63 | |||||||
| 9 | HSBC CUSTODY NOMINEES (AUSTRALIA) LIMITED <NT-COMNWLTH SUPER CORP A/C> | 18,183,444 | 0.63 | |||||||
| 10 | ARGO INVESTMENTS LIMITED | 9,762,275 | 0.34 | |||||||
| 11 | UBS WEALTH MANAGEMENT AUSTRALIA NOMINEES PTY LTD | 9,079,789 | 0.31 | |||||||
| 12 | RBC INVESTOR SERVICES AUSTRALIA NOMINEES PTY LIMITED <PI POOLED A/C> | 8,965,343 | 0.31 | |||||||
| 13 | AUSTRALIAN FOUNDATION INVESTMENT COMPANY LIMITED | 8,487,710 | 0.29 | |||||||
| 14 | ANZEST PTY LTD <DEFERRED SHARE PLAN A/C> | 7,774,518 | 0.27 | |||||||
| 15 | ANZEST PTY LTD <DEA CONTROL A/C> | 7,576,947 | 0.26 | |||||||
| 16 | BNP PARIBAS NOMINEES PTY LTD <AGENCY LENDING DRP A/C> | 7,478,557 | 0.26 | |||||||
| 17 | NAVIGATOR AUSTRALIA LTD <MLC INVESTMENT SETT A/C> | 5,595,482 | 0.19 | |||||||
| 18 | RBC INVESTOR SERVICES AUSTRALIA NOMINEES PTY LIMITED <BKCUST A/C> | 5,301,529 | 0.18 | |||||||
| 19 | QUESTOR FINANCIAL SERVICES LIMITED <TPS RF A/C> | 4,904,823 | 0.17 | |||||||
| 20 | NULIS NOMINEES (AUSTRALIA) LIMITED <NAVIGATOR MAST PLAN SETT A/C> | 4,731,583 | 0.16 | |||||||
|
|
||||||||||
| Total |
1,611,541,422 | 55.52 | ||||||||
|
|
||||||||||
DISTRIBUTION OF SHAREHOLDINGS
| At 9 October 2015 Range of shares |
Number of holders |
% of holders |
Number of shares |
% of shares |
||||||||||||||
|
|
||||||||||||||||||
| 1 to 1,000 |
302,055 | 55.05 | 124,806,734 | 4.30 | ||||||||||||||
| 1,001 to 5,000 |
197,864 | 36.06 | 449,914,855 | 15.50 | ||||||||||||||
| 5,001 to 10,000 |
31,536 | 5.75 | 218,942,284 | 7.54 | ||||||||||||||
| 10,001 to 100,000 |
16,745 | 3.05 | 336,776,063 | 11.60 | ||||||||||||||
| Over 100,000 |
485 | 0.09 | 1,772,274,425 | 61.06 | ||||||||||||||
|
|
||||||||||||||||||
| Total |
548,685 | 100.00 | 2,902,714,361 | 100.00 | ||||||||||||||
|
|
||||||||||||||||||
At 9 October 2015:
| – | there were no persons with a substantial shareholding in the Company; |
| – | the average size of holdings of ordinary shares was 5,290 (2014: 5,509) shares; and |
| – | there were 10,556 holdings (2014: 9,711 holdings) of less than a marketable parcel (less than $500 in value or 18 shares based on the closing market price of $28.46 per share), which is less than 1.93% of the total holdings of ordinary shares. |
VOTING RIGHTS OF ORDINARY SHARES
The Constitution provides for votes to be cast as follows:
| i) | on show of hands, one vote for each shareholder; and |
| ii) | on a poll, one vote for every fully paid ordinary share. |
A register of holders of ordinary shares is held at:
452 Johnston Street
Abbotsford
Victoria, Australia
(Telephone: +61 3 9415 4010)
188
ANZ ANNUAL REPORT 2015
ANZ Convertible Preference Shares
ANZ CPS2
On 17 December 2009 the Company issued convertible preference shares (ANZ CPS2) which were offered pursuant to a prospectus dated 18 November 2009.
At 9 October 2015, the twenty largest holders of ANZ CPS2 held 3,883,712 securities, equal to 19.73% of the total issued securities.
| Name | Number of securities |
% of securities |
||||||||
|
|
||||||||||
| 1 | NATIONAL NOMINEES LIMITED | 440,628 | 2.24 | |||||||
| 2 | QUESTOR FINANCIAL SERVICES LIMITED <TPS RF A/C> | 436,081 | 2.21 | |||||||
| 3 | J P MORGAN NOMINEES AUSTRALIA LIMITED | 421,014 | 2.14 | |||||||
| 4 | UBS WEALTH MANAGEMENT AUSTRALIA NOMINEES PTY LTD | 375,127 | 1.91 | |||||||
| 5 | NAVIGATOR AUSTRALIA LTD <MLC INVESTMENT SETT A/C> | 281,069 | 1.43 | |||||||
| 6 | HSBC CUSTODY NOMINEES (AUSTRALIA) LIMITED | 240,371 | 1.22 | |||||||
| 7 | NULIS NOMINEES (AUSTRALIA) LIMITED <NAVIGATOR MAST PLAN SETT A/C> | 234,054 | 1.19 | |||||||
| 8 | AUSTRALIAN EXECUTOR TRUSTEES LIMITED <NO 1 ACCOUNT> | 207,731 | 1.06 | |||||||
| 9 | AVANTEOS INVESTMENTS LIMITED <ENCIRCLE IMA A/C> | 192,532 | 0.98 | |||||||
| 10 | THE AUSTRALIAN NATIONAL UNIVERSITY | 170,000 | 0.86 | |||||||
| 11 | CITICORP NOMINEES PTY LIMITED <COLONIAL FIRST STATE INV A/C> | 145,335 | 0.74 | |||||||
| 12 | NETWEALTH INVESTMENTS LIMITED <WRAP SERVICES A/C> | 136,241 | 0.69 | |||||||
| 13 | JMB PTY LIMITED | 100,600 | 0.51 | |||||||
| 14 | UBS NOMINEES PTY LTD | 100,153 | 0.51 | |||||||
| 15 | RANDAZZO C & G DEVELOPMENTS PTY LTD | 78,500 | 0.4 | |||||||
| 16 | HSBC CUSTODY NOMINEES (AUSTRALIA) LIMITED—A/C 2 | 73,020 | 0.37 | |||||||
| 17 | AVANTEOS INVESTMENTS LIMITED <ENCIRCLE SUPER A/C> | 72,452 | 0.37 | |||||||
| 18 | MR PHILIP WILLIAM DOYLE | 60,000 | 0.3 | |||||||
| 19 | W MITCHELL INVESTMENTS PTY LTD <W MITCHELL SUPER FUND> | 60,000 | 0.3 | |||||||
| 20 | QUESTOR FINANCIAL SERVICES LIMITED <TPS PIP A/C> | 58,804 | 0.3 | |||||||
|
|
||||||||||
| Total |
3,883,712 | 19.73 | ||||||||
|
|
||||||||||
DISTRIBUTION OF ANZ CPS2 HOLDINGS
| At 9 October 2015 Range of securities |
Number of holders |
% of holders |
Number of securities |
% of securities |
||||||||||||||
|
|
||||||||||||||||||
| 1 to 1,000 |
28,415 | 92.33 | 8,869,487 | 45.05 | ||||||||||||||
| 1,001 to 5,000 |
2,137 | 6.94 | 4,379,273 | 22.24 | ||||||||||||||
| 5,001 to 10,000 |
146 | 0.47 | 1,119,705 | 5.69 | ||||||||||||||
| 10,001 to 100,000 |
65 | 0.21 | 1,837,823 | 9.34 | ||||||||||||||
| Over 100,000 |
14 | 0.05 | 3,480,936 | 17.68 | ||||||||||||||
|
|
||||||||||||||||||
| Total |
30,777 | 100.00 | 19,687,224 | 100.00 | ||||||||||||||
|
|
||||||||||||||||||
At 9 October 2015 there were 13 holdings (2014: 11 holdings) of less than a marketable parcel (less than $500 in value or 5 securities based on the closing market price of $100.300 per security), which is less than 0.05% of the total holdings of ANZ CPS2.
SHAREHOLDER INFORMATION 189
SHAREHOLDER INFORMATION (continued)
ANZ CPS3
On 28 September 2011 the Company issued convertible preference shares (ANZ CPS3) which were offered pursuant to a prospectus dated 31 August 2011.
At 9 October 2015, the twenty largest holders of ANZ CPS3 held 2,360,561 securities, equal to 17.61% of the total issued securities.
| Name | Number of securities |
% of securities |
||||||||
|
|
||||||||||
| 1 | UBS WEALTH MANAGEMENT AUSTRALIA NOMINEES PTY LTD | 420,067 | 3.14 | |||||||
| 2 | HSBC CUSTODY NOMINEES (AUSTRALIA) LIMITED | 238,178 | 1.78 | |||||||
| 3 | NAVIGATOR AUSTRALIA LTD <MLC INVESTMENT SETT A/C> | 200,284 | 1.5 | |||||||
| 4 | RAKIO PTY LTD <PIEKARSKI GYMPIE A/C> | 200,000 | 1.49 | |||||||
| 5 | NULIS NOMINEES (AUSTRALIA) LIMITED <NAVIGATOR MAST PLAN SETT A/C> | 146,124 | 1.09 | |||||||
| 6 | QUESTOR FINANCIAL SERVICES LIMITED <TPS RF A/C> | 141,352 | 1.05 | |||||||
| 7 | CITICORP NOMINEES PTY LIMITED <COLONIAL FIRST STATE INV A/C> | 139,630 | 1.04 | |||||||
| 8 | AUSTRALIAN EXECUTOR TRUSTEES LIMITED <NO 1 ACCOUNT> | 117,198 | 0.88 | |||||||
| 9 | NATIONAL NOMINEES LIMITED | 86,935 | 0.65 | |||||||
| 10 | DIMBULU PTY LTD | 85,000 | 0.63 | |||||||
| 11 | LONGHURST MANAGEMENT SERVICES PTY LTD | 83,246 | 0.62 | |||||||
| 12 | MICHAEL COPPEL VENTURES P/L <MICHAEL COPPEL VENTURES A/C> | 80,000 | 0.6 | |||||||
| 13 | JMB PTY LIMITED | 70,000 | 0.52 | |||||||
| 14 | NETWEALTH INVESTMENTS LIMITED <WRAP SERVICES A/C> | 57,154 | 0.43 | |||||||
| 15 | BNP PARIBAS NOMS PTY LTD <DRP> | 53,485 | 0.4 | |||||||
| 16 | NETWEALTH INVESTMENTS LIMITED <SUPER SERVICES A/C> | 50,215 | 0.37 | |||||||
| 17 | EASTCOTE PTY LTD <VAN LIESHOUT FAMILY A/C> | 50,000 | 0.37 | |||||||
| 18 | RANDAZZO C & G DEVELOPMENTS PTY LTD | 50,000 | 0.37 | |||||||
| 19 | RBC INVESTOR SERVICES AUSTRALIA NOMINEES PTY LIMITED <MULTIPORT A/C> | 49,693 | 0.37 | |||||||
| 20 | SIR MOSES MONTEFIORE JEWISH HOME <INCOME A/C> | 42,000 | 0.31 | |||||||
|
|
||||||||||
| Total |
2,360,561 | 17.61 | ||||||||
|
|
||||||||||
DISTRIBUTION OF ANZ CPS3 HOLDINGS
| At 9 October 2015 Range of securities |
Number of holders |
% of holders |
Number of securities |
% of securities |
||||||||||||||
|
|
||||||||||||||||||
| 1 to 1,000 |
19,734 | 92.22 | 6,272,592 | 46.81 | ||||||||||||||
| 1,001 to 5,000 |
1,512 | 7.07 | 3,189,377 | 23.80 | ||||||||||||||
| 5,001 to 10,000 |
89 | 0.41 | 690,503 | 5.15 | ||||||||||||||
| 10,001 to 100,000 |
55 | 0.26 | 1,644,695 | 12.28 | ||||||||||||||
| Over 100,000 |
8 | 0.04 | 1,602,833 | 11.96 | ||||||||||||||
|
|
||||||||||||||||||
| Total |
21,398 | 100.00 | 13,400,000 | 100.00 | ||||||||||||||
|
|
||||||||||||||||||
At 9 October 2015 there were 10 holdings (2014: 4 holdings) of less than a marketable parcel (less than $500 in value or 6 securities based on the closing market price of $99.801 per security), which is less than 0.05% of the total holdings of ANZ CPS3.
VOTING RIGHTS OF ANZ CPS3
190
ANZ ANNUAL REPORT 2015
ANZ Capital Notes
ANZ CN1
On 7 August 2013 the Company issued convertible subordinated perpetual notes (ANZ CN1) which were offered pursuant to a prospectus dated 10 July 2013.
At 9 October 2015 the twenty largest holders of ANZ CN1 held 2,077,008 securities, equal to 18.54% of the total issued securities.
| Name | Number of securities |
% of securities |
||||||||
|
|
||||||||||
| 1 | UBS WEALTH MANAGEMENT AUSTRALIA NOMINEES PTY LTD | 343,134 | 3.06 | |||||||
| 2 | NATIONAL NOMINEES LIMITED | 308,966 | 2.76 | |||||||
| 3 | J P MORGAN NOMINEES AUSTRALIA LIMITED | 218,314 | 1.95 | |||||||
| 4 | NAVIGATOR AUSTRALIA LTD <MLC INVESTMENT SETT A/C> | 157,245 | 1.4 | |||||||
| 5 | CITICORP NOMINEES PTY LIMITED | 135,470 | 1.21 | |||||||
| 6 | HSBC CUSTODY NOMINEES (AUSTRALIA) LIMITED | 133,228 | 1.19 | |||||||
| 7 | NULIS NOMINEES (AUSTRALIA) LIMITED <NAVIGATOR MAST PLAN SETT A/C> | 115,309 | 1.03 | |||||||
| 8 | NETWEALTH INVESTMENTS LIMITED <WRAP SERVICES A/C> | 114,206 | 1.02 | |||||||
| 9 | BNP PARIBAS NOMS PTY LTD <DRP> | 87,150 | 0.78 | |||||||
| 10 | SERVCORP HOLDINGS PTY LTD | 72,817 | 0.65 | |||||||
| 11 | DIMBULU PTY LTD | 50,000 | 0.45 | |||||||
| 12 | RANDAZZO C & G DEVELOPMENTS PTY LTD | 50,000 | 0.45 | |||||||
| 13 | AUSTRALIAN MASTERS YIELD FUND NO 5 LIMITED | 45,410 | 0.4 | |||||||
| 14 | ADCO CONSTRUCTIONS PTY LTD | 40,000 | 0.36 | |||||||
| 15 | THORSEN INVESTMENTS PTY LTD | 40,000 | 0.36 | |||||||
| 16 | NETWEALTH INVESTMENTS LIMITED <SUPER SERVICES A/C> | 38,835 | 0.35 | |||||||
| 17 | AUSTRALIAN EXECUTOR TRUSTEES LIMITED <NO 1 ACCOUNT> | 37,542 | 0.33 | |||||||
| 18 | HSBC CUSTODY NOMINEES (AUSTRALIA) LIMITED—A/C 2 | 32,528 | 0.29 | |||||||
| 19 | QUESTOR FINANCIAL SERVICES LIMITED <TPS RF A/C> | 31,854 | 0.28 | |||||||
| 20 | BARRETT SUPERFUND PTY LTD <BARRETT SUPERFUND A/C> | 25,000 | 0.22 | |||||||
|
|
||||||||||
| Total |
2,077,008 | 18.54 | ||||||||
|
|
||||||||||
DISTRIBUTION OF ANZ CN1 HOLDINGS
| At 9 October 2015 Range of securities |
Number of holders |
% of holders |
Number of securities |
% of securities |
||||||||||||||
|
|
||||||||||||||||||
| 1 to 1,000 |
15,088 | 91.17 | 5,037,427 | 44.98 | ||||||||||||||
| 1,001 to 5,000 |
1,315 | 7.95 | 2,850,461 | 25.45 | ||||||||||||||
| 5,001 to 10,000 |
95 | 0.57 | 739,250 | 6.60 | ||||||||||||||
| 10,001 to 100,000 |
43 | 0.26 | 1,046,990 | 9.35 | ||||||||||||||
| Over 100,000 |
8 | 0.05 | 1,525,872 | 13.62 | ||||||||||||||
|
|
||||||||||||||||||
| Total |
16,549 | 100.00 | 11,200,000 | 100.00 | ||||||||||||||
|
|
||||||||||||||||||
At 9 October 2015 there were 6 holdings (2014: 4 holdings) of less than a marketable parcel (less than $500 in value or 6 securities based on the closing market price of $93.989 per security), which is less than 0.04% of the total holdings of ANZ CN1.
VOTING RIGHTS OF ANZ CN1
SHAREHOLDER INFORMATION 191
SHAREHOLDER INFORMATION (continued)
ANZ CN2
On 31 March 2014 the Company issued convertible subordinated perpetual notes (ANZ CN2) which were offered pursuant to a prospectus dated 19 February 2014.
At 9 October 2015 the twenty largest holders of ANZ CN2 held 2,954,397 securities, equal to 18.35% of the total issued securities.
| Name | Number of securities |
% of securities |
||||||||
|
|
||||||||||
| 1 | UBS WEALTH MANAGEMENT AUSTRALIA NOMINEES PTY LTD | 571,044 | 3.55 | |||||||
| 2 | HSBC CUSTODY NOMINEES (AUSTRALIA) LIMITED | 497,649 | 3.09 | |||||||
| 3 | NATIONAL NOMINEES LIMITED | 240,884 | 1.5 | |||||||
| 4 | J P MORGAN NOMINEES AUSTRALIA LIMITED | 217,978 | 1.35 | |||||||
| 5 | QUESTOR FINANCIAL SERVICES LIMITED <TPS RF A/C> | 185,342 | 1.15 | |||||||
| 6 | JOHN E GILL TRADING PTY LTD | 164,193 | 1.02 | |||||||
| 7 | BNP PARIBAS NOMS PTY LTD <DRP> | 142,915 | 0.89 | |||||||
| 8 | NAVIGATOR AUSTRALIA LTD <MLC INVESTMENT SETT A/C> | 141,223 | 0.88 | |||||||
| 9 | NETWEALTH INVESTMENTS LIMITED <WRAP SERVICES A/C> | 107,286 | 0.67 | |||||||
| 10 | LIGHTNINGEDGE PTY LTD | 100,000 | 0.62 | |||||||
| 11 | NULIS NOMINEES (AUSTRALIA) LIMITED <NAVIGATOR MAST PLAN SETT A/C> | 87,364 | 0.54 | |||||||
| 12 | PERSHING AUSTRALIA NOMINEES PTY LTD <IMPLEMENTED PORTFOLIOS A/C> | 81,932 | 0.51 | |||||||
| 13 | RAKIO PTY LTD <PIEKARSKI GYMPIE A/C> | 60,000 | 0.37 | |||||||
| 14 | AUSTRALIAN EXECUTOR TRUSTEES LIMITED <NO 1 ACCOUNT> | 59,405 | 0.37 | |||||||
| 15 | AUSTRALIAN MASTERS YIELD FUND NO 5 LIMITED | 50,000 | 0.31 | |||||||
| 16 | BALLARD BAY PTY LTD <BALLARD BAY DISCRETIONARY AC> | 50,000 | 0.31 | |||||||
| 17 | ELMORE SUPER PTY LTD <PEABODY SUPERFUND A/C> | 50,000 | 0.31 | |||||||
| 18 | JMB PTY LIMITED | 50,000 | 0.31 | |||||||
| 19 | KOLL PTY LTD <NO 1 ACCOUNT> | 50,000 | 0.31 | |||||||
| 20 | CITICORP NOMINEES PTY LIMITED | 47,182 | 0.29 | |||||||
|
|
||||||||||
| Total |
2,954,397 | 18.35 | ||||||||
|
|
||||||||||
DISTRIBUTION OF ANZ CN2 HOLDINGS
| At 9 October 2015 Range of securities |
Number of holders |
% of holders |
Number of securities |
% of securities |
||||||||||||||
|
|
||||||||||||||||||
| 1 to 1,000 |
20,414 | 90.29 | 6,720,914 | 41.74 | ||||||||||||||
| 1,001 to 5,000 |
1,971 | 8.72 | 4,061,343 | 25.23 | ||||||||||||||
| 5,001 to 10,000 |
141 | 0.62 | 1,097,378 | 6.82 | ||||||||||||||
| 10,001 to 100,000 |
75 | 0.33 | 1,951,851 | 12.12 | ||||||||||||||
| Over 100,000 |
9 | 0.04 | 2,268,514 | 14.09 | ||||||||||||||
|
|
||||||||||||||||||
| Total |
22,610 | 100.00 | 16,100,000 | 100.00 | ||||||||||||||
|
|
||||||||||||||||||
At 9 October 2015 there were 3 holdings of less than a marketable parcel (less than $500 in value or 6 securities based on the closing market price of $91.600 per security), which is less than 0.02% of the total holdings of ANZ CN2.
VOTING RIGHTS OF ANZ CN2
192
ANZ ANNUAL REPORT 2015
ANZ CN3
On 5 March 2015 the Company acting through its New Zealand Branch issued convertible subordinated perpetual notes (ANZ CN3) which were offered pursuant to a prospectus dated 5 February 2015.
At 9 October 2015 the twenty largest holders of ANZ CN3 held 1,752,440 securities, equal to 18.06% of the total issued securities.
| Name | Number of securities |
% of securities |
||||||||
|
|
||||||||||
| 1 | UBS WEALTH MANAGEMENT AUSTRALIA NOMINEES PTY LTD | 336,235 | 3.46 | |||||||
| 2 | HSBC CUSTODY NOMINEES (AUSTRALIA) LIMITED | 192,152 | 1.98 | |||||||
| 3 | LONGHURST MANAGEMENT SERVICES PTY LTD | 167,000 | 1.72 | |||||||
| 4 | CITICORP NOMINEES PTY LIMITED | 100,812 | 1.04 | |||||||
| 5 | TRANSFIELD FINANCE PTY LTD | 100,600 | 1.04 | |||||||
| 6 | RAKIO PTY LTD <PIEKARSKI GYMPIE A/C> | 100,000 | 1.03 | |||||||
| 7 | J P MORGAN NOMINEES AUSTRALIA LIMITED | 83,376 | 0.86 | |||||||
| 8 | PERSHING AUSTRALIA NOMINEES PTY LTD <IMPLEMENTED PORTFOLIOS A/C> | 74,296 | 0.76 | |||||||
| 9 | NATIONAL NOMINEES LIMITED | 68,233 | 0.7 | |||||||
| 10 | MR YUXIANG DU | 60,000 | 0.62 | |||||||
| 11 | NETWEALTH INVESTMENTS LIMITED <WRAP SERVICES A/C> | 57,464 | 0.59 | |||||||
| 12 | BNP PARIBAS NOMS PTY LTD <DRP> | 54,587 | 0.56 | |||||||
| 13 | JDB SERVICES PTY LTD <RAC & JD BRICE INVEST A/C> | 50,665 | 0.52 | |||||||
| 14 | GARRY JOHNSON + MARGARET JOHNSON <JOHNSON FAMILY A/C> | 50,000 | 0.52 | |||||||
| 15 | ROOKWOOD GENERAL CEMETERIES RESERVE | 50,000 | 0.52 | |||||||
| 16 | THE WALTER AND ELIZA HALL INSTITUTE OF MEDICAL RESEARCH | 50,000 | 0.52 | |||||||
| 17 | HAWAII INVESTMENTS PTY LTD | 44,250 | 0.46 | |||||||
| 18 | HSBC CUSTODY NOMINEES (AUSTRALIA) LIMITED—A/C 2 | 40,770 | 0.42 | |||||||
| 19 | MR PAUL WILLIAM BROTCHIE + MR KENNETH FRANCIS WALLACE <STAFFORD FOX FOUNDATION A/C> | 40,000 | 0.41 | |||||||
| 20 | WONGA BEACH VILLAGE PTY LTD | 32,000 | 0.33 | |||||||
|
|
||||||||||
| Total |
1,752,440 | 18.06 | ||||||||
|
|
||||||||||
DISTRIBUTION OF ANZ CN3 HOLDINGS
| At 9 October 2015 Range of securities |
Number of holders |
% of holders |
Number of securities |
% of securities |
||||||||||||||
|
|
||||||||||||||||||
| 1 to 1,000 |
11,708 | 90.56 | 3,979,933 | 41.02 | ||||||||||||||
| 1,001 to 5,000 |
1,068 | 8.26 | 2,433,191 | 25.08 | ||||||||||||||
| 5,001 to 10,000 |
95 | 0.74 | 790,232 | 8.15 | ||||||||||||||
| 10,001 to 100,000 |
52 | 0.40 | 1,601,636 | 16.51 | ||||||||||||||
| Over 100,000 |
5 | 0.04 | 896,799 | 9.24 | ||||||||||||||
|
|
||||||||||||||||||
| Total |
12,928 | 100.00 | 9,701,791 | 100.00 | ||||||||||||||
|
|
||||||||||||||||||
At 9 October 2015 there were 2 holdings of less than a marketable parcel (less than $500 in value or 6 securities based on the closing market price of $92.383 per security), which is less than 0.02% of the total holdings of ANZ CN3.
VOTING RIGHTS OF ANZ CN3
SHAREHOLDER INFORMATION 193
SHAREHOLDER INFORMATION (continued)
194
ANZ ANNUAL REPORT 2015
GLOSSARY
GLOSSARY 195
GLOSSARY (continued)
196
ANZ ANNUAL REPORT 2015
| GLOSSARY 197 |
ALPHABETICAL INDEX
198