Attached files
| file | filename |
|---|---|
| EX-31.2 - CERTIFICATION OF CFO - ROFIN SINAR TECHNOLOGIES INC | a2015930-ex312.htm |
| EX-31.1 - CERTIFICATION OF CEO - ROFIN SINAR TECHNOLOGIES INC | a2015930-ex311.htm |
| EX-32.2 - SECTION 1350 CFO CERTIFICATION - ROFIN SINAR TECHNOLOGIES INC | a2015930-ex322.htm |
| EX-23.1 - CONSENT OF INDEPENDENT AUDITORS - ROFIN SINAR TECHNOLOGIES INC | a2015930-ex231.htm |
| EX-21.1 - LIST OF SUBSIDIARIES - ROFIN SINAR TECHNOLOGIES INC | a2015930-ex211.htm |
| EX-32.1 - SECTION 1350 CERTIFICATION OF CEO - ROFIN SINAR TECHNOLOGIES INC | a2015930-ex321.htm |
| EX-10.13 - EXHIBIT 10.13 FORM OF EMPLOYMENT AGREEMENT - ROFIN SINAR TECHNOLOGIES INC | a20150930-ex1013.htm |
| EX-10.14 - EXHIBIT 10.14 FORM OF EMPLOYMENT AGREEMENT - ROFIN SINAR TECHNOLOGIES INC | a20150930-ex1014.htm |
UNITED STATES
SECURITIES AND EXCHANGE COMMISSION
Washington, D.C. 20549
FORM 10-K
ý | ANNUAL REPORT PURSUANT TO SECTION 13 OR 15(d) OF THE SECURITIES EXCHANGE ACT OF 1934 |
For the fiscal year ended September 30, 2015
o | TRANSITION REPORT PURSUANT TO SECTION 13 OR 15(d) OF THE SECURITIES EXCHANGE ACT OF 1934 |
For the transition period from to
Commission file number: 000-21377
ROFIN-SINAR TECHNOLOGIES INC.
(Exact name of Registrant as specified in its charter)
Delaware | 38-3306461 | |
(State or other jurisdiction of incorporation or organization) | (I.R.S. Employer Identification No.) | |
40984 Concept Drive, Plymouth, MI | 48170 | |
(Address of principal executive offices) | (Zip Code) | |
Registrant’s telephone number, including area code: (734) 455-5400
Securities registered pursuant to Section 12(b) of the Act:
Title of each class | Name of each exchange on which registered |
Common stock, par value $0.01 per Share | The NASDAQ Global Select Market |
Securities registered pursuant to Section 12(g) of the Act: NONE
Indicate by check mark if the registrant is a well-known seasoned issuer, as defined in Rule 405 of the
Securities Act. Yes ý No o
Indicate by check mark if the registrant is not required to file reports pursuant to Section 13 or Section 15(d) of the Act. Yes o No ý
Indicate by check mark whether the registrant: (1) has filed all reports required to be filed by Section 13 or 15(d) of the Securities Exchange Act of 1934 during the preceding 12 months (or for such shorter period that the registrant was required to file such reports) and (2) has been subject to such filing requirements for the past 90 days. Yes ý No o
Indicate by check mark whether the registrant has submitted electronically and posted on its corporate Website, if any, every Interactive Data File required to be submitted and posted pursuant to Rule 405 of Regulation S-T during the preceding 12 months (or for such shorter period that the registrant was required to submit and post such files). Yes ý No o
Indicate by check mark if disclosure of delinquent filers pursuant to Item 405 of Regulation S-K (§229.405 of this chapter) is not contained herein, and will not be contained, to the best of registrant’s knowledge, in definitive proxy or information statements incorporated by reference in Part III of this Form 10-K or any amendment to this Form 10-K. ý
Indicate by check mark whether the registrant is a large accelerated filer, an accelerated filer, a non-accelerated filer, or a smaller reporting Company. See definition of “accelerated filer”, “large accelerated filer”, and “smaller reporting company” in Rule 12b-2 of the Exchange Act.
Large accelerated filer ý Accelerated filer o Non-accelerated filer o Smaller reporting company o
Indicate by check mark whether the registrant is a shell company (as defined in Rule 12b-2 of the Exchange Act). Yes o No ý
The aggregate market value of the voting and non-voting common equity held by non-affiliates of the registrant based upon the closing price of the common stock on March 31, 2015 (the last business day of the most recently completed second fiscal quarter) as reported by the NASDAQ Global Select Market was approximately $673,519,517. For the purposes hereof, “affiliates” include all executive officers and directors of the registrant.
28,360,103 shares of the registrant’s common stock, par value $0.01 per share, were outstanding as of November 25, 2015.
Certain sections of the Company’s Proxy Statement to be filed in connection with the Company’s 2016 Annual Meeting of Stockholders expected to be held in March 2016, are incorporated by reference herein at Part III, Items 10-14.
2
ROFIN-SINAR TECHNOLOGIES INC.
TABLE OF CONTENTS
Page | |||
3
PART I
Cautionary Note Regarding Forward-Looking Statements
Certain statements in this Annual Report on Form 10-K constitute forward-looking statements within the meaning of the Private Securities Litigation Reform Act of 1995 (the “Reform Act”). Forward-looking statements include all statements that do not relate solely to historical or current facts, and can be identified by the use of words such as “may”, “believe”, “will”, “expect”, “project”, “anticipate”, “estimate”, “plan” or “continue”. These forward-looking statements are based on the current plans and expectations of our management and are subject to a number of uncertainties and risks that could significantly affect our current plans and expectations, as well as future results of operations and financial condition.
These factors include (among others):
• | downturns in the machine tool, automotive, semiconductor, electronics, photovoltaic, jewelry, flexible packaging, defense, and medical device industries which may have a material adverse effect on sales and profitability of the Company; |
• | the ability of the Company’s OEM customers to incorporate its laser products into their systems; |
• | the impact of exchange rate fluctuations, which may be significant because a substantial portion of the Company’s operations is located in non-U.S. countries; |
• | the level of competition and the ability of the Company to compete in the markets for its products; |
• | the Company’s ability to develop new and enhanced products to meet market demand or to adequately utilize its existing technology; |
• | third party infringement of the Company’s proprietary technology or third party claims against the Company for the infringement or misappropriation of proprietary rights; |
• | the scope of patent protection that the Company is able to obtain or maintain; |
• | competing technologies that are similar to or that serve the same uses as the Company’s technology; |
• | the Company’s ability to efficiently manage the risks associated with its international operations; |
• | risks associated with recent changes in the Company's senior management personnel; |
• | any adverse impact to the Company resulting from the announcement or implementation of any one or more of our cost reduction programs; |
• | the worldwide economic environment, including specifically, but not limited to, in Asia; and |
• | the other risks described under “ITEM 1A - Risk Factors”. |
In making these forward-looking statements, we claim the protection of the safe-harbor for forward-looking statements contained in the Reform Act. We do not assume any obligation to update these forward-looking statements to reflect actual results, changes in assumptions, or changes in other factors affecting such forward-looking statements.
ITEM 1. BUSINESS
COMPANY OVERVIEW
ROFIN-SINAR Technologies Inc. was incorporated in 1996 under the laws of the State of Delaware. ROFIN-SINAR's shares trade on the NASDAQ Global Select Market under the symbol RSTI. In this report, the terms “Company”, “ROFIN”, “RSTI”, “we”, “us”, and “our” mean ROFIN-SINAR Technologies Inc., and, to the extent applicable, all entities included in the Company's consolidated financial statements.
4
ROFIN-SINAR Technologies is a leader in the design, development, engineering, manufacturing and marketing of laser sources and laser-based system solutions for industrial material processing applications, which include primarily cutting, welding and marking a wide range of materials. The Company's product portfolio ranges from single laser-beam sources to highly complex systems, covering all of the key laser technologies such as CO2 lasers, fiber, ultrashort pulse, solid-state and diode lasers, and the entire power spectrum, from single-digit watts up to multi-kilowatts, as well as a comprehensive spectrum of wavelengths. An extensive range of laser components completes the product portfolio. Lasers are a non-contact technology for material processing, which have several advantages compared to conventional manufacturing tools that are desirable in industrial applications. The Company's lasers all deliver a high-quality beam at guaranteed power outputs and feature compact design, high processing speed, flexibility, low operating and maintenance costs and easy integration into the customer's production process thus meeting a broad range of material processing requirements of RSTI's customers.
Through its global manufacturing, distribution and service network, the Company provides a comprehensive range of laser sources and laser-based system solutions to the following principal target markets: the machine tool, automotive & sub-suppliers ("automotive"), semiconductor, electronics and photovoltaic industries. The Company sells directly to end users and to original equipment manufacturers (“OEMs”) that integrate ROFIN's laser sources with other system components. Many of ROFIN's customers are among the largest global participants in their respective industries. During fiscal 2015, 2014 and 2013, 21%, 19% and 20%, respectively, of the Company’s sales were in North America, 45%, 49% and 45%, respectively, were in Europe, and 34%, 32% and 35%, respectively, were in Asia.
ROFIN's sales approach in the laser-related business reflects the many different requirements of its customers throughout a multitude of industries, and is divided into three areas of core competence: Macro, Micro and Marking. The core of the Macro business section is high-powered laser sources, primarily used for cutting and welding as well as surface treatment applications. The Micro section concentrates on laser sources and laser-based system solutions that require less power output for micro-processing of materials. The Marking section specializes in innovative marking solutions on both organic and inorganic materials for many different industries. The activities in the components sector which comprises of diodes and diode laser components, power supplies, fibers and fiber beam deliveries as well as fiber laser components round out the Company's business activities in the industrial laser market. During fiscal 2015, 2014 and 2013, approximately 38%, 40% and 38%, respectively, of the Company’s revenues related to sales of laser products for macro applications, approximately 47%, 47% and 49%, respectively, related to sales of laser products for marking and micro applications, and approximately 15%, 13% and 13%, respectively, related to sales of components.
THE INDUSTRIAL LASER MARKET FOR MATERIAL PROCESSING
Over the past decades, lasers have revolutionized industrial manufacturing and have been used increasingly to provide reliable, flexible, non-contact, compact and high-speed alternatives to conventional technologies for processing various kinds of metal and non-metal materials in a broad range of advanced manufacturing applications. The industrial laser market is generally considered to be made up of laser sources sold for industrial applications including material processing, medical therapeutic, instrumentation, research, telecommunications, optical storage, entertainment, image recording, inspection, measurement and control, bar-code scanning and other end-uses.
According to the Industrial Laser Solutions magazine's 2015 industry forecast published in January 2015, worldwide laser revenues for industrial material processing applications, which are ROFIN’s primary addressed markets, are expected to reach approximately $2.8 billion. The Company has sold more than 75,000 laser sources since 1975 and currently has over 4,000 active customers (including multinational companies with multiple facilities purchasing from the Company).
BUSINESS STRATEGY
The Company's business strategy is to maximize shareholder value by, among other things, (i) strengthening its position as a leading supplier to the global market for macro (cutting and welding) applications; (ii) capitalizing on its leadership position in marking applications; (iii) extending its position in micro (fine cutting, fine welding, perforating and structuring applications); (iv) cross-selling its various laser products to its existing large customer base; (v) enlarging its market coverage geographically and by developing new applications; (vi) strengthening its product portfolio and customer base through acquisitions; (vii) capitalizing on its proprietary application process and technology portfolio; (viii) broadening its component product portfolio; (ix) focusing on continued cost reduction and efficiency improvement in processes and worldwide organizational structure.
5
The Company believes that the major sources of its future growth will be the following:
• | Developing New Laser Products through Technological Innovation: Product innovation in response to evolving customer needs for increased output power, greater penetration and higher processing speeds is a key component of the Company's strategy. The Company is actively engaged in the research and development of its low- and high-power fiber laser family to further expand its solid-state laser offering for marking, micro and macro applications. The Company is also enhancing its research and development efforts in order to broaden its portfolio of short and ultrashort pulse lasers. The Company is also focusing its research and development activity on expanding the output power range of its CO2, diffusion cooled, wave-guide Slab lasers and enhancing the performance of its line of high power, fast-flow CO2 lasers. In addition, the Company is expanding its series of end and side pumped, solid-state lasers for marking and micro applications. Especially for those lasers there are also activities to enlarge the portfolio by green and ultraviolet ("SHG" and "THG") laser products. In addition, research and development is focused on expanding the Company's product range, especially in the field of passive and active fibers, laser diodes, power supplies and fiber delivery systems. |
• | Focusing on Cross-Selling to Existing Customers in Target Markets: The Company intends to continue to focus its sales and marketing activities on its traditional target markets (the machine tool, automotive, semiconductor, electronics, photovoltaic, flexible packaging and medical device industries). The Company has targeted and will continue to target these industries because they use advanced manufacturing processes that require continuing investments to improve production efficiency and because the Company has significant market presence in these sectors. In addition, building on the success of its laser marking of small integrated circuits, the Company intends to develop new applications, such as fine welding, cutting and drilling for the semiconductor and electronics industry. In the packaging industry, the Company is seeking new opportunities for foil perforation based on its extensive knowledge of paper perforation with lasers. In the photovoltaic industry, the Company intends to further exploit structuring and annealing applications for its macro and micro laser products such as scribing of thin film solar cells as well as crystalline solar cells. In the consumer electronics and medical device industries, the Company is seeking new opportunities to cut brittle material for various applications such as displays and cover glasses for consumer electronic products, medical glass and architecture glass. |
• | Capitalizing on Global Presence to Attract New Customers: The Company intends to capitalize on its customer base and the presence of its manufacturing, sales and service operations in the three principal geographic markets in which its customers operate (North America, Europe and the Asia/Pacific region) to increase market share in its existing industrial and geographic markets. The Company believes its global manufacturing, distribution and service network allows it to be more responsive to customers' needs and positions it to expand into additional promising markets which offer high long-term potential for growth. |
• | Offering Customized Solutions based on Standard Platforms: While the Company offers a wide range of laser applications and develops customized solutions for its customers, these applications and solutions are built on a focused number of product families comprised of standardized laser sources. For example, for its OEM customers in the machine tool industry, the Company provides customized laser versions. For its marking customers, the Company combines its standard laser markers with customized parts handling and software. For its micro applications customers, the Company delivers its standard laser sources in different customized packages. The Company believes that this product strategy has contributed to increases in product sales and intends to continue offering focused customization services and pursuing its initiatives to standardize its core products so as to lower its production costs and continue to improve its profitability. |
• | Acquiring Complementary Business Operations, Products, Applications or Technologies: Besides growing organically, one of ROFIN's targets is to grow through strategic acquisitions. Since 1997 the Company has successfully acquired and integrated fifteen businesses, including its acquisitions of DILAS Diodenlaser GmbH (“DILAS”) (1997), assets of Palomar Technologies UK Ltd. (1998), Rasant-Alcotec Beschichtungstechnik GmbH (“Rasant”) (1999), Baasel Lasertech (“CBL” now "RBL") (2000), Z-Laser S.A. (2001), Optoskand AB (“Optoskand”) (2004), PRC Laser Corporation (“PRC”) and Lee Laser, Inc. (“Lee”) (2004), H2B Photonics GmbH (“H2B”) (2006), ES Technologies Ltd. (2007), Corelase Oy (2007), m2k-laser GmbH (2007), Nufern (2008), Nanjing Eastern Laser Co. Ltd. (“NELC”) (2009), the coil winding business from Optelecom-NKF, Inc. (2010), LASAG AG (“LASAG”) (2011) and assets of FiLaser USA LLC (2014). Management believes that, collectively, these acquisitions have advanced the Company's worldwide expansion, strengthened the Company's position in the industrial laser material processing market and |
6
positively contributed to the Company's financial performance during the last several years. The Company will continue to seek opportunities to make value-based acquisitions that complement its business operations, broaden its product offerings, or provide access to new geographical markets and applications.
LASER TECHNOLOGY
The term “laser” is an acronym for “Light Amplification by Stimulated Emission of Radiation”. Lasers were first developed in the early 1960s in the United States. A laser consists of an active lasing medium that gives off its own light (radiation) when excited, an optical resonator with a partially-reflective output mirror at one end, a fully-reflective rear mirror at the other that permits the light to bounce back and forth between the mirrors through the lasing medium, and an external energy source used to excite the lasing medium. A laser works by causing the energy source to excite (pump) the lasing medium, which converts the energy from the source into an emission consisting of particles of light (photons). These photons stimulate the release of more photons, as they are reflected between the two mirrors, which form the resonator. The resulting build-up in the number of photons is emitted in the form of a laser beam through an output port or “window”. By changing the energy and the lasing medium, different wavelengths and types of laser light can be produced. The laser produces light from the lasing medium to achieve the desired intensity, uniformity, and wavelength through a series of reflective mirrors. The heat generated by the excitation of the lasing medium is dissipated through a cooling mechanism, which varies according to the type of laser technology.
Lasers are used for material processing because they have many advantages over other conventional production methods. In many areas of industrial manufacturing, lasers already allow for significantly greater precision, flexibility, and productivity and are often the only technology that enables efficient mass production of innovative products. The principal factors that distinguish different types of lasers and determine the particular laser suitable for a specific application, besides economic reasons, are wavelength, pulse duration, output power, and spatial coherence.
The principal types of laser technologies currently used for material processing are CO2 lasers, solid-state lasers, fiber lasers, and diode lasers.
CO2 lasers, which use CO2 gas as the lasing medium, are divided into high-power (above 500 watts) and low-power (below 500 watts) applications. There are two methods for CO2 excitation, radio frequency (“RF” or “HF”) and direct current (“DC”) excitation. Most high-power CO2 lasers are based on gas flow, in which a continuous supply of fresh laser gas flows through the laser cavity to create the energy necessary for excitation. Due to their ability to generate comparatively high levels of continuous-wave (“CW”) power, CO2 lasers are a particularly attractive laser medium for material processing applications. Material processing applications for CO2 laser sources vary according to the power output and configuration of the laser system. The primary applications for high-power CO2 lasers are cutting and welding of metal as well as surface treatment. Low-power CO2 lasers are used principally for marking, cutting and engraving of organic materials. While both low- and high- power CO2 lasers are used for cutting, the materials they are used to process and their physical size can vary significantly.
Traditional solid-state lasers use flash lamps or laser diodes as source of excitation and are referred to as “flash-lamp-pumped” or “diode-pumped” lasers. The lasing medium is a solid-state crystal, generally in the form of a rod or a disc. Widely used crystal rod material is either neodymium yttrium aluminum garnet (Nd:YAG) or neodymium vanadate (Nd:YVO4). The rod is positioned in a cavity, which is either a gold or ceramic reflector, and pumped using flash lamps or laser diodes from the side, or alternatively the rod is pumped from its ends with laser diodes. Typical output powers vary from 3 to 1,000 watts from a single rod and output powers in the multiple kilowatt range can be achieved by combining several cavities within a resonator. In the “disc design” the lasing medium is a thin crystal (typically ytterbium:YAG) disc, which is excited by laser diodes in an optical multi-pass configuration. By using multiple thin disc laser heads within one resonator, several kilowatts of power can be generated.
Fiber lasers are solid-state lasers that have their origin in low-power information and communication applications, and since 2003 have undergone a rapid development towards higher output powers, which has also made this technology very attractive for higher-power material processing applications. The lasing medium, typically ytterbium, is contained in a waveguide (the active fiber itself) and surrounded by a cladding, which guides the pump light to the lasing medium. With in-fiber components like fiber bragg gratings, tapered fiber bundles (pump light couplers), power combiners, and delivery fibers, from the generation of the light to the delivery of the light to the work piece, can be realized in an “all-in-fiber” technology. Today multi kW output power can be generated from a single fiber, no bigger in diameter than a human hair. Higher power can be generated by bundling multiple fibers. Typical industrial applications for solid-state and fiber lasers
7
vary according to the different output powers from marking and engraving, to micro processing such as fine cutting, fine welding or micro-structuring right up to macro processing (cutting, welding and surface treatment).
Solid-state and fiber lasers can be operated in cw, pulsed, q-switched or modelocked mode, covering the pulse width range from cw down to femtoseconds; lasers with pulse widths shorter than 10-8s are often referred to as ultrashort pulse lasers. Over the recent years ultrashort pulse laser technology has matured and today these lasers provide sufficient output power for industrial applications with typical pulse lengths in the range from some ten picoseconds to some 100 femtoseconds. These lasers provide pulses with high peak powers that are shorter than the time needed for most energy diffusion processes within the atomic lattice. Therefore heat transfer to surrounding material is dramatically reduced which eliminates almost all unwanted material change or thermal damage. This is the reason why this method is also referred to as “cold” or “a-thermal” material processing which is suitable for processing extremely sensitive materials. Ultrashort pulse lasers cut, drill and structure virtually any material with micron-scale precision and are perfect tools for applications in the electronics, semiconductor, micro technology, and medical device manufacturing industries.
Diode lasers are based on special semiconductor structures on a gallium arsenide (GaAs) die to generate laser light. A typical 10 mm long laser diode bar contains approximately 25 single laser emitters. When mounted on a specially designed, highly- efficient heat sink, a laser diode bar is able to produce up to 100 watts of laser output power. A single high-power laser diode module consists of: (1) a semiconductor laser diode bar; (2) a high-efficient heat sink, on which the laser bar is mounted; and optional (3) a micro-lens system, which is mounted in front of the laser bar to collimate or focus the light. Optical output power can be increased by combining the beamlets of several laser diode modules on top of each other. Through optical combination of such modules, output powers in the kilowatt range can be achieved. Diode lasers typically have larger spot diameters when focused, and are typically used for surface treatment such as cladding or hardening, for additive manufacturing as well as for soldering and plastic welding.
THE COMPANY’S LASER PRODUCTS
The Company distinguishes itself from the majority of its competitors who specialize in only one or two of the three principal laser technologies for material processing by offering its customers CO2, solid-state, fiber, ultrashort pulse and diode laser sources, and solutions in a variety of configurations and options. As a technological leader in CO2, solid-state, fiber, ultrashort pulse and diode lasers, the Company is able to meet a broad range of its customers' cutting, welding and marking requirements. The Company's lasers all deliver a high-quality beam at guaranteed power outputs and feature compact design, high processing speed, flexibility, low operating and maintenance costs, and easy integration into the customer's production process. The Company's engineers and other technical experts work directly with the customer in the Company's applications centers to develop and customize the optimal solution for the customer's manufacturing requirements.
The Company currently offers a comprehensive range of laser products and related services for three principal material processing applications:
• | cutting, welding and surface treatment (macro applications); |
• | marking and engraving; and |
• | fine cutting, spot and seam welding, micro drilling, scribing, perforating and fine structuring/ablation (micro applications). |
Besides offering standard solutions and laser systems for some specialized niche applications, the Company works directly with its customers to develop and customize optimal solutions for their unique manufacturing requirements. In developing its laser-based solutions, the Company offers customers its expertise in:
• | product development and manufacturing services based on 40 years of laser technology experience and applications know-how; |
• | application and process development, which means developing new laser-based applications for manufacturing customers and assisting them in integrating lasers into their production processes; |
• | system engineering, which means advising customers on machine design, including tooling, automation and controls for customers in need of “turn-key” solutions; and |
8
• | extensive after-sales support of its laser products, including technical support, field service, maintenance and training programs as well as rapid spare parts delivery. |
The following table sets forth the Company’s net sales of laser products used for macro applications, laser products used for marking and micro applications, and components in fiscal 2015, 2014 and 2013:
September 30, | ||||||||||||
Product Category* | 2015 | 2014 | 2013 | |||||||||
(in thousands) | ||||||||||||
Laser macro products | $ | 200,358 | $ | 209,632 | $ | 214,623 | ||||||
Laser marking and micro products | 243,096 | 250,228 | 272,632 | |||||||||
Components | 76,189 | 70,257 | 72,813 | |||||||||
$ | 519,643 | $ | 530,117 | $ | 560,068 | |||||||
_____________ | ||||||||||||
* For each laser product category, net sales include sales of service (including training, maintenance and repair) and spare parts.
The laser sources sold by the Company consist of a laser head (containing the lasing medium, resonator, source of excitation, resonator optics and cooling mechanism), power supply and microcontroller (for control and monitoring). The Company's products are offered in different configurations and utilize different design principles according to the desired application. A large variety of laser systems provided by the Company are equipped with the uniform operating concept “ROFIN Control Unit” (RCU). The RCU is a real-time laser and handling control device, which allows control of any laser mode. The user interface allows full access from a terminal (for instance a touch screen) that is located directly on the machines, or via a preceding PC with an Ethernet connection. The standardized ROFIN Control Network allows the extended diagnosis of all laser components via the Intranet, the Internet or WLAN. With the open PLC programming system customers can individually adapt the process sequence.
For a more detailed discussion of the components of a laser source, see “Laser Technology”.
The following table sets forth the Company’s product categories by principal markets and principal applications:
PRODUCT CATEGORY | PRINCIPAL MARKETS | PRINCIPAL APPLICATIONS | ||
Laser macro products | Machine tool | Cutting and welding of metals | ||
Automotive | Cutting and welding of metals | |||
Laser marking products | Semiconductor and electronics | Marking of integrated circuits, wafers, solar cells, electronic components and smart cards | ||
Automotive | Marking of labels and car components | |||
Medical device | Marking of medical devices | |||
Laser micro products | Medical devices, semiconductor and electronics, photovoltaics, dental and jewelry | Fine welding, fine cutting, micro structuring/ablation, scribing and drilling | ||
Automotive, consumer electronics, consumer goods | Fine cutting, scribing and plastic welding | |||
Packaging and paper industry | Perforating and scribing of paper and foils | |||
Components | Laser industry, printing, defense industry, medical | |||
9
LASER MACRO PRODUCTS
The Company's business strategy for revenue growth in its macro laser business focuses on:
• | further broadening and optimizing its high-power fiber laser portfolio by offering more efficient laser sources and additional features for improved performance and lower cost of ownership; |
• | further reduction of manufacturing costs of high-power fiber lasers; |
• | targeting the surface treatment market with its new DF060 HP fiber coupled 6 kW diode laser system; |
• | further developing the Tube Welding, Profile Welding and Scanner Welding System concepts; |
• | capitalizing on its strong CO2 laser portfolio, in the low-power as well as in the high-power range; and |
• | continuing research and product engineering for its solid-state, fiber, diode and CO2 laser series to further penetrate the market and to further increase the output power or vary the wavelengths for specific applications. |
The Company's high-power laser macro product offering consists of laser products which are produced and marketed under the following brand names: ROFIN, PRC, NELC, Nufern and DILAS.
The Company's family of CO2 laser products for macro applications and their principal markets and applications, are discussed below.
LASER SERIES | POWER RANGE | MODE OF EXCITATION | PRINCIPAL MARKETS | PRINCIPAL APPLICATIONS | ||||
DC Slab Series | 1.0 kW - 8.0 kW | Radio frequency | Machine tool Automotive | Cutting and welding | ||||
SR / OEM Series | 125 W - 650 W | Radio frequency | Machine tool Electronics Packaging Textile industry | Cutting and structuring of textile, paper and plastics Glass marking and cutting Scribing | ||||
GL Series | 1.0 kW - 2.0 kW | Direct current | Machine tool | Cutting and welding | ||||
STS Series | 2.5 kW - 5.0 kW | Direct current | Machine tool | Cutting and welding | ||||
CH Series | 5.0 kW - 6.0 kW | Direct current | Machine tool | Cutting and welding | ||||
FH Series | 6.0 kW - 8.0 kW | Direct current | Machine tool | Cutting and welding | ||||
SM Series | 1.0 kW - 3.0 kW | Direct current | Machine tool Packaging | Cutting and welding | ||||
FA Series | 4.0 kW - 5.0 kW | Direct current | Machine tool | Cutting and welding | ||||
PLS Series | 2.5 kW - 6.0 kW | Direct current | Machine tool | Cutting and welding | ||||
The Company believes that it is the only laser manufacturer of diffusion cooled, Slab-based lasers in the high-power range. In the DC Slab Series laser design, a radio-frequency excited gas discharge occurs between two water-cooled electrodes that have a large surface area that permits maximum heat dissipation. Principal market for the Slab Series lasers is the machine tool industry.
The Company's SR and OEM Series diffusion cooled, wave-guide CO2 lasers are developed and produced by ROFIN-SINAR UK Ltd. Both Series are sealed-off lasers, which are also based on the Slab laser principle used for the DC Slab Series. These lasers are used mainly for cutting, marking and structuring applications. Principal markets are the machine tool, textile, electronics and packaging industries.
The Company's GL, CH, STS, FH, SM, FA and PLS Series fast-axial flow CO2 lasers are used for both cutting and welding applications and are marketed under the PRC and NELC brands. In the fast-axial flow principle, the gas discharge occurs in a tube in the same direction as the resonator, through which the laser gas mixture flows at a high speed. GL, CH, STS, FH, SM,
10
FA and PLS Series products are used primarily by the machine tool industry. The SM Series are also frequently used in the packaging industry, for example for dieboard cutting.
The Company's family of solid-state and fiber laser products for macro applications and their principal markets and applications, are discussed below.
LASER SERIES | POWER RANGE | MODE OF EXCITATION | PRINCIPAL MARKETS | PRINCIPAL APPLICATIONS | ||||
DQ Series | 500 W - 1.0 kW | Laser diodes | Automotive, Photovoltaics, Steel industry | Surface treatment | ||||
FL Series | 500 W - 8.0 kW | Laser diodes | Automotive, Machine tool | Cutting and welding | ||||
NukW Series | > 1.0 kW | Laser diodes | Defense industry | Advanced applications | ||||
The Company's DQ Series of Q switched, solid-state lasers are designed for applications such as removal, cleaning, and insulation of various materials in the automotive, steel and photovoltaic markets. To meet the different demands of these target markets, DQ Series lasers offer alternative set-up options which differ in power, pulse energy and number of laser sources per unit.
The Company's FL Series of high-brightness single or multi-mode fiber lasers use special fiber optics as the active medium. These fiber lasers are suitable for classic cutting and welding applications as well as for new applications such as remote cutting and scanner welding. In contrast to common laser concepts in which the created laser beam switches repeatedly between air and the active medium, this laser beam does not leave the fiber optic before entering the working process optic or the beam switch with subsequent launching into the working process. Due to this “all-in-fiber” technology, the risk of contamination can be avoided. Beam switches and energy splitters are available options allowing up to four work cells to be operated with only one laser.
The Company's NukW Series products are stand-alone fiber laser amplifiers that are produced and marketed under the Nufern brand. Their principal market is the defense industry, where they are used for advanced applications.
The Company's family of high-power diode laser products for welding and surface treatment applications, and their principal market, are discussed below.
LASER SERIES | POWER RANGE | MODE OF EXCITATION | PRINCIPAL MARKETS | PRINCIPAL APPLICATIONS | ||||
DF Series | 1.0 kW - 6.0 kW | Direct current | Machine tool | Cladding, hardening, additive manufacturing and welding | ||||
The Company's high-power diode lasers are designed to meet the requirements of a wide range of welding and surface treatment applications like cladding, hardening and additive manufacturing. The Company's high-power diode lasers are produced by Dilas and marketed under the ROFIN brand.
LASER MARKING PRODUCTS
The Company entered the laser marking business in 1989 when it acquired Laser Optronic GmbH from Coherent General, Inc. and designed and introduced the “PowerLine” laser marker. Since then the Company has developed a broad line of market leading laser markers that deliver optimal results in terms of quality and speed on a wide range of materials. Based on its vast experience, ROFIN offers standardized and customized laser marking systems in different power ranges and wavelengths for use in various industrial segments. Strength and experience in research and development, application and software ensure innovative, standardized and tailored solutions which meet most exigent customer demands. The Company's laser marking products incorporate high value-added software - VisualLaserMarker - that provide the customer with full control of the laser marking process.
11
The Company believes that the following factors have contributed to the growth that it has experienced in the laser marking business:
• | the Company's ability to tailor its laser marking solutions to the customer's requirements; |
• | the Company's expertise in solid-state laser beam power in different wavelengths, mode structure and high-frequency switching capability, which provides optimal quality in terms of marking contrast and speed on a wide variety of materials; |
• | the Company's proprietary software - VisualLaserMarker - which provides an interface between the laser marking products and the customer's computers and supports a broad range of network communication software; and |
• | the Company's focus on innovation, which is reflected in cutting-edge products that satisfy standard as well as complex market requirements. |
The Company's business strategy for revenue growth in its laser marking business focuses on:
• | to expand its position in worldwide laser marking markets with a particular focus on the semiconductor, electronics, automotive, smart card and medical device industries; |
• | to offer a balanced product portfolio covering different technologies (such as CO2, solid-state, short pulse and fiber lasers) in different wavelengths (i.e. infrared, green and UV) and different pulsing capabilities (i.e. ns or ps lasers); |
• | to pursue application development for existing and new products; and |
• | to capitalize on its installed base of lasers by cross-selling the Company's products to its existing customers. |
The Company's laser marking product offering consists of laser products, which are produced and marketed under the following brand names: ROFIN and Nufern.
The Company's family of laser products for marking applications and their principal markets, are discussed below.
LASER SERIES | POWER RANGE | MODE OF EXCITATION | PRINCIPAL MARKETS | PRINCIPAL APPLICATIONS | ||||
PowerLine | 2 W - 100 W | Laser diodes | Semiconductor, Electronics, Automotive, Medical device, General marking applications | Integrated circuit marking, marking of metals, plastics and organic materials, day and night design, smart card, annealing | ||||
PowerLine Pico | 2 W - 10 W | Laser diode | Electronics | Marking of plastics and metals | ||||
MultiScan VS / HE | 100 W - 120 W | Radio frequency | Packaging, Consumer products, Pharmaceutical | Consumer goods marking | ||||
LabelMarker Series | Stand-alone laser based system | Automotive | Label marking | |||||
EasyMark | Laser workstation | General marking applications, Medical components, Tool industry | Metal and plastics marking | |||||
EasyJewel | Laser workstation | Jewelry marking | Metal marking | |||||
CombiLine Series | Laser workstation for integration of a wide range of ROFIN laser markers | General marking applications | Metal and plastics marking | |||||
NuQ Fiber Series | 10 W - 50 W | Laser diodes | OEM/Integrators | Marking, engraving | ||||
12
PowerLine - The Company's latest generation of PowerLine laser marking products consist of a range of lasers with output power from 2 watts to 100 watts with a galvo-head, a state-of-the-art personal computer and ROFIN's proprietary VisualLaserMarker software. The modular design of the PowerLine markers with 19'' components enable the customers to order the most suitable configuration for their production processes or systems (e.g. OEM customers may order the laser head and 19'' modules for easy integration into the system specified by the end user). The PowerLine solid-state lasers incorporate diode modules which result in higher output power (and therefore higher marking speeds), high beam quality (and therefore constant and reliable marking quality), and longer service intervals. New-generation, completely air-cooled solutions provide further increases in efficiency in a compact size. PowerLine marking products are also available with fiber lasers with output powers of up to 100 watts (i.e. with PowerLine F 100), ensuring higher energy efficiency and therefore reduced operating costs. The availability of different wavelengths and pulse widths in the product portfolio enables the Company to provide solutions for a wide range of applications. This is especially true for the frequency multiplied lasers (green, UV) as well as shortpulse lasers that open new areas for the industrial utilization. The Company's proprietary VisualLaserMarker software provides customers with a user-friendly software environment that allows them to select fonts, import graphics, preview marking and control all laser parameters and job programs. Special options and accessories include a double marking head allowing speeds of up to 1,600 characters per second in certain applications (most notably marking of integrated circuits), as well as beam-switching and -splitting options for marking of products in multiple production lines using a single laser. Their main application - among a wide variety of possible applications - is marking in the semiconductor and electronics industries.
PowerLine Pico - The Company’s PowerLine Pico laser marker is an efficient tool for marking and engraving but is also suitable for thin film ablation and structuring. The exceptionally high pulse frequency of 200 to 800 KHz offers high throughput and allows for maximum pulse overlapping. The PowerLine Pico features a linear polarized and collimated output beam with 1064 nm and 532 nm wavelengths. Compared to nanosecond laser sources, the picosecond pulse length significantly reduces thermal damage in adjacent material. This results in better ablation quality, less surface roughness and enhanced precision of selective layer ablation. Furthermore, the shorter pulses significantly help reducing thermal penetration depth during delicate ablation processes, like marking of silicon. The Company believes that the PowerLine Pico perfectly meets the requirements of various applications in wafer production, medical device manufacturing and other industries.
MultiScan VS - This vector scanning marker utilizes a 100 watts sealed-off CO2 laser and features the ability to mark components that are moving at high speeds. The main application is the marking of consumer goods in the packaging industry (i.e. date coding). MultiScan HE - This vector scanning marker has been designed to operate in some of the harshest manufacturing environments and it utilizes a 120 watts sealed-off CO2 laser source. The main applications are the marking of beverage labels and the application of tracking data on "hot" glass containers during the manufacturing process.
LabelMarker Advanced - This stand alone, laser-based system is ROFIN's state-of-the art solution to address the high demands concerning speed and reliability in the process of label marking. The LabelMarker Advanced system delivers high efficiency and short marking time due to an integrated, powerful laser. As a comprehensive all-in-one solution, the LabelMarker Advanced is a compact laser system with a class 1 safety rating which can be used in any production area without additional safety requirements.
EasyMark - The EasyMark is a class 1 safety rating transportable desktop device. The 110 V to 230 V connection and integrated cooling based on thermo-electrical technology guarantees quick and easy initial operation. Besides a program-controlled z-axis and a rotary axis, the EasyMark offers various modules which can optionally be integrated. An aluminum T-slot plate facilitates mounting of customer-specific work piece carriers, thereby allowing the processing of work pieces of different sizes and shapes.
EasyJewel - The EasyJewel is a transportable desktop device with a class 1 safety rating specially developed to mark jewelry. The laser system offers the benefits of non-contact, abrasion-resistant, permanent marking onto almost any type of precious material with high speed and precision. Special machine features include quick and exact loading of regular and special shapes, jogging function to reach the optimum marking position and various software capabilities.
CombiLine Basic/CombiLine Advanced - These compact laser workstations have been designed for small and medium-size batches. They integrate a wide range of ROFIN laser markers depending on the customer's specific application. Supply units are incorporated in the housing to provide efficient use of the customer's floor space. Different versions (either with rotary or work table with various axes) enable exact adaptation to the required tasks.
NuQ - These pulsed fiber laser sources are produced and marketed under the Nufern brand and are designed for OEM customers and integrators. Their compact industry standard footprint allows easy integration into marking systems in a variety of industries.
13
LASER MICRO PRODUCTS
After the acquisition of Baasel Lasertech in 2000, the Company formed a separate sales and marketing group focused on micro applications. This group markets and sells a broad range of laser products, including pulsed, fiber and other solid-state lasers for various spot and seam welding and fine cutting applications, CO2 Slab lasers for perforating applications, Q switched, solid-state and ultrashort pulse lasers for surface structuring/ablation, cutting, drilling and diode lasers for plastic welding applications. In 2011, the company acquired Lasag AG, Thun (Switzerland) with its primary markets including the medical device and aerospace industries.
The Company's business strategy for revenue growth in its micro applications business focuses on:
• | continue to develop customers in the consumer electronics industry for fine welding and cutting applications as well as for plastic welding; |
• | focus on manufacturers of medical instruments and implants within the medical device industry using mainly cutting and welding applications; |
• | increase its sales of perforating systems to the packaging industry for applications like easy-tear and special perforated foils for food packaging that allow the transfer of air and keep moisture in packaged goods; |
• | further broadening its existing portfolio through expanding the output power range and offering different wavelengths (i.e. UV, infrared, green) and different laser technologies (i.e. fiber lasers, ultrashort pulse lasers, diode lasers); |
• | increase its sales in the photovoltaic market with different applications (e.g. through special laser solutions that realize an efficiency increase of solar cells); |
• | develop/broaden new markets for short and ultrashort pulse laser applications such as brittle material cutting based on the Company's proprietary process technology; and |
• | develop/broaden applications such as turbine drilling for the aerospace or power generation industries. |
The Company's laser micro product offering consists of laser products which are produced and marketed under the ROFIN, DILAS, Corelase and Lee Laser brand names.
14
The Company's family of laser products for micro applications, and their principal markets, are discussed below.
LASER SERIES | POWER RANGE | MODE OF EXCITATION | PRINCIPAL MARKETS | PRINCIPAL APPLICATIONS | ||||
Manual Welders | 60 W - 200 W | Flash lamp | Jewelry, Mold making, Medical device | Spot and seam welding | ||||
StarPulse | 40 W - 500 W | Flash lamp | Medical device, Electronics | Spot and seam welding | ||||
StarFiber | 100 W - 600 W | Diode | Electronics, Medical device | Fine cutting, fine welding | ||||
StarFiber P | 150 W - 300 W | Diode | Medical device, Electronics, Watch industry | Precision drilling, cutting and welding | ||||
X-Lase | 1 W - 24 W | Diode | Semiconductor, Electronics, Displays | Scribing, fine cutting, fine welding | ||||
StarFemto | 1 W - 15 W | Diode | Medical device, Watch industry, Automotive | Cutting, structuring, drilling | ||||
StarPico | 15 W - 50 W | Diode | Medical device, Electronics, Displays & Glass, Photovoltaics, Tool industry | Cutting, structuring, drilling, ablation | ||||
PerfoLas Systems | 1,000 W - 2,000 W | Radio frequency | Paper | Perforating | ||||
StarShape Systems | 100 W - 600 W | Radio frequency | Packaging | Cutting, drilling, structuring | ||||
UW and MPS Laser Systems | n.a. | n.a. | Electronics, Energy, Medical device, Glass, Automotive, Semiconductor, Job shops | Cutting, welding structuring, brittle materials (e.g. sapphire) | ||||
Series LDP | 10 W - 800 W | Diode | OEM | Micro/Marking | ||||
Series LEP | 2 W - 20 W | Diode | OEM | Micro/Marking | ||||
Series LDPP | 8 W - 200 W | Diode | OEM | Fine cutting | ||||
Series LFP | 7 W - 50 W | Diode | OEM | Micro | ||||
COMPACT, MINI and EVOLUTION Diode Laser System Series | 10 W - 1,200 W | Direct current | Automotive, Electronics, Medical device, Consumer goods | Plastic welding, soldering, brazing, micro hardening | ||||
KLS Series | 15 W - 250 W | Flash lamp | Automotive, Medical device, Consumer goods | Fine cutting, precision drilling, scribing | ||||
FLS Series | 150 W - 800 W | Flash lamp | Aerospace, Power generation, Tooling | Drilling, cutting, welding | ||||
SLS Series | 5 W - 220 W | Flash lamp | Medical device, Electronics, Automotive | Spot and seam welding | ||||
QFS Series | 50 W | Diode | Automotive | Scribing | ||||
Manual Welders - The Company's manual welders for micro applications, which are sold under the names Performance, Tool Open, and Integral, consist of pulsed, solid-state lasers in the range of 60 to 200 watts, which are primarily used for fine welding applications in the medical device, jewelry and mold making industries.
15
StarPulse Series - The StarPulse Series consists of pulsed Nd:YAG rod lasers with power ratings from 40 to 500 watts. StarPulse lasers provide high peak powers and high pulse-to-pulse stability and are designed for use in fine welding applications such as laser welding of highly reflective materials in the medical device and electronics industries.
StarFiber Series - The robust and compact fiber laser systems of the StarFiber Series achieve nominal powers of 100 to 600 watts. The lasers can be operated in either pulse-modulated or continuous-wave mode. The StarFiber Series is designed for a broad range of applications including fine welding, such as welding of electro-mechanic components, and fine cutting, such as in the production of medical devices.
StarFiber P Series - The pulsed fiber lasers of the StarFiber P Series provide high pulse peak power and high beam quality and are ideally suited for processing a wide range of materials in the medical device, electronics and watch industries.
X-Lase - The X-Lase Series consists of picosecond pulse mode-locked fiber laser systems with a maximal output power of up to 24 watts. Main markets are in the semiconductor, electronics, and display industries. In these industries the X-Lase products can be used for thin film patterning, ablation and scribing applications. Additionally, specific versions of the X-Lase Series have been developed for fine cutting and fine welding of transparent and brittle materials like sapphire, glass or silicon carbide. The X-Lase Series are manufactured and marketed under the Corelase brand.
StarFemto - The StarFemto Series is comprised of femtosecond pulse mode-locked laser systems with a maximal output power of 15 watts. The main markets are medical implants, automotive and watch manufacturing, where they are mainly used for fine cutting, drilling, or structuring applications.
StarPico - The StarPico Series consists of picosecond pulse mode-locked laser systems with a maximal output power of 50 watts. The main markets are the medical device, electronics, tool, glass and solar industries, in which they are mainly used for fine cutting, drilling structuring and ablation.
PerfoLas Systems - The PerfoLas systems consist of a high-power CO2 laser and a specially designed beam delivery and paper handling system that includes a laser beam splitter (PerfoLas Multiplexer) which allows customers to drill more than 500,000 holes per second into paper or foils. The primary application for these lasers is perforation of paper and foils.
StarShape Systems - Each StarShape system consists of a CO2 laser in combination with a galvo scanning head and is used for precise cutting, drilling and surface structuring. The main market is the packaging industry.
The Universal Workstation (“UW”) and Modular Processing System (“MPS”) Series are modular, standard laser-based systems that have been designed to meet a variety of applications including welding, cutting, surface modification and ablation. Depending on the application, the UW and MPS Systems can be equipped with different laser sources (CO2, femtosecond, fiber, diode or solid-state laser) and modified for specific handling requirements. Our latest generation MPS systems are designed to accommodate the Ultrashort Pulse (USP) series products and address the market needs for applications such as cutting brittle materials (e.g. glass). Our next generation UW systems are designed to accommodate our high-power fiber lasers and address the needs for competitive 5 axis motion, high accuracy and high volume manufacturing.
The Series LDP and LEP are diode pumped, solid-state lasers that are produced and marketed under the Lee Laser brand and sold to OEM customers and system integrators for various micro and marking applications.
The Series LDPP are diode pulse-pumped Nd:YAG lasers that are produced and marketed under the Lee Laser brand and are designed specifically to precision cut thin metals. The main market is the medical device industry.
The Series LFP are hybrid diode pumped, solid state, picosecond lasers that are produced and marketed under the Lee Laser brand and are sold to OEM customers and system integrators for various micro applications.
The COMPACT, MINI and EVOLUTION Diode Laser System Series are laser systems that are manufactured and marketed under the DILAS brand. These systems are available in a wide range of output powers and wavelengths, including fiber-coupled direct beam or homogenized line source solutions, and are engineered for utilization in industrial laser materials processing, mainly for plastic welding, soldering and brazing applications in the automotive, medical device and electronic industries.
KLS Series - The KLS Series lasers are pulsed solid-state lasers that provide excellent beam quality and high peak power, which are ideal for fine cutting, drilling and scribing applications.
16
The FLS Series are lamp pumped, pulsed, solid-state lasers with high peak power for deep penetration cutting, welding and drilling for high throughput. Targeted industries are mainly the aerospace, power generation, and tooling industries.
SLS Series - The lasers of this series are pulsed Nd:YAG solid-state lasers with output powers in the range of 5 to 250 watts and pulse durations of up to 200 ms with outstanding process features for welding challenging metals and dissimilar materials. The SLS Series lasers are state-of-the-art production tools in the medical device industry, but are also used in many other applications in the aerospace, power generation, electronics and automotive industries.
QFS Series - The QFS fiber laser system, consisting of a q-switch laser and a motorized processing head, offers a complete solution for scribing connection rods and other car engine parts in the automotive industry.
The KLS, FLS, SLS and QFS Series are all manufactured by the Company's Switzerland-based subsidiary ROFIN-LASAG. A broad variety of accessories such as specific beam delivery components, scanners, as well as different processing heads for cutting, welding or drilling applications are offered in combination with these micro products.
COMPONENTS
Power Supplies - The Company offers power supplies for pulsed and continuous wave, solid-state lasers, CO2 lasers, diode lasers as well as RF generators for acousto-optic Q-switches through its wholly-owned subsidiary PMB Elektronik GmbH.
Fiber and Optics Technology and Wafer Processing - Fiber coupling products and optical engines for primary use in fiber lasers are manufactured and marketed by the Company's Finland-based subsidiary Corelase Oy. In addition, the Company's wafer processing takes place in the Finland-based facility.
Laser Diodes and Modules - High-power semiconductor components such as high power, high-brightness laser diodes and modules are manufactured and marketed by the Company's subsidiaries DILAS and m2k-laser GmbH.
Fibers and Fiber Optic Beam Deliveries - Fibers, fiber components, beam splitters or switches, and beam combiners designed for use in industrial lasers or as beam delivery systems are manufactured and marketed by Optoskand AB.
Laser Processing heads specially optimized for fiber lasers and applications such as micro cutting, drilling and welding are manufactured and marketed by ROFIN-LASAG.
Active and Passive Fibers and Amplifiers - Fibers and fiber laser technology components are developed, manufactured and marketed by Nufern.
The Company's high-technology components are either integrated by other laser manufacturers into their products or are used for the Company's own product portfolio.
APPLICATIONS DEVELOPMENT
In addition to manufacturing and selling laser sources for macro applications and marking and micro applications, ROFIN operates sixteen application centers in ten countries, where it develops laser-based solutions for customers seeking alternatives to conventional manufacturing techniques. Revenues derived from application development are not a significant component of total revenues. Applications development is generally a support service to the sales and marketing function and is performed to customize the laser to the particular needs of the customer. The Company currently has approximately 50 employees in applications development.
MARKETS AND CUSTOMERS
ROFIN sells its laser products and laser-based system solutions to a wide range of industries. Our principal markets are the machine tool, semiconductor, electronics, photovoltaic and automotive industries.
17
The following table sets forth the allocation of the Company’s total laser-related sales (excluding service, spare parts and components) among our principal markets:
Fiscal Years | ||||||||
Principal Market | 2015 | 2014 | 2013 | Primary Applications | ||||
Machine Tool | 36% | 40% | 37% | Cutting and welding | ||||
Semiconductor, Electronics, and Photovoltaic | 22% | 19% | 27% | Marking, cutting and welding of integrated circuits, electronic components, smart cards, and structuring of solar cells | ||||
Automotive & Sub-Supplier | 12% | 10% | 8% | Cutting, welding, and component marking | ||||
70% | 69% | 72% | ||||||
The remaining 30%, 31% and 28%, of total laser sales in fiscal 2015, 2014 and 2013, respectively, were attributable to customers in a wide variety of other industries including aerospace, consumer goods, medical device manufacturing, flexible packaging, job shops, jewelry, universities and institutes. No one customer accounted for over 10% of total sales in any of these periods.
SALES, MARKETING AND DISTRIBUTION
ROFIN sells its products in approximately 70 countries to OEMs, systems integrators and industrial end users who have in-house engineering resources capable of integrating ROFIN’s products into their own production systems. Lasers for cutting applications are marketed and sold principally to OEMs in the machine tool industry, which sell laser cutting machines incorporating ROFIN’s products without any substantial involvement by ROFIN. Lasers for welding applications are marketed and sold both to systems integrators and to end users. Laser marking products are marketed and sold directly to end users and to OEMs for integration into their handling systems (mainly for integrated circuit, solar cell and smart card marking applications). Laser micro products are marketed and sold directly to end users and to OEM customers (mainly for solar cell, medical devices and jewelry applications). In the case of both welding lasers and laser marking products, the end user is significantly involved in the selection of the laser component. In these cases, ROFIN’s application engineers work directly with the end user to optimize the application’s performance and demonstrate the advantages of the Company’s products.
ROFIN has approximately 135 direct sales engineers operating in 24 countries, approximately 45 of whom are dedicated to marketing lasers for macro applications and approximately 90 of whom are dedicated to marketing lasers for marking and micro applications. ROFIN sales engineers work either in a well-defined geographic territory or are dedicated to specific industries or applications. In addition, ROFIN has 45 independent representatives marketing the Company’s laser products in Australia, Austria, Argentina, Brazil, Chile, China, Czech Republic, Denmark, Estonia, Finland, France, Germany, India, Israel, Italy, Korea, New Zealand, Northern Africa, Norway, the Middle East, the Philippines, Poland, Romania, Russia, Singapore, South Africa, Slovenia, Sweden, Switzerland, Thailand, Turkey and Ukraine. These independent representatives provide ROFIN with sales leads and opportunities, but do not distribute ROFIN’s products. All sales and delivery of products are conducted by the Company. Of the independent representative agreements, 19 are on an exclusive basis, with the other 26 on a non-exclusive basis. These agreements provide for a standard percentage of the net sales price to be paid as commissions to the representatives. The duration of the agreements is usually one year (with an automatic one-year extension) and a six-month cancellation clause.
ROFIN directs its worldwide sales and marketing of lasers for macro applications from its offices in Hamburg and Mainz (both Germany), Kingston upon Hull (UK), and East Granby, Connecticut, and of laser diode components, from Mainz and Freiburg (both Germany). Worldwide sales and marketing of laser marking products is directed from ROFIN’s offices in Gunding-Munich (Germany) and, for laser micro products and power supplies from Starnberg (Germany). Optical engines for fiber lasers for the worldwide market are sold and marketed from Tampere (Finland) and East Granby, Connecticut (USA), and fiber optics and beam delivery systems are sold and marketed from Gothenburg (Sweden). In Europe, ROFIN also maintains sales and service offices in Belgium, France, Italy, the Netherlands, Spain, Switzerland and the United Kingdom.
North American sales of ROFIN’s macro and micro laser products are managed out of the Company’s Plymouth, Michigan, facility. North American sales of its marking products are managed out of its Devens, Massachusetts, facility. The Company also maintains sales offices in Chandler, Arizona; and Santa Clara, California, to support the expansion of ROFIN’s laser
18
business in the North American market, and a sales and service office in Mississauga (Canada) to support the Canadian market. North American sales of diode laser components are directed from Tucson, Arizona.
PRC Laser directs its worldwide sales and marketing of lasers for macro applications from its office in Landing, New Jersey, Lee Laser directs its worldwide sales and marketing of lasers for micro applications from its office in Orlando, Florida, and ROFIN-LASAG directs its worldwide sales and marketing of lasers for micro applications from its office in Thun, Switzerland. NELC directs its sales and marketing of lasers for macro applications from its office in Nanjing (China). All four companies sell their products independently under their own brands.
The Company maintains sales and service offices in China, India, Japan, Singapore, South Korea and Taiwan. The Company believes that the Asian/Pacific region will have a very important business potential over the next five years. The countries with the greatest long-term business potential in the future are expected to be China and India, principally due to the expansion of domestic machine tool, automotive, semiconductor, electronics and photovoltaic production in these countries.
CUSTOMER SERVICE, REPLACEMENT PARTS AND COMPONENTS
During fiscal 2015, 2014 and 2013, approximately 42%, 42% and 39%, respectively, of the Company’s revenues were generated from sales of after-sales services, replacement parts and components for laser products. The Company believes that a high level of customer support is necessary to successfully develop and maintain long-term relationships with its OEM- and end-user customers. The Company seeks to maintain this close relationship as its customers’ needs change and evolve.
Recognizing the importance of its existing and growing installed multinational customer base, the Company has expanded its local service and support platform into new geographic regions. ROFIN has 430 customer service personnel. The Company’s field service and in-house technical support personnel receive ongoing training with respect to the Company’s laser products, maintenance procedures, laser-operating techniques and processing technology. Most of the Company’s OEM customers also provide customer service and support to end users.
Many of ROFIN’s laser products are operated 24 hours a day in high speed, quality-oriented manufacturing operations. Accordingly, the Company provides 24 hour, year-round service support to its customers in the United States, Germany and the majority of other countries in which it operates. The Company plans to continue adopting similar service support elsewhere. In addition, eight-hour response time is provided to certain key customers. This support includes field service personnel who reside in close proximity to the Company’s installed base. The Company provides customers with process diagnostic and verification techniques, as well as specialized training in the operation and maintenance of its systems. The Company also offers regularly scheduled and intensive training programs and customized maintenance contracts for its customers.
Of ROFIN’s 430 customer service personnel, approximately 276 employees operate in the field in about 50 countries. Field service personnel are also involved in the installation of the Company’s systems.
ROFIN’s approach to the sale of replacement parts is closely linked to the Company’s strategic focus on rapid customer response. The Company provides around-the-clock order entry and provides same or next day delivery of parts worldwide in order to minimize disruption to customers’ manufacturing operations. ROFIN typically provides a minimum one-year warranty for its products with warranty extensions negotiated on a case-by-case basis; and for after-sales service and parts supply for up to a period of 10 years, if requested by a customer. The Company’s growing base of installed laser sources and laser-based systems is expected to continue to generate a stable source of revenues from sales of replacement parts and after-sales service.
In addition, the Company offers components such as OEM-laser modules, optical engines, laser diodes, active and passive fibers, fiber optic delivery systems and power supplies. These high-technology components are either integrated by other laser manufacturers into their products or are used for the Company's own product portfolio.
COMPETITION
The Company believes that as manufacturing industries continue to modernize, seek to reduce production costs and require more precise and flexible production, the features of laser-based systems will become more desirable than systems incorporating conventional material processing techniques and processes. The increased acceptance of these laser applications by industrial users will be enhanced by laser product line expansion to include lower and higher power CO2 lasers, variations in wavelength,
19
advancements in fiber-optic beam delivery systems, improvements in reliability and the introduction of lower and higher power diode lasers, diode pumped, solid-state lasers, short and ultrashort pulse lasers and fiber lasers, capable of performing heavy industrial material processing and marking and micro applications.
Laser Macro Products
The market for laser macro products and systems is fragmented and addressed by a large number of competitors. Many of them are small or privately owned or compete with ROFIN on a limited geographic, industry- or application-specific basis. The Company also competes in certain target markets with competitors that are part of large industrial groups and have access to substantially greater financial and other resources than ROFIN. The overall competitive position of the Company will depend upon a number of factors, including product performance and reliability, price, customer support, manufacturing quality, the compatibility of its products with existing laser systems, and the continued development of products utilizing diode laser, diode pumped, solid-state laser and fiber laser technologies. Competition among laser manufacturers is also based on attracting and retaining qualified engineering and technical personnel.
ROFIN believes it is among the top three suppliers of laser sources in the worldwide market for macro applications. Companies such as Trumpf and Fanuc (for high-power CO2 lasers), Synrad and Coherent (for low-power CO2 lasers), Trumpf and IPG Photonics (for solid-state or fiber lasers), and Laserline and Jenoptik (for diode lasers and laser diodes) all compete in a subset of markets in which ROFIN operates. However, in the Company's opinion, none of these companies compete in all of the industries, applications and geographic markets currently served by ROFIN.
Laser Marking and Micro Products
The Company's laser marking products compete with conventional ink-based and acid-etching technologies, as well as with laser mask-marking. The Company's micro products compete with conventional welding, etching and spark erosion technologies. The Company believes that its principal competitors in the laser marking and micro markets include Trumpf, GSI Group, Unitek Miyachi, Han's Laser and IPG Photonics. ROFIN also competes with manufacturers of conventional non-laser products in applications such as welding, drilling, cutting and marking.
Significant competitive factors in the market for laser marking and micro products include system performance and flexibility, cost, the size of each manufacturer's installed base, capability for customer support and breadth of product line. Because many of the required components to develop and produce a laser product for marking applications are commercially available, barriers to entry into this market are low and the Company expects new competitive products to enter this market. The Company believes that its product range for marking and micro applications will compete favorably in this market primarily due to performance and price characteristics of such products.
MANUFACTURING AND ASSEMBLY
ROFIN manufactures and tests its high-power CO2, solid-state and fiber laser macro products at its Hamburg (Germany), Plymouth, Michigan; Landing, New Jersey; East Granby, Connecticut, and Nanjing (China) facilities. The Company’s laser marking products are manufactured and tested at its facilities in Gunding-Munich (Germany), Starnberg (Germany), Oxford (UK), Singapore and Devens, Massachusetts. ROFIN’s micro application products are manufactured and tested in Starnberg (Germany), Tampere (Finland), Thun (Switzerland) and Orlando, Florida. The Company’s diode laser products are manufactured and tested at its Mainz (Germany), Freiburg (Germany), Nanjing (China), and Tucson, Arizona, facilities. The Company’s low-power CO2 laser products are manufactured and tested in Kingston upon Hull (UK). Coating of ROFIN’s Slab laser electrodes is performed at the Overath (Germany) facility. The Company’s fiber optics and beam delivery systems are manufactured and tested in Gothenburg (Sweden), and power supplies are manufactured and tested in Starnberg (Germany). The Company’s active and passive fibers and amplifiers are manufactured and tested in East Granby, Connecticut. Optical engines for fiber lasers, fiber lasers modules and wafer material are designed and manufactured in Tampere (Finland).
Given the competitive nature of the laser business, the Company focuses substantial efforts on maintaining and enhancing the efficiency and quality of its manufacturing operations. The Company utilizes just-in-time and cell-based manufacturing techniques to reduce manufacturing cycle times and inventory levels, thus enabling it to offer on-time delivery and high-quality products to its customers.
ROFIN’s in-house manufacturing includes only those manufacturing operations that are critical to achieve quality standards or protect intellectual property. These manufacturing activities consist primarily of product development, testing of components and subassemblies (some of which are supplied from within the Company and others of which are supplied by third party
20
vendors and then integrated into the Company’s finished products), assembly and final testing of the completed product, as well as proprietary software design and hardware/software integration. Although the Company minimizes the number of suppliers and component types, wherever practicable, it has at least two sources of supply for key items. ROFIN has a qualifying program for its vendors and generally seeks to build long-term relationships with such vendors. The Company purchases certain major components from single suppliers. The Company estimates that 8% of its revenues are from the sale of products that require specialized components currently only available from single sources. ROFIN has written agreements with such suppliers and has not had material delays in supplies from these sources. The Company believes that it could, if necessary, purchase such components from alternative sources, within four to six months, following appropriate qualification of such new vendors.
ROFIN is committed to meeting internationally recognized manufacturing standards. Its Hamburg, Gunding-Munich, Starnberg, Mainz, Overath (all Germany), Thun (Switzerland), Gothenburg (Sweden), Monza (Italy), Paris (France), Daventry (UK), Kingston upon Hull (UK), Nanjing (China), Singapore, East Granby, Connecticut, and Tucson, Arizona, facilities are ISO 9001 certified.
RESEARCH AND DEVELOPMENT
During fiscal 2015, 2014 and 2013, ROFIN’s net spending on research and development was $40.0 million, $45.9 million and $43.0 million, respectively. The Company’s net spending on research and development reflects receipt of funding mainly under German and other European governments and European Union grants totaling $0.7 million, $1.6 million, and $2.4 million in fiscal 2015, 2014 and 2013, respectively. ROFIN has approximately 290 employees engaged in product research and development.
ROFIN’s research and development activities are directed at meeting customers’ manufacturing needs and application processes. Core competencies include solid-state lasers, fiber lasers, ultrashort pulse lasers, CO2 gas lasers, diode lasers, precision optics, electronic power supplies, fibers, fiber optics, beam delivery, control interfaces, software programming, and systems integration. The Company strives for customer-driven development activities and promotes the use of alliances with key customers and joint development programs in a wide range of its target markets.
The Company’s research and development activities are carried out in fifteen centers in Hamburg, Gunding-Munich, Starnberg, Freiburg and Mainz (all Germany), Kingston upon Hull (UK), Gothenburg (Sweden), Tampere (Finland), Thun (Switzerland), Plymouth, Michigan, Landing, New Jersey, Orlando, Florida, Tucson, Arizona, East Granby, Connecticut, and Nanjing (China), and are centrally coordinated and managed. ROFIN maintains close working relationships with the leading industrial, government and university research laboratories in Germany, including the Fraunhofer Institute for Laser Technology in Aachen, the Institute for “Technische Physik” of the German Space and Aerospace Research Center in Stuttgart, the Fraunhofer Institute for Applied Solid State Physics in Freiburg, the Fraunhofer Institute for Material Science in Dresden, the Laser Center in Hanover (all Germany), and elsewhere around the world, including the University of Edinburgh in the United Kingdom, Tampere University of Technology in Finland, and University of Bern in Switzerland. These relationships include funding of research, joint development programs, personnel exchange programs, and licensing of patents developed at these institutes.
INTELLECTUAL PROPERTY
ROFIN owns intellectual property, which includes patents, proprietary software, technical know-how and expertise, designs, process techniques and inventions.
While policies and procedures are in place to protect critical intellectual property rights, ROFIN believes that its success depends to a larger extent on the innovative skills, know-how, technical competence and abilities of ROFIN’s personnel.
ROFIN protects its intellectual property in a number of ways including, in certain circumstances, through patents. ROFIN has sought patent protection primarily in the United States, Europe and Asia. ROFIN currently holds 262 patents for inventions relating to lasers, processes and power supplies with expiration dates ranging from 2015 to 2034. In addition, 204 patent applications have been filed and are under review by the relevant patent authorities. The Company holds 39 exclusive and non-exclusive licenses of patents and pending patent applications with relevance to its products and laser technology. ROFIN requires its employees and certain of its customers, suppliers, representatives, agents and consultants to enter into confidentiality agreements to further safeguard ROFIN’s intellectual property.
21
ROFIN, from time to time, receives notices from third parties alleging infringement of such parties’ patent or other intellectual property rights by ROFIN’s products. While these notices are common in the laser industry and ROFIN has in the past been able to develop non-infringing technology or license necessary patents or technology on commercially reasonable terms, ROFIN cannot assure that it would in the future prevail in any litigation seeking damages or expenses from ROFIN or to enjoin ROFIN from selling its products on the basis of such alleged infringement. Nor can ROFIN assure that it would be able to develop any non-infringing technology or to license any valid and infringed patents on commercially reasonable terms. In the event any third party made a valid claim against ROFIN or its customers and a license were not made available to ROFIN on commercially reasonable terms, ROFIN would be adversely affected.
From time to time, ROFIN files notices of opposition to certain patents on laser technologies held by others, including academic institutions and competitors of ROFIN, which the Company believes could inhibit its ability to develop laser products for industrial material processing applications.
ORDER BACKLOG
The Company’s order backlog was $144.3 million, $141.3 million and $118.0 million, as of September 30, 2015, 2014 and 2013, respectively. The Company’s order backlog, which contains relatively little service, training and spare parts, represents approximately three months of laser shipments. The order backlog as of September 30, 2015, consists of a 4% higher order backlog for macro applications, a minor increase in order backlog for micro and marking applications of less than 1%, and a 4% higher order backlog for components compared to the order backlog as of September 30, 2014. The fluctuation of the U.S. dollar in fiscal year 2015 had an unfavorable effect of approximately $13.1 million on year-to-year order backlog. The increase in the Company's order backlog as of September 30, 2014 compared to September 30, 2013, was attributable to 18% higher order backlog for macro applications, 18% higher order backlog for micro and marking applications, and a 35% higher order backlog for components. The fluctuation of the U.S. dollar in fiscal year 2014 had a favorable effect of approximately $2.2 million on year-to-year order backlog.
An order is entered into backlog by ROFIN when a purchase order with an assigned delivery date has been received. Delivery schedules range from one week to six months, depending on the size, complexity and availability of the product or system ordered, although typical delivery dates for laser source products range between one to twelve weeks from the date an order is placed. Although there is a risk that customers may cancel or delay delivery of their orders, orders for standard non-customized lasers can typically be allocated to other customers without significant additional costs. The Company also manages this risk by establishing the right to charge a cancellation fee that covers any material and developmental costs incurred prior to the order being canceled. Enforcement of this right is dependent on many factors including, but not limited to, the customer’s requested length of delay, the number of other outstanding orders and the order and sales history with the same customer, and the ability to quickly convert the canceled order to another sale.
The Company anticipates shipping the present backlog during fiscal year 2016. However, the Company’s backlog at any given date is not necessarily indicative of actual sales for any future period.
EMPLOYEES
The following table sets forth the Company's employees by geographic regions as of September 30, 2015 and 2014:
September 30, | ||||||
2015 | 2014 | |||||
North America | 399 | 425 | ||||
Germany | 1,041 | 1,066 | ||||
Asia | 327 | 320 | ||||
Other | 464 | 459 | ||||
2,231 | 2,270 | |||||
The average number of employees for the fiscal year ended September 30, 2015 was 2,255.
While the Company’s employees are not covered by collective bargaining agreements and the Company has never experienced a work stoppage, slowdown or strike, the Company’s employees at its Hamburg and Starnberg (both Germany) facilities are
22
each represented by a nine-person works council and in Gunding-Munich (Germany) by a seven-person works council. Additionally, Hamburg and Gunding-Munich are represented by a four-person central works council. Matters relating to compensation, benefits and work rules are negotiated and resolved between management and the works council for the relevant location. The Company considers its relations with its employees to be good.
GOVERNMENT REGULATION
The majority of the Company’s laser products sold in the United States are classified as Class IV Laser Products under applicable rules and regulations of the Center for Devices and Radiological Health (“CDRH”) of the U.S. Food and Drug Administration. The same classification system is applied in the European markets. Safety rules are formulated with “Deutsche Industrie Norm” (i.e., German Industrial Standards) or ISO standards, which are internationally harmonized.
CDRH regulations generally require a self-certification procedure pursuant to which, for each product incorporating a laser device, a manufacturer must file periodic reporting of sales and purchases, and compliance with product labeling standards with CDRH. The Company’s laser products for macro, micro and laser marking applications can result in injury to human tissue if directed at an individual or otherwise misused.
The Company believes that its laser products for macro, micro and marking applications, and its components are in substantial compliance with all applicable laws for the manufacture of laser devices.
In August 2012, the U.S. Securities and Exchange Commission (SEC) issued a rule under Section 1502 of the Dodd-Frank Wall Street Reform and Consumer Protection Act requiring companies to publicly disclose their use of conflict minerals that originated in the Democratic Republic of the Congo (DRC) or an adjoining country. Under the rule, issuers are required to conduct a “reasonable” due diligence process to ascertain the source of conflict minerals, defined as tantalum, tin, gold or tungsten, that are necessary to the functionality or production of their manufactured or contracted to be manufactured products. Companies are required to provide this disclosure on Form SD filed with the SEC. The Company filed its Form SD on June 1, 2015 for the 2014 calendar period.
AVAILABLE INFORMATION
The Company makes available, free of charge on its internet website, its Annual Report on Form 10-K, quarterly reports on Form 10-Q, current reports on Form 8-K, and any amendments to those reports filed or furnished pursuant to Section 13(a) or 15(d) of the Exchange Act, as soon as reasonably practicable after they are electronically filed with, or furnished to, the Securities and Exchange Commission (the “SEC”). You can find these reports on the Company’s website at www.rofin.com under the heading “Investor Relations”. The information on the Company’s website is not incorporated by reference in this Annual Report on Form 10-K.
These reports may also be obtained at the SEC’s Public Reference Room at 100 F Street NE, Washington, D.C. 20549. Information on the operation of the Public Reference Room is available by calling the SEC at (202) 551-8090. You may also access this information at the SEC’s website (http://www.sec.gov). This site contains reports, proxy and information statements, and other information regarding issuers that file electronically with the SEC.
23
ITEM 1A. RISK FACTORS
THE GLOBAL ECONOMY, CAPITAL MARKETS, CREDIT DISRUPTIONS AND POLITICAL ENVIRONMENT CHANGES CAN ADVERSELY IMPACT OUR RESULTS OF OPERATIONS.
Our business, operating results, or financial condition can be impacted by a number of macroeconomic factors, which could in turn affect our stock price. These macroeconomic factors include, but are not limited to, consumer confidence and spending levels, unemployment, consumer credit availability, global factory production and credit market conditions. Additionally, changes in the political environment in the markets in which we operate can adversely impact our business, such as foreign exchange import and export controls, tariffs and other trade barriers and price or exchange controls.
DOWNTURNS IN THE INDUSTRIES WE SERVE, PARTICULARLY IN THE MACHINE TOOL, AUTOMOTIVE, SEMICONDUCTOR, ELECTRONICS AND PHOTOVOLTAIC INDUSTRIES, MAY HAVE A MATERIAL ADVERSE EFFECT ON OUR SALES AND PROFITABILITY.
Our business depends substantially upon capital expenditures particularly by manufacturers in the machine tool, automotive (and sub-suppliers), semiconductor, electronics and photovoltaic industries. Approximately 70% of our laser sales during fiscal year 2015 were to these industry markets. These industries are cyclical and have historically experienced periods of oversupply, resulting in significantly reduced demand for capital equipment, including the products manufactured and marketed by us. For the foreseeable future, our operations will continue to depend upon capital expenditures in these industries, which, in turn, depend upon the market demand for their products. Decreased demand from manufacturers in these industries, for example, during an economic downturn, may lead to decreased demand for our products. Although such decreased demand would reduce our sales, we may not be able to reduce expenses quickly, due in part to the need for continual investment in research and development and the need to maintain our extensive ongoing customer service and support capability. Although we order materials for assembly in response to firm orders, the lead time for assembly and delivery of some of our products creates a risk that we may incur expenditures or purchase inventories for products which we cannot sell.
Accordingly, any economic downturn or slowdown in the machine tool, automotive, semiconductor, electronics or photovoltaic industries could have a material adverse effect on our financial condition and results of operations.
A HIGH PERCENTAGE OF OUR SALES ARE OVERSEAS AND OUR RESULTS ARE THEREFORE SUBJECT TO THE IMPACT OF EXCHANGE RATE FLUCTUATIONS.
Although we report our results in U.S. dollars, approximately 67% of our current sales are denominated in other currencies, including the Euro, Swedish krona, Swiss francs, British pound, Singapore dollar, Japanese yen, Korean won, Taiwanese dollar, Canadian dollar, Indian rupee, and Chinese RMB. The fluctuation of the Euro, and the other functional currencies, against the U.S. dollar has had the effect of increasing and decreasing (as applicable) reported net sales as well as cost of goods sold, gross margin, and selling, general and administrative expenses denominated in such foreign currencies when translated into U.S. dollars as compared to prior periods.
We also face transaction risk from fluctuations in exchange rates between the various currencies in which we do business. We believe that a certain portion of the transaction risk of our operations in multiple currencies is mitigated by our hedging activities, utilizing forward exchange contracts and forward exchange options. We also continue to borrow in many of our operating subsidiaries' functional currencies to reduce exposure to exchange gains and losses. However, there can be no assurance that changes in currency exchange rates will not have a material adverse effect on our business, financial condition and results of operations.
24
OUR INABILITY TO MANAGE THE RISKS ASSOCIATED WITH OUR INTERNATIONAL OPERATIONS COULD ADVERSELY AFFECT OUR BUSINESS.
Our products are currently marketed in approximately 70 countries, with the United States, Germany, the rest of Europe and the Asia/Pacific region being our principal markets. Our operations and sales in our principal markets are subject to risks inherent in international business activities, including:
• | the general political and economic conditions in each such country or region; |
• | overlap of differing tax structures; |
• | climatic or other natural disasters in regions where we operate; |
• | increases in shipping costs or increases in fuel costs; |
• | longer payment cycles; |
• | acts of terrorism; |
• | increased vulnerability to the theft of, and reduced protection for intellectual property rights; |
• | management of an organization spread over various jurisdictions; and |
• | unexpected changes in regulatory requirements and compliance with a variety of foreign laws and regulations, such as import and export licensing requirements, trade restrictions, currency control and restrictions, delays, penalties or required withholdings on repatriation of earnings. |
Any failure to manage the risks associated with our international business operations could have a material adverse effect on our financial condition and results of operations.
Our profitability may be adversely affected by economic slowdowns in the United States, Europe or the Asia/Pacific region. A recession in these economies could trigger a decline in laser sales to the machine tool, automotive, semiconductor, electronics or photovoltaic industries, and any related weaknesses in their respective currencies could adversely affect customer demand for our products, the U.S. dollar value of our foreign currency denominated sales, and ultimately our consolidated results of operations.
We also are subject to risks that our operations outside the United States could be conducted by our employees, contractors, service providers, representatives or agents in ways that violate the Foreign Corrupt Practices Act or other similar anti-bribery laws. Any such violations could have a negative impact on our business and could result in government investigations and/or injunctive, monetary or other penalties. Moreover, we face additional risks that our anti-bribery policy and procedures may be violated by third-party sales representatives or other agents that help sell our products or provide other services, because such representatives or agents are not our employees and it may be more difficult to oversee their conduct.
OUR GLOBAL OPERATIONS ARE SUBJECT TO EXTENSIVE AND COMPLEX IMPORT AND EXPORT RULES THAT VARY AMONG THE LEGAL JURISDICTIONS IN WHICH WE OPERATE. FAILURE TO COMPLY WITH THESE RULES COULD RESULT IN SUBSTANTIAL PENALTIES.
Due to the international scope of our operations, we are subject to a complex system of import- and export-related laws and regulations, including U.S. export control and customs regulations and customs regulations of other countries. These regulations are complex and vary among the legal jurisdictions in which we operate. Any alleged or actual failure to comply with such regulations may subject us to government scrutiny, investigation and civil and criminal penalties, and may limit our ability to import or export our products or to provide services outside the United States. Depending on its size and scope, any of these penalties could have a material impact on our financial position, results of operations and cash flows.
25
WE DEPEND ON THE ABILITY OF OUR OEM CUSTOMERS TO INCORPORATE OUR LASER PRODUCTS INTO THEIR SYSTEMS.
Our sales depend in part upon the ability of our OEM customers to develop and sell systems that incorporate our laser products. Adverse economic conditions, inadequate liquidity, large inventory positions, limited marketing resources and other factors affecting these OEM customers could subject us to risks of business failure by such customers and potential credit and inventory risks, and thus could have a substantial impact upon our financial results. We cannot provide assurances that our OEM customers will not experience financial or other difficulties that could adversely affect their operations and, in turn, our financial condition or results of operations.
WE EXPERIENCED IN THE PAST, AND EXPECT TO EXPERIENCE IN THE FUTURE, FLUCTUATIONS IN OUR QUARTERLY RESULTS. THESE FLUCTUATIONS MAY INCREASE THE VOLATILITY OF OUR STOCK PRICE.
We have experienced and expect to continue to experience some fluctuations in our quarterly results. We believe that fluctuations in quarterly results may cause the market prices of our common stock, on the NASDAQ Global Select Market and the Frankfurt Stock Exchange, to fluctuate, perhaps substantially. Factors which may have an influence on the Company’s operating results in a particular quarter include:
• | general economic uncertainties; |
• | fluctuations in demand for, and sales of, our products or prolonged downturns in the industries that we serve; |
• | the timing of the receipt of orders from major customers; |
• | product mix; |
• | competitive pricing pressures; |
• | the relative proportions of domestic and international sales; |
• | our ability to design, manufacture and introduce new products on a cost-effective and timely basis; |
• | the delayed effect of incurrence of expenses to develop and improve marketing and service capabilities; |
• | foreign currency fluctuations; |
• | ability of our suppliers to produce and deliver components and parts, including sole or limited source components, in a timely manner, in the quantity desired and at the prices we have budgeted; |
• | our ability to control expenses; and |
• | costs related to acquisitions of businesses. |
These and other factors make it difficult for us to release precise predictions regarding the development and financial results of our business. In addition, current conditions in the domestic and global economies are uncertain, i.e. currently in Asia, especially in China. As a result, it is difficult to estimate the level of growth for the economy as a whole or of capital expenditures in the industrial markets we serve. Because all of the components of our budgeting and forecasting are dependent on estimates of spending within these markets, the prevailing economic uncertainty renders estimates of future revenue and expenses even more difficult than usual to make. In addition, our backlog at any given time is not necessarily indicative of actual sales for any succeeding period. As our delivery schedule typically ranges from one week to six months, our sales will often reflect orders shipped in the same quarter that they are received. Moreover, customers may cancel or reschedule shipments and production difficulties could delay shipments. Accordingly, the Company’s results of operations are subject to significant fluctuations from quarter to quarter. See also “Business - Order Backlog”.
Other factors that we believe may cause the market price of our common stock to fluctuate, perhaps substantially, include announcements of new products, technologies, or customers by us or our competitors, developments with respect to intellectual property, and shortfalls in our operations relative to analysts’ expectations. In addition, in recent years, the stock market in general, and the shares of technology companies in particular, have experienced wide price fluctuations. These broad market and industry fluctuations, particularly in the semiconductor, electronics, photovoltaics, machine tool and automotive industries,
26
may adversely affect the market prices of our common stock on the NASDAQ Global Select Market and the Frankfurt Stock Exchange.
THE MARKETS FOR OUR PRODUCTS ARE HIGHLY COMPETITIVE AND INCREASED COMPETITION COULD INCREASE OUR COSTS, REDUCE OUR SALES OR CAUSE US TO LOSE MARKET SHARE.
The laser industry is characterized by significant price and technical competition. Our current and proposed laser products for macro, marking and micro applications, and components, compete with those of several well-established companies, some of which are larger and have substantially greater financial, managerial and technical resources, more extensive distribution and service networks and larger installed customer bases than us.
We believe that competition will be particularly intense in the solid-state, fiber, CO2 and diode laser markets, as many companies have committed significant research and development resources to pursue opportunities in these markets. There can be no assurance that we will successfully differentiate our current and proposed products from the products of our competitors or that the marketplace will consider our products to be superior to competing products. Because many of the components required to develop and produce a laser-based marking system are commercially available, barriers to entry into this market are relatively low, and we expect new competitive product entries in this market. To maintain our competitive position in these markets, we believe that we will be required to continue a high level of investment in engineering, research and development, marketing, and customer service and support. There can be no assurance that we will have sufficient resources to continue to make these investments, that we will be able to make the technological advances necessary to maintain our competitive position, or that our products will receive market acceptance. See also “Business - Competition”.
OUR FUTURE GROWTH AND COMPETITIVENESS DEPEND UPON OUR ABILITY TO DEVELOP NEW AND ENHANCED PRODUCTS TO MEET MARKET DEMAND AND TO INCREASE OUR MARKET SHARE FOR LASER MACRO AND MARKING AND MICRO PRODUCTS.
If we are to increase our laser sales in the near term, these sales will have to come through increases in market share for our existing products, through the development of new products, or through the acquisition of competitors or their products. To date, a substantial portion of our revenues has been derived from sales of high-powered solid-state lasers, fiber lasers, CO2 laser sources and diode lasers. In order to increase market demand for these products, we will need to devote substantial resources to:
• | continuing to broaden our fiber, solid-sate, CO2 and diode laser product range; |
• | continuing to increase the output power and vary the laser wavelengths of our product portfolio; and |
• | continuing to reduce the manufacturing costs of our product range to achieve more attractive pricing. |
A large part of our growth strategy depends upon being able to increase our worldwide market share for laser macro, marking and micro products.
Our future success depends on our ability to anticipate our customers’ needs and develop products that address those needs. Our ability to control costs is limited by our need to invest in research and development. If we are unable to implement our strategy to develop new and enhanced products, our business, operating results and financial condition could be adversely affected. We cannot provide assurance that we will successfully implement our business strategy or that any of the newly developed or enhanced products will achieve market acceptance or not be rendered obsolete or uncompetitive by products of other companies. See also “Management’s Discussion and Analysis of Financial Condition and Results of Operations” and “Business - The Company’s Laser Products”.
WE DEPEND ON OUR EXECUTIVE MANAGEMENT TEAM AND SKILLED PERSONNEL TO OPERATE OUR BUSINESS EFFECTIVELY IN A RAPIDLY CHANGING MARKET, AND IF WE ARE UNABLE TO RETAIN EXISTING OR HIRE ADDITIONAL PERSONNEL WHEN NEEDED, OUR ABILITY TO DEVELOP AND SELL OUR PRODUCTS COULD BE HARMED.
Our future success depends in large part upon the leadership and performance of our executive management team and key employees at the operating level. These key employees include engineering, sales, marketing, manufacturing and support
27
personnel for our operations on a worldwide basis. Recruiting and retaining highly skilled personnel in certain functions continues to be difficult. At certain locations where we operate, the cost of living is extremely high and it may be difficult to retain key employees and management at a reasonable cost. We may not be successful in attracting, assimilating or retaining qualified personnel to fulfill our current or future needs. If we fail to attract additional employees or lose the services of one or more of our executive officers or key employees, or if one or more of them decide to join a competitor or otherwise compete directly or indirectly with us, we may not be able to successfully manage our business or achieve our business objectives. If we lose the services of any of our key employees at the operating or regional level, we may not be able to replace them with similarly qualified personnel, which could harm our business.
RECENT CHANGES IN OUR EXECUTIVE AND SENIOR MANAGEMENT TEAM MAY BE DISRUPTIVE TO, OR CAUSE UNCERTAINTY IN, OUR BUSINESS, RESULTS OF OPERATIONS, FINANCIAL CONDITION AND THE MARKET PRICE OF OUR COMMON STOCK.
Effective on July 1, 2015, Thomas Merk succeeded Günther Braun as President and Chief Executive Officer of the Company, and at the same time Mr. Merk replaced Mr. Braun as a member of the Board of Directors. In addition to these changes, we have also recently implemented a broader senior management team. These changes in our executive and senior management team may be disruptive to, or cause uncertainty in, our business. In addition, the departure of Mr. Braun, and the failure to ensure a smooth transition and effective transfer of knowledge involving senior employees, could hinder our strategic planning and execution. Any such disruption or uncertainty could have an adverse impact on our results of operations, financial condition and the market price of our common stock.
WE MAY NOT BE ABLE TO SUCCESSFULLY ACQUIRE NEW OPERATIONS OR INTEGRATE FUTURE ACQUISITIONS, WHICH COULD CAUSE OUR BUSINESS TO SUFFER.
An important part of our growth strategy is making strategic acquisitions of companies with complementary operations, technologies or products. We regularly review potential acquisitions and periodically engage in discussions regarding such possible acquisitions. We may be unable to successfully complete potential strategic acquisitions if we cannot reach agreement on acceptable terms or for other reasons. Future acquisitions may require us to obtain additional debt or equity financing, which may not be available on terms acceptable to us, if at all. In connection with future acquisitions, we may assume the liabilities of the companies we acquire. Any debt that we incur to pay for future acquisition could contain covenants that restrict the manner in which we operate our business. Any new equity securities that we issue for this purpose would be dilutive to our existing stockholders. If we buy a company or a division of a company, we may experience difficulty integrating that company or division’s personnel and operations, which could negatively affect our operating results.
In addition:
• | the key personnel of the acquired company may decide not to work for us; |
• | we may experience additional financial and accounting challenges and complexities in areas such as tax planning, treasury management and financial reporting; |
• | we may be held liable for risks and liabilities (including for environmental-related costs) as a result of our acquisitions, some of which we may not discover during our due diligence; |
• | our ongoing business may be disrupted or receive insufficient management attention; and |
• | we may not be able to realize the synergies, cost savings or other financial benefits we anticipated. |
PRODUCTION DIFFICULTIES AND PRODUCT DELIVERY DELAYS OR DISRUPTIONS COULD HAVE A MATERIAL ADVERSE EFFECT ON OUR BUSINESS.
We manufacture and test our products at our facilities in Germany, the United States, the United Kingdom, China, Finland, Sweden, Switzerland and Singapore. If use of any of our manufacturing facilities were interrupted by a natural disaster or otherwise, our operations would be negatively impacted until we could establish alternative production and service operations. Significant production difficulties could be the result of:
28
• | mistakes made while transferring manufacturing processes between locations; |
• | changing process technologies; |
• | ramping production; |
• | installing new equipment at our manufacturing facilities; and |
• | shortage of key components. |
In addition, we may experience product delivery delays in the future. A significant disruption in third-party package delivery and import/export services, or significant increases in prices for those services, could interfere with our ability to ship products, increase our costs and lower our profitability.
We ship a significant portion of our products to our customers through independent package delivery and import/export companies. We also ship our products through national trucking firms, overnight carrier services and local delivery practices. If one or more of the package delivery or import/export providers experiences a significant disruption in services or institutes a significant price increase, the delivery of our products could be prevented or delayed. Such events could cause us to incur increased shipping costs that could not be passed on to our customers, negatively impacting our profitability and our relationships with certain customers.
THE ANNOUNCEMENT OF AND ANY FAILURE TO SUCCESSFULLY IMPLEMENT PROFITABILITY ENHANCEMENT PROGRAMS AND COST REDUCTIONS COULD ADVERSELY AFFECT OUR BUSINESS.
From time to time, we have implemented various profitability enhancement and cost reduction initiatives, including the efficiency and cost reduction programs that we announced in the second quarter of fiscal year 2015. These initiatives include evaluating the manufacturing of some products in lower cost regions, the consolidation of various facilities and operations, transitioning higher-cost external supply to internal manufacturing, working with our material suppliers to further lower costs, evaluation the appropriate business staffing levels and streamlining our overhead.
We cannot be sure that our cost reduction initiatives will be successfully or timely implemented, or that they will materially and positively impact our profitability. The cost reductions could adversely impact productivity and sales to an extent we have not anticipated. Even if we fully execute and implement these activities and they generate the anticipated cost savings, there may be other unforeseeable and unintended factors or consequences that could adversely impact our profitability and business.
IF WE FAIL TO ACCURATELY FORECAST COMPONENT AND MATERIAL REQUIREMENTS FOR OUR PRODUCTS, WE COULD INCUR ADDITIONAL COSTS AND INCUR SIGNIFICANT DELAYS IN SHIPMENTS, WHICH COULD RESULT IN A LOSS OF CUSTOMERS.
We use rolling forecasts based on anticipated product orders and material requirements planning systems to determine our product requirements. It is very important that we accurately predict both the demand for our products and the lead times required to obtain the necessary components and materials. We depend on our suppliers for most of our product components and materials. Lead times for components and materials that we order vary significantly and depend on factors including the specific supplier requirements, the size of the order, contract terms, and current market demand for components. For substantial increases in our sales levels of certain products, some of our suppliers may need at least a nine-month lead time. If we
over estimate our component and material requirements, we may have excess inventory, which would increase our costs. If we underestimate our component and material requirements, we may have inadequate inventory, which could interrupt and delay delivery of our products to our customers. Any of these occurrences would negatively impact our net sales, business, or operating results.
WE DEPEND ON LIMITED SOURCE SUPPLIERS THAT COULD CAUSE SUBSTANTIAL MANUFACTURING DELAYS AND INCREASE OUR COSTS IF A DISRUPTION IN SUPPLY OCCURS.
We estimate that 8% of our revenues in fiscal 2015 were derived from sales of products that require specialized components only available from single sources. We also rely on a limited number of independent contractors to manufacture subassemblies
29
for some of our products. There can be no assurance that, in the future, our current or alternative sources will be able to meet all of our demands on a timely basis. If one or more of our suppliers or subcontractors experiences difficulties that result in a reduction or interruption in supply to us, or if they fail to meet any of our manufacturing requirements, our business could be harmed until we are able to secure alternative sources, if any. If we are unable to find necessary parts or components on commercially reasonable terms, we could be required to reengineer our products to accommodate available substitutions which could increase our costs and/or have a material adverse effect on manufacturing schedules, product performance and market acceptance.
The manufacturing of our solid-state lasers require elements of rare earth in small quantities. Shortages of these elements, delays in their delivery and resulting increases of the market price for such materials might have an adverse effect on our production costs.
IF OUR GOODWILL OR OTHER INTANGIBLE ASSETS BECOME IMPAIRED, WE MAY BE REQUIRED TO RECORD A SIGNIFICANT CHARGE TO EARNINGS.
Under accounting principles generally accepted in the United States, we review our intangible assets, subject to amortization, for impairment when events or changes in circumstances indicate the carrying value may not be recoverable. Goodwill is required to be tested for impairment at least annually. Factors that may be considered a change in circumstances indicating that the carrying value of our goodwill or other intangible assets may not be recoverable include declines in our stock price and market capitalization or future cash flow projections. A decline in our stock price, or any other adverse change in market conditions, particularly if such change has the effect of changing one of the critical assumptions or estimates we used to calculate the estimated fair value of our reporting units, could result in a change to the estimation of fair value that could result in an impairment charge. Any such material charges, whether related to goodwill or purchased intangible assets, may have a material negative impact on our financial and operating results.
WE COULD BE NEGATIVELY AFFECTED AS A RESULT OF A PROXY FIGHT.
In October 2015, we received notice from SilverArrow Capital Advisors LLP, SilverArrow Capital Holding Ltd., SAC Jupiter Holding Ltd., Pluto Fund Limited, Thomas Limberger, Robert Schimanko, Abdullah Saleh A. Kamel, Osama H. Al Sayed and Ernesto Palomba (collectively “SliverArrow”) (which reports that it owns over 9% of our common stock) declaring its intention to nominate three new independent directors at the Company’s 2016 annual meeting of stockholders. A proxy contest could negatively affect us because: responding to proxy contests, litigation and other actions by dissident shareholders can be costly and time-consuming, disrupting our operations and diverting the attention of management and our employees; perceived uncertainties as to our future direction may divert the attention of, damage morale and create instability among our business partners, management, and employees and adversely impact our existing and potential strategic and operational relationships and opportunities; we may experience difficulties in hiring, retaining and motivating personnel during the resulting uncertain and turbulent times; if individuals are elected to our Board with a specific agenda, it may adversely affect our ability to effectively and timely implement our current business plan which could have a material adverse effect on our results of operations and financial condition; increases in legal fees, administrative and associated costs incurred in connection with responding to a proxy contest and related litigation could be substantial; and a proxy contest, or the threat of one, could cause our stock price to experience periods of volatility or stagnation.
WE ARE EXPOSED TO LAWSUITS IN THE NORMAL COURSE OF BUSINESS WHICH COULD HAVE A MATERIAL ADVERSE EFFECT ON OUR BUSINESS, OPERATING RESULTS, OR FINANCIAL CONDITION.
We are exposed to lawsuits in the normal course of our business, including product liability claims, if personal injury, death or commercial losses occur from the use of our products. While we typically maintain business insurance, including directors' and officers' policies, litigation can be expensive, lengthy and disruptive to normal business operations, including the potential impact of indemnification obligations for individuals named in any such lawsuits. We may not, however, be able to secure insurance coverage on terms acceptable to us in the future. Moreover, the results of complex legal proceedings are difficult to predict. An unfavorable resolution of a particular lawsuit, including a recall or redesign of products if ultimately determined to be defective, could have a material adverse effect on our business, operating results or financial condition.
ANY DEFECTS IN OUR PRODUCTS OR CUSTOMER PROBLEMS ARISING FROM THE USE OF OUR PRODUCTS MAY SERIOUSLY HARM OUR BUSINESS AND REPUTATION.
30
Our laser products are technologically complex and may contain both known and undetected errors or performance problems. In addition, performance problems can also be caused by the improper installation or use of our products by a customer. These errors or performance problems could result in customer dissatisfaction, which could harm our sales or customer relationships. In addition, these problems may cause us to incur significant warranty and repair costs and divert the attention of our engineering personnel from our product development efforts.
THE LONG SALES CYCLES FOR OUR PRODUCTS MAY CAUSE US TO INCUR SIGNIFICANT EXPENSES WITHOUT OFFSETTING REVENUES.
Customers often view the purchase of our products as a significant and strategic decision. As a result, customers typically expend significant effort in evaluating, testing and qualifying our products before making a decision to purchase them, resulting in a lengthy initial sales cycle. While our customers are evaluating our products and before they place an order with us, we may incur substantial sales and marketing and research and development expenses to customize our products to the customer's needs. We may also expend significant management efforts, increase manufacturing capacity and order long lead-time components or materials prior to receiving an order. Even after this evaluation process, a potential customer may not purchase our products. As a result, these long sales cycles may cause us to incur significant expenses without ever receiving revenue to offset such expenses.
OUR FAILURE TO PROTECT OUR PROPRIETARY TECHNOLOGY OR TO AVOID LITIGATION FOR INFRINGEMENT OR MISAPPROPRIATION OF PROPRIETARY RIGHTS OF THIRD PARTIES COULD RESULT IN A LOSS OF REVENUES AND PROFITS.
Our future success depends in part upon our intellectual property rights, including trade secrets, know-how and continuing technological innovation. There can be no assurance that the steps taken by us to protect our intellectual property rights will be adequate to prevent misappropriation or that others will not develop competitive technologies or products.
We currently hold 262 United States and foreign patents on our laser sources and laser applications, with expiration dates ranging from 2015 to 2034. We have also obtained licenses under certain patents covering lasers and related technology incorporated into our products. In addition, 204 patent applications have been filed and are under review by the relevant patent authorities. There can be no assurance that other companies are not investigating or developing other technologies that are similar to ours, that any patents will issue from any application filed by us or that, if patents do issue, the claims allowed will be sufficiently broad to deter or prohibit others from marketing similar products. In addition, there can be no assurance that any patents issued to us will not be challenged, invalidated or circumvented, or that the rights thereunder will provide a competitive advantage to us. See also “Business - Intellectual Property”.
From time to time, we receive notices from third parties alleging infringement of such parties’ patent or other proprietary rights by our products. While these notices are common in the laser industry and we have in the past been able to develop non-infringing technology or license necessary patents or technology on commercially reasonable terms, there can be no assurance that we would in the future prevail in any litigation seeking damages or expenses from us or to enjoin us from selling products on the basis of such alleged infringement, or that we would be able to develop any non-infringing technology or license any valid and infringed patents on commercially reasonable terms. In the event any third party made a valid claim against us or our customers and a license was not made available to us on commercially reasonable terms, we would be adversely affected.
CHANGES IN GOVERNMENTAL REGULATION OF OUR BUSINESS OR OUR PRODUCTS COULD REDUCE DEMAND FOR OUR PRODUCTS OR INCREASE OUR EXPENSES.
We are subject to many governmental regulations, including but not limited to the laser radiation safety regulations of the Radiation Control for Health and Safety Act administered by the National Center for Devices and Radiological Health, a branch of the United States Food and Drug Administration. Among other things, these regulations require us to file annual reports, to maintain quality control and sales records, to perform product testing, to distribute appropriate operating manuals, to conduct safety reviews, to incorporate design and operating features in products sold to end users, and to certify and label our products. We are also subject to regulatory oversight, including comparable enforcement remedies, in the markets we serve.
On August 22, 2012, the SEC adopted a new rule requiring disclosures by public companies of specified minerals, known as conflict minerals, that are necessary to the functionality or production of products manufactured or contracted to be
31
manufactured. The new rule, which went into effect for calendar year 2013 and requires annual disclosure reports to be filed with the SEC, requires companies to perform due diligence, disclose and report whether or not such minerals originate from the Democratic Republic of Congo or an adjoining country. The new rule could affect sourcing at competitive prices and availability in sufficient quantities of certain minerals used in the manufacture of our products, including tin, tungsten, tantalum and/or gold. The number of suppliers who provide conflict-free minerals may be limited. In addition, there may be material costs associated with complying with the disclosure requirements, such as costs related to the due diligence process of determining the source of certain minerals used in our products, as well as costs of possible changes to products, processes or sources of supply as a consequence of such verification activities. As our supply chain is complex, we may not be able to sufficiently verify the origins of the relevant minerals used in our products through the due diligence procedures that we implement, which may harm our reputation. We may also encounter challenges to satisfy those customers who require that all of the components of our products be certified as conflict-free, which could place us at a competitive disadvantage if we are unable to do so.
Any significant change in the regulations described in the paragraphs above could reduce demand for our products or increase our expenses, which in turn could adversely affect our business, financial condition, results of operations and cash flows.
CHANGES IN TAX RATES, TAX LIABILITIES OR TAX ACCOUNTING RULES COULD AFFECT FUTURE RESULTS.
As a global company, we are subject to taxation in the United States and various other countries and jurisdictions in which we do business. Significant judgment is required to determine our worldwide tax liabilities. Our future tax rates could be affected by changes in the composition of earnings in countries with differing tax rates, changes in the valuation of our deferred tax assets and liabilities or changes in the tax laws in the jurisdictions in which we do business. In addition, we are subject to regular examination of the income tax returns that we and our subsidiaries file by the Internal Revenue Service and other tax authorities. We regularly assess the likelihood of favorable or unfavorable outcomes resulting from these examinations to determine the adequacy of our provision for income taxes. Although we believe our tax estimates are reasonable, there can be no assurance that any final determination will not be materially different than the treatment reflected in our historical income tax provisions and accruals, which could materially and adversely affect our operating results and financial condition.
IF WE EXPERIENCE A SIGNIFICANT DISRUPTION IN, OR BREACH IN SECURITY OF, OUR INFORMATION TECHNOLOGY SYSTEMS, OUR BUSINESS MAY BE ADVERSELY AFFECTED.
We rely on information technology systems throughout our Company to manage orders, process shipments to customers, manage inventory levels and maintain financial information. Events could result in the disruption of our systems, including power outages, computer attacks by hackers, viruses, catastrophes, hardware and software failures, and other unforeseen events. If we were to experience a significant period of system disruption in information technology systems that involve our interactions with customers or suppliers, it could result in the loss of sales and customers and significant incremental costs, which could adversely affect our business. In addition, security breaches of our information technology systems could result in the misappropriation or unauthorized disclosure of confidential information belonging to us or to our employees, partners, customers or suppliers, which could result in our suffering significant financial or reputational damage.
ITEM 1B. UNRESOLVED STAFF COMMENTS
None.
32
ITEM 2. PROPERTIES
The Company’s manufacturing facilities include the following:
Location of Facility | Owned or Leased | Size** (sq. ft.) | Lease Expiration | Primary Activity | |||||
Hamburg, Germany | Owned* | 171,975 | CO2 lasers, solid-state lasers, fiber lasers | ||||||
Starnberg, Germany | Leased*** | 131,772 | 2016 through 2017 | Laser marking and micro products, power supplies | |||||
Gilching, Germany | Owned | 89,642 | Laser marking and micro products | ||||||
Gunding-Munich, Germany | Leased | 81,192 | 2017 | Solid-state lasers, laser marking products | |||||
Plymouth, Michigan | Leased | 52,128 | 2017 | Laser systems | |||||
Kingston upon Hull, United Kingdom | Leased | 48,502 | 2016 | Low-power CO2 lasers | |||||
Kingston upon Hull, United Kingdom | Owned | 80,019 | Low-power CO2 lasers | ||||||
Orlando, Florida | Owned | 35,219 | Solid-state lasers | ||||||
Landing, New Jersey | Owned | 34,305 | CO2 lasers | ||||||
Mainz, Germany | Leased | 43,497 | 2016-2021 | Diode lasers and components | |||||
Mainz, Germany | Owned | 38,965 | Diode lasers and components | ||||||
Devens, Massachusetts | Leased | 16,955 | 2017 | Laser marking systems | |||||
Gothenburg, Sweden | Leased | 49,514 | 2020 | Fiber optic production | |||||
Overath, Germany | Owned | 22,948 | Coating of materials | ||||||
Oxford, United Kingdom | Leased | 14,919 | 2019 | Laser marking systems | |||||
Tampere, Finland | Leased | 10,064 | None | Fiber lasers, optical engines | |||||
Tampere, Finland | Owned | 44,100 | Fiber lasers, optical engines | ||||||
Pamplona, Spain | Owned | 12,658 | Laser marking systems | ||||||
Singapore | Leased | 7,815 | 2018 | Laser marking products | |||||
Freiburg, Germany | Leased | 12,686 | 2019 | Laser diodes | |||||
Tucson, Arizona | Leased | 22,310 | 2020 | Components | |||||
East Granby, Connecticut | Leased | 96,565 | 2027 | Fibers, fiber lasers | |||||
Nanjing, China | Owned | 67,834 | Laser products, diode components | ||||||
Thun, Switzerland | Leased | 25,134 | 2016 | Solid-state lasers for micro material processing, laser processing heads | |||||
* The facility is owned by ROFIN-SINAR Laser GmbH (“RSL”); the real property on which the facility is located is leased by RSL under a 99-year lease.
** Includes sales, administration and research and development facilities, where applicable.
*** An aggregate of three facilities.
One of the Starnberg main facilities is leased until 2016 from a member of the Company’s Board of Directors. The operating lease was acquired by the Company in 2000, as part of its then acquisition of ROFIN-BAASEL Lasertech GmbH & Co. KG ("RBL"), of which the Board member was a minority shareholder. That lease will terminate by end of December 2016. In January 2015, the Company acquired a new manufacturing facility in Gilching, which is currently under reconstruction and which is intended to replace all RBL leased facilities in Starnberg. During fiscal 2015, the Company also purchased a new manufacturing facility in Kingston upon Hull, which is currently under construction and will afterwards replace the existing leased facility in Kingston upon Hull, acquired one of the Mainz (Germany) main facilities which had previously been leased, and purchased the Overath facility which had previously been leased. The Freiburg facility lease has a renewal option for five
33
years. The Tampere facility lease can be terminated upon six-month notice from the landlord and the lessee. The Gothenburg facility has a renewal option for three years.
The Company maintains sales, administration, and research and development facilities at each of the Hamburg, Starnberg, Gunding-Munich, Mainz, Freiburg, Kingston upon Hull, Gothenburg, Tampere, East Granby, Plymouth, Landing, Orlando, Thun, and Nanjing locations. The Company also maintains sales and service offices worldwide, all of which are leased, with the exception of the Pamplona (Spain) and Seoul (South Korea) properties which are owned.
The Company believes that its existing facilities are adequate to meet its currently projected needs for the next 12 months and that suitable additional or alternative space would be available, if necessary, in the future on commercially reasonable terms.
ITEM 3. LEGAL PROCEEDINGS
The Company has been and is likely to be involved from time to time in litigation involving its intellectual property and ordinary routine litigation arising in the ordinary course of business.
A licensor of patents that, before their expiration in 2010, covered the technology used in certain of the Company's CO2 lasers has asserted that the Company has calculated royalties due in respect of certain sales of such CO2 lasers in a manner that is not consistent with the applicable license agreement. In addition, the licensor claims that it has not been provided with copies of invoices and other documentation relating to such sales, to which it asserts it is entitled under the license agreement. The Company disputes these and related allegations and believes that it is in compliance with all of its obligations under the license agreement. The patents, and therefore the license rights, have already expired and there are no further license fees to be calculated and paid. Accordingly, management believes that the resolution of this matter will not have a material adverse impact on the Company's financial condition, results of operations or cash flows.
ITEM 4. MINE SAFETY DISCLOSURES
Not applicable.
34
PART II
ITEM 5. | MARKET FOR REGISTRANT'S COMMON EQUITY, RELATED STOCKHOLDER MATTERS AND ISSUER PURCHASES OF EQUITY SECURITIES |
The Company’s common stock is traded on the NASDAQ Global Select Market and also on the Prime Standard Segment of the Frankfurt Stock Exchange, under the symbol RSTI and international securities identification number (ISIN) US7750431022, respectively. The table below sets forth the high and low closing sales prices of the Company’s common stock for each quarter ended during the last two fiscal years as reported by NASDAQ:
Common Stock Trade Prices | ||||||||
Quarter ended | High | Low | ||||||
December 31, 2013 | $ | 27.02 | $ | 23.05 | ||||
March 31, 2014 | $ | 26.38 | $ | 21.28 | ||||
June 30, 2014 | $ | 24.66 | $ | 21.81 | ||||
September 30, 2014 | $ | 24.42 | $ | 21.79 | ||||
December 31, 2014 | $ | 30.16 | $ | 20.78 | ||||
March 31, 2015 | $ | 28.46 | $ | 23.39 | ||||
June 30, 2015 | $ | 29.40 | $ | 23.55 | ||||
September 30, 2015 | $ | 27.44 | $ | 23.43 | ||||
At November 25, 2015, the Company had six holders of record of its common stock and 28,360,103 shares outstanding. A significantly greater number of holders of the Company’s common stock are “street name” or beneficial holders, whose shares are held of record by bankers, brokers, and other financial institutions. The Company has not paid dividends on its common stock and does not anticipate paying dividends in the foreseeable future.
During fiscal year 2015, the Company did not sell any equity securities that were not registered under the Securities Act.
There were no purchases of common stock of the Company made by the Company or any “affiliated purchaser” of the Company as defined in Rule 10b-18(a)(3) under the Exchange Act during the fourth fiscal quarter of fiscal year 2015.
On November 11, 2015, the Board of Directors authorized the Company to initiate another share buyback of up to $50 million of the Company's Common Stock over the next eighteen months. The Company expects the purchases to be made from time to time in the open market or in privately negotiated transactions at the Company’s discretion.
STOCK PRICE PERFORMANCE GRAPH
The following Stock Price Performance Graph includes comparisons required by the SEC. The Graph does not constitute soliciting material and should not be deemed filed or incorporated by reference into any other Company filings under the Securities Act of 1933, as amended, or the Securities Exchange Act of 1934, as amended, except to the extent that the Company specifically incorporates this information by reference therein.
The following graph presents the one-year total return for ROFIN-SINAR Technologies Inc. common stock compared with the NASDAQ Stock Market Index and the S&P Technology Sector Index. ROFIN-SINAR selected these comparative groups due to industry similarities and the fact that they contain several direct competitors.
The graph assumes that the value of the investment in ROFIN-SINAR Technologies Inc. common stock, the NASDAQ Stock Market Index, and the S&P Technology Sector Index each was $100 on September 30, 2010, and that all dividends were reinvested. The S&P Technology Sector Index is weighted by market capitalization.
The stock price performance shown in this graph is not necessarily indicative of, and not intended to suggest future stock price performance.
35
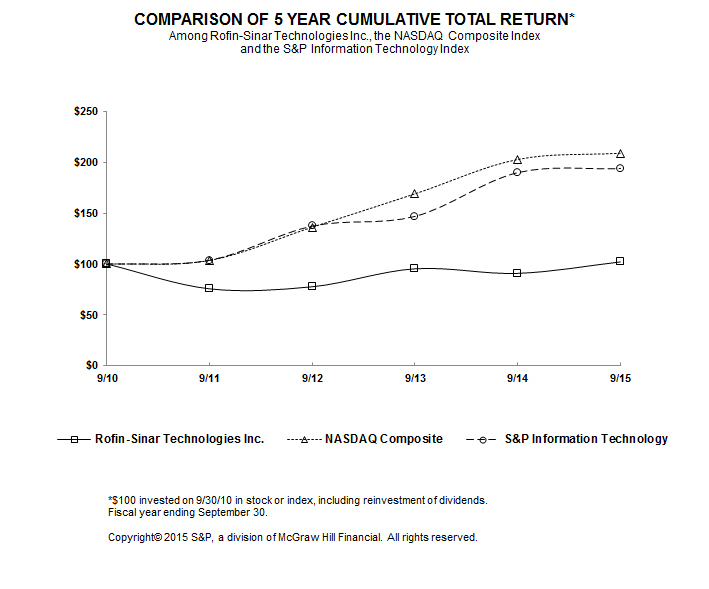
EDGAR REPRESENTATION OF DATA POINTS USED IN PRINTED GRAPHIC
ROFIN-SINAR Technologies Inc. | NASDAQ Stock Market Index | S&P Technology Sector Index | ||||
9/30/2010 | 100 | 100 | 100 | |||
9/30/2011 | 75.65 | 103.65 | 103.83 | |||
9/30/2012 | 77.74 | 136.22 | 137.49 | |||
9/30/2013 | 95.39 | 168.91 | 146.99 | |||
9/30/2014 | 90.86 | 202.57 | 190.01 | |||
9/30/2015 | 102.17 | 208.69 | 194.03 | |||
36
ITEM 6. SELECTED FINANCIAL DATA
The following table sets forth selected consolidated financial data for the past five fiscal years. The information set forth below should be read in conjunction with the consolidated financial statements and notes and “Management’s Discussion and Analysis of Financial Condition and Results of Operations” contained elsewhere in this Annual Report on Form 10-K.
Year ended September 30, | |||||||||||||||||||||
2015 | 2014 | 2013 | 2012 | 2011 | |||||||||||||||||
STATEMENT OF OPERATIONS DATA: | |||||||||||||||||||||
Net sales | $ | 519,643 | $ | 530,117 | $ | 560,068 | $ | 540,121 | $ | 597,763 | |||||||||||
Cost of goods sold | 323,165 | 341,202 | 363,559 | 343,769 | 365,684 | ||||||||||||||||
Gross profit | 196,478 | 188,915 | 196,509 | 196,352 | 232,079 | ||||||||||||||||
Selling, general & administrative expenses | 97,405 | 106,051 | 101,726 | 101,088 | 107,510 | ||||||||||||||||
Research & development expenses | 39,987 | 45,900 | 43,014 | 42,604 | 38,337 | ||||||||||||||||
Amortization expense | 3,057 | 2,906 | 2,553 | 2,279 | 2,569 | ||||||||||||||||
Income from operations | 56,029 | 34,058 | 49,216 | 50,381 | 83,663 | ||||||||||||||||
Net interest expense (income) | (9 | ) | 234 | 54 | (11 | ) | (135 | ) | |||||||||||||
Income before income taxes | 56,968 | 36,680 | 49,155 | 52,392 | 87,143 | ||||||||||||||||
Income tax expense | 15,747 | 11,528 | 14,139 | 17,180 | 26,070 | ||||||||||||||||
Net income attributable to RSTI | 41,258 | 25,168 | 34,755 | 34,530 | 60,032 | ||||||||||||||||
Earnings per common share | |||||||||||||||||||||
attributable to RSTI– Basic | $ | 1.47 | $ | 0.90 | $ | 1.23 | $ | 1.21 | $ | 2.11 | |||||||||||
Earnings per common share | |||||||||||||||||||||
attributable to RSTI– Diluted | $ | 1.46 | $ | 0.89 | $ | 1.22 | $ | 1.20 | $ | 2.06 | |||||||||||
Shares used in computing earnings | |||||||||||||||||||||
per share – Basic | 28,128 | 28,073 | 28,189 | 28,498 | 28,440 | ||||||||||||||||
Shares used in computing earnings | |||||||||||||||||||||
per share – Diluted | 28,271 | 28,222 | 28,392 | 28,744 | 29,105 | ||||||||||||||||
OPERATING DATA (as percentage of sales): | ||||||||||||||||
Gross profit | 37.8 | % | 35.6 | % | 35.1 | % | 36.4 | % | 38.8 | % | ||||||
Selling, general & administrative expenses | 18.7 | % | 20.0 | % | 18.2 | % | 18.7 | % | 18.0 | % | ||||||
Research & development expenses | 7.7 | % | 8.7 | % | 7.7 | % | 7.9 | % | 6.4 | % | ||||||
Income from operations | 10.8 | % | 6.4 | % | 8.8 | % | 9.3 | % | 14.0 | % | ||||||
Income before income taxes | 11.0 | % | 6.9 | % | 8.8 | % | 9.7 | % | 14.6 | % | ||||||
BALANCE SHEET DATA: | |||||||||||||||||||||
Working capital | $ | 378,958 | $ | 374,022 | $ | 372,778 | $ | 318,827 | $ | 333,328 | |||||||||||
Total assets | 706,491 | 688,585 | 699,910 | 652,532 | 653,946 | ||||||||||||||||
Line of credit and loans | 23,311 | 14,766 | 18,622 | 22,545 | 22,863 | ||||||||||||||||
Long-term debt | 18,085 | 11,511 | 14,913 | 5,662 | 14,742 | ||||||||||||||||
Total equity | 542,609 | 538,709 | 543,418 | 493,919 | 478,617 | ||||||||||||||||
37
ITEM 7. MANAGEMENT'S DISCUSSION AND ANALYSIS OF FINANCIAL CONDITION AND
RESULTS OF OPERATIONS
OVERVIEW
ROFIN-SINAR Technologies is a leader in the design, development, engineering, manufacturing and marketing of laser sources and laser-based system solutions for industrial material processing applications, which include primarily cutting, welding and marking a wide range of materials. The Company's product portfolio ranges from single laser-beam sources to highly complex systems, covering all of the key laser technologies such as solid-state, fiber, ultrashort pulse, diode and CO2 lasers and the entire power spectrum, from single-digit watts up to multi-kilowatts, as well as a comprehensive spectrum of wavelengths. An extensive range of laser components completes the product portfolio. Lasers are a non-contact technology for material processing, which have several advantages compared to conventional manufacturing tools that are desirable in industrial applications. The Company's lasers all deliver a high-quality beam at guaranteed power outputs and feature compact designs, high processing speeds, flexibility, low operating and maintenance costs, and easy integration into the customer's production process thus meeting a broad range of its customers' material processing requirements.
According to the Industrial Laser Solutions magazine's 2015 industry forecast published in January 2015, worldwide laser revenues for industrial material processing applications, which are ROFIN’s primary addressed markets, are expected to reach approximately $2.8 billion. The Company has sold more than 75,000 laser sources since 1975 and currently has over 4,000 active customers (including multinational companies with multiple facilities purchasing from the Company). During fiscal 2015, 2014 and 2013, approximately 38%, 40% and 38%, respectively, of the Company’s revenues related to sales of laser products for macro applications, approximately 47%, 47% and 49% respectively, related to sales of laser products for marking and micro applications, and approximately 15%, 13% and 13%, respectively, related to sales of components.
Through its global manufacturing, distribution and service network, the Company provides a comprehensive range of laser sources and laser-based system solutions to the following principal target markets: the machine tool, automotive, semiconductor, electronics, and photovoltaic industries. The Company sells directly to end users and to original equipment manufacturers (“OEMs”) that integrate ROFIN’s laser sources with other system components. Many of ROFIN’s customers are among the largest global participants in their respective industries. During fiscal 2015, 2014, and 2013, 21%, 19% and 20%, respectively, of the Company’s sales were in North America, 45%, 49% and 45%, respectively, were in Europe, and 34%, 32% and 35%, respectively, were in Asia.
The results of the fiscal year ended September 30, 2015, were characterized by traditional seasonality in the first half of the year. The second half of the fiscal year 2015 resulted in a recovery of the Asian markets, especially in China. In terms of overall business development, we had a stable business for CO2 laser technology and a far above average growing business with our high-power fiber and ultrashort pulsed laser technologies. For the latter, we experienced especially high interest for our proprietary filament cutting technology of brittle materials. During fiscal year 2015, we were able to significantly improve our profitability, mainly as a result of an optimized cost structure in the manufacture of our high-power fiber lasers, a better fixed cost absorption and positive effects of our efficiency and cost reduction programs.
Outlook
We continue to target high growth rates in our high-power fiber laser sales in fiscal year 2016. Our 3rd generation high-power fiber laser business is progressing very well as we continue our efforts to further reduce the manufacturing costs of this product. In our second growth area, the ultrashort pulse lasers, we are also gaining momentum. In this segment, we see significant future growth in the medical device, automotive, consumer electronics and photovoltaic industries. With our efficiency and cost reduction programs that we announced in the second quarter of fiscal year 2015, we continue to proactively target further cost control, while actively promoting sales and development in key areas and markets. Coupling these initiatives on the cost side with our strong product portfolio, we feel well-positioned for a successful fiscal year 2016.
Acquisitions and Formation of New Entities
Effective August 24, 2011, the Company formed ROFIN BAASEL Laser India Pvt. Ltd. in Mumbai (India) as a wholly-owned subsidiary through its wholly-owned subsidiaries ROFIN-SINAR Laser GmbH (99%) and ROFIN-BAASEL Lasertech GmbH & Co KG (1%). It started its operations in October 2011 and is responsible for sales and service of ROFIN laser products in India.
38
On each of October 26, 2011, and March 12, 2012, the Company purchased an additional 5% of the share capital, and on November 18, 2013, the Company purchased the remaining 10% of the share capital of m2k-laser GmbH through ROFIN-SINAR Laser GmbH under an option agreement between the Company and the minority shareholders of m2k-laser GmbH. As a result of those share purchases, the Company currently holds 100% of the share capital of m2k-laser GmbH.
Effective March 28, 2007, the Company acquired 100% of the common stock of Corelase Oy, Tampere (Finland). Corelase Oy has considerable experience in semiconductors, optics, and fiber technology. Its product lines include ultrashort pulse, mode-locked fiber laser systems, fiber laser modules, and other components. The terms of the purchase included payment of a deferred purchase price based on Corelase Oy achieving certain financial targets. On December 14, 2011, the Company finalized and paid the deferred purchase price. This payment resulted in additional goodwill of $13.4 million.
Effective September 29, 2011, the Company received the remaining 15% of the share capital of H2B Photonics GmbH (“H2B“) through a transfer of shares and now holds 100% of the share capital. In May 2012, the Company merged its wholly-owned subsidiary PMB Elektronik GmbH with H2B and named the newly formed subsidiary PMB Elektronik GmbH.
Effective December 20, 2012, the Company acquired the remaining 20% of the common stock of ROFIN-BAASEL China Co., Ltd. through its wholly-owned subsidiary RSL. The Company currently holds 100% of the share capital of ROFIN-BAASEL China Co., Ltd.
Effective January 8, 2013, the Company acquired the remaining 20% of the common stock of Nanjing Eastern Technologies Company, Ltd. The Company currently holds 100% of the share capital of Nanjing Eastern Technologies Company, Ltd.
Effective December 20, 2013, the Company acquired the remaining 12% of the common stock of ROFIN-BAASEL Japan Corp. through its wholly-owned subsidiary ROFIN-SINAR Laser GmbH. The Company currently holds 100% of the share capital of ROFIN-BAASEL Japan Corp.
On April 10, 2014, the Company completed the acquisition of certain assets of FiLaser USA LLC. ("FiLaser") and subsidiaries. The transaction contained all intellectual property including trademarks, know-how, patents and patent applications of FiLaser. FiLaser has developed advanced laser process technology used for precision cutting and drilling of brittle material including glass, sapphire and semiconductor substrates.
Effective June 12, 2014, the Company acquired the remaining 5% of the common stock of DILAS Diodenlaser GmbH through its wholly-owned subsidiary ROFIN-SINAR Technologies Europe S.L.U. The Company currently holds 100% of the share capital of DILAS Diodenlaser GmbH.
Effective December 23, 2014, the Company acquired an additional 8.8% of the common stock of Nanjing Eastern Laser Co., Ltd. The Company currently holds 88.8% of the share capital of Nanjing Eastern Laser Co., Ltd.
39
RESULTS OF OPERATIONS
For the periods indicated, the following table sets forth the percentage of net sales represented by the respective line items in the Company’s consolidated statements of operations:
Years ended September 30, | |||||||||
2015 | 2014 | 2013 | |||||||
Net sales | 100.0 | % | 100.0 | % | 100.0 | % | |||
Cost of goods sold | 62.2 | % | 64.4 | % | 64.9 | % | |||
Gross profit | 37.8 | % | 35.6 | % | 35.1 | % | |||
Selling, general and administrative expenses | 18.7 | % | 20.0 | % | 18.2 | % | |||
Research & development expenses | 7.7 | % | 8.7 | % | 7.7 | % | |||
Intangibles amortization | 0.6 | % | 0.5 | % | 0.5 | % | |||
Income from operations | 10.8 | % | 6.4 | % | 8.8 | % | |||
Income before income taxes | 11.0 | % | 6.9 | % | 8.8 | % | |||
Net income attributable to RSTI | 7.9 | % | 4.7 | % | 6.2 | % | |||
Fiscal Year 2015 Compared to Fiscal Year 2014
Net Sales – Net sales of $519.6 million represents a decrease of $10.5 million, or 2%, over the prior year. Net sales decreased $20.7 million, or 5%, in Europe/Asia and increased $10.2 million, or 10%, in North America, each as compared to the prior year. The U.S. dollar fluctuated against foreign currencies, which had an unfavorable effect on net sales of $49.3 million. Net sales of laser products for macro applications decreased by 4% to $200.4 million, primarily due to lower business with the machine tool industries which was partially offset by improved business from the automotive industry and advanced applications. Net sales of lasers for marking and micro applications decreased by 3% to $243.1 million compared to fiscal year 2014, mainly due to lower demand for our lasers for micro and marking applications, principally from the electronics, semiconductor and jewelry industries, partially offset by higher demand from the photovoltaic industry. Revenues for the component business increased by 8% to $76.2 million, primarily due to higher sales related to laser diode products and fiber-related components.
Gross Profit – The Company’s gross profit of $196.5 million represents an increase of $7.6 million, or 4%, from the prior year. As a percentage of sales, gross profit increased to 38% from 36% in fiscal year 2014. A favorable product and sales mix, the manufacturing cost reduction of our high-power fiber lasers and a better absorption of fixed costs contributed to the improvement in gross margin. Gross profit was unfavorably affected by $9.3 million in fiscal year 2015 due to the fluctuation of the U.S. dollar against foreign currencies.
Selling, General and Administrative Expenses – Selling, general and administrative expenses decreased by $8.6 million, or 8%, to $97.4 million, compared to fiscal year 2014. As a percentage of net sales, selling, general and administrative expenses decreased to 19% from 20% in the prior year. Selling, general and administrative expenses were favorably affected by $10.0 million due to the fluctuation of the U.S. dollar against foreign currencies in fiscal year 2015. During fiscal year 2015, SG&A expenses increased due to higher legal and consulting fees as well as expenses related to a change in the Company's senior management. This increase was partially offset by lower marketing, exhibition and other labor costs.
Research and Development – The Company’s net expenses for research and development amounted to $40.0 million, which represents a decrease of $5.9 million, or 13%, as compared to the prior fiscal year. Gross research and development expenses for fiscal year 2015 and 2014, were $40.7 million and $47.5 million, respectively, and were reduced by $0.7 million and $1.6 million of government grants during the respective periods. The Company will continue to apply for, and expects to continue receiving, government grants towards research and development, principally in Europe. Research and development expenses were favorably affected by $5.1 million due to the fluctuation of the U.S. dollar against foreign currencies in fiscal year 2015. R&D expenses decreased primarily due to lower material and labor costs, partially offset by lower R&D grants.
Other Income/Expenses – Net other income of $0.9 million in fiscal year 2015 represents a decrease of $1.7 million compared with net other income of $2.6 million in the prior year. This decrease is mainly a result of higher losses related to disposals of fixed assets as well as lower miscellaneous income partially offset by higher net exchange gains and lower net interest expenses.
40
Income Tax Expense – Income tax expense of $15.7 million in fiscal year 2015 and $11.5 million in fiscal year 2014, represents effective tax rates of 27.6% and 31.4% for the respective periods. The lower effective income tax rate in fiscal year 2015 is primarily a result of the generation of taxable income in countries with lower tax rates and to a $1.9 million favorable effect of the fluctuation of the U.S. dollar against foreign currencies.
Net Income Attributable to RSTI – As a result of the foregoing factors, net income attributable to RSTI of $41.3 million ($1.46 per diluted share, based on 28.3 million weighted average common shares outstanding) in fiscal year 2015 increased by $16.1 million over the prior year’s net income attributable to RSTI of $25.2 million ($0.89 per diluted share, based on 28.2 million weighted average common shares outstanding). Net income attributable to RSTI was favorably affected by $7.7 million in fiscal year 2015 due to the fluctuation of the U.S. dollar against foreign currencies.
Fiscal Year 2014 Compared to Fiscal Year 2013
Net Sales – Net sales of $530.1 million represents a decrease of $30.0 million, or 5%, over the prior year. Net sales decreased $17.0 million, or 4%, in Europe/Asia and decreased $12.9 million, or 11%, in North America, each as compared to the prior year. The U.S. dollar fluctuated against foreign currencies, which had a favorable effect on net sales of $8.6 million. Net sales of laser products for macro applications decreased by 2% to $209.6 million, primarily due to lower business with the machine tool industries and advanced application which was partially offset by improved business from the automotive industry. Net sales of lasers for marking and micro applications decreased by 8% to $250.2 million compared to fiscal year 2013. This was mainly due to lower demand for our lasers for micro and marking applications, principally from the electronics and photovoltaic industries, though this was partially offset by higher demand from the semiconductor and jewelry industries. Revenues for the component business decreased by 4% to $70.3 million, primarily due to lower sales related to laser diode products and fiber-related components.
Gross Profit – The Company’s gross profit of $188.9 million represents a decrease of $7.6 million, or 4%, from the prior year. As a percentage of sales, gross profit increased to 36% from 35% in the prior year. The increased percentage margin in fiscal year 2014 was primarily a result of a favorable product mix and the continuing efforts of our manufacturing cost reduction program for high-power fiber lasers. Gross profit was favorably affected by $1.2 million in fiscal year 2014 due to the fluctuation of the U.S. dollar against foreign currencies.
Selling, General and Administrative Expenses – Selling, general and administrative expenses increased by $4.3 million, or 4%, to $106.1 million, compared to fiscal year 2013, primarily as a result of one-time expenses associated with the expansion and modernization of production facilities as well as higher consulting fees and an increase in the allowance for bad debts. As a percentage of net sales, selling, general and administrative expenses increased to 20% from 18% in prior year. Selling, general and administrative expenses were unfavorably affected by $1.7 million due to the fluctuation of the U.S. dollar against foreign currencies in fiscal year 2014.
Research and Development – The Company’s net expenses for research and development amounted to $45.9 million, which represents an increase of $2.9 million, or 7%, primarily due to a reduction of $0.9 million in R&D grants and higher expenses related to the intellectual property associated with the newly acquired FiLaser technology. Gross research and development expenses for fiscal year 2014 and 2013 were $47.5 million and $45.4 million, respectively, and were reduced by $1.6 million and $2.4 million of government grants during the respective periods. The Company will continue to apply for, and expects to continue receiving, government grants towards research and development, principally in Europe. Research and development expenses were unfavorably affected by $1.1 million due to the fluctuation of the U.S. dollar against foreign currencies in fiscal year 2014.
Other Income/Expense – Net other income of $2.6 million in fiscal year 2014 represents an increase of $2.7 million compared with net other expenses of $0.1 million in the prior year. This increase is a result of $1.0 million due to the partial forgiveness of a loan with the State of Connecticut related to investments and creation of new jobs and net exchange gains of $1.4 million in fiscal year 2014, compared to net exchange losses of $0.5 million in fiscal year 2013, offset by $0.2 million lower net interest income.
Income Tax Expense – Income tax expense of $11.5 million in fiscal year 2014 and $14.1 million in fiscal year 2013, represents effective tax rates of 31.4% and 28.8% for the respective periods. The higher effective income tax rate in fiscal year 2014 is mainly a result of the generation of taxable income in countries with lower tax rates and because the research and development credit legislation has not been re-enacted in the U.S. Income tax expense, a significant portion of which is incurred in foreign currencies, was unfavorably affected by $0.2 million due to the fluctuation of the U.S. dollar against foreign currencies.
41
Net Income Attributable to RSTI – As a result of the foregoing factors, net income attributable to RSTI of $25.2 million ($0.89 per diluted share, based on 28.2 million weighted average common shares outstanding) in fiscal year 2014 decreased by $9.6 million over the prior year’s net income attributable to RSTI of $34.8 million ($1.22 per diluted share, based on $28.4 million weighted average common shares outstanding). Net income attributable to RSTI was unfavorably affected by $1.8 million in fiscal year 2014 due to the fluctuation of the U.S. dollar against foreign currencies.
LIQUIDITY AND CAPITAL RESOURCES
Fiscal Year 2015
The Company’s primary sources of liquidity at September 30, 2015, were cash and cash equivalents of $169.7 million, short-term investments of $5.8 million and short-term credit lines of $63.7 million. As of September 30, 2015, $3.9 million was outstanding under the short-term lines of credit and $2.3 million was used for bank guarantees under these lines of credit, leaving $57.5 million available for borrowing under short-term lines of credit. In addition, the Company maintained credit lines specific to bank guarantees for $12.2 million, of which $4.7 million was used. Therefore, $65.0 million was unused and available under our short-term and bank guarantee lines of credit, in aggregate, at September 30, 2015. At September 30, 2015, the entire amount of our long-term lines of credit was fully drawn. The Company is subject to financial covenants under some of these facilities and lines of credit, which could restrict the Company from drawing money under them. At September 30, 2015, the Company was in compliance with these covenants.
Cash and cash equivalents increased by $41.2 million during fiscal year 2015. Approximately $68.6 million in cash and cash equivalents were provided by operating activities, primarily as the result of the net income ($41.2 million), plus other non-cash items, principally depreciation and amortization ($16.2 million) and stock-based compensation expense ($4.2 million), as well as an increase in accrued liabilities and pension obligations ($13.0 million). Operating cash flow was negatively affected mainly by the increase in inventories ($7.4 million).
Net cash used in investing activities totaled $26.9 million for the year ended September 30, 2015, and was primarily related to various additions to property and equipment ($34.0 million) and the purchase of short-term investments ($9.3 million), partly offset by the sale of short-term investments ($15.9 million).
Net cash provided by financing activities totaled $11.7 million for the year ended September 30, 2015, and was primarily related to proceeds from the borrowings of debt ($34.3 million) and $2.1 million generated through issuance of new shares from the exercise of stock options, partly offset by repayments of loans ($23.4 million), payments of contingent acquisition-related obligations ($0.8 million) and payments to minority shareholders ($0.4 million).
The Company expects that its capital expenditures will be approximately $23 million in fiscal year 2016.
Management believes that cash flows from operations, along with existing cash and cash equivalents and availability under the credit facilities and lines of credit, will provide adequate resources to meet the Company’s capital requirements and operational needs on both a current and a long-term basis.
As of September 30, 2015, $133.9 million of the total $175.6 million of cash, cash equivalents and short-term investments, was held by our non-US subsidiaries, with the balance of $41.7 million held by our US subsidiaries. As of that date, of the $23.3 million of the Company's indebtedness to banks, $2.8 million was owed by our US subsidiaries, and $20.5 million was owed by our non-US subsidiaries. We expect our existing domestic cash, cash equivalents and short-term investments, together with cash flows from operations to be sufficient to fund our domestic operating activities. In addition, the US Company has $20.0 million in available and unused lines of credit at September 30, 2015. Therefore, we do not intend, nor do we foresee a need, to repatriate foreign earnings that are considered to be indefinitely reinvested, and we do not believe there are any material implications for or restrictions on the liquidity of our domestic subsidiaries as a result of having a majority of our cash, cash equivalents, and short-term investments held by our foreign subsidiaries.
On November 11, 2015, the Board of Directors authorized the Company to initiate a share buyback program of up to $50 million of the Company's Common Stock over the next eighteen months. The Company expects the purchases to be made from time to time in the open market or in privately negotiated transactions at the Company’s discretion. The Company will utilize existing cash and existing available lines of credit to finance this program.
42
Fiscal Year 2014
The Company’s primary sources of liquidity at September 30, 2014, were cash and cash equivalents of $128.5 million, short-term investments of $13.1 million, and short-term credit lines of $65.0 million. As of September 30, 2014, $1.6 million was outstanding under the short-term lines of credit and $2.0 million was used for bank guarantees under these lines of credit, leaving $61.4 million available for borrowing under short-term lines of credit. In addition, the Company maintained credit lines specific to bank guarantees for $13.8 million, of which $2.7 million was used. Therefore, $72.5 million was unused and available under our short-term and bank guarantee lines of credit, in aggregate, at September 30, 2014. At September 30, 2014, the entire amount of our long-term lines of credit was fully drawn. The Company is subject to financial covenants under some of these facilities and lines of credit, which could restrict the Company from drawing money under them. At September 30, 2014, the Company was in compliance with these covenants.
Cash and cash equivalents increased by $5.2 million during fiscal year 2014. Approximately $35.5 million in cash and cash equivalents were provided by operating activities, primarily as the result of the net income ($25.2 million) plus other non-cash items, principally depreciation and amortization ($17.3 million) and stock-based compensation expense ($4.3 million) and a decrease in other accounts receivable ($2.9 million). Operating cash flow was negatively affected by a decrease in accrued liabilities and pension obligations ($3.9 million) and an increase in trade accounts receivable ($3.6 million).
Net cash used in investing activities totaled $24.2 million for the year ended September 30, 2014, and was primarily related to various additions to property and equipment ($10.4 million), the purchase of short-term investments ($38.7 million) and acquisitions ($5.9 million), partially offset by the sale of short-term investments ($30.5 million).
Net cash used in financing activities totaled $10.7 million for the year ended September 30, 2014, and was primarily related to payments to minority shareholders ($4.9 million), the stock buyback program ($6.2 million) and repayments of loans ($41.7 million), partly offset by borrowings from banks ($39.7 million) and $2.4 million generated through issuance of new shares from the exercise of stock options.
The Company expects that its capital expenditures will be approximately $44 million in fiscal year 2015.
Management believes that cash flows from operations, along with existing cash and cash equivalents and availability under the credit facilities and lines of credit, will provide adequate resources to meet the Company’s capital requirements and operational needs on both a current and a long-term basis.
As of September 30, 2014, $118.9 million of the total $142 million of cash, cash equivalents, and short-term investments, was held by our non-US subsidiaries, with the balance ($22.8 million) held by our US subsidiaries. As of that date, of the $14.8 million of the Group's indebtedness to banks, $3.0 million was owed by our US subsidiaries, and $11.8 million was owed by our non-US subsidiaries. We expect our existing domestic cash, cash equivalents, and short-term investments, together with cash flows from operations to be sufficient to fund our domestic operating activities. In addition, the US Company has $20.0 million in available and unused lines of credit at September 30, 2014. Therefore, we do not intend, nor do we foresee a need, to repatriate foreign earnings that are considered to be indefinitely reinvested, and we do not believe there are any material implications for or restrictions on the liquidity of our domestic subsidiaries as a result of having a majority of our cash, cash equivalents, and short-term investments held by our foreign subsidiaries.
Fiscal Year 2013
The Company’s primary sources of liquidity at September 30, 2013, were cash and cash equivalents of $133.7 million, short-term investments of $3.2 million, short-term credit lines of $67.0 million. As of September 30, 2013, $2.1 million was outstanding under the short-term lines of credit and $1.5 million was used for bank guarantees under these lines of credit, leaving $63.4 million available for borrowing under short-term lines of credit. In addition, the Company maintained credit lines specific to bank guarantees for $21.2 million, of which $7.7 million was used. Therefore, $76.9 million was unused and available under our short-term and bank guarantee lines of credit, in aggregate, at September 30, 2013. At September 30, 2013, the entire amount of our long-term lines of credit was fully drawn. The Company is subject to financial covenants under some of these facilities and lines of credit, which could restrict the Company from drawing money under them. At September 30, 2013, the Company was in compliance with these covenants.
Cash and cash equivalents decreased by $35.0 million during fiscal year 2013. Approximately $57.0 million in cash and cash equivalents were provided by operating activities, primarily as the result of the net income ($35.0 million) plus other non-cash
43
items, principally depreciation and amortization ($15.3 million) and a decrease in inventories ($10.1 million). Operating cash flow was negatively affected by the increase in other accounts receivable ($2.7 million) and by a decrease in accounts payable ($2.2 million) and income tax payable ($1.3 million).
Net cash used in investing activities totaled $15.5 million for the year ended September 30, 2013, and was primarily related to various additions to property and equipment ($16.2 million), and purchase of short-term investments ($6.3 million), partially offset by proceeds from the sale of short-term investments ($6.8 million).
Net cash used in financing activities totaled $9.4 million for the year ended September 30, 2013, and was primarily related to payments to minority shareholders ($4.3 million), the stock buyback program ($4.1 million) and repayments on loans ($24.9 million), partly offset by borrowings from banks ($20.9 million) and $2.9 million generated through issuance of new shares from the exercise of stock options.
The following table illustrates the Company’s contractual obligations as of September 30, 2015:
Payments due by period (in thousands) | ||||||||||||||||||||
Less than | 1-3 | 3-5 | More than | |||||||||||||||||
Contractual Obligations | Total | 1 Year | Years | Years | 5 Years | |||||||||||||||
Long and short-term debt | $ | 23,311 | $ | 5,226 | $ | 7,955 | $ | 3,547 | $ | 6,583 | ||||||||||
Pension obligations | 25,893 | 874 | 2,257 | 2,247 | 20,515 | |||||||||||||||
Operating lease obligations | 21,941 | 8,675 | 7,617 | 2,928 | 2,721 | |||||||||||||||
Purchase obligations * | 87,626 | 76,548 | 10,930 | 148 | — | |||||||||||||||
Interest obligation | 1,029 | 284 | 367 | 214 | 164 | |||||||||||||||
Other short- and long-term obligations reflected on the registrant's Balance Sheet | 6,207 | 2,159 | 1,547 | 142 | 2,359 | |||||||||||||||
Total | $ | 166,007 | $ | 93,766 | $ | 30,673 | $ | 9,226 | $ | 32,342 | ||||||||||
* | Purchase obligations include payments due under various types of agreements to purchase raw materials, services or other goods. |
Note – Uncertain tax benefit liabilities of $0.2 million are not included in the Company’s contractual obligation table, as the Company cannot make reasonable estimates about the timing of any required payments related to these liabilities.
Off-Balance Sheet Arrangements
The Company has no off-balance sheet arrangements or financing arrangements involving variable interest entities.
CURRENCY EXCHANGE RATE FLUCTUATIONS
Although the Company prepares its consolidated financial statements in U.S. dollars, approximately 67% of its net sales are denominated in other currencies, primarily the Euro, Swedish krona, Swiss francs, British pound, Singapore dollar, Taiwanese dollar, Korean won, Japanese yen, Canadian dollar, Indian rupee and Chinese RMB. Net sales and costs and related assets and liabilities are generally denominated in the functional currencies of the operations, thereby serving to reduce the Company’s exposure to exchange gains and losses.
Exchange differences upon translation from each operation’s functional currency to U.S. dollars are accumulated as a separate component of equity. The currency translation adjustment component of shareholders’ equity had the effect of decreasing total equity by $50.9 million at September 30, 2015, and by $7.8 million at September 30, 2014.
The fluctuation of the Euro and the other relevant functional currencies against the U.S. dollar has had the effect of increasing or decreasing (as applicable), among other things, the Company's reported net sales, as well as its cost of goods sold, gross profit, selling, general and administrative expenses, research and development expenses and income tax expenses denominated in such foreign currencies when translated into U.S. dollars as compared to prior periods.
44
The Company defines the term “constant currency” to mean that financial data for a period are translated into U.S. dollars using the same foreign currency exchange rates that were used to translate financial data for the previously reported period. Changes in sales, gross profit and income from operations include the effect of fluctuations in foreign currency exchange rates. The Company's management reviews and analyzes business results on a constant currency basis and believes these results represent the Company's underlying business trends without distortion due to currency fluctuations. The Company believes that this “constant currency” financial information is a useful measure for investors because it reflects actual changes in operations.
The following chart compares our net sales, gross profit and income from operations for each of fiscal years 2015, 2014 and 2013, to the equivalent financial results calculated on a “constant currency” basis. Because this “constant currency” financial information does not conform to Generally Accepted Accounting Principles, it is presented under the caption “Non-GAAP Constant Currency”:
Fiscal Year 2015 | Fiscal Year 2014 | Fiscal Year 2013 | ||||||||||||||||||||||
GAAP Actual | Non- GAAP Constant Currency | GAAP Actual | Non- GAAP Constant Currency | GAAP Actual | Non- GAAP Constant Currency | |||||||||||||||||||
(in millions) | ||||||||||||||||||||||||
Net sales | $ | 519.6 | $ | 568.9 | $ | 530.1 | $ | 521.5 | $ | 560.1 | $ | 559.5 | ||||||||||||
Gross profit | 196.5 | 205.8 | 188.9 | 187.7 | 196.5 | 197.0 | ||||||||||||||||||
Income from operations | 56.0 | 50.1 | 34.1 | 35.7 | 49.2 | 50.0 | ||||||||||||||||||
Between fiscal year 2014 and 2015, the average exchange rate for the Euro weakened against the U.S. dollar by approximately 17.8%. The impact of this weakening was to decrease net sales and gross profit by $49.3 million and $9.3 million, respectively, because approximately 67% of fiscal year 2015 sales were denominated in other currencies, primarily the Euro. These exchange rate fluctuations had the effect of decreasing operating expenses by $15.3 million, thereby increasing income from operations by $5.9 million.
Between fiscal year 2013 and 2014, the average exchange rate for the Euro strengthened against the U.S. dollar by approximately 2.9%. The impact of this strengthening was to increase net sales and gross profit by $8.6 million and $1.2 million, respectively, because approximately 69% of fiscal year 2014 sales were denominated in other currencies, primarily the Euro. These exchange rate fluctuations had the effect of increasing operating expenses by $2.9 million, thereby decreasing income from operations by $1.6 million.
Between fiscal year 2012 and 2013, the average exchange rate for the Euro strengthened against the U.S. dollar by approximately 0.6%. The impact of fluctuations in exchanges rates of foreign currencies against the U.S. dollar was to increase net sales by $0.6 million and to decrease gross profit by $0.5 million, because approximately 67% of fiscal year 2013 sales were denominated in other currencies, primarily the Euro. These exchange rate fluctuations had the effect of increasing operating expenses by $0.3 million, thereby decreasing income from operations by $0.8 million.
CRITICAL ACCOUNTING POLICIES
The Company’s significant accounting policies are also described in Note 1 of the consolidated financial statements. Certain of the accounting policies require the application of significant judgment by management in selecting appropriate assumptions for calculating financial estimates. By their nature, these judgments are subject to an inherent degree of uncertainty.
Allowance for Doubtful Accounts
The Company records allowances for uncollectible customer accounts receivable based on historical experience. Additionally, an allowance is made based on an assessment of specific customers’ financial condition and liquidity. If the financial condition of the Company’s customers were to deteriorate, additional allowances may be required. No individual customer represents more than 10% of total accounts receivable. Any increase in allowance will impact operating income during a given period.
45
Inventory Valuation
Inventories are stated at the lower of cost or market, after provisions for excess and obsolete inventory salable at prices below cost. Provisions for slow moving and obsolete inventories are provided based on current assessments about historical experience and future product demand and production requirements for the next twelve months. We also write-down up to ninety percent of our total demo inventory costs over thirty six months. These factors are impacted by market conditions, technology changes and changes in strategic direction, and require estimates and management judgment that may include elements that are uncertain. The Company evaluates the adequacy of these provisions quarterly. Although the Company strives to achieve a balance between market demands and risk of inventory excess or obsolescence, it is possible that, should conditions change, additional provisions may be needed. Any changes in provisions will impact operating income during a given period.
Warranty Reserves
The Company provides reserves for the estimated costs of product warranties when revenue is recognized. The Company relies upon historical experience, expectations of future conditions, and its service data to estimate its warranty reserve. The Company continuously monitors these data to ensure that the reserve is sufficient. Warranty costs have historically been within our expectations. To the extent we experience increased warranty claim activity or increased costs associated with servicing those claims (such costs may include material, labor and travel costs), revisions to the estimated warranty liability would be required. Increases in reserves will impact operating income during the period.
Pension Obligations
The determination of the Company’s obligation and expense for pension is dependent on the selection of certain actuarial assumptions in calculating those amounts. Assumptions are made about interest rates, expected investment return on plan assets, total turnover rates and rates of future compensation increases. In addition, the Company provides the actuarial consultants with subjective factors such as withdrawal rates and mortality rates to develop their calculations of these amounts. The Company generally reviews these assumptions at the beginning of each fiscal year. The Company is required to consider current market conditions, including changes in interest rates, in making these assumptions. The actuarial assumptions that the Company uses may differ materially from actual results due to changing market and economic conditions, higher or lower withdrawal rates, or longer or shorter life spans of participants. These differences may result in a significant impact on the amount of pension benefits expense the Company has recorded or may record.
Another key assumption in determining the net pension expense is the assumed discount rate to be used to discount plan obligations. The Company's U.S. plan uses a cash flow matching approach, which uses projected cash flows matched to spot rates along a high-quality corporate yield curve to determine the present value of cash flows to calculate a single equivalent discount rate. A lower discount rate increases the present value of benefit obligations and increases pension expense.
To determine the expected long-term rate of return on plan assets, the Company considers the current and expected asset allocations, as well as historical and expected returns on various categories of plan assets.
Income Taxes
We estimate our income tax provision in each of the jurisdictions in which we operate, a process that includes estimating exposures related to examinations by taxing authorities. We must also make judgments regarding the ability to realize the deferred tax assets. The carrying value of our net deferred tax assets is based on our belief that it is more likely than not that we will generate sufficient future taxable income in certain jurisdictions to realize these deferred tax assets. A valuation allowance has been established for deferred tax assets that we do not believe meet the “more likely than not” criteria. We assess whether an uncertain tax position taken or expected to be taken in a tax return meets the threshold for recognition and measurement in the consolidated financial statements. Our judgments regarding future taxable income as well as tax positions taken or expected to be taken in a tax return may change due to changes in market conditions, changes in tax laws, or other factors. If our assumptions and consequently our estimates change in the future, the valuation allowances and/or tax reserves established may be increased or decreased, resulting in a respective increase or decrease in income tax expense.
Share-Based Payment
Stock-based compensation cost is measured at grant date, based on the fair value of the award, and is recognized as expense over the employee requisite vesting period. We make judgments about the fair value of the awards, including the expected term of the award, volatility of the underlying stock and estimated forfeitures, which impact the amount of compensation expense
46
recognized in the financial statements. Such amounts may change as a result of additional grants, forfeitures, modifications in assumptions and other factors. The income tax effects of share-based payments are recognized in the financial statements for those awards which will normally result in tax deductions under existing tax law. Under current U.S. federal tax laws, we receive a compensation expense deduction related to stock options only when those options are exercised and vested shares are received. Accordingly, the financial statement recognition of compensation cost for stock options creates a deductible temporary difference which results in a deferred tax asset and a corresponding deferred tax benefit in the statement of operations for all U.S.-based employees. Stock compensation expense related to non-U.S. employees is treated as a permanent difference for income tax purposes.
Recent Accounting Pronouncements Adopted
In June 2011, the Financial Accounting Standards Board ("FASB") issued guidance requiring changes to the presentation of comprehensive income which requires entities to present the total of comprehensive income, the components of net income, and the components of other comprehensive income either in a single continuous statement of comprehensive income or in two separate but consecutive statements. These changes, with retrospective application, became effective for the Company in fiscal year 2013. Other than the change in presentation to report comprehensive income as a separate but consecutive statement, these changes did not have an impact on the consolidated financial statements.
In September 2011, the FASB issued Accounting Standards Update ("ASU") 2011-08, “Testing Goodwill for Impairment”. The amendments under ASU 2011-08 allow entities to first assess qualitative factors to determine whether it is necessary to perform the two-step quantitative goodwill impairment test. Under these amendments, an entity is not required to calculate the fair value of a reporting unit unless the entity determines, based on a qualitative assessment, that it is more likely than not that the reporting unit’s fair value is less than its carrying amount. The amendments included a number of events and circumstances for entities to consider in conducting the qualitative assessment. Entities now have the option to bypass the qualitative assessment for any reporting unit in any period and proceed directly to performing the first step of the two-step quantitative goodwill impairment test. ASU 2011-08 was effective for annual and interim goodwill impairment tests performed for fiscal years beginning after December 15, 2011 (fiscal year 2013 for the Company). Adoption of ASU 2011-08 did not have a material impact on the Company’s financial statements.
In December 2011, the FASB issued ASU 2011-11, “Disclosures about Offsetting Assets and Liabilities”. ASU 2011-11 amended guidance on balance sheet presentation, to converge the presentation of offsetting assets and liabilities between U.S. GAAP and IFRS. ASU 2011-11 requires that entities disclose both gross information and net information about both instruments and transactions eligible for offset in the statement of financial position and instruments and transactions subject to an agreement similar to a master netting arrangement. In January 2013, the FASB issued ASU 2013-01 which limited the scope of this guidance to derivatives, repurchase type agreements, and securities borrowing and lending transactions. The guidance from these updates became effective for the Company in fiscal year 2014. Adoption of this guidance did not have an impact on the Company's financial statements.
In February 2013, the FASB issued ASU 2013-02, “Reporting of Amounts Reclassified Out of Accumulated Other Comprehensive Income”. ASU 2013-02 requires reclassification adjustments for items that are reclassified from accumulated other comprehensive income to net income be presented on the financial statements or in a note to the financial statements. The new disclosure requirements are effective for fiscal years, and interim periods within those years, beginning after December 15, 2012. As such, ASU 2013-02 became effective October 1, 2013, for the Company and is applied prospectively. The adoption of this updated authoritative guidance resulted in an additional footnote disclosure but had no effect on our financial condition, results of operations or cash flows.
In March 2013, the FASB issued ASU No. 2013-05, “Foreign Currency Matters (Topic 830): Parent’s Accounting for the Cumulative Translation Adjustment upon De-recognition of Certain Subsidiaries or Groups of Assets within a Foreign Entity or of an Investment in a Foreign Entity”. This ASU amended guidance related to a parent company’s accounting for the release of the cumulative translation adjustment into net income upon de-recognition of certain subsidiaries or groups of assets within a foreign entity or of an investment in a foreign entity. This guidance became effective for the Company in fiscal year 2015, and is to be applied prospectively to de-recognition events occurring after the effective date. The adoption of this amendment did not have an impact on the Company's financial statements.
In July 2013, the FASB issued ASU No. 2013-11, "Presentation of an Unrecognized Tax Benefit When a Net Operating Loss Carryforward, a Similar Tax Loss, or Tax Credit Carryforward Exists". ASU 2013-11 provides guidance on financial statement presentation of an unrecognized tax benefit when a net operating loss carryforward, a similar tax loss, or a tax credit carryforward exists. Under this guidance an unrecognized tax benefit, or a portion of an unrecognized tax benefit, should be presented in the financial statements as a reduction to a deferred tax asset for a net operating loss carryforward, a similar tax
47
loss, or a tax credit carryforward, except as follows. To the extent a net operating loss carryforward, a similar tax loss, or a tax credit carryforward is not available at the reporting date under the tax law of the applicable jurisdiction to settle any additional income taxes that would result from the disallowance of a tax position or the tax law of the applicable jurisdiction does not require the entity to use, and the entity does not intend to use, the deferred tax asset for such purpose, the unrecognized tax benefit should be presented in the financial statements as a liability and should not be combined with deferred tax assets. These amendments were effective for fiscal years, and interim periods within those years, beginning after December 15, 2013 (fiscal year 2015 for the Company). The adoption did not have an impact on the Company's consolidated financial statements.
Recent Accounting Pronouncements Not Yet Adopted as of September 30, 2015
In May 2014, the FASB issued ASU No. 2014-09, "Revenue from Contracts with Customers (Topic 606)." ASU 2014-09 provides guidance on revenue from contracts with customers, which implements a five step process of how an entity should recognize revenue in order to depict the transfer of promised goods or services to customers in an amount that reflects the consideration to which the entity expects to be entitled in exchange for those goods or services. This standard was initially released as effective for fiscal years beginning after December 15, 2016. In August 2015, the FASB issued ASU No. 2015-14 which defers the effective date of ASU 2014-09 by one year, with a new effective date for fiscal years beginning after December 15, 2017 (fiscal year 2019 for the Company). The new guidelines can be implemented using either of the following transition methods: (i) a full retrospective approach reflecting the application of the standard in each prior reporting period with the option to elect certain practical expedients, or (ii) a retrospective approach with the cumulative effect of initially adopting ASU 2014-09 recognized at the date of adoption. The Company is currently evaluating the impact of the new guidance on its consolidated financial statements and has not yet determined the method by which it will adopt the standard.
In August 2014, the FASB issued No. ASU 2014-15, "Presentation of Financial Statements - Going Concern (Subtopic 205-40): Disclosure of Uncertainties about an Entity’s Ability to Continue as a Going Concern". ASU 2014-15 requires management to assess an entity’s ability to continue as a going concern by incorporating and expanding upon certain principles that are currently in U.S. auditing standards. Specifically, ASU 2014-15 (1) provides a definition of the term substantial doubt, (2) requires an evaluation every reporting period including interim periods, (3) provides principles for considering the mitigating effect of management’s plans, (4) requires certain disclosures when substantial doubt is alleviated as a result of consideration of management’s plans, (5) requires an express statement and other disclosures when substantial doubt is not alleviated, and (6) requires an assessment for a period of one year after the date that the financial statements are issued (or are available to be issued). The standard will be effective for the first interim period within annual reporting periods beginning after December 15, 2016. Early application is permitted. This guidance will not have a material impact on our consolidated financial statements.
In April 2015, the FASB issued ASU No. 2015-05, "Customer's Accounting for Fees Paid in a Cloud Computing Arrangement". ASU 2015-05 provides guidance to customers about whether a cloud computing arrangement includes a software license. If the arrangement includes a software license, the customer should account for the software license element in a manner consistent with the acquisition of other software licenses. If the arrangement does not include a software license, the customer should account for the arrangement as a service contract. This guidance will be effective for annual periods, including interim periods within those annual periods, beginning after December 15, 2015 (fiscal year 2017 for the Company). The Company does not believe the pronouncement will have a material impact on the Company’s consolidated financial statements.
In April 2015, the FASB issued ASU No. 2015-03, “Simplifying the Presentation of Debt Issuance Costs”. This standard amends existing guidance to require the presentation of debt issuance cost in the balance sheet as a deduction from the carrying amount of the related debt liability instead of a deferred charge. It is effective for annual reporting periods beginning after December 15, 2015, but early adoption is permitted. The Company does not believe the pronouncement will have a material impact on the Company’s financial statements and will implement the pronouncement beginning in the period after December 15, 2015.
In July 2015, the FASB issued ASU No. 2015-11, "Simplifying the Measurement of Inventory". The new guidance does not apply to inventory that is measured using last-in, first-out or the retail inventory method. The guidance applies to all other inventory, which includes inventory that is measured using first-in, first-out or average cost and requires that inventory should be measured at the lower of cost and net realizable value. These amendments are effective for fiscal years beginning after December 15, 2016 (fiscal year 2018 for the Company). The Company is currently evaluating the impact of the new guidance on its consolidated financial statements.
Other accounting standards that have been issued by the FASB or other standards-setting bodies that do not require adoption until a future date are not expected to have a material impact on the Company's financial statements upon adoption.
48
ITEM 7A. QUANTITATIVE AND QUALITATIVE DISCLOSURES ABOUT MARKET RISK
The following discussion about the Company’s market risk disclosures involves forward-looking statements. Actual results could differ materially from those projected in the forward-looking statements. The Company is exposed to market risk related to changes in interest rates and foreign currency exchange rates. The Company does not use derivative financial instruments for trading purposes.
Interest Rate Sensitivity
As of September 30, 2015, the Company maintained cash equivalents and short-term investments of $175.6 million, consisting mainly of non-taxable interest bearing securities and demand deposits all with maturities of less than one year. If short-term interest rates were to increase or decrease by 10%, the impact on interest income would be less than $0.1 million.
As of September 30, 2015, the Company had $2.6 million of variable rate debt on which the interest rate is reset every six months and $20.7 million of fixed rate debt. Maturities of this debt are as follows: $5.2 million is due in 2016, $5.5 million is due in 2017, $2.5 million is due in 2018, $1.8 million is due annually from 2019 through 2022, $1.6 million is due in 2023 and $1.4 million is due in 2024. A 10% change in the variable interest rates of the Company’s debt would result in an increase or decrease in interest expense of less than $0.1 million.
The Company has entered into one interest rate swap agreements to minimize the interest expenses on a portion of its variable debt described in the previous paragraph by shifting from variable to fixed interest rates. The swap agreement is for a total notional amount of Swiss francs 2.5 million (equivalent to $2.6 million based on the exchange rate at September 30, 2015).
Foreign Currency Exchange Risk
The Company enters into foreign currency forward contracts and forward exchange options generally of less than one year duration to hedge a portion of its foreign currency risk on sales transactions. At September 30, 2015, the Company held Japanese yen forward exchange contracts with notional amounts of Euro1.8 million and of $0.3 million. The gains or losses resulting from a 10% change in currency exchange rates would be approximately $0.2 million and $0.3 million, respectively.
ITEM 8. CONSOLIDATED FINANCIAL STATEMENTS AND SUPPLEMENTARY DATA
See Item 15(a) for an index to the consolidated financial statements, which are incorporated here by reference.
ITEM 9. | CHANGES IN AND DISAGREEMENTS WITH ACCOUNTANTS ON ACCOUNTING AND FINANCIAL DISCLOSURE |
None.
ITEM 9A. CONTROLS AND PROCEDURES
Attached as exhibits to this Form 10-K are certifications of the Company’s Chief Executive Officer and Chief Financial Officer, which are required in accordance with Rule 13a-14 of the Securities Exchange Act of 1934, as amended (the “Exchange Act”). This “Controls and Procedures” section includes information concerning the controls and controls evaluation referred to in the certifications. Part IV, Item 15 of this Form 10-K, sets forth the report of Deloitte & Touche LLP, our independent registered public accounting firm, regarding its audit of the Company’s internal control over financial reporting set forth below in this section. This section should be read in conjunction with the certifications and the Deloitte & Touche LLP report for a more complete understanding of the topics presented.
Evaluation of Disclosure Controls and Procedures
The Company, under the supervision and with the participation of its management, including the Chief Executive Officer and Chief Financial Officer, evaluated the effectiveness of the design and operation of the Company’s disclosure controls and
49
procedures (as defined in Rules 13a-15(e) and 15d-15(e) of the Exchange Act). Based on the evaluation, the Chief Executive Officer and Chief Financial Officer concluded that the Company’s disclosure controls and procedures were effective as of September 30, 2015.
There has been no change in the Company’s internal control over financial reporting during the fourth quarter of the fiscal year ended September 30, 2015, that has materially affected, or is reasonably likely to materially affect, the Company’s internal control over financial reporting.
Management Report on Internal Control Over Financial Reporting
The Company’s management is responsible for establishing and maintaining adequate internal control over financial reporting to provide reasonable assurance regarding the reliability of the Company’s financial reporting and the preparation of financial statements for external purposes in accordance with Generally Accepted Accounting Principles. Internal control over financial reporting includes those policies and procedures that (i) pertain to the maintenance of records, that in reasonable detail accurately and fairly reflect the transactions and dispositions of the assets of the Company; (ii) provide reasonable assurance that transactions are recorded as necessary to permit preparation of financial statements in accordance with Generally Accepted Accounting Principles, and that receipts and expenditures of the Company are being made only in accordance with authorizations of management and directors of the Company; and (iii) provide reasonable assurance regarding prevention or timely detection of unauthorized acquisition, use or disposition of the Company’s assets that could have a material effect on the financial statements.
Management assessed the Company’s internal control over financial reporting as of September 30, 2015, the end of its fiscal year. Management based its assessment on criteria established in “Internal Control - Integrated Framework” (1992) issued by the Committee of Sponsoring Organizations of the Treadway Commission. Management’s assessment included evaluation of such elements as the design and operating effectiveness of key financial reporting controls, process documentation, accounting policies and the Company’s overall control environment. This assessment is supported by testing and monitoring performed by the Company’s Internal Audit organization.
Based on its assessment, management has concluded that the Company’s internal control over financial reporting was effective as of the end of the fiscal year to provide reasonable assurance regarding the reliability of financial reporting and the preparation of financial statements for external reporting purposes in accordance with Generally Accepted Accounting Principles. Management reviewed the results of its assessment with the Audit Committee of the Company’s Board of Directors.
The Company’s independent registered public accounting firm, Deloitte & Touche LLP, independently assessed the effectiveness of the Company’s internal control over financial reporting. Deloitte & Touche LLP has issued an attestation report concurring with management’s assessment, which is included at the beginning of Part IV, Item 15 of this Annual Report on Form 10-K.
The Company’s management does not expect that the internal controls over financial reporting will prevent or detect all errors and all fraud. A control system, no matter how well designed and operated, can provide only reasonable, not absolute, assurance that the objectives of the control system are met. Further, the design of a control system must reflect the fact that there are resource constraints, and the benefits of controls must be considered relative to their costs. Due to the inherent limitations in all control systems, no evaluation of controls can provide absolute assurance that all control issues, errors and instances of fraud, if any, within the Company have been or will be detected.
ITEM 9B. OTHER INFORMATION
None.
50
PART III
ITEM 10. DIRECTORS, EXECUTIVE OFFICERS AND CORPORATE GOVERNANCE
The information required by this item is included in the “Election of Directors”, “Directors and Executive Officers”, “Section 16(a) Beneficial Ownership Reporting Compliance”, and “Committees of the Board of Directors; Meetings and Compensation of Directors”, sections of the Company’s Proxy Statement to be filed in connection with the 2016 Annual Meeting of Stockholders expected to be held in March 2016, and is incorporated by reference herein.
ITEM 11. EXECUTIVE COMPENSATION
The information required by this item is included in the “Executive Compensation and Related Information” section of the Company’s Proxy Statement to be filed in connection with the 2016 Annual Meeting of Stockholders expected to be held in March 2016, and is incorporated by reference herein.
ITEM 12. SECURITY OWNERSHIP OF CERTAIN BENEFICIAL OWNERS AND MANAGEMENT AND
RELATED STOCKHOLDER MATTERS
The information required by this item is included in the “Security Ownership of Common Stock by Management and Certain Beneficial Owners” section of the Company’s Proxy Statement to be filed in connection with the 2016 Annual Meeting of Stockholders expected to be held in March 2016, and is incorporated by reference herein.
ITEM 13. CERTAIN RELATIONSHIPS AND RELATED TRANSACTIONS AND DIRECTOR
INDEPENDENCE
The information required by this item is included in the “Compensation Committee”, “Compensation Committee Interlocks and Insider Participation”, and “Certain Relationships and Related Transactions” sections of the Company’s Proxy Statement to be filed in connection with the 2016 Annual Meeting of Stockholders expected to be held in March 2016, and is incorporated by reference herein.
The main facility in Starnberg is rented under a 25-year operating lease from the former minority shareholder of ROFIN-BAASEL Lasertech GmbH & Co. KG (“RBL”), Mr. Baasel, who is also a member of the Board of Directors of the Company. That lease will terminate by end of December 2016. The operating lease was acquired by the Company in 2000 as part of its then acquisition of RBL. The Company paid Mr. Baasel expenses, mainly for rental expenses, of $0.7 million, $0.9 million, and $0.8 million in fiscal years 2015, 2014, and 2013, respectively. In fiscal 2015, the Company acquired a new manufacturing facility in Gilching, which is currently under reconstruction and which is intended to replace all RBL leased facilities in Starnberg.
The Company believes that all transactions noted above have been executed on an arms-length basis. Except for the foregoing, no director, officer, nominee director, 5% holder of the Company’s shares, or immediate family member, associate or affiliate thereof, had any material interest, direct or indirect, in any transaction since the beginning of fiscal year 2015 or has any material interest, direct or indirect, in any proposed transaction, having a value of $60,000 or more.
Indebtedness of Officers and Directors
Since the beginning of fiscal year 2004, there has been no indebtedness to the Company by any director or officer or associates of any such person, other than reimbursements for purchases, for ordinary travel and expense advances and for other transactions in the ordinary course of business.
51
ITEM 14. PRINCIPAL ACCOUNTANT FEES AND SERVICES
The information set forth under “Independent Public Accountants” in the definitive form of the Company’s Proxy Statement to be filed in connection with the 2016 Annual Meeting of Stockholders to be held in March 2016, is incorporated by reference herein.
52
PART IV
ITEM 15. EXHIBITS AND FINANCIAL STATEMENT SCHEDULES
a. | 1 | Consolidated Financial Statements | ||||
The following financial statements are filed as part of this Form 10-K: | ||||||
Report of Independent Registered Public Accounting Firm | ||||||
Consolidated Balance Sheets as of September 30, 2015, and 2014 | ||||||
Consolidated Statements of Operations for the years ended | ||||||
September 30, 2015, 2014 and 2013 | ||||||
Consolidated Statements of Comprehensive Income for the years ended | ||||||
September 30, 2015, 2014 and 2013 | ||||||
Consolidated Statements of Stockholders’ Equity for the years ended | ||||||
September 30, 2015, 2014 and 2013 | ||||||
Consolidated Statements of Cash Flows for the years ended | ||||||
September 30, 2015, 2014 and 2013 | ||||||
Notes to Consolidated Financial Statements | ||||||
2 | Financial Statement Schedules | |||||
Schedule II – Valuation and Qualifying Accounts | ||||||
Schedules not listed above have been omitted because the matter or conditions are not present or the information required to be set forth therein is included in the Consolidated Financial Statements hereto. | ||||||
3 | Exhibits | |||||
The exhibits listed in the accompanying index to exhibits are filed or incorporated by reference as part of this Annual Report. | ||||||
53
EXHIBIT NUMBER | DESCRIPTION | ||
3.1 | Certificate of Incorporation of the Company and Form of Certificate of Amendment thereto (Incorporated by reference to the exhibits filed with the Company’s Registration Statement on Form S-1 (File No. 333-09539) which was declared effective on September 25, 1996) | ||
3.2 | By-Laws of the Company, As Amended Through November 29, 2011 (Incorporated by reference to the exhibit filed with the Company’s Proxy Statement on Schedule 14A filed with the Securities and Exchange Commission on March 12, 2015) | ||
10.1 | Inheritable Building Right (Erbbaurecht), dated as of March 1, 1990, between ROFIN-SINAR Laser GmbH and Lohss GmbH (in German, English summary provided) (Incorporated by reference to the exhibits filed with the Company’s Registration Statement on Form S-1 (File No. 333-09539) which was declared effective on September 25, 1996) | ||
10.2 | Lease Agreement, dated August 10, 1990, between Josef and Maria Kranz and ROFIN-SINAR Laser GmbH (in German, English summary provided) (Incorporated by reference to the exhibits filed with the Company’s Registration Statement on Form S-1 (File No. 333-09539) which was declared effective on September 25, 1996) | ||
10.3 | Lease Agreement, dated March 25, 1993, between DR Group and ROFIN-SINAR, Incorporated (Concept Drive property) (Incorporated by reference to the exhibits filed with the Company’s Registration Statement on Form S-1 (File No. 333-09539) which was declared effective on September 25, 1996) | ||
10.4 | ROFIN-SINAR Laser GmbH Pension Plan (in German, English summary provided) (Incorporated by reference to the exhibits filed with the Company’s Registration Statement on Form S-1 (File No. 333-09539) which was declared effective on September 25, 1996) (a) | ||
10.5 | Deutsche Bank AG Commitment Letter dated August 22, 1996 (Incorporated by reference to the exhibits filed with the Company’s Registration Statement on Form S-1 (File No. 333-09539) which was declared effective on September 25, 1996) | ||
10.6 | U.S. and German Separation Agreements, dated as of June 4, 2015, among Gunther Braun, ROFIN-SINAR Laser GmbH, and ROFIN-SINAR Technologies Inc. (in German, English summary provided) (Incorporated by reference to the exhibits filed with the Company’s Current Report on Form 8-K filed with the Securities and Exchange Commission on June 5, 2015) (a) | ||
10.7 | Lease Agreement between Carl Baasel and ROFIN-SINAR Laser GmbH (Incorporated by reference to the exhibit filed with the Company’s Current Report on Form 8-K filed with the Securities and Exchange Commission on May 24, 2000) | ||
10.8 | 2002 Equity Incentive Plan (Incorporated by reference to the exhibit filed with the Company’s Annual Report on Form 10-K filed with the Securities and Exchange Commission on December 23, 2003) (a) | ||
10.9 | 2007 Incentive Stock Plan (Incorporated by reference to the exhibit filed with the Company’s Proxy Statement on Schedule 14A filed with the Securities and Exchange Commission on January 25, 2007, and as amended by the Company's Current Report on Form 8-K filed with the Securities and Exchange Commission on March 2, 2011) (a) | ||
10.10 | 2015 Incentive Stock Plan (Incorporated by reference to the exhibit filed with the Company’s Proxy Statement on Schedule 14A filed with the Securities and Exchange Commission on March 12, 2015) (a) | ||
10.11 | Form of Non-Qualified Stock Option Agreement (Incorporated by reference in the exhibits filed with the Company's Registration Statement on Form S-8 filed with the Securities and Exchange Commission on June 26, 2015) (a) | ||
10.12 | Form of Incentive Stock Option Agreement (Incorporated by reference in the exhibits filed with the Company's Registration Statement on Form S-8 filed with the Securities and Exchange Commission on June 26, 2015) (a) | ||
10.13 | Form of Employment Agreement, dated July 1, 2015, among Thomas Merk and ROFIN-SINAR Laser GmbH, and ROFIN-SINAR Technologies, Inc. (a) (*) | ||
10.14 | Form of Employment Agreement, dated as of September 2, 1996, among Thomas Merk, CBL Verwaltungsgellschaft mbH, and ROFIN-SINAR Laser GmbH (in German, English summary provided) (a) (*) | ||
14.1 | Code of Business Ethics (Incorporated by reference to the exhibit filed with the Company’s Proxy Statement on Schedule 14A filed with the Securities and Exchange Commission on January 30, 2004) | ||
54
EXHIBIT NUMBER | DESCRIPTION | ||
21.1 | List of Subsidiaries of the Registrant | ||
23.1 | Consent of Deloitte & Touche LLP Independent Registered Public Accounting Firm | ||
31.1 | Rule 13a-14(a)/15d-14(a) Certification of Chief Executive Officer | ||
31.2 | Rule 13a-14(a)/15d-14(a) Certification of Chief Financial Officer | ||
32.1 | Section 1350 Certification of Chief Executive Officer | ||
32.2 | Section 1350 Certification of Chief Financial Officer | ||
101.INS | XBRL Instance Document (*) | ||
101.SCH | XBRL Taxonomy Extension Schema Document (*) | ||
101.CAL | XBRL Taxonomy Extension Calculation Linkbase Document (*) | ||
101.DEF | XBRL Taxonomy Extension Definition Linkbase Document (*) | ||
101.LAB | XBRL Taxonomy Extension Label Linkbase Document (*) | ||
101.PRE | XBRL Taxonomy Extension Presentation Linkbase Document (*) | ||
(a) | Management contracts and compensatory plans and arrangements required to be filed as exhibits pursuant to Item 15(c) of this Report. | ||
(*) | These exhibits are filed with the SEC only | ||
55
SIGNATURES
Pursuant to the requirements of Section 13 or 15(d) of the Securities Exchange Act of 1934, the registrant has duly caused this report to be signed on its behalf by the undersigned, thereunto duly authorized.
Date: November 27, 2015 | ROFIN-SINAR TECHNOLOGIES INC. | ||
By: | /s/ Thomas Merk | ||
Thomas Merk | |||
President, Chief Executive Officer, and Director | |||
Pursuant to the requirements of the Securities Act of 1934, this report has been signed below by the following persons on behalf of the registrant and in the capacities and on the dates indicated.
SIGNATURE | TITLE | DATE | ||
/s/ Peter Wirth | Chairman of the Board | November 27, 2015 | ||
Peter Wirth | ||||
/s/ Thomas Merk | President, Chief Executive Officer, | November 27, 2015 | ||
Thomas Merk | and Director | |||
/s/ Ingrid Mittelstaedt | Chief Financial Officer | November 27, 2015 | ||
Ingrid Mittelstaedt | ||||
/s/ Ralph Reins | Director | November 27, 2015 | ||
Ralph Reins | ||||
/s/ Gary Willis | Director | November 27, 2015 | ||
Gary Willis | ||||
/s/ Carl F. Baasel | Director | November 27, 2015 | ||
Carl F. Baasel | ||||
/s/ Daniel Smoke | Director | November 27, 2015 | ||
Daniel Smoke | ||||
/s/ Stephen Fantone | Director | November 27, 2015 | ||
Stephen Fantone | ||||
56
REPORT OF INDEPENDENT REGISTERED PUBLIC ACCOUNTING FIRM
To the Board of Directors and Stockholders of
ROFIN-SINAR Technologies Inc. and Subsidiaries
Plymouth, Michigan
We have audited the accompanying consolidated balance sheets of ROFIN-SINAR Technologies Inc. and subsidiaries (the "Company") as of September 30, 2015 and 2014, and the related consolidated statements of operations, comprehensive income, stockholders' equity, and cash flows for each of the three years in the period ended September 30, 2015. Our audits also included the financial statement schedule listed in the Index at Item 15 (the “financial statement schedule”). We also have audited the Company's internal control over financial reporting as of September 30, 2015, based on criteria established in Internal Control - Integrated Framework (1992) issued by the Committee of Sponsoring Organizations of the Treadway Commission. The Company's management is responsible for these financial statements and financial statement schedule, for maintaining effective internal control over financial reporting, and for its assessment of the effectiveness of internal control over financial reporting, included in the accompanying Management Report on Internal Control Over Financial Reporting. Our responsibility is to express an opinion on these financial statements and financial statement schedule and an opinion on the Company's internal control over financial reporting based on our audits.
We conducted our audits in accordance with the standards of the Public Company Accounting Oversight Board (United States). Those standards require that we plan and perform the audit to obtain reasonable assurance about whether the financial statements are free of material misstatement and whether effective internal control over financial reporting was maintained in all material respects. Our audits of the financial statements included examining, on a test basis, evidence supporting the amounts and disclosures in the financial statements, assessing the accounting principles used and significant estimates made by management, and evaluating the overall financial statement presentation. Our audit of internal control over financial reporting included obtaining an understanding of internal control over financial reporting, assessing the risk that a material weakness exists, and testing and evaluating the design and operating effectiveness of internal control based on the assessed risk. Our audits also included performing such other procedures as we considered necessary in the circumstances. We believe that our audits provide a reasonable basis for our opinions.
A company's internal control over financial reporting is a process designed by, or under the supervision of, the company's principal executive and principal financial officers, or persons performing similar functions, and effected by the company's board of directors, management, and other personnel to provide reasonable assurance regarding the reliability of financial reporting and the preparation of financial statements for external purposes in accordance with generally accepted accounting principles. A company's internal control over financial reporting includes those policies and procedures that (1) pertain to the maintenance of records that, in reasonable detail, accurately and fairly reflect the transactions and dispositions of the assets of the company; (2) provide reasonable assurance that transactions are recorded as necessary to permit preparation of financial statements in accordance with generally accepted accounting principles and that receipts and expenditures of the company are being made only in accordance with authorizations of management and directors of the company; and (3) provide reasonable assurance regarding prevention or timely detection of unauthorized acquisition, use, or disposition of the company's assets that could have a material effect on the financial statements.
Because of the inherent limitations of internal control over financial reporting, including the possibility of collusion or improper management override of controls, material misstatements due to error or fraud may not be prevented or detected on a timely basis. Also, projections of any evaluation of the effectiveness of the internal control over financial reporting to future periods are subject to the risk that the controls may become inadequate because of changes in conditions, or that the degree of compliance with the policies or procedures may deteriorate.
In our opinion, the consolidated financial statements referred to above present fairly, in all material respects, the financial position of ROFIN-SINAR Technologies Inc. and subsidiaries as of September 30, 2015 and 2014, and the results of their operations and their cash flows for each of the three years in the period ended September 30, 2015, in conformity with accounting principles generally accepted in the United States of America. Also, in our opinion, such financial statement schedule, when considered in relation to the basic consolidated financial statements taken as a whole, presents fairly, in all material respects, the information set forth therein. Also, in our opinion, the Company maintained, in all material respects, effective internal control over financial reporting as of September 30, 2015, based on the criteria established in Internal Control - Integrated Framework (1992) issued by the Committee of Sponsoring Organizations of the Treadway Commission.
/s/ Deloitte & Touche LLP
Detroit, MI
November 30, 2015
F-1
ROFIN-SINAR TECHNOLOGIES INC. AND SUBSIDIARIES
CONSOLIDATED BALANCE SHEETS
(dollars in thousands, except share data)
September 30, | ||||||||
2015 | 2014 | |||||||
ASSETS | ||||||||
Current assets: | ||||||||
Cash and cash equivalents | $ | 169,729 | $ | 128,537 | ||||
Short-term investments | 5,833 | 13,121 | ||||||
Accounts receivable, trade | 99,372 | 111,364 | ||||||
Less allowance for doubtful accounts | (3,279 | ) | (3,338 | ) | ||||
Trade accounts receivable, net | 96,093 | 108,026 | ||||||
Other accounts receivable | 3,258 | 4,885 | ||||||
Inventories, net (note 3) | 181,025 | 190,321 | ||||||
Prepaid expenses | 6,920 | 5,449 | ||||||
Deferred income tax assets (note 10) | 25,718 | 23,536 | ||||||
Total current assets | 488,576 | 473,875 | ||||||
Property and equipment, at cost (note 4) | 191,828 | 180,746 | ||||||
Less accumulated depreciation | (99,255 | ) | (101,043 | ) | ||||
Property and equipment, net | 92,573 | 79,703 | ||||||
Deferred income tax assets (note 10) | 15,528 | 16,890 | ||||||
Goodwill (note 5) | 93,541 | 100,355 | ||||||
Other Intangibles, net (note 5) | 14,767 | 15,712 | ||||||
Other assets | 1,506 | 2,050 | ||||||
Total assets | $ | 706,491 | $ | 688,585 | ||||
LIABILITIES AND EQUITY | ||||||||
Current liabilities: | ||||||||
Line of credit and short-term borrowings (note 7 and 8) | $ | 5,226 | $ | 3,255 | ||||
Accounts payable, trade | 23,443 | 22,702 | ||||||
Accounts payable to related party (note 15) | 299 | 443 | ||||||
Income taxes payable (note 10) | 7,998 | 5,872 | ||||||
Deferred income tax liabilities (note 10) | 2,666 | 4,437 | ||||||
Accrued liabilities (note 6) | 69,986 | 63,144 | ||||||
Total current liabilities | 109,618 | 99,853 | ||||||
Long-term debt (note 8) | 18,085 | 11,511 | ||||||
Pension obligations (note 11) | 25,439 | 25,692 | ||||||
Deferred income tax liabilities (note 10) | 6,452 | 7,303 | ||||||
Other long-term liabilities | 4,288 | 5,517 | ||||||
Total liabilities | 163,882 | 149,876 | ||||||
Commitments and contingencies (note 9) | ||||||||
F-2
Stockholders’ equity: | ||||||||
Preferred stock, 5,000,000 shares authorized, none issued or outstanding | — | — | ||||||
Common stock, $0.01 par value, 50,000,000 shares authorized, 33,053,687 shares issued at September 30, 2015 (32,884,000 shares issued at September 30, 2014) | 331 | 329 | ||||||
Additional paid-in capital | 239,333 | 232,832 | ||||||
Retained earnings | 529,234 | 487,976 | ||||||
Accumulated other comprehensive income (loss) | (57,517 | ) | (14,072 | ) | ||||
Treasury shares, at cost, 4,871,884 shares at September 30, 2015 and 2014 | (169,262 | ) | (169,262 | ) | ||||
Total ROFIN-SINAR Technologies Inc. stockholders’ equity | 542,119 | 537,803 | ||||||
Noncontrolling interest in subsidiaries | 490 | 906 | ||||||
Total equity | 542,609 | 538,709 | ||||||
Total liabilities and equity | $ | 706,491 | $ | 688,585 | ||||
See accompanying notes to consolidated financial statements
F-3
ROFIN-SINAR TECHNOLOGIES INC. AND SUBSIDIARIES
CONSOLIDATED STATEMENTS OF OPERATIONS
YEARS ENDED SEPTEMBER 30, 2015, 2014 AND 2013
(dollars in thousands, except share and per share amounts)
Years ended September 30, | ||||||||||||
2015 | 2014 | 2013 | ||||||||||
Net sales | $ | 519,643 | $ | 530,117 | $ | 560,068 | ||||||
Cost of goods sold | 323,165 | 341,202 | 363,559 | |||||||||
Gross profit | 196,478 | 188,915 | 196,509 | |||||||||
Selling, general and administrative expenses | 97,405 | 106,051 | 101,726 | |||||||||
Research and development expenses | 39,987 | 45,900 | 43,014 | |||||||||
Amortization expense | 3,057 | 2,906 | 2,553 | |||||||||
Income from operations | 56,029 | 34,058 | 49,216 | |||||||||
Other expense (income): | ||||||||||||
Interest income | (418 | ) | (485 | ) | (541 | ) | ||||||
Interest expense | 409 | 719 | 595 | |||||||||
Foreign currency losses (gains) | (1,680 | ) | (1,425 | ) | 452 | |||||||
Miscellaneous | 750 | (1,431 | ) | (445 | ) | |||||||
Total other expense (income), net | (939 | ) | (2,622 | ) | 61 | |||||||
Income before income taxes | 56,968 | 36,680 | 49,155 | |||||||||
Income tax expense (note 10) | 15,747 | 11,528 | 14,139 | |||||||||
Net income | 41,221 | 25,152 | 35,016 | |||||||||
Less: net income (loss) attributable to the non-controlling interest | (37 | ) | (16 | ) | 261 | |||||||
Net income attributable to RSTI | $ | 41,258 | $ | 25,168 | $ | 34,755 | ||||||
Net income attributable to RSTI per share (note 12): | ||||||||||||
Per Share of Common Stock Basic | $ | 1.47 | $ | 0.90 | $ | 1.23 | ||||||
Per Share of Common Stock Diluted | $ | 1.46 | $ | 0.89 | $ | 1.22 | ||||||
Weighted average shares used in computing earnings per share (note 12): | ||||||||||||
Basic | 28,127,733 | 28,073,081 | 28,188,849 | |||||||||
Diluted | 28,270,944 | 28,222,191 | 28,391,762 | |||||||||
See accompanying notes to consolidated financial statements
F-4
ROFIN-SINAR TECHNOLOGIES INC. AND SUBSIDIARIES
CONSOLIDATED STATEMENTS OF COMPREHENSIVE INCOME
YEARS ENDED SEPTEMBER 30, 2015, 2014 AND 2013
(dollars in thousands)
Years ended September 30, | ||||||||||||
2015 | 2014 | 2013 | ||||||||||
Net income | $ | 41,221 | $ | 25,152 | $ | 35,016 | ||||||
Other comprehensive income (loss): | ||||||||||||
Fair value of interest rate swap agreements, net of tax expense of $11, $15 and $25 | 38 | 47 | 80 | |||||||||
Foreign currency translation adjustments | (43,137 | ) | (24,850 | ) | 14,830 | |||||||
Defined benefit pension plans, net of tax benefit of $309 and $391 and tax expense of $619 (note 11) | (346 | ) | (802 | ) | 859 | |||||||
Other comprehensive income (loss), net of tax | $ | (43,445 | ) | $ | (25,605 | ) | $ | 15,769 | ||||
Total comprehensive income (loss) | $ | (2,224 | ) | $ | (453 | ) | $ | 50,785 | ||||
Less: Total comprehensive income (loss) attributable to the non-controlling interest | (37 | ) | (16 | ) | 261 | |||||||
Total comprehensive income (loss) attributable to RSTI | $ | (2,187 | ) | $ | (437 | ) | $ | 50,524 | ||||
See accompanying notes to consolidated financial statements
F-5
ROFIN-SINAR TECHNOLOGIES INC. AND SUBSIDIARIES
CONSOLIDATED STATEMENTS OF STOCKHOLDERS’ EQUITY
YEARS ENDED SEPTEMBER 30, 2015, 2014 AND 2013
(dollars in thousands, except share data)
Number of Common Shares Outstanding | Common Stock Par Value | Additional Paid-in Capital | Retained Earnings | Accumulated Other Comprehensive Income (Loss) | Treasury Stock | ROFIN-SINAR Technologies Stockholders’ Equity | Non- Controlling Interests | Total Equity | ||||||||||||||||||||||||||
BALANCES at September 30, 2012 | 28,072,964 | $ | 325 | $ | 223,339 | $ | 428,053 | $ | (4,236 | ) | $ | (158,904 | ) | $ | 488,577 | $ | 5,342 | $ | 493,919 | |||||||||||||||
Total comprehensive income (loss) | 34,755 | 15,769 | — | 50,524 | 261 | 50,785 | ||||||||||||||||||||||||||||
Purchase of non-controlling interest | — | — | (2,332 | ) | — | — | — | (2,332 | ) | (1,951 | ) | (4,283 | ) | |||||||||||||||||||||
Common stock issued in connection with Stock Incentive Plans | 230,450 | 2 | 7,117 | — | — | — | 7,119 | — | 7,119 | |||||||||||||||||||||||||
Purchases of treasury stock | (179,145 | ) | — | — | — | — | (4,122 | ) | (4,122 | ) | — | (4,122 | ) | |||||||||||||||||||||
BALANCES at September 30, 2013 | 28,124,269 | $ | 327 | $ | 228,124 | $ | 462,808 | $ | 11,533 | $ | (163,026 | ) | $ | 539,766 | $ | 3,652 | $ | 543,418 | ||||||||||||||||
Total comprehensive income (loss) | 25,168 | (25,605 | ) | — | (437 | ) | (16 | ) | (453 | ) | ||||||||||||||||||||||||
Purchase of non-controlling interest | — | — | (2,302 | ) | — | — | — | (2,302 | ) | (2,730 | ) | (5,032 | ) | |||||||||||||||||||||
Common stock issued in connection with Stock Incentive Plans | 158,050 | 2 | 7,010 | — | — | — | 7,012 | — | 7,012 | |||||||||||||||||||||||||
Purchases of treasury stock | (270,203 | ) | — | — | — | — | (6,236 | ) | (6,236 | ) | — | (6,236 | ) | |||||||||||||||||||||
BALANCES at September 30, 2014 | 28,012,116 | $ | 329 | $ | 232,832 | $ | 487,976 | $ | (14,072 | ) | $ | (169,262 | ) | $ | 537,803 | $ | 906 | $ | 538,709 | |||||||||||||||
Total comprehensive income (loss) | 41,258 | (43,445 | ) | — | (2,187 | ) | (37 | ) | (2,224 | ) | ||||||||||||||||||||||||
Purchase of non-controlling interest | — | — | (69 | ) | — | — | — | (69 | ) | (379 | ) | (448 | ) | |||||||||||||||||||||
Common stock issued in connection with Stock Incentive Plans | 169,687 | 2 | 6,570 | — | — | — | 6,572 | — | 6,572 | |||||||||||||||||||||||||
BALANCES at September 30, 2015 | 28,181,803 | $ | 331 | $ | 239,333 | $ | 529,234 | $ | (57,517 | ) | $ | (169,262 | ) | $ | 542,119 | $ | 490 | $ | 542,609 | |||||||||||||||
See accompanying notes to consolidated financial statements
F-6
ROFIN-SINAR TECHNOLOGIES INC. AND SUBSIDIARIES
CONSOLIDATED STATEMENTS OF CASH FLOWS
YEARS ENDED SEPTEMBER 30, 2015, 2014 AND 2013
(dollars in thousands)
Years ended September 30, | ||||||||||||
2015 | 2014 | 2013 | ||||||||||
CASH FLOWS FROM OPERATING ACTIVITIES: | ||||||||||||
Net income | $ | 41,221 | $ | 25,152 | $ | 35,016 | ||||||
Adjustments to reconcile net income to net cash provided by operating activities: | ||||||||||||
Depreciation and amortization | 16,190 | 17,312 | 15,318 | |||||||||
Issuance of restricted stock | 275 | 292 | 245 | |||||||||
Provision for doubtful accounts | 552 | 889 | 156 | |||||||||
Exchange rate (gains) losses | (1,062 | ) | (837 | ) | 540 | |||||||
Loss (gains) on disposal of property and equipment | 566 | (55 | ) | 398 | ||||||||
Stock-based compensation expenses | 4,189 | 4,282 | 3,929 | |||||||||
Deferred income taxes | (3,396 | ) | (2,178 | ) | (2,542 | ) | ||||||
Other non-cash income | — | (1,000 | ) | — | ||||||||
Change in operating assets and liabilities: | ||||||||||||
Accounts receivable, trade | 2,701 | (3,560 | ) | (469 | ) | |||||||
Other accounts receivable | 1,394 | 2,866 | (2,698 | ) | ||||||||
Inventories | (7,421 | ) | (1,972 | ) | 10,068 | |||||||
Prepaid expenses and other | (3,970 | ) | (2,316 | ) | 1,582 | |||||||
Accounts payable | 2,509 | (653 | ) | (2,247 | ) | |||||||
Income taxes payable | 1,865 | 1,221 | (1,320 | ) | ||||||||
Accrued liabilities and pension obligations | 12,966 | (3,899 | ) | (952 | ) | |||||||
Net cash provided by operating activities | 68,579 | 35,544 | 57,024 | |||||||||
CASH FLOWS FROM INVESTING ACTIVITIES: | ||||||||||||
Additions to property and equipment | (33,998 | ) | (10,389 | ) | (16,168 | ) | ||||||
Proceeds from the sale of property and equipment | 527 | 231 | 128 | |||||||||
Purchases of short-term investments | (9,327 | ) | (38,671 | ) | (6,253 | ) | ||||||
Proceeds from the sale of short-term and long-term investments | 15,860 | 30,499 | 6,771 | |||||||||
Acquisitions | — | (5,891 | ) | — | ||||||||
Net cash used in investing activities | (26,938 | ) | (24,221 | ) | (15,522 | ) | ||||||
CASH FLOWS FROM FINANCING ACTIVITIES: | ||||||||||||
Proceeds from the issuance of debt | 34,260 | 39,726 | 20,878 | |||||||||
Repayments to bank | (23,436 | ) | (41,677 | ) | (24,869 | ) | ||||||
Purchase of treasury stock | — | (6,236 | ) | (4,122 | ) | |||||||
Issuance of common stock | 2,109 | 2,389 | 2,945 | |||||||||
Excess tax benefit from stock options | — | 48 | 2 | |||||||||
Payment of contingent acquisition-related obligations | (800 | ) | — | — | ||||||||
Payments to subsidiary’s minority shareholders | (410 | ) | (4,911 | ) | (4,262 | ) | ||||||
Net cash provided by (used in) financing activities | 11,723 | (10,661 | ) | (9,428 | ) | |||||||
Effect of foreign currency translation on cash | (12,172 | ) | (5,858 | ) | 2,924 | |||||||
Net increase (decrease) in cash and cash equivalents | 41,192 | (5,196 | ) | 34,998 | ||||||||
Cash and cash equivalents at beginning of year | 128,537 | 133,733 | 98,735 | |||||||||
Cash and cash equivalents at end of year | $ | 169,729 | $ | 128,537 | $ | 133,733 | ||||||
Cash paid during the year for interest | $ | 277 | $ | 355 | $ | 614 | ||||||
Cash paid during the year for income taxes | $ | 16,082 | $ | 10,716 | $ | 21,560 | ||||||
F-7
ROFIN-SINAR TECHNOLOGIES INC. AND SUBSIDIARIES
NOTES TO CONSOLIDATED FINANCIAL STATEMENTS
September 30, 2015, 2014, and 2013
(dollars in thousands, except per share amounts)
1. SUMMARY OF ACCOUNTING POLICIES
Description of the Company and Business
The primary business of ROFIN-SINAR Technologies Inc. (“ROFIN” or “RSTI” or “the Company”) is to develop, manufacture, and market industrial lasers and supplies used for material processing applications. The majority of the Company’s customers are in the machine tool, automotive, semiconductor, and electronics industries and are located in the United States, Europe, and Asia/Pacific. For the years ended September 30, 2015, 2014 and 2013, ROFIN generated approximately 58% , 58% and 61% , respectively, of its revenues from the sale of lasers and laser systems. For the years ended September 30, 2015, 2014 and 2013, approximately 42% , 42% and 39%, respectively, of its revenues were generated from sales of after-sales services, replacement parts and components for laser products.
Principles of Consolidation and Basis of Presentation
The accompanying consolidated financial statements of RSTI and its subsidiaries were prepared in accordance with accounting principles generally accepted in the United State of America ("U.S. GAAP") and include the assets, liabilities, revenues and expenses of all majority-owned subsidiaries over which the Company exercises control and, when applicable, for which the Company has a controlling financial interest or is the primary beneficiary.
All intercompany balances and transactions have been eliminated in consolidation.
Acquisitions and Formation of New Entities
The Company uses the acquisition method of accounting for its acquisitions with the respective results of operations included in the consolidated results from the date of acquisition.
• | Effective December 20, 2012, the Company acquired the remaining 20% of the common stock of ROFIN-BAASEL China Co., Ltd. through its wholly-owned subsidiary RSL. The Company currently holds 100% of the share capital of ROFIN-BAASEL China Co., Ltd. |
• | Effective January 8, 2013, the Company acquired the remaining 20% of the common stock of Nanjing Eastern Technologies Company, Ltd. (“NETC”). The Company currently holds 100% of the share capital of NETC. |
• | On November 18, 2013, the Company purchased the remaining 10% of the share capital of m2k-laser GmbH (“m2k“) through ROFIN-SINAR Laser GmbH ("RSL") under an option agreement between the Company and the minority shareholders of m2k. As a result of those share purchases, the Company currently holds 100% of the share capital of m2k. |
• | Effective December 20, 2013, the Company acquired the remaining 12% of the common stock of ROFIN-BAASEL Japan Corp. through its wholly-owned subsidiary RSL. The Company currently holds 100% of the share capital of ROFIN-BAASEL Japan Corp. |
• | Effective June 12, 2014, the Company acquired the remaining 5% of the common stock of DILAS Diodenlaser GmbH (“DILAS”) through its wholly-owned subsidiary ROFIN-SINAR Technologies Europe S.L.U. (“RSTE”). The Company currently holds 100% of the share capital of DILAS. |
• | Effective December 23, 2014, the Company acquired an additional 8.8% of the common stock of Nanjing Eastern Laser Company, Ltd. (“NELC”). The company currently holds 88.8% of the share capital of NELC. |
F-8
The Company also completed the following acquisition of certain assets.
• | On April 10, 2014, the Company completed the acquisition of certain assets of FiLaser USA LLC. ("FiLaser") and subsidiaries. The transaction contains all intellectual property including know-how, patents, and patent applications of FiLaser. FiLaser has developed advanced laser process technology used for precision cutting and drilling of brittle material including glass, sapphire and semiconductor substrates. The Company has held back approximately 18% of the purchase price as security for various claims. In addition, the purchase agreement also provides for potential future earn-out payments from revenues generated from certain of these intangible assets. |
Fair Value
The Company’s cash, short-term investments, accounts receivable and accrued liabilities are carried at amounts that reasonably approximate their fair value due to their short-term nature. The Company’s notes payable are at variable interest rates that approximate market. Fair value is defined as the price that would be received to sell an asset or paid to transfer a liability in an orderly transaction between market participants at the measurement date. Where available, fair value is based on observable market prices or parameters or derived from such prices or parameters. Where observable prices or inputs are not available, valuation models may be applied.
Assets and liabilities recorded at fair value in our balance sheet are categorized based upon the level of judgment associated with the inputs used to measure their fair values. Hierarchical levels are directly related to the amount of subjectivity associated with the inputs to fair valuation of these assets and liabilities and are as follows:
• | Level 1 - Unadjusted observable quoted prices for identical instruments in active markets. |
• | Level 2 - Observable inputs other than those included in Level 1. For example, quoted prices for similar assets or liabilities in active markets or quoted prices for identical assets or liabilities in inactive markets. |
• | Level 3 - Unobservable inputs reflecting management's own assumptions about the inputs used in pricing the asset or liability. |
Cash Equivalents
Cash equivalents consist of financial instruments that are readily convertible into cash and have original maturities of three months or less at the time of acquisition.
Inventories
Inventories are stated at the lower of cost or market, after provisions for excess and obsolete inventory salable at prices below cost. Costs are determined using the first-in, first-out and weighted average cost methods.
The Company writes down inventory for estimated obsolescence or unmarketable inventory equal to the difference between the cost of inventory and the estimated market value based upon assumptions about future demand and market conditions. If actual market conditions are less favorable than those projected by management, additional inventory write-downs may be required.
We also write-down up to ninety percent of our total demo inventory costs over thirty six months.
Property and Equipment
Property and equipment are recorded at cost and depreciated over their estimated useful lives, except for leasehold improvements, which are amortized over the lesser of their estimated useful lives or the term of the lease. The methods of depreciation are straight line for financial reporting purposes and accelerated for income tax purposes.
F-9
Depreciable lives for financial reporting purposes are as follows:
Useful Lives | |
Buildings | 40 Years |
Technical machinery and equipment | 3-10 Years |
Furniture and fixtures | 3-10 Years |
Computers and software | 3-4 Years |
Leasehold improvements | Term of lease |
Total depreciation expense for the years ended September 30, 2015, 2014 and 2013, amounted to $13,133, $14,406, and $12,765, respectively.
The Company reviews long-lived assets for impairment whenever events or changes in circumstances indicate that the carrying amount of an asset may not be recoverable. Recoverability of assets to be held and used is measured by a comparison of the carrying amount of an asset to future undiscounted net cash flows expected to be generated by the asset. If such assets are considered to be impaired, the impairment to be recognized is measured by the amount by which the carrying amount of the assets exceeds the fair value of the assets. Assets to be disposed of are reported at the lower of the carrying amount or fair value less costs to sell.
Goodwill and Other Intangible Assets
Goodwill represents the excess purchase price over the fair value of the assets acquired in connection with the Company’s acquisitions.
Goodwill is required to be tested on an annual basis for potential impairment at the reporting unit level. A reporting unit is defined as the lowest level of an entity that is a business and that can be distinguished, physically and operationally and for internal reporting purposes, from other activities, operations and assets of the entity. A reporting unit can be no higher than an operating segment and would generally be lower than that level of reporting. The Company manages its business under one operating and reportable segment, and has one reporting unit.
In testing for impairment, the fair value of the reporting unit, that is determined based on market data, is compared to its carrying amount. If the carrying value is below the fair value assessment, there will be no impairment loss. If the fair value is below the carrying value, then the Company is required to perform an additional test to determine the implied fair value of the goodwill.
The Company performed its annual goodwill impairment testing as of September 30th and determined that the fair value of its reporting unit exceeds its carrying value and accordingly, the second step of the impairment test was not required to be performed.
Revenue Recognition and Accounts Receivable Valuation
Revenue is recognized when persuasive evidence of an arrangement exists, the product has been delivered, the price is fixed or determinable and collection is probable. Terms under these arrangements are generally free on board (“FOB”) shipping point, or ex works factory (“EXW”), at which time legal title passes from the Company to the customer. Therefore, delivery is generally considered to have occurred upon shipment. In certain circumstances customers may negotiate different terms. In these situations, delivery is considered to have occurred once legal title has passed from the Company to the customer. This may be at delivery to the customer’s destination or acceptance by the Company’s customer.
Sales to end-user customers and resellers typically do not have customer acceptance provisions and only certain of the original equipment manufacturer (“OEM”) customer sales have customer acceptance provisions. Customer acceptance is generally limited to performance under published product specifications. For the few product sales that have customer acceptance provisions because of higher than published specifications, (1) the products are tested and accepted by the customer at a company site or by the customer’s acceptance of the results of a testing program prior to shipment to the customer, or (2) the revenue is deferred until customer acceptance occurs. The Company records revenues net of volume discount rebates that are earned by certain OEM customers, based on sales levels, pursuant to contractual agreements.
F-10
The vast majority of our sales are made to OEMs resellers, and end users in the industrial market. Sales made to OEMs and resellers in the industrial market do not require installation of the products by the Company, as installation is performed by the customer and are not subject to other post-delivery obligations. The Company may enter into multiple-deliverable arrangements which include the delivery of lasers, laser systems, installation, and training. Revenue from these arrangements is allocated to separate units of accounting if certain criteria are met. The allocation of the arrangement consideration to the separate units of accounting is based on vendor-specific objective evidence or third-party evidence. If such evidence is not available, the Company uses best estimate of selling price. Revenue related to installation and training is recognized when installation is completed or training is provided which usually takes place up to three months after the delivery of the laser or the laser system.
The Company records allowances for uncollectible customer accounts receivable based on historical experience. Additionally, an allowance is made based on an assessment of specific customers’ financial condition and liquidity. If the financial condition of the Company’s customers were to deteriorate, additional allowances may be required.
Income and Other Taxes
Income taxes are accounted for under the asset and liability method. Deferred tax assets and liabilities are recognized for the future tax consequences attributable to differences between the financial statement carrying amounts of existing assets and liabilities and their respective tax bases and operating loss tax carryforwards. Deferred tax assets and liabilities are measured using enacted tax rates that apply to taxable income in the years in which those temporary differences are expected to be recovered or settled. The effect on deferred taxes of a change in tax rates is recognized in income in the period that includes the enactment date. In assessing the realizability of deferred tax assets, management considers whether it is more likely than not that some portion or all of the deferred tax assets will not be realized.
The Company recognizes certain tax liabilities for anticipated tax audit findings in the U.S. and other tax jurisdictions based on its estimate of whether, and to the extent to which additional taxes would be due. If the audit finding results in actual taxes owed more or less than what the Company anticipated, its income tax expense would increase or decrease in the period of determination.
Revenue and expenses are presented net of any country-specific taxes.
Accounting for Warranties
The Company issues a standard warranty of one to two years for parts and labor on lasers that are sold. Additionally, extended warranties are negotiated on a contract-by-contract basis. The Company provides for estimated warranty costs as products are shipped.
The Company’s estimate of costs to fulfill its warranty obligations is based on historical experience and expectation of future conditions. To the extent the Company experiences increased warranty claim activity or increased costs associated with servicing those claims, revisions to the estimated warranty liability would be required.
Foreign Currency Translation
The assets and liabilities of the Company’s operations outside the United States are translated into U.S. dollars at exchange rates in effect on the balance sheet date, and revenues and expenses are translated using a weighted average exchange rate during the period. Gains or losses resulting from the translation of foreign currency financial statements are recorded as a separate component of stockholders’ equity. Gains and losses resulting from the re-measurement of foreign currency transactions are reported as a component of “Other expense (income), net”.
Earnings per Share (“EPS”)
Basic EPS is computed by dividing “Net Income attributable to RSTI” by the weighted average number of common shares outstanding during the period. Diluted EPS reflects the potential dilution from common stock equivalents (stock options).
F-11
Comprehensive Income
Comprehensive income consists of net income, foreign currency translation adjustments, pension liability adjustments and changes in the fair value of interest rate swap agreements, and is presented in the consolidated statements of stockholders’ equity and comprehensive income.
Research and Development Expenses
Research and development costs are expensed when incurred and are net of primarily German and other European governments and European Union grants of $691, $1,555 and $2,437, received for the years ended September 30, 2015, 2014 and 2013, respectively. The Company has no future obligations under such grants.
Derivative Financial Instruments
The Company uses derivative financial instruments to manage funding costs and exposures arising from fluctuations in interest rates. These derivative financial instruments consist primarily of interest rate swaps. The Company does not use derivative financial instruments for trading purposes.
On the date the derivative contract is entered into, the Company designates the derivative as a hedge of the variability of cash flows to be paid related to a recognized liability (“cash flow” hedge). Changes in the fair value of a derivative that is highly effective and that is designated and qualifies as a cash flow hedge are recorded in other comprehensive income, until earnings are affected by the variability in cash flows of the designated hedged item.
Interest rate swap agreements designated as hedges of the Company’s financial liabilities are recorded in the consolidated balance sheet at fair value. Adjustments to the fair value of the derivative asset or liability are recorded as an adjustment to other comprehensive income. The swap agreement is for a total notional amount of Swiss francs 2.5 million.
From time to time, the Company enters into foreign currency forward contracts and forward exchange options generally of less than one year duration to hedge a portion of its sales transactions denominated in foreign currencies. The gains and losses from these foreign currency forward contracts and forward exchange options are reflected in the consolidated statement of operations. At September 30, 2015, the Company held Japanese yen forward exchange contracts with notional amounts of Euro 1.8 million and of $0.3 million, respectively.
Operating Leases
The Company leases facilities under operating leases. Building lease agreements generally include rent escalation clauses. Most of the Company’s lease agreements include renewal periods at the Company’s option. The Company recognizes scheduled rent increases on a straight-line basis over the lease term beginning with the date the Company takes possession of the leased space.
Use of Estimates
Management of the Company makes a number of estimates and assumptions relating to the reporting of assets and liabilities, the disclosure of contingent assets and liabilities and the reporting of revenues and expenses, to prepare these financial statements in conformity with generally accepted U.S. accounting principles. Significant items subject to such estimates and assumptions include the valuation allowance for receivables, inventory valuation, warranty liabilities, the valuation allowance for deferred tax assets, assets and obligations related to employee benefits, and share-based payment awards. Actual results could differ from these estimates.
Stock Incentive Plans
The Company measures share-based payments to employees, including grants of employee stock options, at fair value and expenses them in the consolidated statement of operations over the service period (generally the vesting period) of the grant.
F-12
Shipping and Handling Costs
The Company accounts for shipping and handling fees and costs by recording revenue from shipping and handling fees in net sales and shipping and handling costs in cost of sales.
Recent Accounting Pronouncements Adopted
In June 2011, the Financial Accounting Standards Board ("FASB") issued guidance requiring changes to the presentation of comprehensive income which requires entities to present the total of comprehensive income, the components of net income and the components of other comprehensive income either in a single continuous statement of comprehensive income or in two separate but consecutive statements. These changes, with retrospective application, became effective for the Company in fiscal year 2013. Other than the change in presentation to report comprehensive income as a separate but consecutive statement, these changes did not have an impact on the consolidated financial statements.
In September 2011, the FASB issued Accounting Standards Update ("ASU") 2011-08, “Testing Goodwill for Impairment”. The amendments under ASU 2011-08 allow entities to first assess qualitative factors to determine whether it is necessary to perform the two-step quantitative goodwill impairment test. Under these amendments, an entity is not required to calculate the fair value of a reporting unit unless the entity determines, based on a qualitative assessment, that it is more likely than not that the reporting unit’s fair value is less than its carrying amount. The amendments included a number of events and circumstances for entities to consider in conducting the qualitative assessment. Entities now have the option to bypass the qualitative assessment for any reporting unit in any period and proceed directly to performing the first step of the two-step quantitative goodwill impairment test. ASU 2011-08 was effective for annual and interim goodwill impairment tests performed for fiscal years beginning after December 15, 2011 (fiscal year 2013 for the Company). Adoption of ASU 2011-08 did not have a material impact on the Company’s financial statements.
In December 2011, the FASB issued ASU 2011-11, “Disclosures about Offsetting Assets and Liabilities”. ASU 2011-11 amended guidance on balance sheet presentation, to converge the presentation of offsetting assets and liabilities between U.S. GAAP and IFRS. ASU 2011-11 requires that entities disclose both gross information and net information about both instruments and transactions eligible for offset in the statement of financial position and instruments and transactions subject to an agreement similar to a master netting arrangement. In January 2013, the FASB issued ASU 2013-01 which limited the scope of this guidance to derivatives, repurchase type agreements, and securities borrowing and lending transactions. The guidance from these updates became effective for the Company in fiscal year 2014. Adoption of this guidance did not have an impact on the Company's financial statements.
In February 2013, the FASB issued ASU 2013-02, “Reporting of Amounts Reclassified Out of Accumulated Other Comprehensive Income”. ASU 2013-02 requires reclassification adjustments for items that are reclassified from accumulated other comprehensive income to net income be presented on the financial statements or in a note to the financial statements. The new disclosure requirements are effective for fiscal years, and interim periods within those years, beginning after December 15, 2012. As such, ASU 2013-02 became effective October 1, 2013, for the Company and is applied prospectively. The adoption of this updated authoritative guidance resulted in an additional footnote disclosure but had no effect on our financial condition, results of operations or cash flows.
In March 2013, the FASB issued ASU No. 2013-05, “Foreign Currency Matters (Topic 830): Parent’s Accounting for the Cumulative Translation Adjustment upon De-recognition of Certain Subsidiaries or Groups of Assets within a Foreign Entity or of an Investment in a Foreign Entity”. This ASU amended guidance related to a parent company’s accounting for the release of the cumulative translation adjustment into net income upon de-recognition of certain subsidiaries or groups of assets within a foreign entity or of an investment in a foreign entity. This guidance became effective for the Company in fiscal year 2015, and is to be applied prospectively to de-recognition events occurring after the effective date. The adoption of this amendment did not have an impact on the Company's financial statements.
In July 2013, the FASB issued ASU No. 2013-11, "Presentation of an Unrecognized Tax Benefit When a Net Operating Loss Carryforward, a Similar Tax Loss, or Tax Credit Carryforward Exists". ASU 2013-11 provides guidance on financial statement presentation of an unrecognized tax benefit when a net operating loss carryforward, a similar tax loss or a tax credit carryforward exists. Under this guidance an unrecognized tax benefit, or a portion of an unrecognized tax benefit, should be presented in the financial statements as a reduction to a deferred tax asset for a net operating loss carryforward, a similar tax loss or a tax credit carryforward, except as follows. To the extent a net operating loss carryforward, a similar tax loss or a tax credit carryforward is not available at the reporting date under the tax law of the applicable jurisdiction to settle any additional income taxes that would result from the disallowance of a tax position or the tax law of the applicable jurisdiction does not
F-13
require the entity to use, and the entity does not intend to use, the deferred tax asset for such purpose, the unrecognized tax benefit should be presented in the financial statements as a liability and should not be combined with deferred tax assets. These amendments were effective for fiscal years, and interim periods within those years, beginning after December 15, 2013 (fiscal year 2015 for the Company). The adoption did not have an impact on the Company's consolidated financial statements.
Recent Accounting Pronouncements Not Yet Adopted as of September 30, 2015
In May 2014, the FASB issued ASU No. 2014-09, "Revenue from Contracts with Customers (Topic 606)." ASU 2014-09 provides guidance on revenue from contracts with customers, which implements a five step process of how an entity should recognize revenue in order to depict the transfer of promised goods or services to customers in an amount that reflects the consideration to which the entity expects to be entitled in exchange for those goods or services. This standard was initially released as effective for fiscal years beginning after December 15, 2016. In August 2015, the FASB issued ASU No. 2015-14 which defers the effective date of ASU 2014-09 by one year, with a new effective date for fiscal years beginning after December 15, 2017 (fiscal year 2019 for the Company). The new guidelines can be implemented using either of the following transition methods: (i) a full retrospective approach reflecting the application of the standard in each prior reporting period with the option to elect certain practical expedients, or (ii) a retrospective approach with the cumulative effect of initially adopting ASU 2014-09 recognized at the date of adoption. The Company is currently evaluating the impact of the new guidance on its consolidated financial statements and has not yet determined the method by which it will adopt the standard.
In August 2014, the FASB issued No. ASU 2014-15, "Presentation of Financial Statements - Going Concern (Subtopic 205-40): Disclosure of Uncertainties about an Entity’s Ability to Continue as a Going Concern". ASU 2014-15 requires management to assess an entity’s ability to continue as a going concern by incorporating and expanding upon certain principles that are currently in U.S. auditing standards. Specifically, ASU 2014-15 (1) provides a definition of the term substantial doubt, (2) requires an evaluation every reporting period including interim periods, (3) provides principles for considering the mitigating effect of management’s plans, (4) requires certain disclosures when substantial doubt is alleviated as a result of consideration of management’s plans, (5) requires an express statement and other disclosures when substantial doubt is not alleviated, and (6) requires an assessment for a period of one year after the date that the financial statements are issued (or are available to be issued). The standard will be effective for the first interim period within annual reporting periods beginning after December 15, 2016. Early application is permitted. This guidance will not have a material impact on our consolidated financial statements.
In April 2015, the FASB issued ASU No. 2015-05, "Customer's Accounting for Fees Paid in a Cloud Computing Arrangement". ASU 2015-05 provides guidance to customers about whether a cloud computing arrangement includes a software license. If the arrangement includes a software license, the customer should account for the software license element in a manner consistent with the acquisition of other software licenses. If the arrangement does not include a software license, the customer should account for the arrangement as a service contract. This guidance will be effective for annual periods, including interim periods within those annual periods, beginning after December 15, 2015 (fiscal year 2017 for the Company). The Company does not believe the pronouncement will have a material impact on the Company’s consolidated financial statements.
In April 2015, the FASB issued ASU No. 2015-03, “Simplifying the Presentation of Debt Issuance Costs”. This standard amends existing guidance to require the presentation of debt issuance cost in the balance sheet as a deduction from the carrying amount of the related debt liability instead of a deferred charge. It is effective for annual reporting periods beginning after December 15, 2015, but early adoption is permitted. The Company does not believe the pronouncement will have a material impact on the Company’s financial statements and will implement the pronouncement beginning in the period after December 15, 2015.
In July 2015, the FASB issued ASU No. 2015-11, "Simplifying the Measurement of Inventory". The new guidance does not apply to inventory that is measured using last-in, first-out or the retail inventory method. The guidance applies to all other inventory, which includes inventory that is measured using first-in, first-out or average cost and requires that inventory should be measured at the lower of cost and net realizable value. These amendments are effective for fiscal years beginning after December 15, 2016 (fiscal year 2018 for the Company). The Company is currently evaluating the impact of the new guidance on its consolidated financial statements.
Other accounting standards that have been issued by the FASB or other standards-setting bodies that do not require adoption until a future date are not expected to have a material impact on the Company's financial statements upon adoption.
F-14
2. FAIR VALUE MEASUREMENTS
Financial assets and liabilities, measured at fair value on a recurring basis, are classified on the valuation hierarchy in the table below:
September 30, 2015 | ||||||||||||||||
Total | Level 1 | Level 2 | Level 3 | |||||||||||||
Cash and cash equivalents | $ | 169,729 | $ | 169,729 | $ | — | $ | — | ||||||||
Short-term investments | 5,833 | 5,833 | — | — | ||||||||||||
Derivatives | (51 | ) | — | (51 | ) | — | ||||||||||
Other long-term assets | 550 | — | 550 | — | ||||||||||||
Total assets and liabilities at fair value | $ | 176,061 | $ | 175,562 | $ | 499 | $ | — | ||||||||
September 30, 2014 | ||||||||||||||||
Total | Level 1 | Level 2 | Level 3 | |||||||||||||
Cash and cash equivalents | $ | 128,537 | $ | 128,537 | $ | — | $ | — | ||||||||
Short-term investments | 13,121 | 13,121 | — | — | ||||||||||||
Derivatives | (92 | ) | — | (92 | ) | — | ||||||||||
Other long-term assets | 550 | — | 550 | — | ||||||||||||
Total assets and liabilities at fair value | $ | 142,116 | $ | 141,658 | $ | 458 | $ | — | ||||||||
The changes in the fair value measurement of investments using significant unobservable inputs (level 3), are as follows:
Fair Value Measurements Using Significant Unobservable Inputs (Level 3) | |||
September 30, 2013 | $ | 1,900 | |
Settlements | (1,900 | ) | |
September 30, 2014 | $ | — | |
All level 3 investments were auction rate securities which are variable rate securities tied to short-term interest rates with maturities on the face of the securities in excess of 90 days. All level 3 investments were settled at par value.
3. INVENTORIES
Inventories, net of obsolescence and lower of cost or market reserves, are summarized as follows:
September 30, | ||||||||
2015 | 2014 | |||||||
Finished goods | $ | 29,720 | $ | 31,625 | ||||
Work in progress | 38,602 | 41,057 | ||||||
Raw materials and supplies | 67,434 | 68,298 | ||||||
Demo inventory | 13,655 | 18,268 | ||||||
Service parts | 31,614 | 31,073 | ||||||
Total inventories | $ | 181,025 | $ | 190,321 | ||||
F-15
4. PROPERTY AND EQUIPMENT
Property and equipment include the following:
September 30, | ||||||||
2015 | 2014 | |||||||
Land and Buildings | $ | 63,302 | $ | 44,290 | ||||
Technical machinery and equipment | 63,764 | 67,241 | ||||||
Construction in progress | 1,461 | 2,064 | ||||||
Furniture and fixtures | 28,461 | 30,385 | ||||||
Computers and software | 8,022 | 8,777 | ||||||
Leasehold improvements | 26,818 | 27,989 | ||||||
Total property and equipment, at cost | $ | 191,828 | $ | 180,746 | ||||
5. GOODWILL AND OTHER INTANGIBLE ASSETS
The changes in the carrying amount of goodwill for the years ended September 30, 2015 and 2014, are as follows:
Germany | United States | Rest of World | Total | |||||||||||||
Balance as of September 30, 2013 | $ | 43,683 | $ | 13,297 | $ | 47,424 | $ | 104,404 | ||||||||
Additional goodwill from acquisitions | — | — | — | — | ||||||||||||
Currency exchange differences | (2,745 | ) | (206 | ) | (1,098 | ) | (4,049 | ) | ||||||||
Balance as of September 30, 2014 | $ | 40,938 | $ | 13,091 | $ | 46,326 | $ | 100,355 | ||||||||
Additional goodwill from acquisitions | — | — | — | — | ||||||||||||
Currency exchange differences | (4,326 | ) | (325 | ) | (2,163 | ) | (6,814 | ) | ||||||||
Balance as of September 30, 2015 | $ | 36,612 | $ | 12,766 | $ | 44,163 | $ | 93,541 | ||||||||
The carrying values of other intangible assets are as follows:
September 30, 2015 | September 30, 2014 | |||||||||||||||
Gross Carrying Amount | Accumulated Amortization | Gross Carrying Amount | Accumulated Amortization | |||||||||||||
Amortized intangible assets: | ||||||||||||||||
Patents | $ | 16,985 | $ | 9,151 | $ | 17,947 | $ | 8,721 | ||||||||
Customer base | 17,220 | 16,451 | 18,404 | 16,883 | ||||||||||||
Other | 23,527 | 17,363 | 22,101 | 17,136 | ||||||||||||
Total | $ | 57,732 | $ | 42,965 | $ | 58,452 | $ | 42,740 | ||||||||
Patents are amortized on a straight-line basis over the life of the patent which ranges from 1 to 20 years. Customer base is amortized on a straight-line basis over seven years. Other intangible assets, mainly comprised of software and unpatented technology, are amortized on a straight-line basis between 1 and 16 years. Amortization expense for the years ended September 30, 2015, 2014 and 2013, was $3,057, $2,906 and $2,553, respectively.
F-16
At September 30, 2015, estimated amortization expense of existing intangible assets for the next five fiscal years based on the average exchange rates as of September 30, 2015, is as follows:
Amortization Expense | ||||
2016 | $ | 2,700 | ||
2017 | 2,300 | |||
2018 | 1,900 | |||
2019 | 1,200 | |||
2020 | 1,000 | |||
6. ACCRUED LIABILITIES
Accrued liabilities are comprised of the following:
September 30, | ||||||||
2015 | 2014 | |||||||
Employee compensation | $ | 24,314 | $ | 21,822 | ||||
Warranty reserves | 10,913 | 10,778 | ||||||
Invoices to be received | 4,343 | 4,991 | ||||||
Customer deposits | 16,188 | 12,379 | ||||||
Other | 14,228 | 13,174 | ||||||
Total accrued liabilities | $ | 69,986 | $ | 63,144 | ||||
The Company provides for the estimated costs of product warranties when revenue is recognized. The estimate of costs to fulfill warranty obligations is based on historical experience and expectation of future conditions.
The change in warranty reserves for the years ended September 30, 2015 and 2014, are as follows:
Balance as of September 30, 2013 | $ | 12,301 | |
Additional accruals for warranties during the period | 5,105 | ||
Usage during the period | (6,074 | ) | |
Currency translation | (554 | ) | |
Balance as of September 30, 2014 | $ | 10,778 | |
Additional accruals for warranties during the period | 3,365 | ||
Usage during the period | (2,351 | ) | |
Currency translation | (879 | ) | |
Balance as of September 30, 2015 | $ | 10,913 | |
7. LINES OF CREDIT
The Company maintains $20,000 in short-term lines of credit in the U.S. As of September 30, 2015 and 2014, $20,000 remained unused and available for future use.
In addition, the Company’s non-U.S. subsidiaries have short-term credit lines amounting to $43,670, which allow them to borrow in the applicable local currency. At September 30, 2015 and 2014, direct borrowings under these agreements totaled $3,932 and $1,555, respectively. Additionally, $2,244 and $2,030 were used for bank guarantees under those lines of credit as of September 30, 2015 and 2014, respectively. The remaining unused portion of the lines of credit at September 30, 2015, was $37,494, in aggregate. Interest rates vary from 0.54% to 2.60%, depending upon the country and the usage made of the available credit.
F-17
Furthermore, the Company also maintains credit lines specific to bank guarantees amounting to $12,180 and $13,764 as of September 30, 2015 and 2014, respectively, of which $4,656 and $2,696 was used as of September 30, 2015 and 2014, respectively.
The Company is subject to financial covenants under some of these lines of credit, which could restrict the Company from drawing money under them.
8. LONG-TERM DEBT
Long-term debt included in the Consolidated Balance Sheets is comprised of the following:
September 30, | ||||||||
Description | 2015 | 2014 | ||||||
2.53% Term loan due 2015 | $ | — | $ | 758 | ||||
1.85% Term loan due 2018 | 2,561 | 3,157 | ||||||
1.7% Term loan due 2017 | 2,794 | 3,157 | ||||||
2.6% Term loan due 2016 | — | 3,139 | ||||||
1.0% State of Connecticut Term loan due 2023 | 2,850 | 3,000 | ||||||
1.3% Term loan due 2024 | 11,174 | — | ||||||
Total long-term debt facilities | 19,379 | 13,211 | ||||||
Current portion of long-term debt included in line of credit and short term borrowings | 1,294 | 1,700 | ||||||
Total long-term debt | $ | 18,085 | $ | 11,511 | ||||
Principal payments of long-term debt as of September 30, 2015, are as follows:
Fiscal year ending September 30, | Total | |||
2017 | $ | 5,489 | ||
2018 | 2,467 | |||
2019 | 1,771 | |||
2020 | 1,775 | |||
2021 and thereafter | 6,583 | |||
$ | 18,085 | |||
9. COMMITMENTS
The Company leases operating facilities and equipment under various operating leases. The lease agreements require payment of real estate taxes, insurance, and maintenance expenses by the Company.
Minimum lease payments for future fiscal years under non-cancellable operating leases as of September 30, 2015, are:
Fiscal year ending September 30, | Total | |||
2016 | $ | 8,675 | ||
2017 | 5,171 | |||
2018 | 2,446 | |||
2019 | 1,620 | |||
2020 | 1,308 | |||
2021 and thereafter | 2,721 | |||
Rent expense charged to operations for the years ended September 30, 2015, 2014 and 2013, approximated $10,728, $10,786 and $10,733, respectively.
F-18
Purchase obligations for payments due under various types of agreements to purchase raw materials, services and other goods as of September 30, 2015, are:
Less than 1 Year | $ | 76,548 | ||
1 - 3 Years | 10,930 | |||
3 - 5 Years | 148 | |||
More than 5 years | — | |||
10. INCOME TAXES
Significant components of the income tax provision are as follows:
Years ended September 30, | ||||||||||||
2015 | 2014 | 2013 | ||||||||||
Current: | ||||||||||||
United States - federal | $ | 3,533 | $ | 3,872 | $ | 3,985 | ||||||
United States - state | 458 | 478 | 408 | |||||||||
Foreign | 15,152 | 9,356 | 12,288 | |||||||||
Total current | 19,143 | 13,706 | 16,681 | |||||||||
Deferred: | ||||||||||||
United States - federal | (1,194 | ) | (1,139 | ) | (1,056 | ) | ||||||
United States - state | $ | (82 | ) | $ | (63 | ) | $ | (51 | ) | |||
Foreign | (2,120 | ) | (976 | ) | (1,435 | ) | ||||||
Total deferred | (3,396 | ) | (2,178 | ) | (2,542 | ) | ||||||
Total income tax expense | $ | 15,747 | $ | 11,528 | $ | 14,139 | ||||||
Income before income taxes is attributable to the following geographic regions:
Years ended September 30, | ||||||||||||
2015 | 2014 | 2013 | ||||||||||
United States | $ | 7,501 | $ | 5,383 | $ | 10,131 | ||||||
Foreign | 49,467 | 31,297 | 39,024 | |||||||||
Total income before income taxes | $ | 56,968 | $ | 36,680 | $ | 49,155 | ||||||
The difference between actual income tax expense and the amount computed by applying the U.S. federal income tax rate is as follows:
Years ended September 30, | ||||||||||||
2015 | 2014 | 2013 | ||||||||||
U.S. federal statutory tax rate | 35 | % | 35 | % | 35 | % | ||||||
Computed “expected” tax expense | $ | 19,939 | $ | 12,838 | $ | 17,154 | ||||||
Difference between U.S. and foreign statutory rates | (4,320 | ) | (3,087 | ) | (3,617 | ) | ||||||
Research & development credits | (806 | ) | (276 | ) | (935 | ) | ||||||
Adjustment of valuation allowance | (225 | ) | (401 | ) | (3 | ) | ||||||
Change in statutory tax rates | 2 | 774 | 37 | |||||||||
Stock-based compensation | 1,186 | 1,212 | 1,106 | |||||||||
Other | (29 | ) | 468 | 397 | ||||||||
Actual tax expense | $ | 15,747 | $ | 11,528 | $ | 14,139 | ||||||
Total income taxes for the years ended September 30, 2015, 2014 and 2013, were allocated as follows:
F-19
Years ended September 30, | ||||||||||||
2015 | 2014 | 2013 | ||||||||||
Income taxes from operations | $ | 15,747 | $ | 11,528 | $ | 14,139 | ||||||
Stockholders’ equity: | ||||||||||||
Tax benefit applicable to the exercise of stock options | — | (48 | ) | (2 | ) | |||||||
Tax (benefit) expense applicable to defined benefit pension plan | (309 | ) | (391 | ) | 619 | |||||||
Tax (benefit) expense applicable to the fair value of interest swap agreements | 11 | 15 | 25 | |||||||||
Total income tax | $ | 15,449 | $ | 11,104 | $ | 14,781 | ||||||
F-20
Deferred income taxes result from temporary differences between the amount of assets and liabilities recognized for financial reporting and tax purposes. The components of net deferred income taxes are as follows:
September 30, | ||||||||
2015 | 2014 | |||||||
Deferred income tax assets: | ||||||||
Foreign | ||||||||
Net operating loss carryforwards | $ | 5,122 | $ | 5,231 | ||||
Inventories | 6,912 | 5,809 | ||||||
Pension obligations | 2,676 | 2,984 | ||||||
Accounts payable | 85 | 105 | ||||||
Accounts receivable | — | 100 | ||||||
Other | 627 | 871 | ||||||
Total Foreign | 15,422 | 15,100 | ||||||
United States: | ||||||||
Net operating loss carryforwards | 6,425 | 6,970 | ||||||
Tax credits | 576 | 122 | ||||||
Warranty reserve | 858 | 918 | ||||||
Inventories | 8,121 | 7,312 | ||||||
Allowance for doubtful accounts | 297 | 272 | ||||||
Accrued liabilities | 783 | 911 | ||||||
Pension obligations | 2,109 | 1,476 | ||||||
Property & equipment | 278 | — | ||||||
Accounts receivables | 355 | 236 | ||||||
Stock-based compensation expense | 2,682 | 2,356 | ||||||
Other | 216 | 144 | ||||||
Total United States | 22,700 | 20,717 | ||||||
Gross deferred income tax assets | 38,122 | 35,817 | ||||||
Less: Valuation allowance | (2,463 | ) | (2,687 | ) | ||||
Net deferred income tax assets | $ | 35,659 | $ | 33,130 | ||||
Deferred income tax liabilities: | ||||||||
Foreign: | ||||||||
Property & equipment | (174 | ) | (400 | ) | ||||
Intangibles | (2,784 | ) | (2,800 | ) | ||||
Accounts receivable | (244 | ) | — | |||||
Other | (259 | ) | (1,084 | ) | ||||
Total Foreign | (3,461 | ) | (4,284 | ) | ||||
United States: | ||||||||
Other non-current assets | (70 | ) | — | |||||
Property & equipment | — | (2 | ) | |||||
Other intangibles | — | (158 | ) | |||||
Total United States | (70 | ) | (160 | ) | ||||
Gross deferred income tax liabilities | (3,531 | ) | (4,444 | ) | ||||
Net deferred income tax assets | $ | 32,128 | $ | 28,686 | ||||
F-21
The total deferred income tax assets (liabilities) are included in the accompanying consolidated balance sheet as follows:
September 30, | ||||||||
2015 | 2014 | |||||||
Deferred income tax assets – current | $ | 25,718 | $ | 23,536 | ||||
Deferred income tax assets – non-current | 15,528 | 16,890 | ||||||
Deferred income tax liabilities – current | (2,666 | ) | (4,437 | ) | ||||
Deferred income tax liabilities – non-current | (6,452 | ) | (7,303 | ) | ||||
Net deferred income tax assets | $ | 32,128 | $ | 28,686 | ||||
In assessing the realizability of deferred tax assets, management considers whether it is more likely than not that some portion or all of the deferred tax assets will not be realized. The ultimate realization of deferred tax assets is dependent upon the generation of future taxable income during the periods in which those temporary differences become deductible, as well as limitations imposed by the relevant taxing jurisdictions on the future benefits of those deductions. Management considers the scheduled reversal of deferred tax liabilities, projected future taxable income, the relevant statutory and regulatory limitations, and tax planning strategies in making this assessment. Based upon the level of historical taxable income and projections for future taxable income over the periods in which the deferred tax assets are deductible, management believes it is more likely than not that the Company will realize the benefits of these deductible differences.
At September 30, 2015, the Company had state net operating tax loss carryforwards available of $35,204 in the United States (which start to expire in 2022). Additionally, the Company had federal net operating tax loss carryforwards available of $11,087 in the United States, $9,122 in Germany and $11,492 in other European/Asian countries (which start to expire in 2017). As of September 30, 2015, deferred tax assets, net of valuation allowances related to these operating tax losses and tax credits, amounted to $9,206.
We have accumulated undistributed earnings of foreign subsidiaries aggregating approximately $430 million at September 30, 2015. These earnings are expected to be indefinitely reinvested outside of the United States. If those earnings were distributed in the form of dividends or otherwise, they would be subject to United States federal income taxes (subject to an adjustment for foreign tax credits), state income taxes and withholding taxes payable to the various foreign countries. It is not currently practicable to estimate the tax liability that might be payable on the repatriation of these foreign earnings.
The Company's policy is to recognize interest and penalties accrued on any unrecognized tax benefits as interest expense and SG&A, respectively. The Company classified the unrecognized tax benefit as non-current because payment is not anticipated within one year of the balance sheet date. As of September 30, 2015, the Company's gross unrecognized tax benefits totaled $239, which includes $5 of interest and penalties. Approximately $234 of unrecognized tax benefits would impact the effective tax rate, if recognized. The Company estimates that the unrecognized tax benefits will not change significantly within the next year.
A reconciliation of the beginning and ending amount of gross unrecognized tax benefits, excluding the related accrual for interest, is as follows:
Balance at September 30, 2012 | $ | 392 | |
Decreases in tax positions for prior years | — | ||
Increases in tax positions for current years | 48 | ||
Settlements with taxing authorities | — | ||
Balance at September 30, 2013 | $ | 440 | |
Decreases in tax positions for prior years | (69 | ) | |
Increases in tax positions for current years | 194 | ||
Settlements with taxing authorities | — | ||
Balance at September 30, 2014 | $ | 565 | |
Decreases in tax positions for prior years | (185 | ) | |
Increases in tax positions for current years | — | ||
Settlements with taxing authorities | (146 | ) | |
Balance at September 30, 2015 | $ | 234 | |
F-22
The Company files federal and state income tax returns in several domestic and foreign jurisdictions. In most tax jurisdictions, returns are subject to examination by the relevant tax authorities for a number of years after the returns have been filed. With limited exceptions, the Company is no longer subject to examination by the United States Internal Revenue Service for years through 2009. With respect to state and local tax jurisdictions and countries outside the United States, with limited exceptions, the Company is no longer subject to income tax audits for years before 2009.
11. EMPLOYEE BENEFIT PLANS
The Company has defined benefit pension plans for the RSL and RS Inc. employees. The Company’s U.S. plan began in fiscal year 1995 and is funded. Any new employees hired after January 1, 2007, are not eligible for the RS Inc. pension plan. As is the normal practice with German companies, the German pension plan is unfunded. Any new employees, hired after the acquisition of RBL in 2000, are not eligible for the RSL pension plan. The measurement date of the Company’s pension plans is September 30.
Effective January 1, 2012, the RS Inc. defined benefit pension plan was amended to exclude highly compensated employees, as defined by the Internal Revenue Service, from receiving future years of service under the RS Inc. pension plan. A non-qualified defined benefit pension plan was created to replace the benefits lost by the employees that were otherwise excluded from the qualified pension plan.
The determination of the Company’s obligation and expense for pension is dependent on the selection of certain actuarial assumptions in calculating those amounts. Assumptions are made about interest rates, expected investment return on plan assets, total turnover rates, and rates of future compensation increases. In addition, the Company’s actuarial consultants use subjective factors such as withdrawal rates and mortality rates to develop their calculations of these amounts. The Company generally reviews these assumptions at the beginning of each fiscal year. The Company is required to consider current market conditions, including changes in interest rates, in making these assumptions. The actuarial assumptions that the Company uses may differ materially from actual results due to changing market and economic conditions, higher or lower withdrawal rates or longer or shorter life spans of participants. These differences may result in a significant impact on the amount of pension benefits expense the Company has recorded or may record.
Another key assumption in determining the net pension expense is the assumed discount rate to be used to discount plan obligations. The Company's U.S. plan uses a cash flow matching approach, which uses projected cash flows matched to spot rates along a high-quality corporate yield curve to determine the present value of cash flows to calculate a single equivalent discount rate. A lower discount rate increases the present value of benefit obligations and increases pension expense.
To determine the expected long-term rate of return on plan assets, the Company considers the current and expected asset allocations, as well as historical and expected returns on various categories of plan assets.
F-23
The following table sets forth the funded status of the plans at the balance sheet dates:
September 30, | ||||||||||||
2015 | 2014 | |||||||||||
Change in benefit obligation: | ||||||||||||
Projected benefit obligation at beginning of year | $ | 36,441 | $ | 34,261 | ||||||||
Service cost | 928 | 943 | ||||||||||
Interest cost | 1,062 | 1,282 | ||||||||||
Actuarial losses (gains) | 259 | 1,673 | ||||||||||
Foreign exchange rate impacts | (1,898 | ) | (1,128 | ) | ||||||||
Benefits paid – total | (804 | ) | (590 | ) | ||||||||
Projected benefit obligation at end of year | 35,988 | 36,441 | ||||||||||
Projected benefit obligation at end of year: | ||||||||||||
U.S. plans | 15,810 | 14,275 | ||||||||||
Foreign plans | 20,178 | 22,166 | ||||||||||
Projected benefit obligation at end of year | 35,988 | 36,441 | ||||||||||
Change in plan assets: | ||||||||||||
Fair value of plan assets at beginning of year | 10,276 | 9,803 | ||||||||||
Actual return on plan assets | (163 | ) | 732 | |||||||||
Employer contributions | 422 | — | ||||||||||
Benefits paid – funded plans | (440 | ) | (259 | ) | ||||||||
Fair value of plan assets at end of year | 10,095 | 10,276 | ||||||||||
Fair value of plan assets at end of year: | ||||||||||||
U.S. plans | 10,095 | 10,276 | ||||||||||
Foreign plans | — | — | ||||||||||
Fair value of plan assets at end of year | 10,095 | 10,276 | ||||||||||
Funded status at end of year | $ | (25,893 | ) | * | $ | (26,165 | ) | * | ||||
Amounts recognized in the consolidated balance sheet | ||||||||
Accrued benefit liability | $ | (25,893 | ) | $ | (26,165 | ) | ||
Accumulated other comprehensive loss (pre-tax) | 9,911 | 9,257 | ||||||
Net amount recognized | $ | (15,982 | ) | $ | (16,908 | ) | ||
*$454 and $473 relate to expected payments in the following twelve months for the Company’s unfunded non-US plans and are therefore classified in current “Accrued liabilities” in the consolidated balance sheets as of September 30, 2015 and 2014, respectively.
The following table sets forth information for pension plans with an accumulated benefit obligation in excess of plan assets:
September 30, | ||||||||
2015 | 2014 | |||||||
Projected benefit obligation | $ | 35,988 | $ | 36,441 | ||||
Accumulated benefit obligation | 33,383 | 33,716 | ||||||
Fair value of plan assets | 10,095 | 10,276 | ||||||
F-24
The components of net periodic benefit cost and other changes recognized in other comprehensive income:
September 30, | ||||||||
2015 | 2014 | |||||||
Net periodic benefit cost | ||||||||
Service Cost | $ | 928 | $ | 943 | ||||
Interest Cost | 1,062 | 1,282 | ||||||
Expected return on plan assets | (700 | ) | (667 | ) | ||||
Amortization of net loss | 405 | 341 | ||||||
Amortization of prior service cost | 75 | 75 | ||||||
Effect of settlement | (13 | ) | — | |||||
Net periodic benefit cost | $ | 1,757 | $ | 1,974 | ||||
Other changes recognized in other comprehensive income | ||||||||
Net loss (gain) | 730 | 1,268 | ||||||
Amortization of prior service cost | (75 | ) | (75 | ) | ||||
Total recognized in other comprehensive income | $ | 655 | $ | 1,193 | ||||
Total recognized in net periodic benefit cost and other comprehensive income | $ | 2,412 | $ | 3,167 | ||||
The weighted average assumptions used in the valuation of the plan are as follows:
September 30, | ||||||
2015 | 2014 | |||||
Discount rate to determine benefit obligations: | ||||||
United States | 4.33 | % | 4.22 | % | ||
Foreign | 2.42 | % | 2.40 | % | ||
Discount rate to determine net periodic benefit cost: | ||||||
United States | 4.22 | % | 4.66 | % | ||
Foreign | 2.40 | % | 3.50 | % | ||
Expected return on plan assets | ||||||
United States | 7.00 | % | 7.00 | % | ||
Foreign | — | % | — | % | ||
Rate of compensation increase | ||||||
United States | 3.0 | % | 3.0 | % | ||
Foreign | 3.0 | % | 3.0 | % | ||
The Company recognizes the over (under) funded status of the defined benefit plans in the statement of financial position. The Company also recognizes, in other comprehensive income, certain gains and losses that arise during the period but are deferred under current pension accounting rules. A one percent change in the discount rate or the rate of return on plan assets would have a de minimis impact on the projected benefit obligation and the net periodic benefit cost.
Expected benefit payments for each of the next five fiscal years and for the five years aggregated thereafter is as follows: $873 in 2016, $888 in 2017, $1,369 in 2018, $1,085 in 2019, $1,162 in 2020 and $8,356 thereafter.
The Company’s pension plan asset allocations at September 30, 2015 and 2014, by asset category are as follows:
2015 | 2014 | ||||||||
Target Allocation | Percentage | Percentage | |||||||
Equity Securities | 50 | % | 49 | % | 51 | % | |||
Debt Securities | 50 | % | 51 | % | 49 | % | |||
Total Plan Assets | 100 | % | 100 | % | 100 | % | |||
F-25
The Company employs a total return investment approach whereby a mix of equity, debt securities and government securities are used to maximize the long-term return of plan assets for a prudent level of risk. The intent of this strategy is to minimize plan expenses by maximizing investment returns within that prudent level of risk. Furthermore, equity investments are diversified across U.S. and non-U.S. stocks as well as growth, value and small and large capitalizations. Additionally, cash balances are maintained at levels adequate to meet near-term plan expenses and benefit payments. Investment risk is measured and monitored on an ongoing basis through semi-annual investment portfolio reviews.
Investments in our defined benefit plan are stated at fair value. Level 1 assets are valued using quoted market prices that represent the asset value of the shares held by the trusts. The level 2 assets are investments in pooled funds, which are valued using a model to reflect the valuation of their underlying assets that are publicly traded with observable values. The fair value of our level 3 pension plan assets are measured by compiling the portfolio holdings and independently valuing the securities in those portfolios.
The fair values of our pension plan assets, by level within the fair value hierarchy, are as follows:
September 30, 2015 | ||||||||||||||||
Asset Categories | Level 1 | Level 2 | Level 3 | Total | ||||||||||||
Equity Securities | ||||||||||||||||
Small Cap | $ | — | $ | 217 | $ | — | $ | 217 | ||||||||
Mid Cap | — | 474 | — | 474 | ||||||||||||
Large Cap | — | 1,770 | — | 1,770 | ||||||||||||
Total Market Stock | — | 808 | — | 808 | ||||||||||||
International | — | 1,444 | — | 1,444 | ||||||||||||
Emerging Markets | — | 230 | — | 230 | ||||||||||||
Debt Securities | ||||||||||||||||
Bonds & Mortgages | — | 4,082 | — | 4,082 | ||||||||||||
Inflation Protected | — | 520 | — | 520 | ||||||||||||
High Yield | — | 510 | — | 510 | ||||||||||||
Money Market | — | 40 | — | 40 | ||||||||||||
Total Plan Assets | $ | — | $ | 10,095 | $ | — | $ | 10,095 | ||||||||
September 30, 2014 | ||||||||||||||||
Asset Categories | Level 1 | Level 2 | Level 3 | Total | ||||||||||||
Equity Securities | ||||||||||||||||
Small Cap | $ | — | $ | 209 | $ | — | $ | 209 | ||||||||
Mid Cap | — | 494 | — | 494 | ||||||||||||
Large Cap | — | 1,853 | — | 1,853 | ||||||||||||
Total Market Stock | — | 867 | — | 867 | ||||||||||||
International | — | 1,441 | — | 1,441 | ||||||||||||
Emerging Markets | — | 344 | — | 344 | ||||||||||||
Debt Securities | ||||||||||||||||
Bonds & Mortgages | — | 3,866 | — | 3,866 | ||||||||||||
Inflation Protected | — | 519 | — | 519 | ||||||||||||
High Yield | — | 514 | — | 514 | ||||||||||||
Money Market | — | 169 | — | 169 | ||||||||||||
Total Plan Assets | $ | — | $ | 10,276 | $ | — | $ | 10,276 | ||||||||
RS Inc., RB Inc., PRC, Lee Laser, ROFIN-BAASEL Canada Ltd., DILAS Diode Laser, Inc. and Nufern have 401(k) plans for the benefit of all eligible U.S. employees, as defined by the plan. Participating employees may contribute up to 16% of their qualified annual compensation. Those subsidiaries match 50% of the first 5 to 6% of the employees’ compensation contributed as a salary deferral. Company contributions for the years ended September 30, 2015, 2014 and 2013, were $736, $701 and $719, respectively.
F-26
12. EARNINGS PER COMMON SHARE
The calculation of the weighted average number of common shares outstanding for each period is as follows:
Years ended September 30, | |||||||||
2015 | 2014 | 2013 | |||||||
Weighted number of shares for basic earnings per common share | 28,127,733 | 28,073,081 | 28,188,849 | ||||||
Potential additional shares due to outstanding dilutive stock options | 143,211 | 149,110 | 202,913 | ||||||
Weighted number of shares for diluted earnings per common share | 28,270,944 | 28,222,191 | 28,391,762 | ||||||
The weighted-average diluted shares outstanding for the years ended September 30, 2015, 2014 and 2013, excludes the dilutive effect of approximately 2,414 thousand, 2,927 thousand and 2,557 thousand stock options, respectively, since the impact of including these options in diluted earnings per share for these years was antidilutive.
13. ACCUMULATED OTHER COMPREHENSIVE INCOME (LOSS)
Accumulated other comprehensive income is comprised of the following:
September 30, | ||||||||||||
2015 | 2014 | 2013 | ||||||||||
Foreign currency translation adjustment | $ | (50,896 | ) | $ | (7,759 | ) | $ | 17,091 | ||||
Defined benefit pension plans (net of taxes of $3,315 in 2015, $3,006 in 2014 and $2,615 in 2013) | (6,597 | ) | (6,251 | ) | (5,449 | ) | ||||||
Fair value of interest swap agreements (net of taxes of $7 in 2015, $18 in 2014 and $33 in 2013) | (24 | ) | (62 | ) | (109 | ) | ||||||
Total accumulated other comprehensive income (loss) | $ | (57,517 | ) | $ | (14,072 | ) | $ | 11,533 | ||||
The changes in Accumulated Other Comprehensive Income by component, net of tax, during the years ended September 30, 2015 and 2014, are as follows:
Defined Benefit Plans | Foreign Currency Translation Adjustments | Fair Value of Interest Swap Agreements | Total | |||||||||||||
Balance at September 30, 2014 | $ | (6,251 | ) | $ | (7,759 | ) | $ | (62 | ) | $ | (14,072 | ) | ||||
Other comprehensive income before reclassifications | — | (43,137 | ) | 38 | (43,099 | ) | ||||||||||
Amounts reclassified from accumulated other comprehensive income | (346 | ) | — | — | (346 | ) | ||||||||||
Balance at September 30, 2015 | $ | (6,597 | ) | $ | (50,896 | ) | $ | (24 | ) | $ | (57,517 | ) | ||||
Defined Benefit Plans | Foreign Currency Translation Adjustments | Fair Value of Interest Swap Agreements | Total | |||||||||||||
Balance at September 30, 2013 | $ | (5,449 | ) | $ | 17,091 | $ | (109 | ) | $ | 11,533 | ||||||
Other comprehensive income before reclassifications | — | (24,850 | ) | 47 | (24,803 | ) | ||||||||||
Amounts reclassified from accumulated other comprehensive income | (802 | ) | — | — | (802 | ) | ||||||||||
Balance at September 30, 2014 | $ | (6,251 | ) | $ | (7,759 | ) | $ | (62 | ) | $ | (14,072 | ) | ||||
F-27
F-28
The reclassifications out of Accumulated Other Comprehensive Income for the years ended September 30, 2015 and 2014, are as follows:
September 30, 2015 | September 30, 2014 | |||||||
Unamortized loss on defined benefit pension plans | ||||||||
Amortization | $ | (655 | ) | $ | (1,193 | ) | ||
Tax effects | 309 | 391 | ||||||
Total reclassification for the period | $ | (346 | ) | $ | (802 | ) | ||
14. TREASURY STOCK
On February 5, 2014, the Board of Directors authorized the Company to initiate a share buyback of up to $25 million of the Company’s Common Stock over the next twelve months ending February 10, 2015, subject to market conditions. The shares were to be repurchased from time to time in open market transactions or privately negotiated transactions at the Company’s discretion. During the year ended September 30, 2015, the Company did not repurchase any shares of common stock.
15. RELATED PARTY TRANSACTIONS
The Company had sales to its former minority shareholder in Japan amounting to $4, and $458, only in fiscal years 2014 and 2013, respectively, and purchases from the former minority shareholder only in fiscal year 2013 amounting to $29. As of September 30, 2013, the accounts receivable with the minority shareholder in Japan amounted to $5. Effective December 20, 2013, the Company acquired the remaining 12% of the common stock of ROFIN-BAASEL Japan Corp. from the minority shareholder in Japan.
The Company maintains other accounts payable to a related party in China amounting to $299 and $317 and as of September 30, 2015 and 2014, respectively. Effective December 23, 2014, the Company acquired an additional 8.8% of the common stock of NELC. The Company currently holds 88.8% of the share capital of NELC.
In fiscal year 2014, the Company had expenses of $57 mainly for purchases of materials and services, from the former minority shareholder of m2k. Effective November 18, 2013, the Company purchased the remaining 10% of the share capital of m2k through its wholly-owned subsidiary RSL under the option agreement between the Company and the minority shareholders of m2k.
Effective June 12, 2014, the Company acquired the remaining 5% of the common stock of DILAS through its wholly-owned subsidiary RSTE from the minority shareholder of DILAS.
The main facility in Starnberg is rented under a 25-year operating lease from the former minority shareholder of RBL, Mr. Baasel, who is also a member of the Board of Directors of the Company. That lease will terminate by end of December 2016. The Company paid expenses, mainly for rental expense of $735, $883 and $846 to Mr. Baasel during fiscal years 2015, 2014 and 2013, respectively.
F-28
16. GEOGRAPHIC INFORMATION
Assets, revenues and income before taxes, by geographic region attributed based on the geographic location of the RSTI entities are summarized below:
ASSETS | September 30, | |||||||
2015 | 2014 | |||||||
North America | $ | 258,424 | $ | 246,370 | ||||
Germany | 433,435 | 430,123 | ||||||
Other | 343,072 | 347,992 | ||||||
Intercompany eliminations | (328,440 | ) | (335,900 | ) | ||||
Total assets | $ | 706,491 | $ | 688,585 | ||||
PROPERTY AND EQUIPMENT, NET | September 30, | |||||||
2015 | 2014 | |||||||
North America | $ | 16,128 | $ | 16,319 | ||||
Germany | 51,124 | 41,828 | ||||||
Other | 25,560 | 21,822 | ||||||
Intercompany eliminations | (239 | ) | (266 | ) | ||||
Total long-lived assets | $ | 92,573 | $ | 79,703 | ||||
REVENUES - TOTAL BUSINESS | Years ended September 30, | |||||||||||
2015 | 2014 | 2013 | ||||||||||
North America | $ | 151,835 | $ | 146,053 | $ | 157,936 | ||||||
Germany | 320,557 | 330,485 | 358,701 | |||||||||
Other | 274,431 | 276,832 | 262,197 | |||||||||
Intercompany eliminations | (227,180 | ) | (223,253 | ) | (218,766 | ) | ||||||
$ | 519,643 | $ | 530,117 | $ | 560,068 | |||||||
INTERCOMPANY REVENUES | Years ended September 30, | |||||||||||
2015 | 2014 | 2013 | ||||||||||
North America | $ | 14,191 | $ | 12,602 | $ | 13,859 | ||||||
Germany | 159,601 | 148,441 | 147,470 | |||||||||
Other | 53,388 | 62,210 | 57,437 | |||||||||
Intercompany eliminations | (227,180 | ) | (223,253 | ) | (218,766 | ) | ||||||
$ | — | $ | — | $ | — | |||||||
EXTERNAL REVENUES | Years ended September 30, | |||||||||||
2015 | 2014 | 2013 | ||||||||||
North America | $ | 137,643 | $ | 133,450 | $ | 144,078 | ||||||
Germany | 160,957 | 182,045 | 211,231 | |||||||||
Other | 221,043 | 214,622 | 204,759 | |||||||||
$ | 519,643 | $ | 530,117 | $ | 560,068 | |||||||
INCOME BEFORE INCOME TAXES | Years ended September 30, | |||||||||||
2015 | 2014 | 2013 | ||||||||||
North America | $ | 7,809 | $ | 5,490 | $ | 10,275 | ||||||
Germany | 22,780 | 5,000 | 19,215 | |||||||||
Other | 26,379 | 26,190 | 19,665 | |||||||||
$ | 56,968 | $ | 36,680 | $ | 49,155 | |||||||
17. ENTERPRISE WIDE INFORMATION
The Company derives revenues from the sale and servicing of laser products used for macro applications, from the sale and servicing of laser products for marking and micro applications, and from the sale of components products.
Product and service sales are summarized below:
September 30, | ||||||||||||
Product Category | 2015 | 2014 | 2013 | |||||||||
Laser macro products | $ | 200,358 | $ | 209,632 | $ | 214,623 | ||||||
Laser marking and micro products | 243,096 | 250,228 | 272,632 | |||||||||
Components | 76,189 | 70,257 | 72,813 | |||||||||
$ | 519,643 | $ | 530,117 | $ | 560,068 | |||||||
18. SELECTED QUARTERLY FINANCIAL DATA (Unaudited)
The following represents the Company’s quarterly results (millions of dollars, except per share amounts):
Quarters ended | ||||||||||||||||
Dec. 31, 2014 | March 31, 2015 | June 30, 2015 | Sept. 30, 2015 | |||||||||||||
Net sales | $ | 122.4 | $ | 122.7 | $ | 132.5 | $ | 142.0 | ||||||||
Gross profit | 42.6 | 45.4 | 52.3 | 56.2 | ||||||||||||
Net income | 6.2 | 8.7 | 11.5 | 14.8 | ||||||||||||
Net income attributable to RSTI | 6.2 | 8.7 | 11.6 | 14.8 | ||||||||||||
Earnings per share – Basic | 0.22 | 0.31 | 0.41 | 0.53 | ||||||||||||
Earnings per share – Diluted | 0.22 | 0.31 | 0.41 | 0.52 | ||||||||||||
Quarters ended | ||||||||||||||||
Dec. 31, 2013 | March 31, 2014 | June 30, 2014 | Sept. 30, 2014 | |||||||||||||
Net sales | $ | 121.2 | $ | 128.6 | $ | 134.3 | $ | 146.1 | ||||||||
Gross profit | 41.3 | 46.3 | 46.7 | 54.6 | ||||||||||||
Net income | 2.3 | 4.5 | 6.4 | 12.0 | ||||||||||||
Net income attributable to RSTI | 2.2 | 4.5 | 6.5 | 12.0 | ||||||||||||
Earnings per share – Basic | 0.08 | 0.16 | 0.23 | 0.43 | ||||||||||||
Earnings per share – Diluted | 0.08 | 0.16 | 0.23 | 0.43 | ||||||||||||
19. STOCK INCENTIVE PLANS
The Company maintains a 2007 Incentive Stock Plan, whereby incentive and non-qualified stock options, restricted stock and performance shares may be granted to officers and other key employees to purchase a specified number of common stock at a price not less than the fair market value on the date of grant. The term of the 2007 Incentive Stock Plan continues through 2017. Effective March 12, 2015, the stockholders approved the Rofin-Sinar Technologies Inc. 2015 Incentive Stock Plan to reserve an additional 1,800,000 shares of common stock. There were no incentive stock options, restricted stock or performance shares granted in fiscal years 2015 or 2014 under either plan. Non-qualified stock options were granted to officers and other key employees in fiscal years 2015 and 2014 under the 2007 Incentive Stock Plan. During fiscal year 2015, outside directors each received 3,000 shares of common stock, which were fully vested upon grant. Officers and other key employees received 361,750 shares of non-qualified stock options that vest over five years and will expire not later than ten years after the date on which they were granted.
F-29
The fair value of our stock options was estimated based on the date of grant using the Black-Scholes option pricing model. The following assumptions were used in these calculations:
September 30, | ||||||||||||
2015 Grants | 2014 Grants | 2013 Grants | ||||||||||
Weighted average grant date fair value | $ | 8.55 | $ | 11.72 | $ | 12.42 | ||||||
Expected life | 5.46 Years | 5.40 Years | 5 Years | |||||||||
Volatility | 37.57 | % | 50.55 | % | 49.64 | % | ||||||
Risk-free interest rate | 1.74 | % | 1.48 | % | 0.98 | % | ||||||
Dividend yield | — | % | — | % | — | % | ||||||
For purposes of the Black-Scholes model, the Company uses historical data to estimate the expected life, volatility, and estimated forfeitures of an option. The risk-free interest rate is based on the U.S. Treasury yield curve in effect at the time of grant.
The balance of outstanding stock options and all options activity for the year ended September 30, 2015, is as follows:
Number of Shares | Weighted Average Exercise Price | Weighted Average Remaining Contractual Term (Years) | Aggregate Intrinsic Value (Millions) | ||||||||||||
Outstanding at September 30, 2014 | 3,357,050 | $ | 27 | 1/10 | |||||||||||
Granted | 361,750 | $ | 23 | 0 | |||||||||||
Exercised | (251,196 | ) | $ | 17 | 6/8 | ||||||||||
Forfeited | (129,504 | ) | $ | 26 | 4/5 | ||||||||||
Outstanding at September 30, 2015 | 3,338,100 | $ | 27 | 2/5 | 4.63 | $ | 4.0 | ||||||||
Exercisable at September 30, 2015 | 2,357,600 | $ | 28 | 1/10 | 3.24 | $ | 2.8 | ||||||||
Years ended September 30, | ||||||||||||
2015 | 2014 | 2013 | ||||||||||
Fair value of shares vested during the year | $ | 3,966 | $ | 3,686 | $ | 4,035 | ||||||
Total intrinsic value of stock options exercised | $ | 1,233 | $ | 1,151 | $ | 2,932 | ||||||
Cash received from stock option exercises | $ | 2,109 | $ | 2,389 | $ | 2,901 | ||||||
As of September 30, 2015, there was $8,614 of total unrecognized compensation cost related to stock options. These costs are expected to be recognized over a weighted average period of 2.88 years.
20. SUBSEQUENT EVENT
On November 11, 2015, the Board of Directors authorized the Company to initiate another share buyback of up to $50 million of the Company's Common Stock over the next eighteen months. The Company expects the purchases to be made from time to time in the open market or in privately negotiated transactions at the Company’s discretion.
F-30
SCHEDULE II
ROFIN-SINAR TECHNOLOGIES INC. AND SUBSIDIARIES
Valuation and Qualifying Accounts - Allowance for Doubtful Accounts
Years ended September 30, 2015, 2014 and 2013
(dollars in thousands)
Balance at Beginning of Period | Additions - Charged to Costs and Expenses | (Deductions) | Balance at End of Period | |||||||||||||
September 30, 2013 | $ | 3,915 | $ | 156 | $ | (648 | ) | $ | 3,423 | |||||||
September 30, 2014 | $ | 3,423 | $ | 889 | $ | (974 | ) | $ | 3,338 | |||||||
September 30, 2015 | $ | 3,338 | $ | 534 | $ | (593 | ) | $ | 3,279 | |||||||
Allowance for Inventory Reserve
Years ended September 30, 2015, 2014 and 2013
(dollars in thousands)
Balance at Beginning of Period | Additions | Usage for Disposals and Scrap | Balance at End of Period | |||||||||||||
September 30, 2013 | $ | 27,157 | $ | 8,890 | $ | (7,455 | ) | $ | 28,592 | |||||||
September 30, 2014 | $ | 28,592 | $ | 7,133 | $ | (5,751 | ) | $ | 29,974 | |||||||
September 30, 2015 | $ | 29,974 | $ | 3,972 | $ | (4,837 | ) | $ | 29,109 | |||||||
F-31
INDEX TO EXHIBITS
Exhibit No. | Exhibit | ||
3.1 | Certificate of Incorporation of the Company and Form of Certificate of Amendment thereto (Incorporated by reference to the exhibits filed with the Company’s Registration Statement on Form S-1 (File No. 333-09539) which was declared effective on September 25, 1996) | ||
3.2 | By-Laws of the Company, As Amended Through November 29, 2011 (Incorporated by reference to the exhibit filed with the Company’s Annual Report on Form 10-K filed with the Securities and Exchange Commission on November 29, 2011) | ||
10.1 | Inheritable Building Right (Erbbaurecht), dated as of March 1, 1990, between ROFIN-SINAR Laser GmbH and Lohss GmbH (in German, English summary provided) (Incorporated by reference to the exhibits filed with the Company’s Registration Statement on Form S-1 (File No. 333-09539) which was declared effective on September 25, 1996) | ||
10.2 | Lease Agreement, dated August 10, 1990, between Josef and Maria Kranz and ROFIN-SINAR Laser GmbH (in German, English summary provided) (Incorporated by reference to the exhibits filed with the Company’s Registration Statement on Form S-1 (File No. 333-09539) which was declared effective on September 25, 1996) | ||
10.3 | Lease Agreement, dated March 25, 1993, between DR Group and ROFIN-SINAR, Incorporated (Concept Drive property) (Incorporated by reference to the exhibits filed with the Company’s Registration Statement on Form S-1 (File No. 333-09539) which was declared effective on September 25, 1996) | ||
10.4 | ROFIN-SINAR Laser GmbH Pension Plan (in German, English summary provided) (Incorporated by reference to the exhibits filed with the Company’s Registration Statement on Form S-1 (File No. 333-09539) which was declared effective on September 25, 1996) (a) | ||
10.5 | Deutsche Bank AG Commitment Letter dated August 22, 1996 (Incorporated by reference to the exhibits filed with the Company’s Registration Statement on Form S-1 (File No. 333-09539) which was declared effective on September 25, 1996) | ||
10.6 | U.S. and German Separation Agreements, dated as of June 4, 2015, among Gunther Braun, ROFIN-SINAR Laser GmbH, and ROFIN-SINAR Technologies Inc. (in German, English summary provided) (Incorporated by reference to the exhibits filed with the Company’s Current Report on Form 8-K filed with the Securities and Exchange Commission on June 5, 2015) (a) | ||
10.7 | Lease Agreement between Carl Baasel and ROFIN-SINAR Laser GmbH (Incorporated by reference to the exhibit filed with the Company’s Current Report on Form 8-K filed with the Securities and Exchange Commission on May 24, 2000) | ||
10.8 | 2002 Equity Incentive Plan (Incorporated by reference to the exhibit filed with the Company’s Annual Report on Form 10-K filed with the Securities and Exchange Commission on December 23, 2003) (a) | ||
10.9 | 2007 Incentive Stock Plan (Incorporated by reference to the exhibit filed with the Company’s Proxy Statement on Schedule 14A filed with the Securities and Exchange Commission on January 25, 2007, and as amended by the Company's Current Report on Form 8-K filed with the Securities and Exchange Commission on March 2, 2011) (a) | ||
10.10 | 2015 Incentive Stock Plan (Incorporated by reference to the exhibit filed with the Company’s Proxy Statement on Schedule 14A filed with the Securities and Exchange Commission on March 12, 2015) (a) | ||
10.11 | Form of Non-Qualified Stock Option Agreement (Incorporated by reference in the exhibits filed with the Company's Registration Statement on Form S-8 filed with the Securities and Exchange Commission on June 26, 2015) (a) | ||
10.12 | Form of Incentive Stock Option Agreement (Incorporated by reference in the exhibits filed with the Company's Registration Statement on Form S-8 filed with the Securities and Exchange Commission on June 26, 2015) (a) | ||
10.13 | Form of Employment Agreement, dated July 1, 2015, among Thomas Merk and ROFIN-SINAR Laser GmbH, and ROFIN-SINAR Technologies, Inc. (a) (*) | ||
10.14 | Form of Employment Agreement, dated as of September 2, 1996, among Thomas Merk, CBL Verwaltungsgellschaft mbH, and ROFIN-SINAR Laser GmbH (in German, English summary provided) (a) (*) | ||
14.1 | Code of Business Ethics (Incorporated by reference to the exhibit filed with the Company’s Proxy Statement on Schedule 14A filed with the Securities and Exchange Commission on January 30, 2004) | ||
21.1 | List of Subsidiaries of the Registrant | ||
23.1 | Consent of Deloitte & Touche LLP Independent Registered Public Accounting Firm | ||
F-32
31.1 | Rule 13a-14(a)/15d-14(a) Certification of Chief Executive Officer | ||
31.2 | Rule 13a-14(a)/15d-14(a) Certification of Chief Financial Officer | ||
32.1 | Section 1350 Certification of Chief Executive Officer | ||
32.2 | Section 1356 Certification of Chief Financial Officer | ||
101.INS | XBRL Instance Document (*) | ||
101.SCH | XBRL Taxonomy Extension Schema Document (*) | ||
101.CAL | XBRL Taxonomy Extension Calculation Linkbase Document (*) | ||
101.DEF | XBRL Taxonomy Extension Definition Linkbase Document (*) | ||
101.LAB | XBRL Taxonomy Extension Label Linkbase Document (*) | ||
101.PRE | XBRL Taxonomy Extension Presentation Linkbase Document (*) | ||
(a) | Management contracts and compensatory plans and arrangements required to be filed as exhibits pursuant to Item 15(c) of this Report. | ||
(*) | These exhibits are filed with the SEC only | ||
F-33