Attached files
| file | filename |
|---|---|
| 8-K - 8-K - HomeTrust Bancshares, Inc. | htbi-20151130x8k.htm |

ANNUAL MEETING NOVEMBER 30, 2015

Forward-Looking Statements This presentation includes “forward-looking statements” within the meaning of the Private Securities Litigation Reform Act of 1995. Such statements often include words such as “believe,” “expect,” “anticipate,” “estimate,” and “intend” or future or conditional verbs such as “will,” “would,” “should,” “could,” or “may.” Forward-looking statements are not historical facts but instead represent management’s current expectations and forecasts regarding future events many of which are inherently uncertain and outside of our control. Actual results may differ, possibly materially from those currently expected or projected in these forward-looking statements. Factors that could cause our actual results to differ materially from those described in the forward-looking statements, include expected cost savings, synergies and other financial benefits from the recent acquisitions might not be realized within the expected time frames or at all, and costs or difficulties relating to integration matters might be greater than expected; increased competitive pressures; changes in the interest rate environment; changes in general economic conditions and conditions within the securities markets; legislative and regulatory changes; and other factors described in HomeTrust’s latest annual Report on Form 10-K and Quarterly Reports on Form 10-Q and other filings with the Securities and Exchange Commission-which are available on our website at www.hometrustbanking.com and on the SEC’s website at www.sec.gov. Any of the forward-looking statements that we make in this presentation or our SEC filings are based upon management’s beliefs and assumptions at the time they are made and may turn out to be wrong because of inaccurate assumptions we might make, because of the factors illustrated above or because of other factors that we cannot foresee. We do not undertake and specifically disclaim any obligation to revise any forward-looking statements to reflect the occurrence of anticipated or unanticipated events or circumstances after the date of such statements. These risks could cause our actual results for fiscal 2016 and beyond to differ materially from those expressed in any forward-looking statements by, or on behalf of, us and could negatively affect our operating and stock performance. 2

HomeTrust Bancshares, Inc. Overview Headquarters: Asheville, NC Exchange/Ticker: NASDAQ: HTBI Founded: 1926 Number of Employees: 499 Locations: 39 (NC,SC,VA,TN) Stock Price: $19.97(2) Total Assets: $2.7 billion Price to TBV: 109% Total Loans: $1.7 billion Market Cap: $372.6 million(2) Total Deposits: $1.8 billion Average Daily Volume: 77,893 (2) Outstanding Shares: 18,656,221(1) Shares Repurchased (2) (since conversion on July 11, 2012) 4,672,249 or approx. 22% Financial data as of 9/30/15 (1) Shares outstanding as of 11/3/15 (2) Market data as of 11/24/15 3

Strategic Operating Committee Leader Role Age Yrs in Banking Yrs w/HTBI Dana Stonestreet Chairman, President & Chief Executive Officer 62 37 26 Tony VunCannon Executive Vice President & Chief Financial Officer 50 27 23 Hunter Westbrook Executive Vice President & Chief Banking Officer 52 28 4 Howard Sellinger Executive Vice President & Chief Information Officer 62 40 40 Keith Houghton Executive Vice President & Chief Credit Officer 53 26 2 Teresa White Executive Vice President & Chief Administration Officer 58 10 (29 in HR) 5 Parrish Little Executive Vice President & Chief Risk Officer 48 25 1 Kathy Redmond Senior Vice President & Director of Retail Banking 61 43 6 236 107 4

Foundation For Growth • Converted to stock in July 2012 and raised $211.6 million • Added 5 larger growing markets in NC, SC, VA and East TN • Expanded our market population from 900,000 to 5.6 million • Added 25 new locations, $1 billion in assets, and 200 new team members • Consolidated six branches within our geographic footprint in October 2015 • Enhanced the Commercial Credit Department to support growth in commercial lending • Acquired/Hired 25 Commercial Relationship Managers 5
Foundation For Growth (cont.) • Grew core deposits by over $700 million or 123% • Moved loan/deposit ratio from 104% to 96% • Successfully executed on four system conversions related to our acquisitions • Added indirect auto lending as a line of business • Expanded our treasury management products and services • Positioned the mortgage line of business for expansion in our new markets • Converted our thrift charter to a commercial bank charter in August 2014 • United 7 names to one brand – HomeTrust Bank in October 2014 • Grown to the 5th largest community bank headquartered in NC 6

New Markets to Drive Organic Growth Date Closed Description Assets (millions) Locations Purchase Price (million) Price to TBV Cash / Stock Conversion Date July 31, 2013 BankGreenville $101 2 - Greenville, SC $8.7 92% Cash Nov 11, 2013 May 31,2014 Jefferson Bancshares, Inc. $489 12 - East Tennessee $51.2 99% Cash- 50% Stock- 50% Aug 25, 2014 July 21, 2014 Roanoke Loan Production Office N/A 1 - Roanoke, VA N/A N/A N/A N/A July 31, 2014 Bank of Commerce $123 1 - Midtown Charlotte, NC $10.0 112% Cash Feb 16, 2015 Nov. 12, 2014 Raleigh Loan Production N/A 1 - Raleigh, NC N/A N/A N/A N/A Nov. 17, 2014 Bank of America - 10 Branches $328 6 - Roanoke, VA 3 - Southwest VA 1 - Eden , NC 2.86% Premium = $8.8 N/A Cash Nov 17, 2014 Total Assets $1,041 Total Purchase Price $78.7 Cash (67%) $53.1 Stock (33%) $26.5 7

Growth Since Conversion Mutual/Stock Conversion Actual 09/30/2012 09/30/2015 $ % Total Assets $ 1,603 $ 2,726 $ 1,123 70% Total Loan Portfolio $ 1,203 $ 1,742 $ 539 45% 1-4 Family 611 646 35 6% HELOC’s & Other Consumer 195 311 116 59% Indirect Auto - 71 71 100% Commercial Real Estate 232 453 221 95% Commercial Constr. & Development 38 72 34 89% Other Commercial 127 189 62 49% Total Deposit Portfolio $ 1,160 $ 1,820 660 57% Checking Accounts 239 583 344 144% Money Market/Savings 337 700 363 108% Time Deposits 584 537 (47) -8% Loan/Deposits 104% 96% - (9%) Locations 20 39 19 95% Employees 315 499 184 58% Conversion Change Since 8

Loan Portfolio Composition Loans: At Time of Conversion (1) Loans: 9/30/15 With Recent Acquisitions (1) Financial data as of 9/30/12 51% 16% 19% 3% 11% 1-4 Family ($611MM) HELOCs & Other Consumer ($195MM) Commercial Real Estate ($232MM) Commercial Construction & Development ($38MM) Other Commercial ($127MM) 37% 22% 26% 4% 11% 1-4 Family ($646MM) HELOCs & Other Consumer ($382MM) Commercial Real Estate ($453MM) Commercial Construction & Development ($72MM) Other Commercial ($189MM) Commercial 33% Commercial 41% 9

Deposit Portfolio Composition Deposits: At Time of Conversion (1) Deposits: 9/30/15 With Recent Acquisitions (1) Financial data as of 9/30/12 29% 39% 32% Time Deposits ($537MM) MMDA / Savings ($700MM) Checking Accounts ($583MM) 50% 29% 21% Time Deposits ($584MM) MMDA / Savings ($337MM) Checking Accounts (239MM) Core Deposits 71%Core Deposits 50% 10

Expanded Footprint for Growth 11

Market Demographics Markets Population 6 Original NC Markets at Conversion 890,851 New Markets Since Conversion Charlotte, NC/Mecklenburg County 990,104 Raleigh, NC/Wake County 978,065 Greenville, SC/MSA 855,961 Knoxville, TN/MSA 855,322 Tri-Cities, TN/MSA 511,491 Roanoke, VA/MSA 313,033 Other 231,072 9 Total New Markets 4,735,048 15 Grand Total 5,625,899 150% % Increase 532% 12

Stock Buy Backs (Dollars in thousands, except per share amounts) Source: Company documents previously filed with the SEC Percent Purchased Shares Total Cost Avg Cost / Share 1st Buy Back (completed 4/29/13) 4% 846,400 13,299$ 15.71$ 2nd Buy Back (completed 12/2/13) 5% 1,041,245 17,055$ 16.38$ 3rd Buy Back (completed 11/18/14) 5% 989,183 15,589$ 15.76$ 4th Buy Back (completed 8/5/15) 5% 1,023,266 16,312$ 15.94$ 5th Buy Back (approved on 6/29/15) 5% 772,155 14,251$ 18.46$ Total 24% 4,672,249 76,506$ 16.37$ Remaining Shares to be purchased through 5th Buy Back 199,116 4,871,365 13
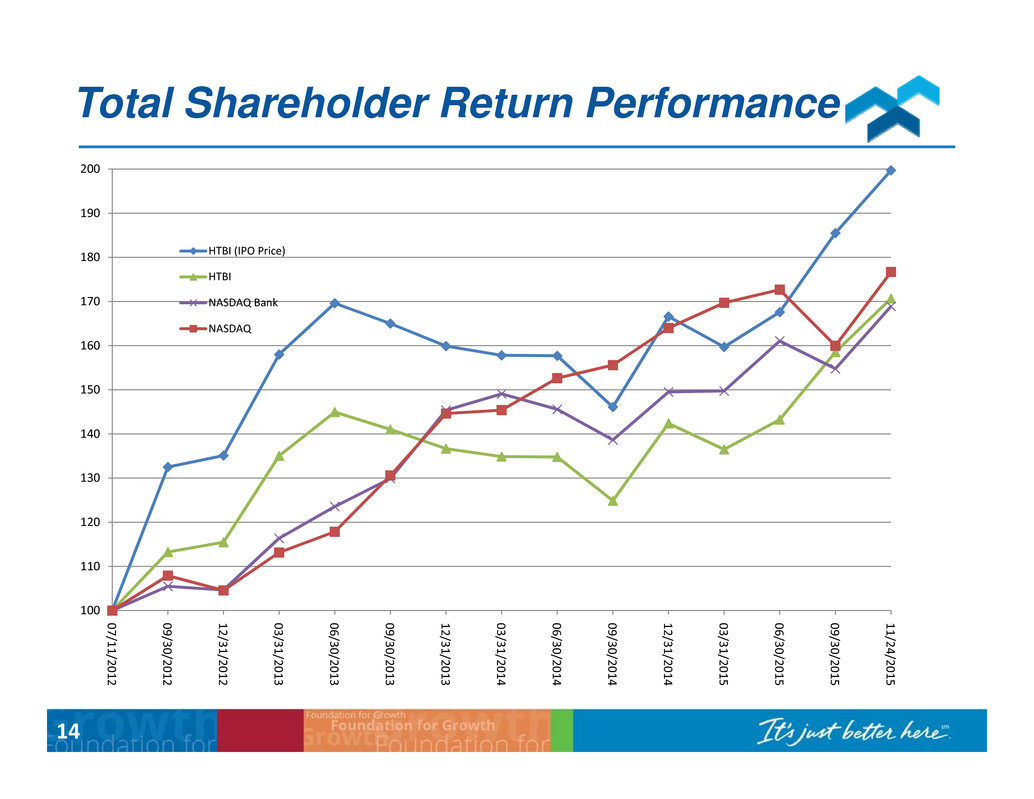
Total Shareholder Return Performance 14 100 110 120 130 140 150 160 170 180 190 200 07/11/2012 09/30/2012 12/31/2012 03/31/2013 06/30/2013 09/30/2013 12/31/2013 03/31/2014 06/30/2014 09/30/2014 12/31/2014 03/31/2015 06/30/2015 09/30/2015 11/24/2015 HTBI (IPO Price) HTBI NASDAQ Bank NASDAQ

FINANCIAL INFORMATION TONY VUNCANNON EVP/CHIEF FINANCIAL OFFICER 15
Current FHLB Leveraging Strategy • Borrowed $446 million (1) of short-term advances from the FHLB • Borrowings increased FHLB stock requirements by $20 million to take advantage of high dividend rate (4.56% for 3rd quarter 2015) • Invested remaining $426 million in short-term interest earning deposits (CD’s in other banks, commercial paper, and deposits with the Federal Reserve Bank) at a positive spread • Increase net interest income by $1.2 - $1.7 million annually • Negative impact on net interest margin (65 basis point decrease for the quarter ended September 30, 2015 compared to adjusted net interest margin excluding leveraging strategy) • Will continue to impact net interest margin and ROA in fiscal 2016 (1) As of September 30, 2015 16

Fiscal Year Ended June 30, 2015 Highlights (Dollars in thousands, except per share amounts) Source: July 27, 2015 earnings release. As Reported 06/30/2015 06/30/2014 Amount Percent Net income 8,025$ 10,342$ (2,317)$ (22%) ROA 0.32% 0.62% (0.30%) (48%) EPS 0.42$ 0.54$ (0.12)$ (22%) Net Interest Margin (tax equivalent) 3.64% 3.79% (0.15%) (4%) Organic Loan Growth: $ Growth 37,354$ (36,627)$ 73,981$ (202%) % Growth 2.50% (3.10%) 5.60% 181% Core Bank Earnings (1) Net income 11,784$ 8,256$ 3,528$ 43% ROA 0.47% 0.49% (0.02%) (4%) EPS 0.62$ 0.44$ 0.18$ 41% Net Interest Margin (tax equivalent) 3.98% 3.79% 0.19% 5% Year Ended Change (1) Core Bank Earnings excludes merger-related expenses, provision for/(recovery of) loan losses, and nonrecurring impairment charges. Merger-related expenses totaled $5.4 million and $2.7 million for the years ended June 30, 2015 and 2014, respectively. Provision for/(recovery of) loan losses totaled $150,000 and ($6.3 million) for the years ended June 30, 2015 and 2014, respectively. Impairment charge related to branch consolidation was $375,000 for the year ended June 30, 2015. Net interest margin excludes the FHLB leveraging strategy as described earlier. 17

Quarter Ended September 30, 2015 Highlights (Dollars in thousands, except per share amounts) Source: October 29, 2015 earnings release. As Reported 09/30/2015 09/30/2014 Amount Percent Net income 2,564$ 1,533$ 1,031$ 67% ROA 0.37% 0.35% 0.02% 6% EPS 0.14$ 0.08$ 0.06$ 75% Net Interest Margin (tax equivalent) 3.37% 3.99% (0.62%) (16%) Organic Loan Growth: $ Growth 26,457$ 25,477$ 980$ N/M % Growth (annualized) 6.30% 6.80% (0.50%) N/M Core Bank Earnings (1) Net income 3,090$ 3,015$ 75$ 2% ROA 0.45% 0.56% (0.11%) (20%) EPS 0.17$ 0.16$ 0.01$ 6% Net Interest Margin (tax equivalent) 4.02% 3.99% 0.03% 1% Quarter Ended Change (1) Core Bank Earnings excludes merger-related expenses, recovery of loan losses, and nonrecurring state tax expense. Merger-related expenses totaled $0 and $1.4 million for the three months ended September 30, 2015 and 2014, respectively. Recovery of loan losses totaled $0 and $250,000 for the three months ended September 30, 2015 and 2014, respectively. Nonrecurring state tax expense was $526,000 for the three months ended September 30, 2015. Net interest margin excludes the FHLB leveraging strategy as described earlier. 18
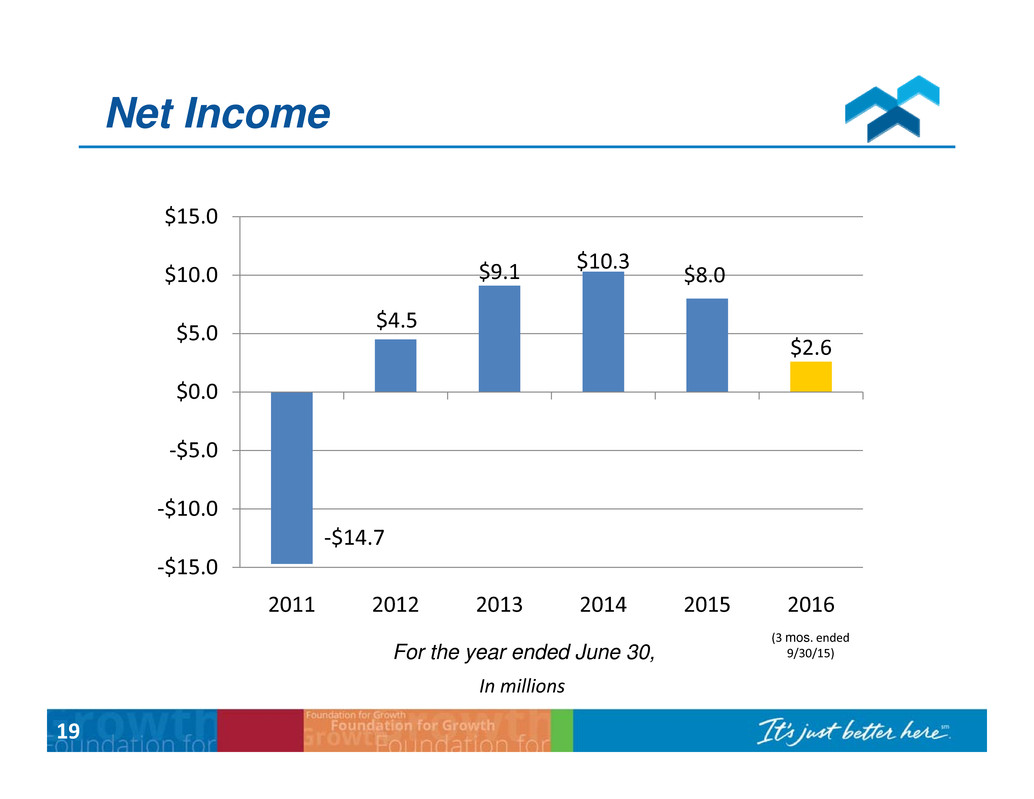
Net Income ‐$14.7 $4.5 $9.1 $10.3 $8.0 $2.6 ‐$15.0 ‐$10.0 ‐$5.0 $0.0 $5.0 $10.0 $15.0 2011 2012 2013 2014 2015 2016 For the year ended June 30, In millions (3 mos. ended 9/30/15) 19

Net Interest Income For the year ended June 30, In millions $51.6 $55.7 $53.1 $54.8 $79.8 $82.3 $0.0 $10.0 $20.0 $30.0 $40.0 $50.0 $60.0 $70.0 $80.0 $90.0 $100.0 2011 2012 2013 2014 2015 2016 3 mos. ended 9/30/15, Annualized in yellow 20

*Excludes the effect of FHLB leveraging strategy Net Interest Margin For the year ended June 30, In millions 3.52% 4.02% 3.81% 3.79% 3.98% * 4.02% * 0.0% 0.5% 1.0% 1.5% 2.0% 2.5% 3.0% 3.5% 4.0% 4.5% 5.0% 2011 2012 2013 2014 2015 2016 3 mos. ended 9/30/15 21

Loan Portfolio Mix As of June 30, In millions $1,331 $1,232 $1,166 $1,498 $1,686 $1,742 $0.0 $200.0 $400.0 $600.0 $800.0 $1,000.0 $1,200.0 $1,400.0 $1,600.0 $1,800.0 $2,000.0 2011 2012 2013 2014 2015 9/30/15 1‐4 Family Commercial Real Estate Construction/ Land/ Development Home Equity Municipal Leases Indirect Auto Other 22
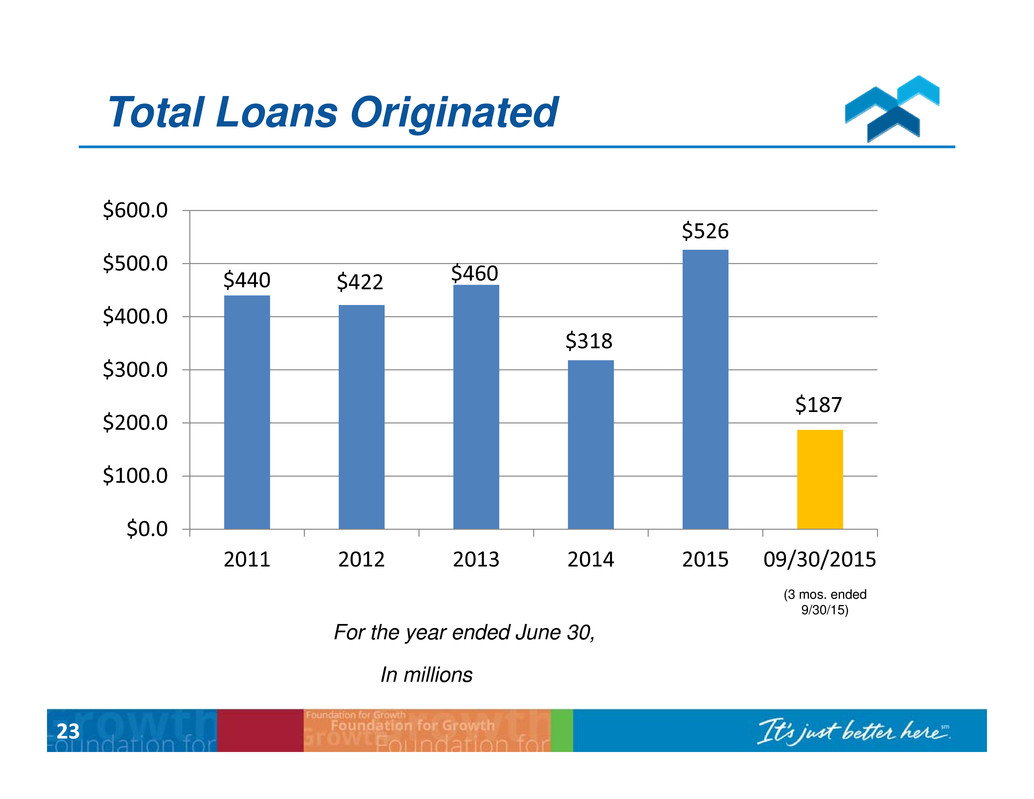
Total Loans Originated (3 mos. ended 9/30/15) For the year ended June 30, In millions $440 $422 $460 $318 $526 $187 $0.0 $100.0 $200.0 $300.0 $400.0 $500.0 $600.0 2011 2012 2013 2014 2015 09/30/2015 23

Total Deposits 58% 51% 47% 40% 31% 29% 42% 49% 53% 60% 69% 71% $0 $250 $500 $750 $1,000 $1,250 $1,500 $1,750 $2,000 2011 2012* 2013 2014 2015 09/30/2015 Time Deposits Core Deposits (checking, savings, money market) $1,820 $1,155$1,239$1,265 $1,583 $1,872 *Excludes $227 million in stock conversion escrow account 24 As of June 30, In millions

Checking Accounts As of June 30, In millions $204 $231 $256 $419 $591 $583 $0 $100 $200 $300 $400 $500 $600 $700 2011 2012 2013 2014 2015 09/30/2015 25

Capital Ratios 5.00% 6.00% 6.50% 10.00% 11.93% 15.33% 15.33% 16.40% 0.00% 3.00% 6.00% 9.00% 12.00% 15.00% 18.00% Leverage Ratio Tier I Risk‐Based Capital Ratio Common Equity Tier I Total Risk‐Based Capital Ratio "Well‐Capitalized" as defined by Bank regulations HTBI As of September 30, 2015 26
ASSET QUALITY 27
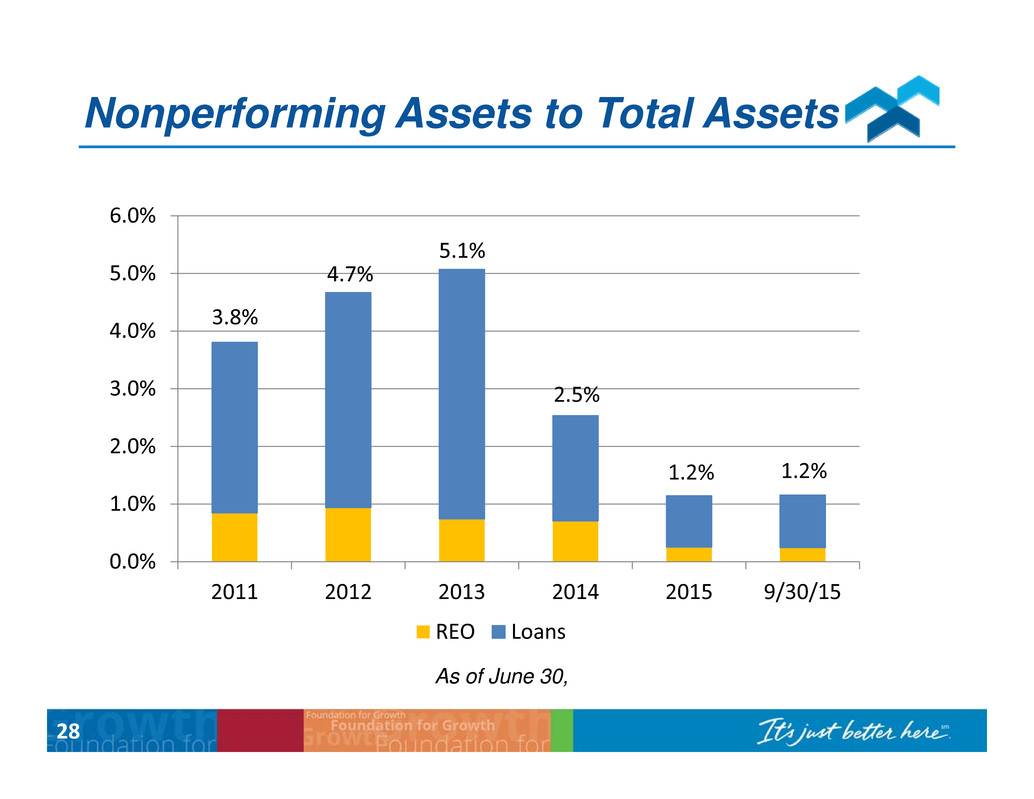
Nonperforming Assets to Total Assets 1.2% 3.8% 2.5% 5.1% 0.0% 1.0% 2.0% 3.0% 4.0% 5.0% 6.0% 2011 2012 2013 2014 2015 9/30/15 REO Loans 4.7% 1.2% As of June 30, 28

Nonperforming Loans by Type As of June 30, $48.5 $64.2 $68.6 $37.9 $24.9 $24.9 $0.0 $10.0 $20.0 $30.0 $40.0 $50.0 $60.0 $70.0 $80.0 2011 2012 2013 2014 2015 9/30/15 1‐4 Family Commercial Real Estate Construction/land/ development Home Equity Other In millions 29

Net Loans Charged-off For the year ended June 30, In millions $34.4 $30.6 $4.1 $2.3 $1.2 $0.3 $0.0 $5.0 $10.0 $15.0 $20.0 $25.0 $30.0 $35.0 $40.0 2011 2012 2013 2014 2015 1‐4 Family Commercial Real Estate Construction/Land/ Development Home Equity Other 2016 30 (3 mos. ended 9/30/15)

Provision for (Recovery of )Loan Losses For the year ended June 30, (3 mos. ended 9/30/15) $42.8 $15.6 $1.1 ‐$6.3 $0.2 $0.0 ‐$10.0 $0.0 $10.0 $20.0 $30.0 $40.0 $50.0 2011 2012 2013 2014 2015 2016 In millions 31

Allowance for Loan Losses to Total Non-acquired Loans In millions 3.77% 2.85% 2.75% 2.05% 1.58% 1.52% 0.00% 0.50% 1.00% 1.50% 2.00% 2.50% 3.00% 3.50% 4.00% 2011 2012 2013 2014 2015 9/30/15 As of June 30, 32

2014-2015 LINE OF BUSINESS ACCOMPLISHMENTS HUNTER WESTBROOK, EVP/CHIEF BANKING OFFICER 33

Talent Added For Growth Roanoke Loan Production Team Market President Jul 2014 Commercial Relationship Manager Jul 2014 Sr. Commercial Credit Manager Jul 2014 Treasury Management Sales Officer Jul 2014 Raleigh Loan Production Team Market President Nov 2014 Customer Relationship Managers (3) Nov 2014 Charlotte Market President Jan 2015 Customer Relationship Managers (2) Mar 2015 Others Senior Commercial Credit Manager Feb 2014 Chief Credit Officer Mar 2014 Auto Finance Portfolio Manager Nov 2014 Chief Risk Officer Mar 2015 Asheville Business Development Officer May 2015 Director of Treasury Management Jun 2015 Consumer Lending Executive Jun 2015 Director of Mortgage Lending Jul 2015 34

Bank of America Branch Purchase Impact • Younger Customer Demographics • Growth in deposit accounts of 60% • Growth in low cost core deposits • Debit card growth of 170% • Internet banking growth of 110% • 5 Branch locations in Roanoke, VA to complement new Commercial LPO 35

• HomeTrust Bank’s recent acquisitions have shifted the consumer customer mix, with significant increases in Gen X and Gen Y (Millennials) households. • Baby Boomers continue to comprise the largest segment of consumer households at the Bank – 33.86%. • Younger consumers use mobile/online channels more often than traditional retail branches. Household Mix Shifting Toward Younger Segments 36

Loan Production for Fiscal 2015 Source: July 27, 2015 earnings release and other internal Company documents 89,299 74,353 46,728 49,689 53,010 3,113 68,242 73,501 30,030 49,455 9,598 3,294 0 10,000 20,000 30,000 40,000 50,000 60,000 70,000 80,000 90,000 100,000 1‐4 Family 1‐4 Brokered HELOC Const&land dev Indirect auto Consumer Retail Loan Originations FY 2015 ($316.2 MM) FY 2014 ($234.1 MM) 112,349 47,955 34,583 15,282 35,773 13,389 18,960 15,814 0 20,000 40,000 60,000 80,000 100,000 120,000 Com RE C&D C&I Municipal Leases Commercial Loan Originations FY 2015 ($210.2 MM) FY 2014 ($83.9 MM) (Dollars in thousands) Retail Commercial Total Total Loans FY 2015 316,192$ 210,169$ 526,361$ Total Loans FY 2014 234,120$ 83,936$ 318,056$ $ Change 82,072$ 126,233$ 208,305$ % Change 35.1% 150.4% 65.5% 37

Loan Production for Quarter Ended September 30, 2015 Source: October 29. 2015 earnings release and other internal Company documents 22,436 26,536 9,923 9,632 23,706 1,379 19,279 16,776 8,150 18,036 7,632 1,419 0 5,000 10,000 15,000 20,000 25,000 30,000 1‐4 Family 1‐4 Brokered HELOC Const&land dev Indirect auto Consumer Retail Loan Originations 09/30/2015 09/30/2014 34,046 50,691 8,808 4,002 28,997 3,388 14,368 4,314 0 10,000 20,000 30,000 40,000 50,000 60,000 Com RE C&D C&I Municipal Leases Commercial Loan Originations Qtr ended 9/30/15 Qtr ended 9/30/14 (Dollars in thousands) Retail Commercial Total Total Originations Qtr ended 9/30/15 89,637$ 97,547$ 187,184$ Total Originations Qtr ended 9/30/14 71,291$ 51,067$ 122,358$ $ Change 18,346$ 46,480$ 64,826$ % Change 25.7% 91.0% 53.0% 38

Retail/Consumer Line of Business • Unified seven banking divisions under HomeTrust name – September 2014 • Consolidated six branches in October 2015 – savings of $1.2 million annually • New customer generation • Consumer loan production by retail personnel 39

Commercial Line of Business • Relationship Managers from 6 to 25 • Legacy HTB – 4 • Via Acquisition – 7 • Lift Out of Banking Teams – 6 • Hired – 8 • Hired experienced commercial lending teams in new markets (Roanoke, Raleigh) 40

• Began in December 2014 • 54 auto dealerships in Western NC and Upstate SC • Average FICO score of 740 • 56% new vehicles; 44% used vehicles • Originations of $7-$8 million monthly • Total portfolio of $70.6 million at September 30, 2015 • 90% of the loans are new households to HTB Indirect Auto Line of Business 41

REPOSITIONED TO CREATE SHAREHOLDER VALUE DANA STONESTREET, CHAIRMAN/PRESIDENT/CEO 42

Transition To High Performing Community Bank Phase I: Create Foundation For Growth • Lines of Business – Infrastructure and Talent • Markets To Grow In Phase II: Execute with a Sense of Urgency • Sound and Profitable Organic Growth • Loan portfolio - Goal of 8-10% annualized growth • Core deposits • Non-interest income • Revenue growth to outpace expense growth • Increase ROA, ROE, and EPS through organic growth • Increase tangible book value per share (TBV/share) • Lower our efficiency ratio • Continue buying back undervalued shares • Create value for shareholders 43

Celebrating Leadership and Service Thank you Tommy Flynt and Bob Shepherd! HomeTrust Board Members Retiring Today 44

Thank You Shareholders and HomeTrust Team! 45

Questions and Comments • In accordance with the Rules of Conduct, each shareholder or proxyholder has an opportunity to ask questions or make comments. • After you are recognized, proceed to the microphone. Please identify yourself by stating your name and whether you are a stockholder or hold the proxy for a shareholder. • Questions and/or comments are limited to two minutes per shareholder. • Please direct all questions and comments to the Chairman/President/Chief Executive Officer. 46

ANNUAL MEETING NOVEMBER 30, 2015
