Attached files
| file | filename |
|---|---|
| 8-K - 8-K - Chemours Co | d33367d8k.htm |
The Chemours Company Investor Presentation December 2015 Exhibit 99.1
This presentation contains forward-looking statements, which often may be identified by their use of words like “plans,” “expects,” “will,” “believes,” “intends,” “estimates,” “anticipates” or other words of similar meaning. These forward-looking statements address, among other things, our anticipated future operating and financial performance, business plans and prospects, transformation plans, resolution of environmental liabilities, litigation and other contingencies, plans to increase profitability, our ability to pay or the amount of any dividend, and target leverage that are subject to substantial risks and uncertainties that could cause actual results to differ materially from those expressed or implied by such statements. Forward-looking statements are not guarantees of future performance and are based on certain assumptions and expectations of future events which may not be realized. The matters discussed in these forward-looking statements are subject to risks, uncertainties and other factors that could cause actual results to differ materially from those projected, anticipated or implied in the forward-looking statements as further described in the “Risk Factors” section of the information statement contained in the registration statement on Form 10 and other filings made by Chemours with the Securities and Exchange Commission. Chemours undertakes no duty to update any forward-looking statements. This presentation contains certain supplemental measures of performance that are not required by, or presented in accordance with, generally accepted accounting principles in the United States (“GAAP”). These Non-GAAP measures include Adjusted Net Income (Loss), Adjusted EPS and Adjusted EBITDA, which should not be considered as replacements of GAAP. Further information with respect to and reconciliations of such measures to the nearest GAAP measure can be found in the appendix hereto. Management uses Adjusted Net Income (Loss), Adjusted EPS and Adjusted EBITDA to evaluate the Company’s performance excluding the impact of certain non-cash charges and other special items in order to have comparable financial results to analyze changes in our underlying business from quarter to quarter. Historical results prior to July 1, 2015 are presented on a stand-alone basis from DuPont historical results and are subject to certain adjustments and assumptions as indicated in this presentation, and may not be an indicator of future performance. Additional information for investors is available on the company’s website at investors.chemours.com. Safe Harbor Statement
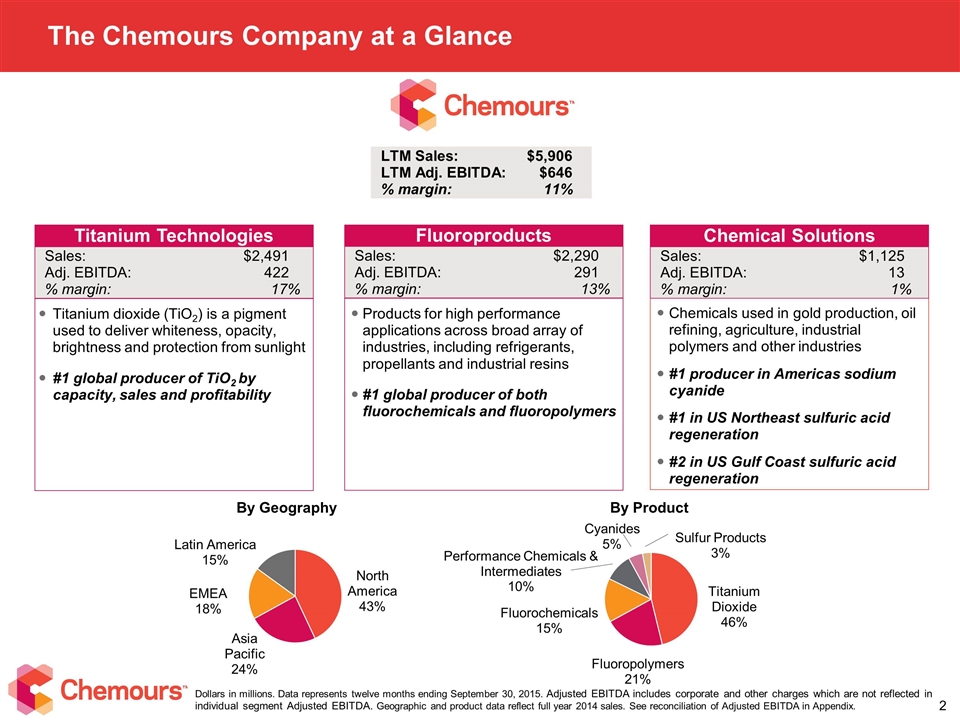
The Chemours Company at a Glance Chemicals used in gold production, oil refining, agriculture, industrial polymers and other industries #1 producer in Americas sodium cyanide #1 in US Northeast sulfuric acid regeneration #2 in US Gulf Coast sulfuric acid regeneration LTM Sales:$5,906 LTM Adj. EBITDA:$646 % margin:11% Titanium Technologies Sales:$2,491 Adj. EBITDA:422 % margin: 17% Fluoroproducts Sales:$2,290 Adj. EBITDA:291 % margin: 13% Chemical Solutions Sales:$1,125 Adj. EBITDA:13 % margin: 1% By Geography By Product Dollars in millions. Data represents twelve months ending September 30, 2015. Adjusted EBITDA includes corporate and other charges which are not reflected in individual segment Adjusted EBITDA. Geographic and product data reflect full year 2014 sales. See reconciliation of Adjusted EBITDA in Appendix. Titanium dioxide (TiO2) is a pigment used to deliver whiteness, opacity, brightness and protection from sunlight #1 global producer of TiO2 by capacity, sales and profitability Products for high performance applications across broad array of industries, including refrigerants, propellants and industrial resins #1 global producer of both fluorochemicals and fluoropolymers Latin America15% Performance Chemicals & Intermediates10% Fluorochemicals15% Sulfur Products3% Fluoropolymers21%
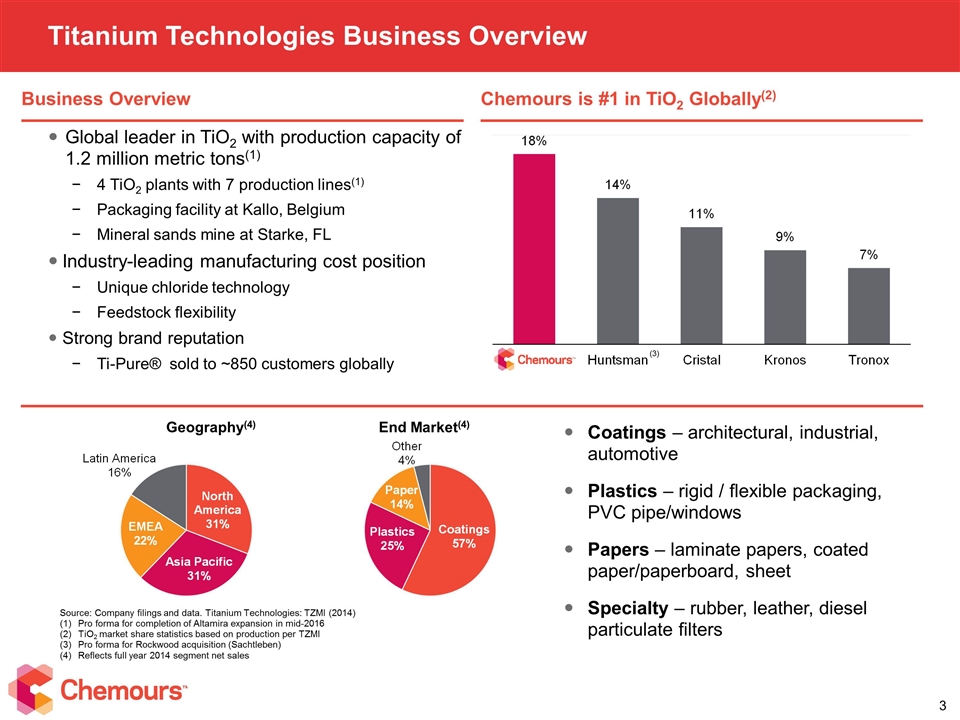
Global leader in TiO2 with production capacity of 1.2 million metric tons(1) 4 TiO2 plants with 7 production lines(1) Packaging facility at Kallo, Belgium Mineral sands mine at Starke, FL Industry-leading manufacturing cost position Unique chloride technology Feedstock flexibility Strong brand reputation Ti-Pure® sold to ~850 customers globally Titanium Technologies Business Overview Coatings – architectural, industrial, automotive Plastics – rigid / flexible packaging, PVC pipe/windows Papers – laminate papers, coated paper/paperboard, sheet Specialty – rubber, leather, diesel particulate filters Geography(4) End Market(4) Source: Company filings and data. Titanium Technologies: TZMI (2014) (1)Pro forma for completion of Altamira expansion in mid-2016 TiO2 market share statistics based on production per TZMI Pro forma for Rockwood acquisition (Sachtleben) Reflects full year 2014 segment net sales (3) Business Overview Chemours is #1 in TiO2 Globally(2)
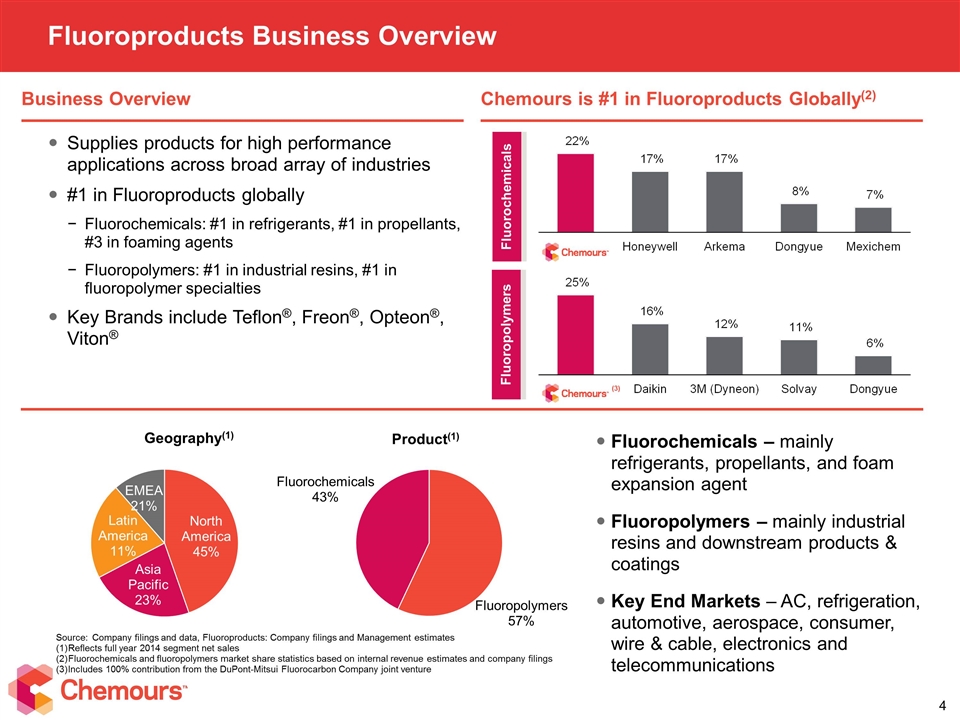
Supplies products for high performance applications across broad array of industries #1 in Fluoroproducts globally Fluorochemicals: #1 in refrigerants, #1 in propellants, #3 in foaming agents Fluoropolymers: #1 in industrial resins, #1 in fluoropolymer specialties Key Brands include Teflon®, Freon®, Opteon®, Viton® Fluoroproducts Business Overview Geography(1) Product(1) Source:Company filings and data, Fluoroproducts: Company filings and Management estimates Reflects full year 2014 segment net sales Fluorochemicals and fluoropolymers market share statistics based on internal revenue estimates and company filings Includes 100% contribution from the DuPont-Mitsui Fluorocarbon Company joint venture Fluorochemicals Fluoropolymers (3) Fluorochemicals – mainly refrigerants, propellants, and foam expansion agent Fluoropolymers – mainly industrial resins and downstream products & coatings Key End Markets – AC, refrigeration, automotive, aerospace, consumer, wire & cable, electronics and telecommunications Business Overview Chemours is #1 in Fluoroproducts Globally(2)
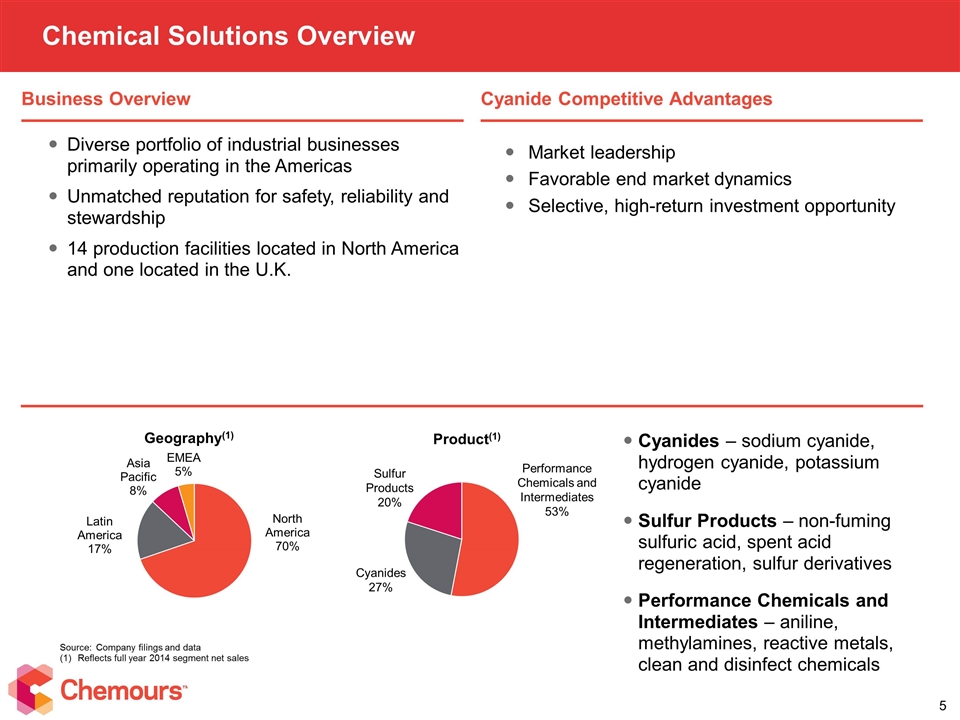
Diverse portfolio of industrial businesses primarily operating in the Americas Unmatched reputation for safety, reliability and stewardship 14 production facilities located in North America and one located in the U.K. Chemical Solutions Overview Source:Company filings and data Reflects full year 2014 segment net sales Cyanides – sodium cyanide, hydrogen cyanide, potassium cyanide Sulfur Products – non-fuming sulfuric acid, spent acid regeneration, sulfur derivatives Performance Chemicals and Intermediates – aniline, methylamines, reactive metals, clean and disinfect chemicals Market leadership Favorable end market dynamics Selective, high-return investment opportunity Geography(1) Product(1) Business Overview Cyanide Competitive Advantages

Chemours Transformation Plan
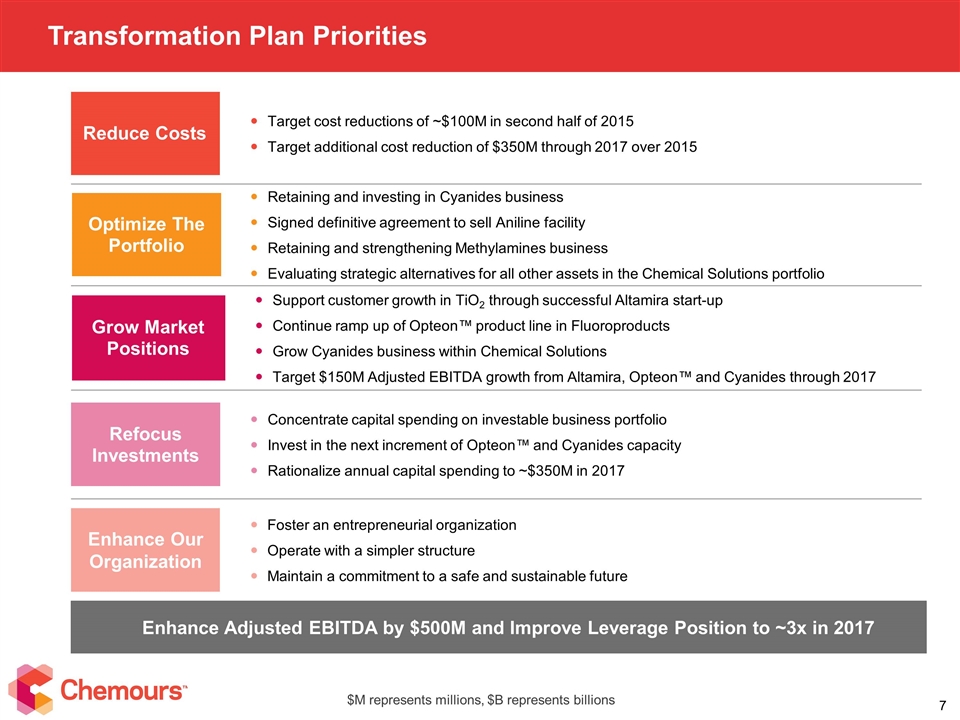
Transformation Plan Priorities Refocus Investments Concentrate capital spending on investable business portfolio Invest in the next increment of Opteon™ and Cyanides capacity Rationalize annual capital spending to ~$350M in 2017 Reduce Costs Target cost reductions of ~$100M in second half of 2015 Target additional cost reduction of $350M through 2017 over 2015 Optimize The Portfolio Retaining and investing in Cyanides business Signed definitive agreement to sell Aniline facility Retaining and strengthening Methylamines business Evaluating strategic alternatives for all other assets in the Chemical Solutions portfolio Grow Market Positions Support customer growth in TiO2 through successful Altamira start-up Continue ramp up of Opteon™ product line in Fluoroproducts Grow Cyanides business within Chemical Solutions Target $150M Adjusted EBITDA growth from Altamira, Opteon™ and Cyanides through 2017 Enhance Adjusted EBITDA by $500M and Improve Leverage Position to ~3x in 2017 Enhance Our Organization Foster an entrepreneurial organization Operate with a simpler structure Maintain a commitment to a safe and sustainable future $M represents millions, $B represents billions
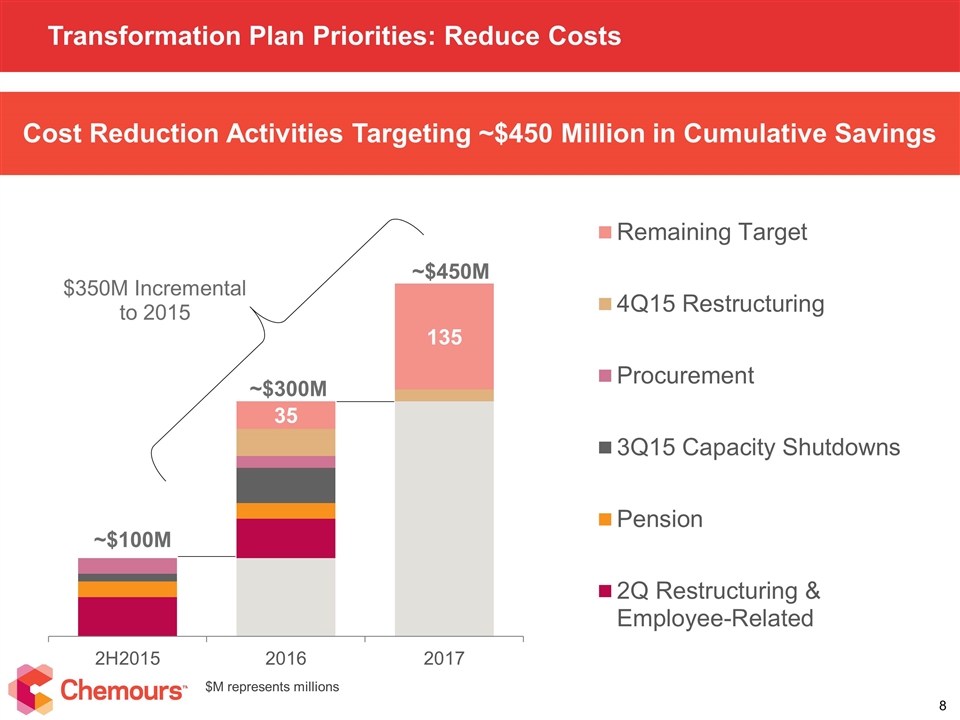
Transformation Plan Priorities: Reduce Costs Cost Reduction Activities Targeting ~$450 Million in Cumulative Savings $M represents millions ~$300M ~$450M $350M Incremental to 2015
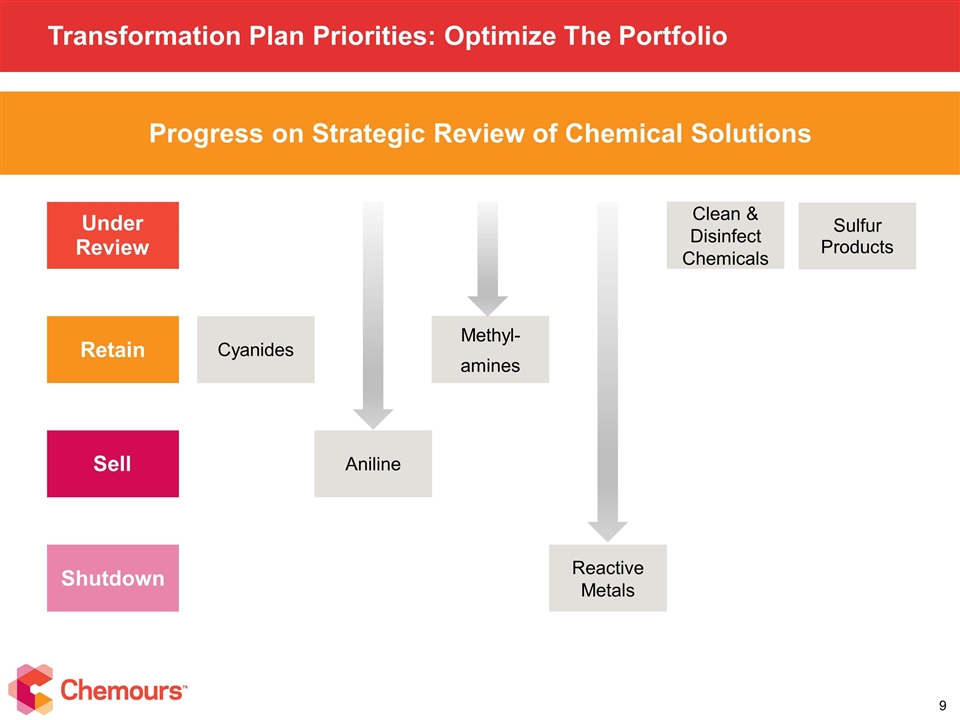
Transformation Plan Priorities: Optimize The Portfolio Progress on Strategic Review of Chemical Solutions Retain Under Review Sell Shutdown Cyanides Sulfur Products Aniline Clean & Disinfect Chemicals Methyl- amines Reactive Metals 9
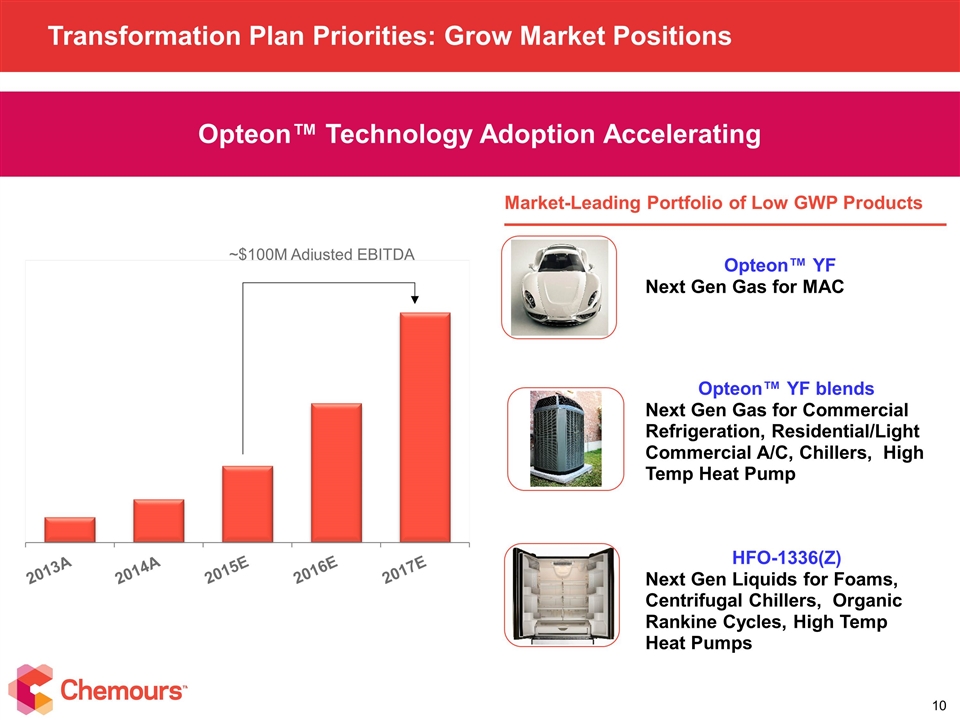
Transformation Plan Priorities: Grow Market Positions Opteon™ YF Next Gen Gas for MAC HFO-1336(Z) Next Gen Liquids for Foams, Centrifugal Chillers, Organic Rankine Cycles, High Temp Heat Pumps Opteon™ YF blends Next Gen Gas for Commercial Refrigeration, Residential/Light Commercial A/C, Chillers, High Temp Heat Pump Market-Leading Portfolio of Low GWP Products ~$100M Adjusted EBITDA Opteon™ Technology Adoption Accelerating
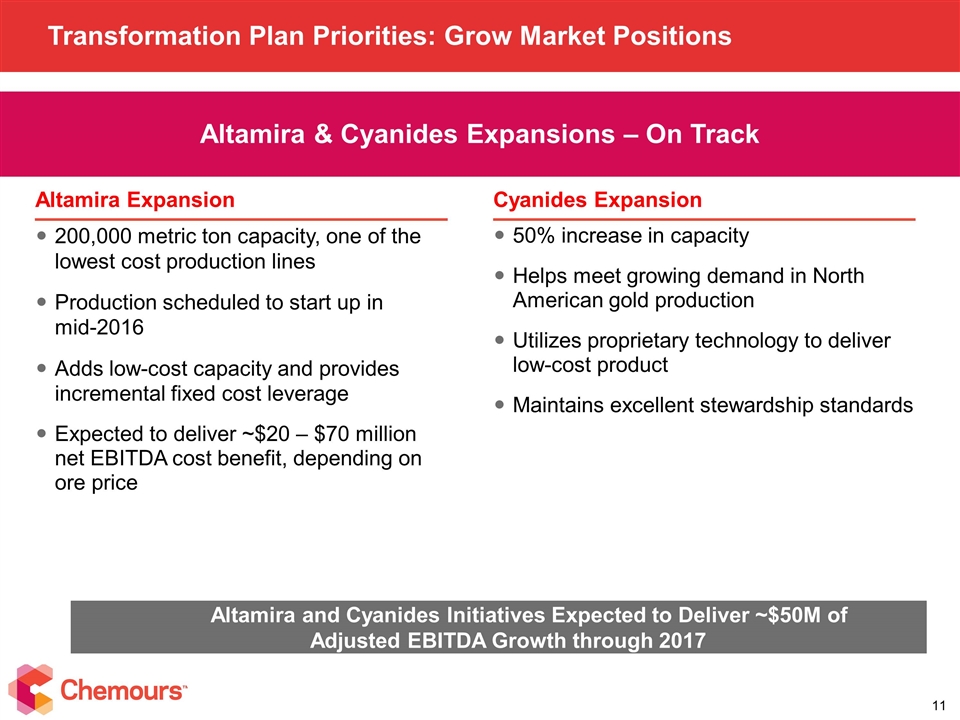
Transformation Plan Priorities: Grow Market Positions Altamira & Cyanides Expansions – On Track 200,000 metric ton capacity, one of the lowest cost production lines Production scheduled to start up in mid-2016 Adds low-cost capacity and provides incremental fixed cost leverage Expected to deliver ~$20 – $70 million net EBITDA cost benefit, depending on ore price Cyanides Expansion 50% increase in capacity Helps meet growing demand in North American gold production Utilizes proprietary technology to deliver low-cost product Maintains excellent stewardship standards Altamira Expansion Altamira and Cyanides Initiatives Expected to Deliver ~$50M of Adjusted EBITDA Growth through 2017
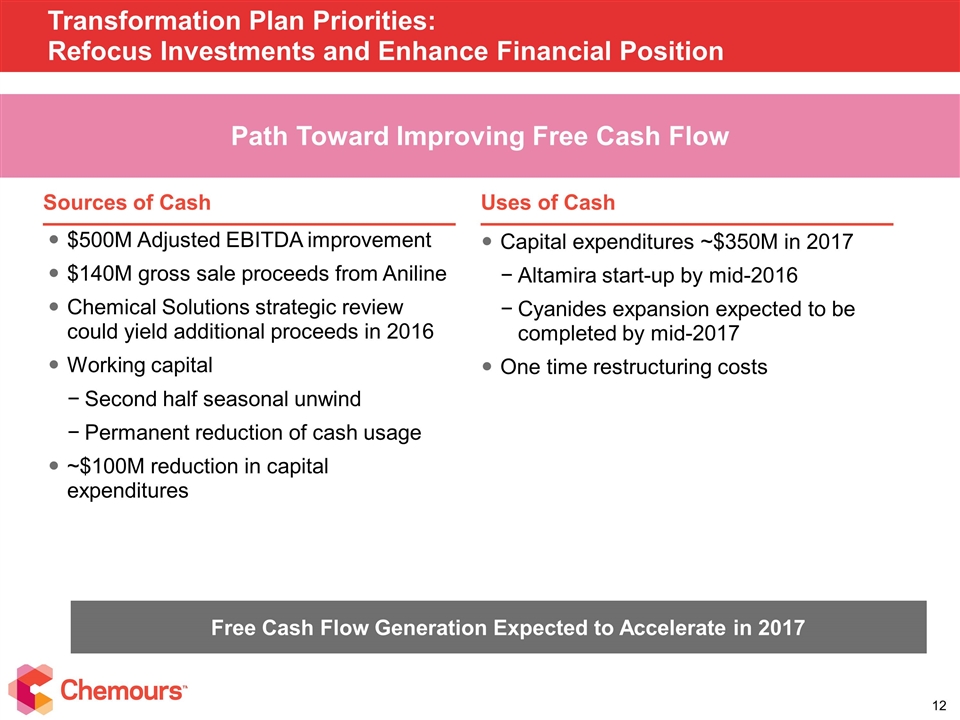
Transformation Plan Priorities: Refocus Investments and Enhance Financial Position Path Toward Improving Free Cash Flow $500M Adjusted EBITDA improvement $140M gross sale proceeds from Aniline Chemical Solutions strategic review could yield additional proceeds in 2016 Working capital Second half seasonal unwind Permanent reduction of cash usage ~$100M reduction in capital expenditures Uses of Cash Sources of Cash Capital expenditures ~$350M in 2017 Altamira start-up by mid-2016 Cyanides expansion expected to be completed by mid-2017 One time restructuring costs Free Cash Flow Generation Expected to Accelerate in 2017
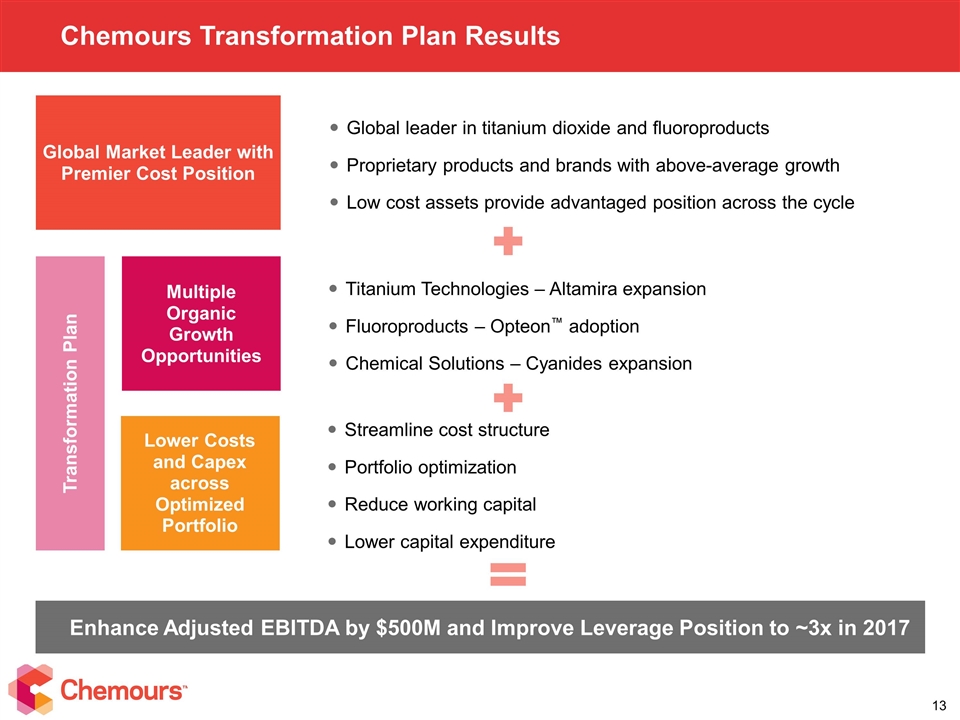
Chemours Transformation Plan Results Global leader in titanium dioxide and fluoroproducts Proprietary products and brands with above-average growth Low cost assets provide advantaged position across the cycle Global Market Leader with Premier Cost Position Titanium Technologies – Altamira expansion Fluoroproducts – Opteon™ adoption Chemical Solutions – Cyanides expansion Multiple Organic Growth Opportunities Streamline cost structure Portfolio optimization Reduce working capital Lower capital expenditure Lower Costs and Capex across Optimized Portfolio Enhance Adjusted EBITDA by $500M and Improve Leverage Position to ~3x in 2017 Transformation Plan
©2015 The Chemours Company. Chemours™ and the Chemours Logo are trademarks or registered trademarks of The Chemours Company
Appendix
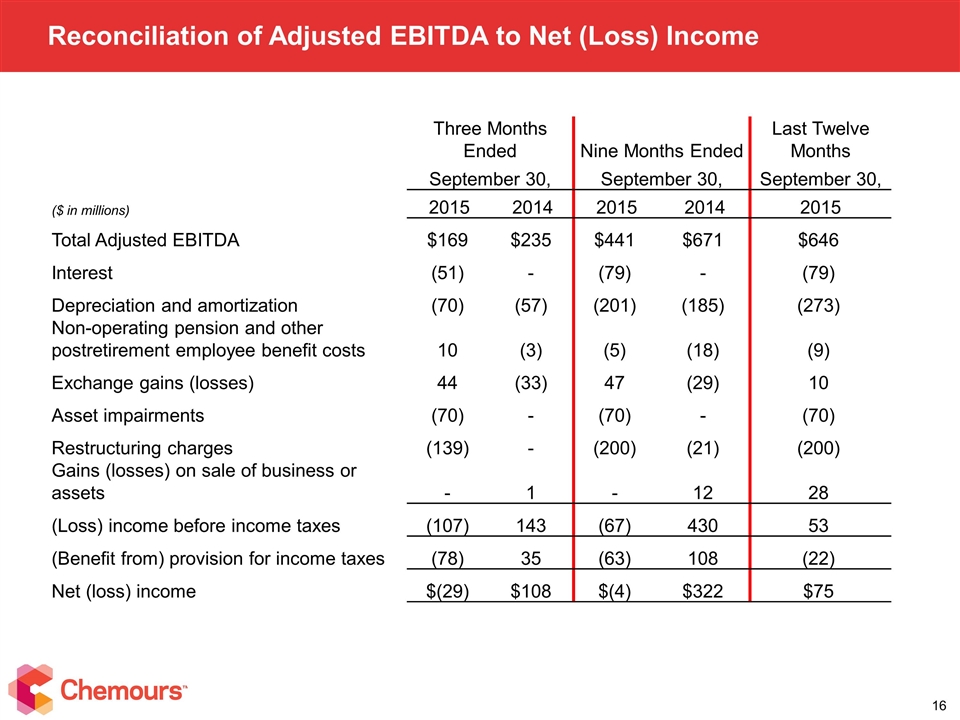
Reconciliation of Adjusted EBITDA to Net (Loss) Income Three Months Ended Nine Months Ended Last Twelve Months September 30, September 30, September 30, ($ in millions) 2015 2014 2015 2014 2015 Total Adjusted EBITDA $169 $235 $441 $671 $646 Interest (51) - (79) - (79) Depreciation and amortization (70) (57) (201) (185) (273) Non-operating pension and other postretirement employee benefit costs 10 (3) (5) (18) (9) Exchange gains (losses) 44 (33) 47 (29) 10 Asset impairments (70) - (70) - (70) Restructuring charges (139) - (200) (21) (200) Gains (losses) on sale of business or assets - 1 - 12 28 (Loss) income before income taxes (107) 143 (67) 430 53 (Benefit from) provision for income taxes (78) 35 (63) 108 (22) Net (loss) income $(29) $108 $(4) $322 $75
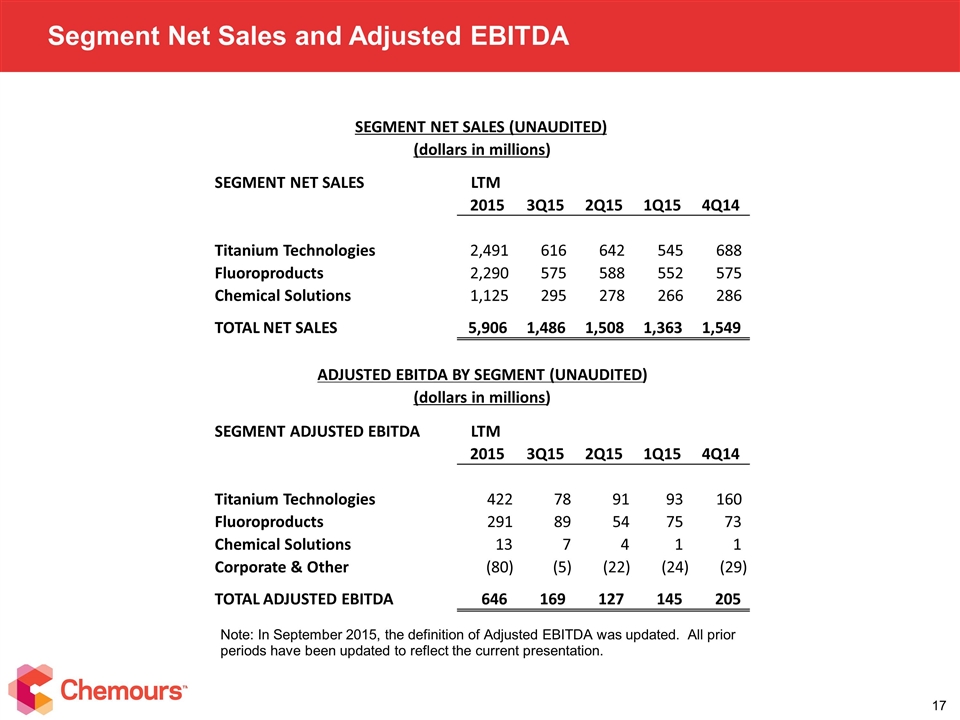
Segment Net Sales and Adjusted EBITDA Note: In September 2015, the definition of Adjusted EBITDA was updated. All prior periods have been updated to reflect the current presentation. SEGMENT NET SALES LTM 2015 3Q15 2Q15 1Q15 4Q14 Titanium Technologies 2,491 616 642 545 688 Fluoroproducts 2,290 575 588 552 575 Chemical Solutions 1,125 295 278 266 286 TOTAL NET SALES 5,906 1,486 1,508 1,363 1,549 SEGMENT ADJUSTED EBITDA LTM 2015 3Q15 2Q15 1Q15 4Q14 Titanium Technologies 422 78 91 93 160 Fluoroproducts 291 89 54 75 73 Chemical Solutions 13 7 4 1 1 Corporate & Other (80) (5) (22) (24) (29) TOTAL ADJUSTED EBITDA 646 169 127 145 205 SEGMENT NET SALES (UNAUDITED) (dollars in millions) ADJUSTED EBITDA BY SEGMENT (UNAUDITED) (dollars in millions)
©2015 The Chemours Company. Chemours™ and the Chemours Logo are trademarks or registered trademarks of The Chemours Company
