Attached files
| file | filename |
|---|---|
| 8-K/A - AMENDMENT NO. 4 TO CURRENT REPORT - Cambridge Capital Acquisition Corp | f8k092915a4_cambridgecapital.htm |
Exhibit 99.1

1 A Global Leader in Tactical Communication Interception and Surveillance Proposed Merger with Cambridge Capital Acquisition Corporation (NASDAQ: CAMB/CAMBU/CAMBW) November 2015

2 Safe Harbor ▪ Neither Cambridge, Ability nor any of their respective affiliates makes any representation or warranty as to the accuracy or completeness of the information contained in this presentation . The sole purpose of the presentation is to assist persons in deciding whether they wish to proceed with a further review of the proposed transaction discussed herein and is not intended to be all - inclusive or to contain all the information that a person may desire in considering the proposed transaction discussed herein . It is not intended to form the basis of any investment decision or any other decision in respect of the proposed transaction . ▪ This presentation shall not constitute a solicitation of a proxy, consent or authorization with respect to any securities or in respect of the proposed transactions . This presentation shall also not constitute an offer to sell or the solicitation of an offer to buy any securities, nor shall there be any sale of securities in any jurisdictions in which such offer, solicitation or sale would be unlawful prior to registration or qualification under the securities laws of any such jurisdiction . No offering of securities shall be made except by means of a prospectus meeting the requirements of section 10 of the Securities Act of 1933 , as amended . ▪ The estimates and projections of future performance set forth in this presentation are based on numerous assumptions about sales, margins, competitive factors, industry performance and other factors which cannot be predicted . Although Cambridge and Ability believe that such assumptions are reasonable, they may be incomplete or incorrect, and events and circumstances may occur . Therefore, the actual results of operations are likely to vary from the projections and the variations may be material and adverse . The projections should not be regarded as a representation or prediction that Ability will achieve or is likely to achieve any particular results . The financial projections have not been prepared, reviewed or compiled by any firm of independent accountants . ▪ This presentation includes “forward - looking statements . ” Cambridge’s and Ability’s actual results may differ from its expectations, estimates and projections and consequently, you should not rely on these forward looking statements as predictions of future events . Words such as “expect,” “estimate,” “project,” “budget,” “forecast,” “anticipate,” “intend,” “plan,” “may,” “will,” “could,” “should,” “believes,” “predicts,” “potential,” “continue,” and similar expressions are intended to identify such forward - looking statements . These forward - looking statements include, without limitation, Cambridge’s and Ability’s expectations with respect to future performance and anticipated financial impacts of the proposed transaction, the satisfaction of the closing conditions to the proposed transaction, and the timing of the completion of the proposed transaction . ▪ These forward - looking statements involve significant risks and uncertainties that could cause the actual results to differ materially from the expected results . Most of these factors are outside Cambridge’s and Ability’s control and are difficult to predict . Factors that may cause such differences include, but are not limited to : ( 1 ) the occurrence of any event, change or other circumstances that could give rise to the termination of the merger agreement for the business combination (the “Merger Agreement”), ( 2 ) the outcome of any legal proceedings against Ability or Cambridge ; ( 3 ) the inability to complete the transaction contemplated by the Merger Agreement, including due to failure to obtain approval of the shareholders of Cambridge or other conditions to closing in the Merger Agreement ; ( 4 ) delays in obtaining, adverse conditions contained in, or the inability to obtain necessary regulatory approvals or complete regulator reviews required to complete the transactions contemplated by the Merger Agreement ; ( 5 ) the risk that the proposed transaction disrupts current plans and operations as a result of the announcement and consummation of the transaction described therein and herein ; ( 6 ) the ability to recognize the anticipated benefits of the business combination, which may be affected by, among other things, competition, the ability of the combined company to grow and manage growth profitably, maintain relationships with suppliers and obtain adequate supply of products and retain its key employees ; ( 7 ) costs related to the proposed business combination ; ( 8 ) changes in applicable laws or regulations ; ( 9 ) the possibility that the combined company may be adversely affected by other economic, business, and/or competitive factors ; and ( 10 ) other risks and uncertainties indicated from time to time in Cambridge’s filings with the Securities and Exchange Commission . ▪ Cambridge cautions that the foregoing list of factors is not exclusive . Cambridge cautions readers not to place undue reliance upon any forward - looking statements, which speak only as of the date made . Cambridge does not undertake or accept any obligation or undertaking to release publicly any updates or revisions to any forward - looking statements to reflect any change in its expectations or any change in events, conditions or circumstances on which any such statement is based . ▪ Certain of Ability’s financial information and data contained herein is unaudited and/or were prepared by Ability as a private company and do not conform to SEC Regulation S - X . Furthermore, they include certain financial information (EBITDA) not derived in accordance with United States generally accepted accounting principals . Accordingly , such information will be presented differently in Cambridge’s filings with the SEC . Cambridge and Ability believe that the presentation of non - GAAP measures provides information that is useful to investors as it indicates more clearly the ability of Ability to meet capital expenditures and working capital requirements and otherwise meet its obligations as they become due . However, this should not be construed to replace GAAP figures

3 Agenda » Presenters » Situation Overview » Investment Highlights » Business Overview » Financial Highlights » Transaction Overview » Comparable Company Analysis » Board of Directors » Planned Transaction Timeline » Appendix

4 Presenters » 1994 - Current » Extensive experience in intelligence technologies » 10 years of relevant military service » MS, Electronics Engineering, Military Academy of Radio Electronics, Vilnius, Lithuania Anatoly Hurgin CEO & Co - Founder - Ability Computer & Software Industries Ltd. (“Ability”) » November 2015 - Current » Investment banking, corporate finance, and public accounting » CPA (PwC ) in the US and Israel » MBA, NYU Stern; BA, Ben Gurion University, Israel Avi Levin CFO - Ability Computer & Software Industries Ltd. (“Ability”) » 2013 - Current » Two successful technology company exits » BGSA founder, CEO / 14 years of transactional experience » MBA, HBS; BA, Yale Ben Gordon CEO - Cambridge Capital Acquisition Corporation ( Nasdaq : CAMB)

5 Situation Overview » CAMB: special purpose acquisition corporation (SPAC) – December 2013: completed IPO and private placement – Raised $81.3 MM (or approximately $10.10 per share) » Entered merger agreement with Ability on September 8 th , 2015 – $281.7 MM equity valuation; $225.1 MM enterprise value at close – We are issuing Ability 17.2 MM shares plus $18.2 MM in cash at close » Ability is motivated to become public, increase its company profile in US market, and raise capital to fund growth strategy » CAMB engaged FBR Capital Markets & Co. as financial advisor for roadshow
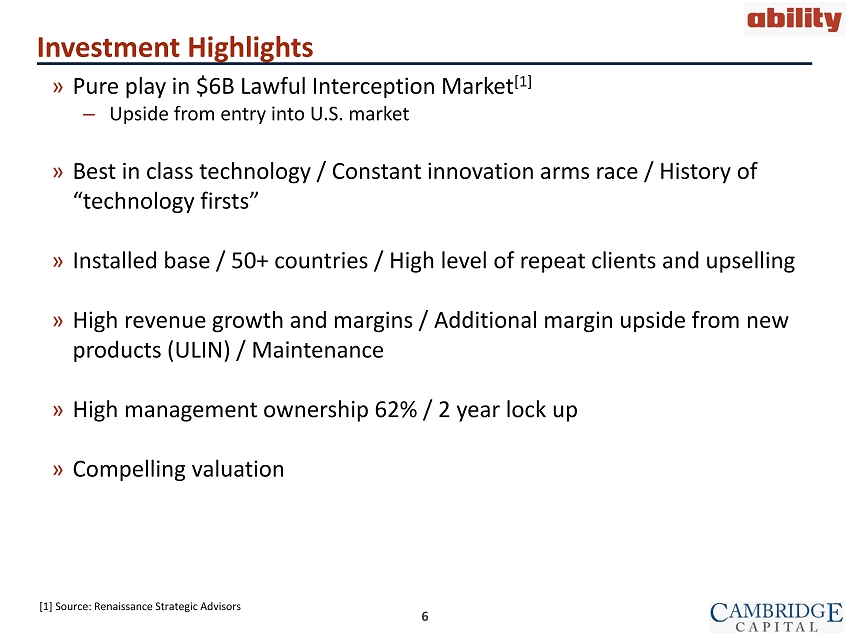
6 Investment Highlights » Pure play in $6B Lawful Interception Market [1] – Upside from entry into U.S. market » Best in class technology / Constant innovation arms race / History of “technology firsts” » Installed base / 50+ countries / High level of repeat clients and upselling » High revenue growth and margins / Additional margin upside from new products (ULIN) / Maintenance » High management ownership 62% / 2 year lock up » Compelling valuation [1] Source: Renaissance Strategic Advisors
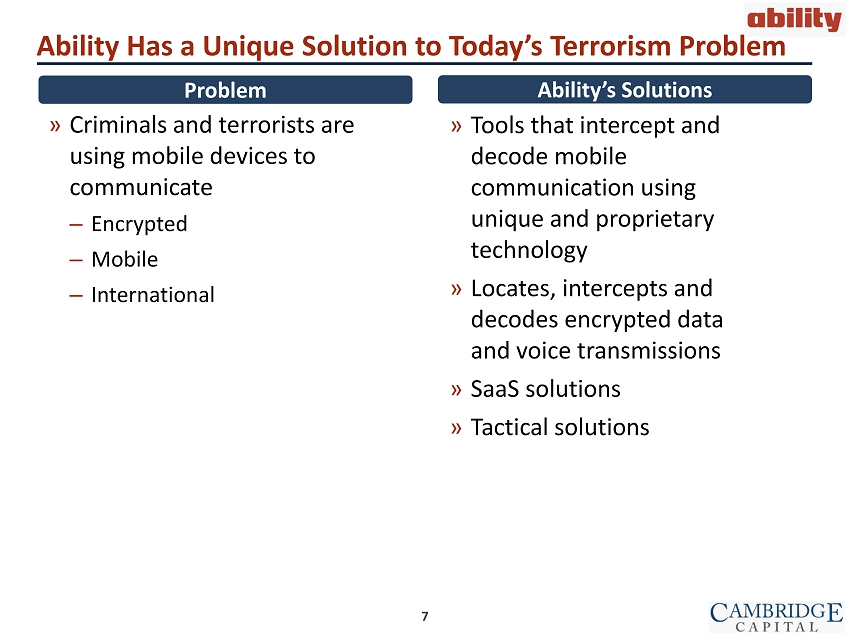
7 Ability Has a Unique Solution to Today’s Terrorism Problem » Criminals and terrorists are using mobile devices to communicate – Encrypted – Mobile – International » Tools that intercept and decode mobile communication using unique and proprietary technology » Locates, intercepts and decodes encrypted data and voice transmissions » SaaS solutions » Tactical solutions Ability’s Solutions Problem

8 $5.6 $22.1 $58.0 $108.0 3% 21% 41% 42% 0% 10% 20% 30% 40% 50% $0 $20 $40 $60 $80 $100 $120 2013 2014 2015E 2016E EBITDA % Revenue ($MM) Overview » Interception, geolocation and cyber solutions » Homeland security, armed forces and intelligence agencies » Team of experts in military intelligence and communications Operating Results Revenue [2], [3] Global Presence Lawful Interception Leader Cellular 40% Location 29% Cyber 23% Satellite 6% Other 2% By Geography By Segment Middle East 32% Latin America 31% Asia 27% Europe 5% Africa 5% [2] 2014 Revenue [3] Middle East includes Israel based resellers Developing Markets Existing Markets Headquarters [1] [1] [1] Management estimates

9 Location Voice Texts Email Contacts How Lawful Interception Works

10 Superior Integrated Solutions Bird - Catcher - - Counter - interception - Launched in 2015 Defense IBIS Airborne – airborne GSM interception system Cellular ATIS – Thuraya interception system Satellite Cyber Location IRIS – Iridium interception system IBIS - II – Ability’s top - of - the - line GSM interception unit 2014 Revenue Cellular 40% Location 29% Cyber 23% Satellite 6% Other 2% » Maintenance revenue opportunities » Leveraging reseller network

11 Ability - Only Provider of Full Suite of Solutions » Customers want end - to - end solutions from one supplier » Bundling is our strategy » Limited / no competition hoi Segments Competitor Cellular Satellite Location Cyber Deciphering Notes Ability P P P P P Leading end-to-end solution in interception Arpege P Iridium system cannot intercept data Circles P P Only UMTS system, location capabilities limited Gamma P No tactical solution Hacking Team P No tactical solution L3 P No Iridium system Neosoft P P No airborne system, cannot compete with ULIN Picsix P Passive GSM solution UAlex P Only CDMA system Verint P P No airborne system, deciphers for GSM and Thuraya are slower, cannot compete with ULIN Wintego P No solution for iCloud

12 Culture of Innovation: Three Waves of Accelerating Growth » 1994: Founded, Computer services » 2000: Interception technology » 2004: First interception solution for IRIDIUM » 2006: First to break GSM encryption » 2008: First to break Thuraya satellite encryption History of Innovation (1994 - 2008) Diversification (2009 - 2014) New Breakthroughs (2015 - Future) » Cellular and satellite interception solutions » Geolocation » Deciphering solutions » Cyber » 2015: Bird - Catcher - cellular interception detection and prevention » 2015: PointGuard - crime prevention system » 2015: Ultimate Interception technology (ULIN) 2015 1994 2009

13 Missions Surveillance Anti - Terror Border Security Anti - Crime Intelligence Gathering Reconnaissance Target Tracking Internal Security Airport Security Tracking Suspicious People Clients Ministries of Defense Ministries of Interior National Security Organizations National Intelligence Agencies Armies, Navies, Air Forces Federal Police Forces Secret Services Presidential Police Homeland Security Organizations Border Control Forces Large - Scale Integrators Anti - Drug Organizations Recent Projects Prison Authority in Latin America Intelligence Agency in Asia Anti - Drug Agency in Asia Intelligence Agency in a NATO Country Broad Range of Clients, Missions and Projects
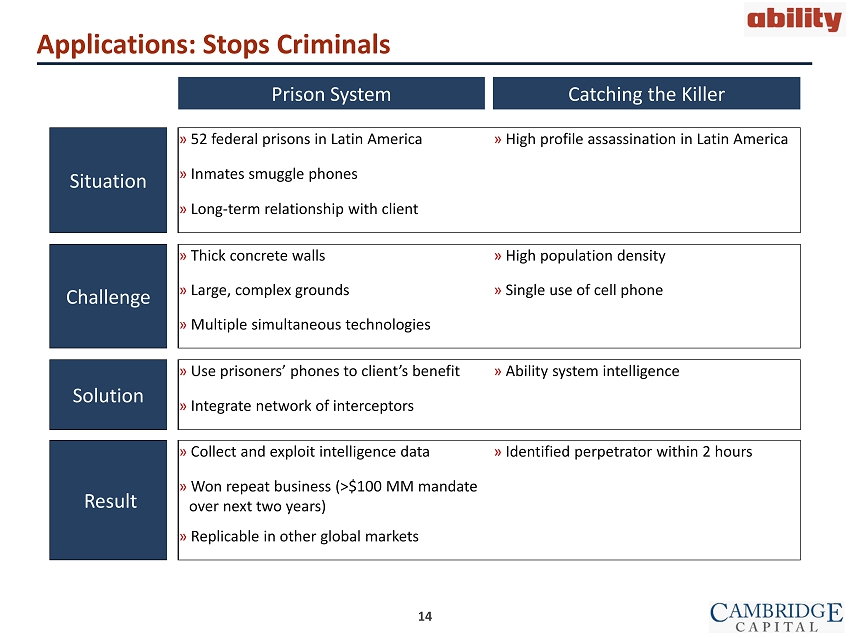
14 Applications: Stops Criminals Prison System Catching the Killer Situation » 52 federal prisons in Latin America » High profile assassination in Latin America » Inmates smuggle phones » Long - term relationship with client Challenge » Thick concrete walls » High population density » Large, complex grounds » Single use of cell phone » Multiple simultaneous technologies Solution » Use prisoners’ phones to client’s benefit » Ability system intelligence » Integrate network of interceptors Result » Collect and exploit intelligence data » Identified perpetrator within 2 hours » Won repeat business (>$100 MM mandate over next two years) » Replicable in other global markets

15 Large, Growing International Market $238 B $106 B $3,847 $4,241 $4,679 $5,167 $5,709 $6,313 $1,997 $2,239 $2,512 $2,821 $3,169 $3,563 $5,844 $6,481 $7,192 $7,988 $8,878 $9,876 $0 $2,000 $4,000 $6,000 $8,000 $10,000 $12,000 2015 2016 2017 2018 2019 2020 $ MM US International » Technology arms race » Pressure on governments to defend » Strategic to Tactical interception » US market opportunity Note: International includes the rest of the world minus countries such as China, Russia, Iran, North Korea, etc. Source: RSAdvisors analysis

16 Strategic Interception Tactical Interception » Mass interception of large networks (AT&T, T - Mobile) » Targeted interception » Network cooperation dependent » Network cooperation not required » Impossible to break encryption of IT traffic (data) » Possible to break encryption » Susceptible to leaks » More confidential » Declining budgets » Growing budgets Ability is a leader in this emerging market Market Shift to Tactical Interception Plays to Ability’s Strengths

17 Why We Win » Constantly innovating technology » Portfolio - interconnected products, cloud based software » Large installed base / repeat customers / 50+ countries » Leverage reseller network » Efficient, flexible and scalable business model » Intelligence solutions
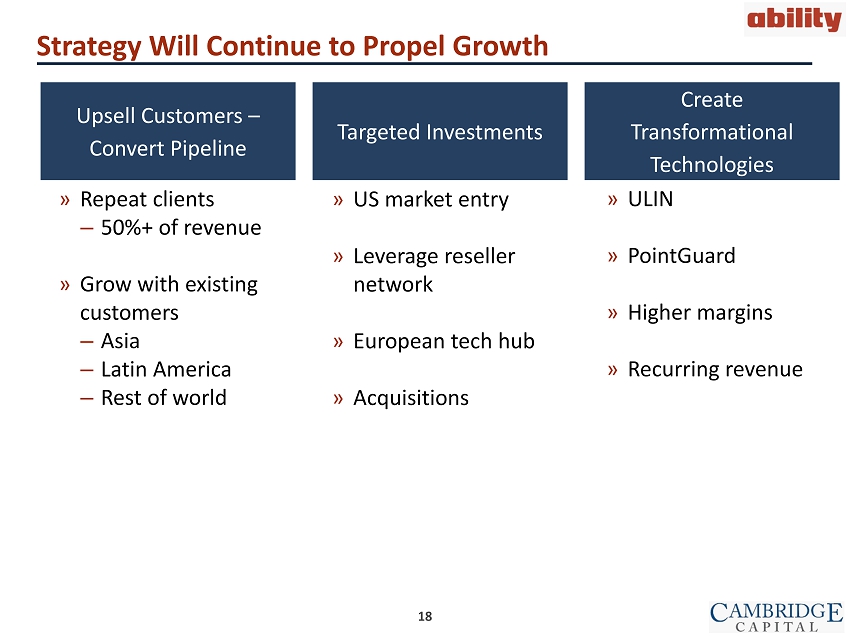
18 Strategy Will Continue to Propel Growth Upsell Customers – Convert Pipeline Targeted Investments Create Transformational Technologies » Repeat clients ‒ 50%+ of revenue » Grow with existing customers ‒ Asia ‒ Latin America ‒ Rest of world » US market entry » Leverage reseller network » European tech hub » Acquisitions » ULIN » PointGuard » Higher margins » Recurring revenue
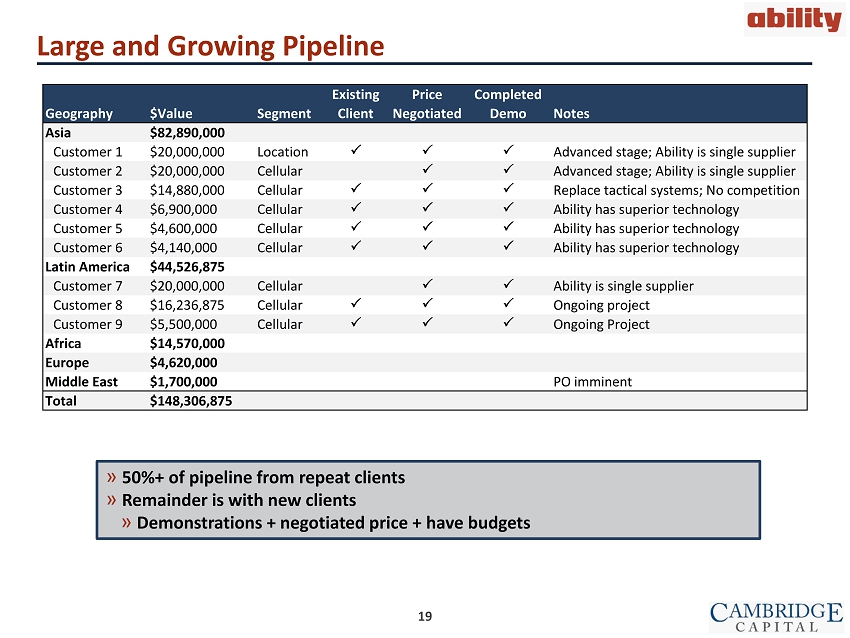
19 Large and Growing Pipeline » 50%+ of pipeline from repeat clients » Remainder is with new clients » Demonstrations + negotiated price + have budgets Geography $Value Segment Notes Asia $82,890,000 Customer 1 $20,000,000 Location P P P Advanced stage; Ability is single supplier Customer 2 $20,000,000 Cellular P P Advanced stage; Ability is single supplier Customer 3 $14,880,000 Cellular P P P Replace tactical systems; No competition Customer 4 $6,900,000 Cellular P P P Ability has superior technology Customer 5 $4,600,000 Cellular P P P Ability has superior technology Customer 6 $4,140,000 Cellular P P P Ability has superior technology Latin America $44,526,875 Customer 7 $20,000,000 Cellular P P Ability is single supplier Customer 8 $16,236,875 Cellular P P P Ongoing project Customer 9 $5,500,000 Cellular P P P Ongoing Project Africa $14,570,000 Europe $4,620,000 Middle East $1,700,000 PO imminent Total $148,306,875 Existing Client Price Negotiated Completed Demo

20 ULIN (Ultimate Interceptor) - Transformational Technology » New technology for interception of mobile devices » Unique to Ability - No known competitors » Cooperation of Network Operator (AT&T, T - Mobile) not required » Developed in house » Revenue model: – System – Software License – Maintenance & Support » High margin expansion » First orders expected 1Q 2016
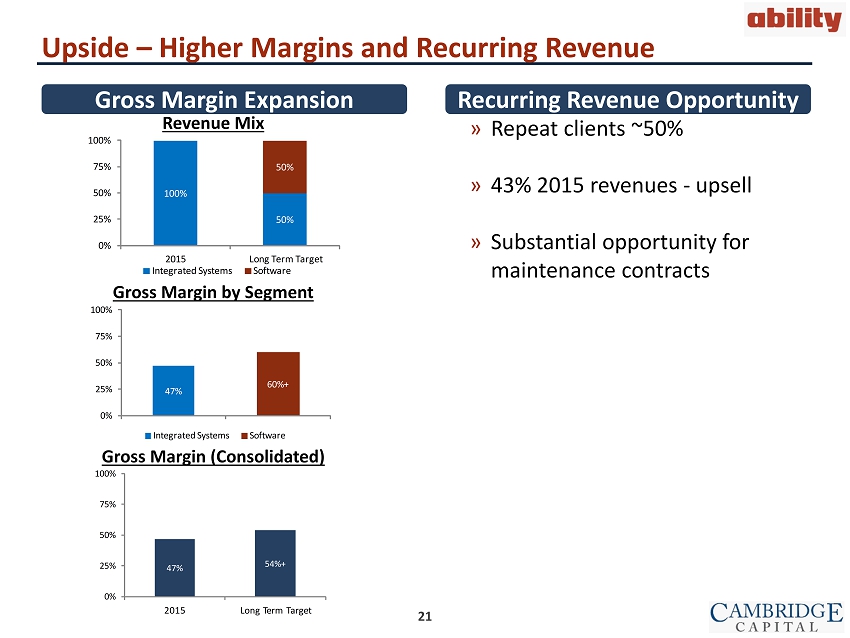
21 47% 54%+ 0% 25% 50% 75% 100% 2015 Long Term Target Blended Gross Margin 47% 60%+ 0% 25% 50% 75% 100% Integrated Systems Software Margin by Segment Integrated Systems Software 100% 50% 50% 0% 25% 50% 75% 100% 2015 Long Term Target Revenue Mix Integrated Systems Software Upside – Higher Margins and Recurring Revenue Gross Margin (Consolidated) Gross Margin by Segment Revenue Mix » Repeat clients ~50% » 43% 2015 revenues - upsell » Substantial opportunity for maintenance contracts Recurring Revenue Opportunity Gross Margin Expansion
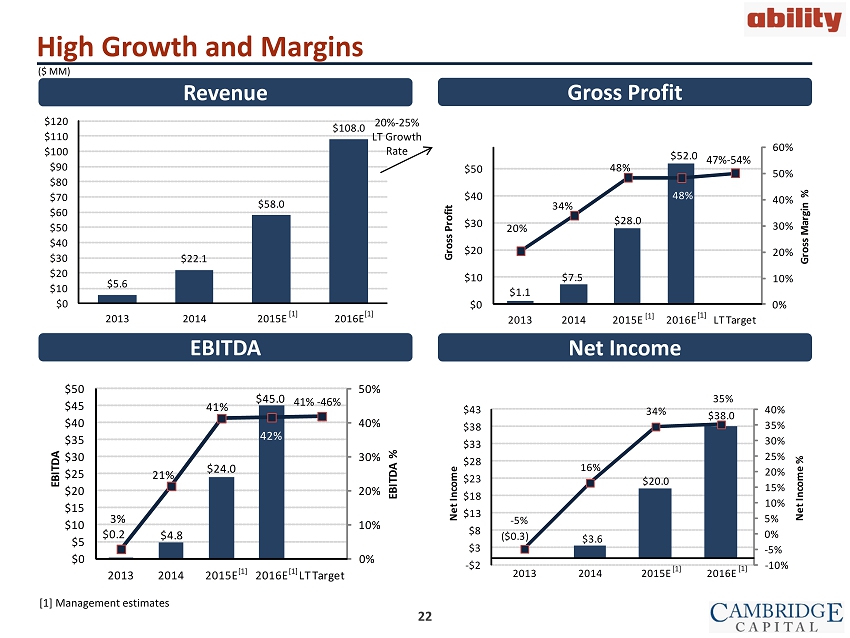
22 $5.6 $22.1 $58.0 $108.0 $0 $10 $20 $30 $40 $50 $60 $70 $80 $90 $100 $110 $120 2013 2014 2015E 2016E ($0.3) $3.6 $20.0 $38.0 - 5% 16% 34% 35% - 10% - 5% 0% 5% 10% 15% 20% 25% 30% 35% 40% - $2 $3 $8 $13 $18 $23 $28 $33 $38 $43 2013 2014 2015E 2016E Net Income % Net Income $1.1 $7.5 $28.0 $52.0 20% 34% 48% 48% 0% 10% 20% 30% 40% 50% 60% $0 $10 $20 $30 $40 $50 2013 2014 2015E 2016E LT Target Gross Margin % Gross Profit $0.2 $4.8 $24.0 $45.0 3% 21% 41% 42% 0% 10% 20% 30% 40% 50% $0 $5 $10 $15 $20 $25 $30 $35 $40 $45 $50 2013 2014 2015E 2016E LT Target EBITDA % EBITDA High Growth and Margins 2… ($ MM) EBITDA Net Income Gross Profit Revenue 20% - 25% LT Growth Rate [1] [1] Management estimates [1] [1] [1] [1] [1] [1] [1] 41% - 46% 47% - 54%

23 Transaction Overview - Compelling Valuation » Pro forma market value of $282 MM at close plus earnout » Ability shareholders to be paid $18.2 MM in cash and issued 17.2 MM shares at closing » Pre - Ability transaction cash includes ~$81.3 MM from existing CAMB shareholders » Closing of the Ability transaction is expected in mid - December 2015 » Aggregate earn - out payment of 8.5 MM shares to be paid based on 2015 - 2018 net income ($ MM, except per share values) Pro Forma Valuation Overview [1] Excludes warrants; assumes no redemptions and CAMB share price of $10.10 [2] Includes estimated $8 MM of net income from July 1, 2015 through transaction close [3] Due to the revenue delay from one contract, Ability does not believe the earnout target will be achieved in 2015. For 2016, Ability expects revenue of $108 MM and net income of $38 MM. [4] Reflects issuance of 95% of 2015 and 2016 earnout shares (3.4 MM + 1.8 MM = 5.2 MM) [4] Pro Forma @ Transaction Close 2015E Pro Forma with Earnout Shares 2016E CAMB Illustrative Share Price $10.10 $10.10 Ordinary Shares Outstanding (MM) [1] 27.9 33.3 Equity Value $281.7 $336.8 Net Cash [2] $56.6 $56.6 Enterprise Value $225.1 $280.2 Valuation Net Income P/E 2015E [3] $20 14.1x 2016E [3] $38 8.8x EBITDA EV/EBITDA 2015E $24 9.4x 2016E $45 6.2x
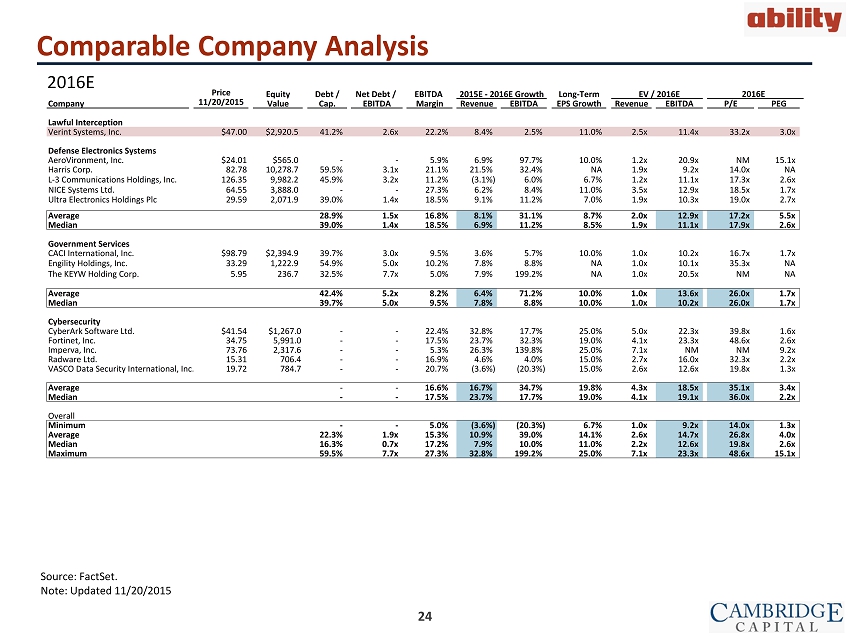
24 Comparable Company Analysis 2016E Source: FactSet . Note: Updated 11/20/2015 Price Equity Debt / Net Debt / EBITDA 2015E - 2016E Growth Long-Term EV / 2016E Company 11/20/2015 Value Cap. EBITDA Margin Revenue EBITDA EPS Growth Revenue EBITDA P/E PEG Lawful Interception Verint Systems, Inc. $47.00 $2,920.5 41.2% 2.6x 22.2% 8.4% 2.5% 11.0% 2.5x 11.4x 33.2x 3.0x Defense Electronics Systems AeroVironment, Inc. $24.01 $565.0 - - 5.9% 6.9% 97.7% 10.0% 1.2x 20.9x NM 15.1x Harris Corp. 82.78 10,278.7 59.5% 3.1x 21.1% 21.5% 32.4% NA 1.9x 9.2x 14.0x NA L-3 Communications Holdings, Inc. 126.35 9,982.2 45.9% 3.2x 11.2% (3.1%) 6.0% 6.7% 1.2x 11.1x 17.3x 2.6x NICE Systems Ltd. 64.55 3,888.0 - - 27.3% 6.2% 8.4% 11.0% 3.5x 12.9x 18.5x 1.7x Ultra Electronics Holdings Plc 29.59 2,071.9 39.0% 1.4x 18.5% 9.1% 11.2% 7.0% 1.9x 10.3x 19.0x 2.7x Average 28.9% 1.5x 16.8% 8.1% 31.1% 8.7% 2.0x 12.9x 17.2x 5.5x Median 39.0% 1.4x 18.5% 6.9% 11.2% 8.5% 1.9x 11.1x 17.9x 2.6x Government Services CACI International, Inc. $98.79 $2,394.9 39.7% 3.0x 9.5% 3.6% 5.7% 10.0% 1.0x 10.2x 16.7x 1.7x Engility Holdings, Inc. 33.29 1,222.9 54.9% 5.0x 10.2% 7.8% 8.8% NA 1.0x 10.1x 35.3x NA The KEYW Holding Corp. 5.95 236.7 32.5% 7.7x 5.0% 7.9% 199.2% NA 1.0x 20.5x NM NA Average 42.4% 5.2x 8.2% 6.4% 71.2% 10.0% 1.0x 13.6x 26.0x 1.7x Median 39.7% 5.0x 9.5% 7.8% 8.8% 10.0% 1.0x 10.2x 26.0x 1.7x Cybersecurity CyberArk Software Ltd. $41.54 $1,267.0 - - 22.4% 32.8% 17.7% 25.0% 5.0x 22.3x 39.8x 1.6x Fortinet, Inc. 34.75 5,991.0 - - 17.5% 23.7% 32.3% 19.0% 4.1x 23.3x 48.6x 2.6x Imperva, Inc. 73.76 2,317.6 - - 5.3% 26.3% 139.8% 25.0% 7.1x NM NM 9.2x Radware Ltd. 15.31 706.4 - - 16.9% 4.6% 4.0% 15.0% 2.7x 16.0x 32.3x 2.2x VASCO Data Security International, Inc. 19.72 784.7 - - 20.7% (3.6%) (20.3%) 15.0% 2.6x 12.6x 19.8x 1.3x Average - - 16.6% 16.7% 34.7% 19.8% 4.3x 18.5x 35.1x 3.4x Median - - 17.5% 23.7% 17.7% 19.0% 4.1x 19.1x 36.0x 2.2x Overall Minimum - - 5.0% (3.6%) (20.3%) 6.7% 1.0x 9.2x 14.0x 1.3x Average 22.3% 1.9x 15.3% 10.9% 39.0% 14.1% 2.6x 14.7x 26.8x 4.0x Median 16.3% 0.7x 17.2% 7.9% 10.0% 11.0% 2.2x 12.6x 19.8x 2.6x Maximum 59.5% 7.7x 27.3% 32.8% 199.2% 25.0% 7.1x 23.3x 48.6x 15.1x 2016E
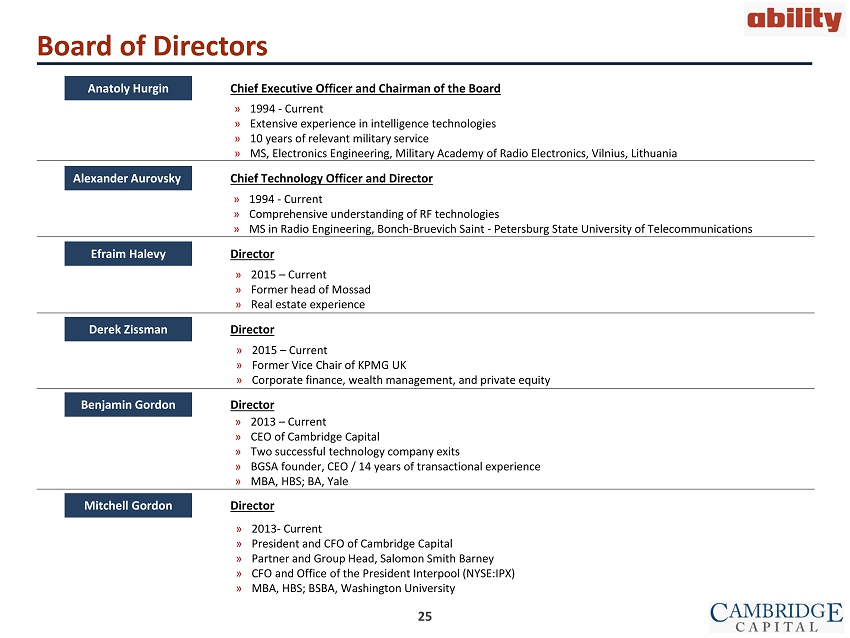
25 Board of Directors » 1994 - Current » Comprehensive understanding of RF technologies » MS in Radio Engineering, Bonch - Bruevich Saint - Petersburg State University of Telecommunications Alexander Aurovsky Chief Technology Officer and Director » 1994 - Current » Extensive experience in intelligence technologies » 10 years of relevant military service » MS, Electronics Engineering, Military Academy of Radio Electronics, Vilnius, Lithuania Anatoly Hurgin Chief Executive Officer and Chairman of the Board » 2015 – Current » Former head of Mossad » Real estate experience Efraim Halevy Director » 2015 – Current » Former Vice Chair of KPMG UK » Corporate finance, wealth management, and private equity Derek Zissman Director » 2013 - Current » President and CFO of Cambridge Capital » Partner and Group Head, Salomon Smith Barney » CFO and Office of the President Interpool (NYSE:IPX) » MBA, HBS; BSBA, Washington University Mitchell Gordon Director Benjamin Gordon Director » 2013 – Current » CEO of Cambridge Capital » Two successful technology company exits » BGSA founder, CEO / 14 years of transactional experience » MBA, HBS; BA, Yale
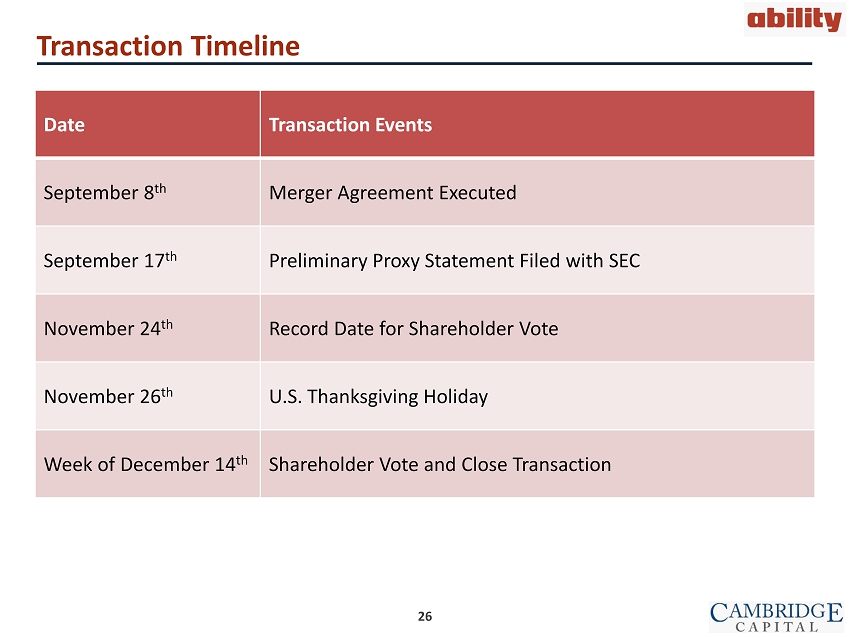
26 Transaction Timeline Date Transaction Events September 8 th Merger Agreement Executed September 17 th Preliminary Proxy Statement Filed with SEC November 24 th Record Date for Shareholder Vote November 26 th U.S. Thanksgiving Holiday Week of December 14 th Shareholder Vote and Close Transaction

27 Appendix

28 Large, Growing Market » Ability participates in the fast growing homeland security space » Growing global markets driven by a rise in security threats, such as terrorism, illegal immigration, and drug smuggling, among others: Homeland Security 1 Cybersecurity 2 Lawful Interception 3 $238 B $106 B $5.8 B $238 $106 $345 $170 2014 2022 2015 2020 2015 2020 Lawful Interception Market Cybersecurity Market Homeland Security Market US $ billions [1] Source: visiongain [2] Source: MarketsandMarkets [3] Source: Renaissance Strategic Advisors $5.8 $9.9
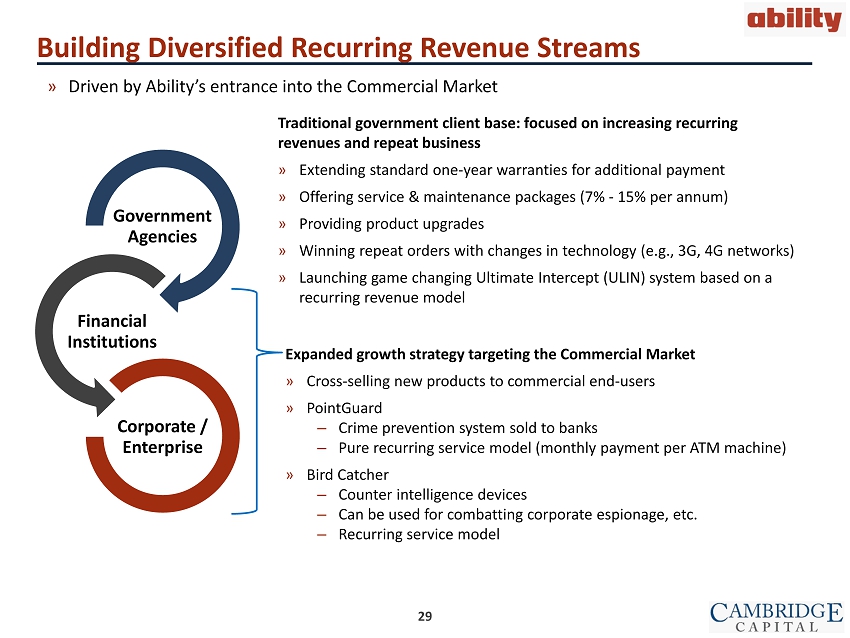
29 Government Agencies Financial Institutions Corporate / Enterprise Expanded growth strategy targeting the Commercial Market » Cross - selling new products to commercial end - users » PointGuard – Crime prevention system sold to banks – Pure recurring service model (monthly payment per ATM machine) » Bird Catcher – Counter intelligence devices – Can be used for combatting corporate espionage, etc. – R ecurring service model Building Diversified Recurring Revenue Streams » Driven by Ability’s entrance into the Commercial Market Traditional government c lient base: focused on increasing r ecurring revenues and repeat b usiness » Extending standard one - year warranties for additional payment » Offering service & maintenance packages (7% - 15% per annum) » Providing product upgrades » Winning repeat orders with changes in technology (e.g., 3G, 4G networks) » Launching game changing Ultimate Intercept (ULIN) system based on a recurring revenue model

30 The United States » A huge, untapped market opportunity for Ability » The U.S. lawful interception sector is projected to grow from $3.8 billion in 2015 to $6.3 billion in 2020. » Ability understands the strategic importance of addressing this significant market . » Currently in discussions with various potential U.S. - based partners. » Seeking a joint venture partner with the following characteristics : – Well - known, recognized and trusted by U.S. intelligence and law enforcement communities – Complementary product offerings – Access to buyers – U.S . manufacturing capabilities and full sales, marketing and service support » Timing : 18 - 36 months for full infrastructure establishment, with U.S. revenues targeted to commence at the end of 2017; full contribution in 2018
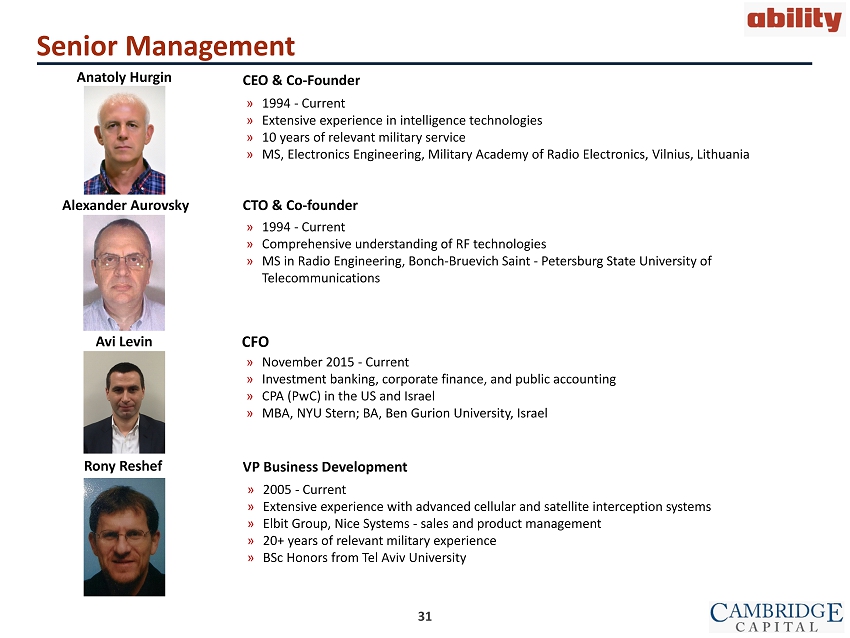
31 Senior Management » 1994 - Current » Comprehensive understanding of RF technologies » MS in Radio Engineering, Bonch - Bruevich Saint - Petersburg State University of Telecommunications Alexander Aurovsky » 2005 - Current » Extensive experience with advanced cellular and satellite interception systems » Elbit Group, Nice Systems - sales and product management » 20+ years of relevant military experience » BSc Honors from Tel Aviv University Rony Reshef CTO & Co - founder VP Business Development » 1994 - Current » Extensive experience in intelligence technologies » 10 years of relevant military service » MS, Electronics Engineering, Military Academy of Radio Electronics, Vilnius, Lithuania Anatoly Hurgin CEO & Co - Founder » November 2015 - Current » Investment banking, corporate finance, and public accounting » CPA (PwC) in the US and Israel » MBA, NYU Stern; BA, Ben Gurion University, Israel Avi Levin CFO
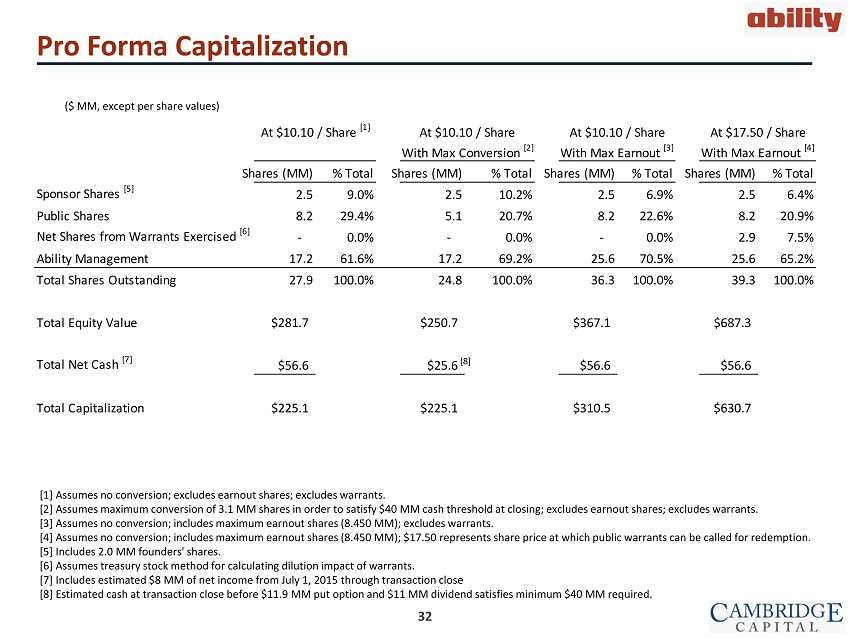
32 Pro Forma Capitalization [1] Assumes no conversion; excludes earnout shares; excludes warrants. [2] Assumes maximum conversion of 3.1 MM shares in order to satisfy $40 MM cash threshold at closing; excludes earnout shares; excludes warrants. [3] Assumes no conversion; includes maximum earnout shares (8.450 MM); excludes warrants. [4] Assumes no conversion; includes maximum earnout shares (8.450 MM); $17.50 represents share price at which public warrants can be called for redemption. [5] Includes 2.0 MM founders' shares. [6] Assumes treasury stock method for calculating dilution impact of warrants. [7] Includes estimated $8 MM of
net income from July 1, 2015 through transaction close [8] Estimated cash at transaction close before $11.9 MM put option and $11 MM dividend satisfies minimum $40 MM required. ($ MM, except per share values) [8] Shares (MM) % Total Shares (MM) % Total Shares (MM) % Total Shares (MM) % Total Sponsor Shares [5] 2.5 9.0% 2.5 10.2% 2.5 6.9% 2.5 6.4% Public Shares 8.2 29.4% 5.1 20.7% 8.2 22.6% 8.2 20.9% Net Shares from Warrants Exercised [6] - 0.0% - 0.0% - 0.0% 2.9 7.5% Ability Management 17.2 61.6% 17.2 69.2% 25.6 70.5% 25.6 65.2% Total Shares Outstanding 27.9 100.0% 24.8 100.0% 36.3 100.0% 39.3 100.0% Total Equity Value $281.7 $250.7 $367.1 $687.3 Total Net Cash [7] $56.6 $25.6 $56.6 $56.6 Total Capitalization $225.1 $225.1 $310.5 $630.7 At $17.50 / ShareAt $10.10 / Share With Max Conversion [2] With Max Earnout [4] At $10.10 / Share [1] At $10.10 / Share With Max Earnout [3]