Attached files
| file | filename |
|---|---|
| 8-K - FORM 8-K - CEB Inc. | d76922d8k.htm |
Exhibit 99.1
Exhibit 99.1
Supplemental
Non-GAAP Financial Information
CEB
WHAT THE BEST COMPANIES DO
Appendix: Non-GAAP Financial Measures
The accompanying tables include a discussion of Adjusted effective tax rate, Adjusted net income, and Non-GAAP diluted earnings per share, all of which are non-GAAP financial
measures provided as a complement to the results provided in accordance with accounting principles generally accepted in the United States of America (“GAAP”). A reconciliation of these non-GAAP measures to the most directly comparable
GAAP measure is included in the accompanying tables.
We believe that these non-GAAP financial measures are relevant and useful supplemental information for
evaluating our results of operations as compared from period to period and as compared to our competitors. We use these non-GAAP financial measures for internal budgeting and other managerial purposes, including comparison against our competitors,
when publicly providing our business outlook, and as a measurement for potential acquisitions. These non-GAAP financial measures are not defined in the same manner by all companies and therefore may not be comparable to other similarly titled
measures used by other companies.
Our non-GAAP financial measures reflect adjustments based on the following items, as well as the related income tax effects:
Certain business combination accounting entries and expenses related to acquisitions:
We have adjusted for the impact of the deferred revenue fair value adjustment, amortization of acquisition related intangibles, and acquisition related costs. We incurred
transaction and certain other operating expenses in connection with our acquisitions which we generally would not have otherwise incurred in the periods presented as a part of our continuing operations. We believe that excluding these acquisition
related items from our non-GAAP financial measures provides useful supplemental information to our investors and is important in illustrating what our core operating results would have been had we not incurred these acquisition related items since
the nature, size, and number of acquisitions can vary from period to period.
Share-based compensation: Although share-based compensation is a key incentive offered
to our employees, we evaluate our operating results excluding such expense.
Accordingly, we exclude share-based compensation from our non-GAAP financial measures
because we believe it provides valuable supplemental information that helps investors have a more complete understanding of our operating results. In addition, we believe the exclusion of this expense facilitates the ability of our investors to
compare our operating results with those of other peer companies, many of which also exclude such expense in determining their non-GAAP measures, given varying valuation methodologies, subjective assumptions, and the variety and amount of award
types that may be utilized.
Net non-operating foreign currency gain (loss): Beginning in the first quarter of 2015, we adjusted for the impact of the net
non-operating foreign currency gain (loss) included in other (expense) income. These items primarily result from the remeasurement of foreign currency cash balances held by CEB US and subsidiaries with the USD as their functional currency, USD cash
balances held by subsidiaries with a functional currency other than the USD, certain intercompany notes, and the balance sheets of non-US subsidiaries whose functional currency is the USD. We believe this information is useful to investors to
facilitate comparison of operating results and better identify trends in our businesses.
Equity method investment loss and restructuring costs: We believe that
excluding these items from our non-GAAP financial measures provides useful supplemental information to our investors and is important in illustrating what our core operating results would have been had we not incurred these items. We exclude these
items because management does not believe they correlate to the ongoing operating results of the business.
Adjusted effective tax rate: Beginning in the third
quarter of 2015, we adjusted for the impact of certain discrete items included in the effective tax rate that relate to prior year periods such as government provided tax incentives pertaining to prior years that were claimed in the current year,
the change in our election to claim foreign tax credits that were previously taken as deductions, changes in tax planning strategies and changes in valuation allowances in certain jurisdictions. We exclude these items because management believes it
will facilitate the comparison of the annual effective tax rate over time. Not all discrete items are removed for purposes of calculating the Adjusted effective tax rate.
These non-GAAP measures may be considered in addition to results prepared in accordance with GAAP, but they should not be considered a substitute for, or superior to, GAAP results.
We intend to continue to provide these non-GAAP financial measures as part of our future earnings discussions and, therefore, the inclusion of these non-GAAP financial measures will provide consistency in our financial reporting.
© 2015 CEB. All rights reserved.CEB156824GD
2
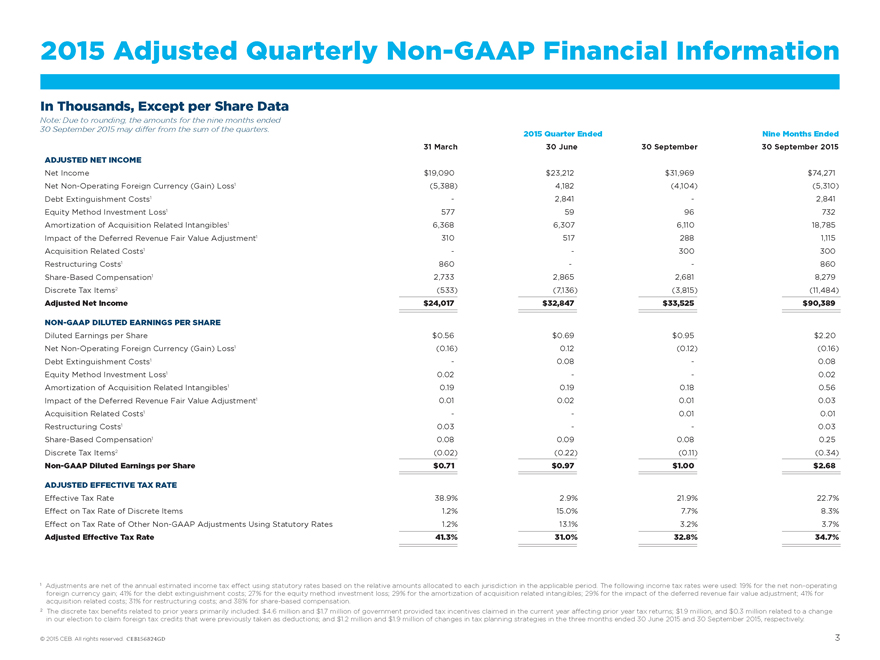
2015 Adjusted Quarterly Non-GAAP Financial Information
In Thousands, Except per Share Data
Note: Due to rounding, the amounts for the nine months
ended
30 September 2015 may differ from the sum of the quarters. 2015 Quarter Ended Nine Months Ended
31 March 30 June 30 September 30 September 2015
ADJUSTED NET INCOME
Net Income $19,090 $23,212 $31,969 $74,271
Net Non-Operating Foreign Currency (Gain) Loss1
(5,388) 4,182 (4,104) (5,310)
Debt Extinguishment Costs1 - 2,841 - 2,841
Equity Method Investment Loss1 577 59 96 732
Amortization of Acquisition
Related Intangibles1 6,368 6,307 6,110 18,785
Impact of the Deferred Revenue Fair Value Adjustment1 310 517 288 1,115
Acquisition Related Costs1 - - 300 300
Restructuring Costs1 860 - - 860
Share-Based Compensation1 2,733 2,865 2,681 8,279
Discrete Tax Items2 (533) (7,136) (3,815)
(11,484)
Adjusted Net Income $24,017 $32,847 $33,525 $90,389
NON-GAAP DILUTED
EARNINGS PER SHARE
Diluted Earnings per Share $0.56 $0.69 $0.95 $2.20
Net
Non-Operating Foreign Currency (Gain) Loss1 (0.16) 0.12 (0.12) (0.16)
Debt Extinguishment Costs1 - 0.08 - 0.08
Equity Method Investment Loss1 0.02 - - 0.02
Amortization of Acquisition Related Intangibles1
0.19 0.19 0.18 0.56
Impact of the Deferred Revenue Fair Value Adjustment1 0.01 0.02 0.01 0.03
Acquisition Related Costs1 - - 0.01 0.01
Restructuring Costs1 0.03 - - 0.03
Share-Based Compensation1 0.08 0.09 0.08 0.25
Discrete Tax Items2 (0.02) (0.22) (0.11) (0.34)
Non-GAAP Diluted Earnings per Share $0.71 $0.97 $1.00 $2.68
ADJUSTED
EFFECTIVE TAX RATE
Effective Tax Rate 38.9% 2.9% 21.9% 22.7%
Effect on Tax
Rate of Discrete Items 1.2% 15.0% 7.7% 8.3%
Effect on Tax Rate of Other Non-GAAP Adjustments Using Statutory Rates 1.2% 13.1% 3.2% 3.7%
Adjusted Effective Tax Rate 41.3% 31.0% 32.8% 34.7%
1 Adjustments are net of the annual
estimated income tax effect using statutory rates based on the relative amounts allocated to each jurisdiction in the applicable period. The following income tax rates were used: 19% for the net non-operating foreign currency gain; 41% for the debt
extinguishment costs; 27% for the equity method investment loss; 29% for the amortization of acquisition related intangibles; 29% for the impact of the deferred revenue fair value adjustment; 41% for acquisition related costs; 31% for restructuring
costs; and 38% for share-based compensation.
2 The discrete tax benefits related to prior years primarily included: $4.6 million and $1.7 million of government
provided tax incentives claimed in the current year affecting prior year tax returns; $1.9 million, and $0.3 million related to a change in our election to claim foreign tax credits that were previously taken as deductions; and $1.2 million and $1.9
million of changes in tax planning strategies in the three months ended 30 June 2015 and 30 September 2015, respectively.
© 2015 CEB. All rights
reserved. CEB156824GD 3
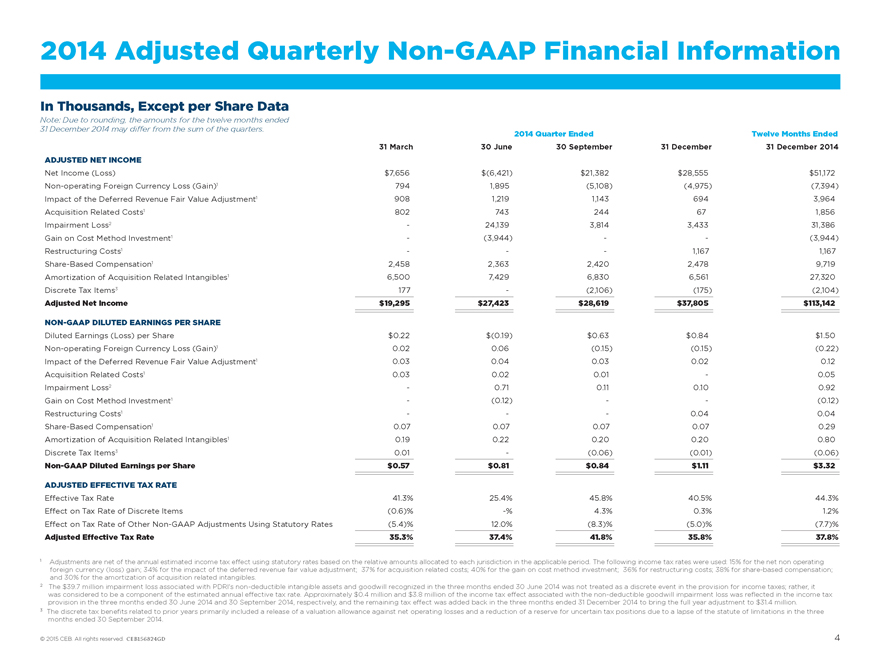
2014 Adjusted Quarterly Non-GAAP Financial Information
In Thousands, Except per Share Data
Note: Due to rounding, the amounts for the twelve months
ended
31 December 2014 may differ from the sum of the quarters. 2014 Quarter Ended Twelve Months Ended
31 March 30 June 30 September 31 December 31 December 2014
ADJUSTED NET INCOME
Net Income (Loss) $7,656 $(6,421) $21,382 $28,555 $51,172
Non-operating Foreign Currency Loss
(Gain)1 794 1,895 (5,108) (4,975) (7,394)
Impact of the Deferred Revenue Fair Value Adjustment1 908 1,219 1,143 694 3,964
Acquisition Related Costs1 802 743 244 67 1,856
Impairment Loss2 - 24,139 3,814 3,433 31,386
Gain on Cost Method Investment1 - (3,944) - - (3,944)
Restructuring Costs1 -
- - 1,167 1,167
Share-Based Compensation1 2,458 2,363 2,420 2,478 9,719
Amortization of Acquisition Related Intangibles1 6,500 7,429 6,830 6,561 27,320
Discrete Tax Items3 177 - (2,106) (175) (2,104)
Adjusted Net Income $19,295
$27,423 $28,619 $37,805 $113,142
NON-GAAP DILUTED EARNINGS PER SHARE
Diluted
Earnings (Loss) per Share $0.22 $(0.19) $0.63 $0.84 $1.50
Non-operating Foreign Currency Loss (Gain)1 0.02 0.06 (0.15) (0.15) (0.22)
Impact of the Deferred Revenue Fair Value Adjustment1 0.03 0.04 0.03 0.02 0.12
Acquisition
Related Costs1 0.03 0.02 0.01 - 0.05
Impairment Loss2 - 0.71 0.11 0.10 0.92
Gain on Cost Method Investment1 - (0.12) - - (0.12)
Restructuring Costs1 - -
- 0.04 0.04
Share-Based Compensation1 0.07 0.07 0.07 0.07 0.29
Amortization
of Acquisition Related Intangibles1 0.19 0.22 0.20 0.20 0.80
Discrete Tax Items3 0.01 - (0.06) (0.01) (0.06)
Non-GAAP Diluted Earnings per Share $0.57 $0.81 $0.84 $1.11 $3.32
ADJUSTED EFFECTIVE TAX RATE
Effective Tax Rate 41.3% 25.4% 45.8% 40.5% 44.3%
Effect on Tax Rate of
Discrete Items (0.6)% -% 4.3% 0.3% 1.2%
Effect on Tax Rate of Other Non-GAAP Adjustments Using Statutory Rates (5.4)% 12.0% (8.3)% (5.0)% (7.7)%
Adjusted Effective Tax Rate 35.3% 37.4% 41.8% 35.8% 37.8%
1 Adjustments are net of the annual
estimated income tax effect using statutory rates based on the relative amounts allocated to each jurisdiction in the applicable period. The following income tax rates were used: 15% for the net non operating foreign currency (loss) gain; 34% for
the impact of the deferred revenue fair value adjustment; 37% for acquisition related costs; 40% for the gain on cost method investment; 36% for restructuring costs; 38% for share-based compensation; and 30% for the amortization of acquisition
related intangibles.
2 The $39.7 million impairment loss associated with PDRI’s non-deductible intangible assets and goodwill recognized in the three months
ended 30 June 2014 was not treated as a discrete event in the provision for income taxes; rather, it was considered to be a component of the estimated annual effective tax rate. Approximately $0.4 million and $3.8 million of the income tax
effect associated with the non-deductible goodwill impairment loss was reflected in the income tax provision in the three months ended 30 June 2014 and 30 September 2014, respectively, and the remaining tax effect was added back in the
three months ended 31 December 2014 to bring the full year adjustment to $31.4 million.
3 The discrete tax benefits related to prior years primarily included
a release of a valuation allowance against net operating losses and a reduction of a reserve for uncertain tax positions due to a lapse of the statute of limitations in the three months ended 30 September 2014.
© 2015 CEB. All rights reserved. CEB156824GD 4