Attached files
| file | filename |
|---|---|
| 8-K - 8-K - BEACON ROOFING SUPPLY INC | v425358_8k.htm |
| EX-99.1 - EXHIBIT 99.1 - BEACON ROOFING SUPPLY INC | v425358_ex99-1.htm |
Exhibit 99.2
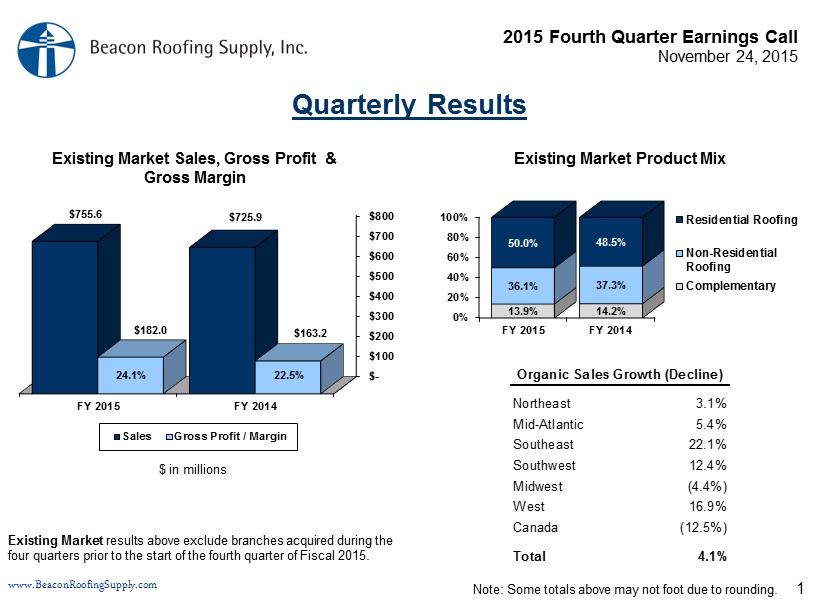
2015 Fourth Quarter Earnings Call November 24, 2015 www.BeaconRoofingSupply.com 0% 20% 40% 60% 80% 100% FY 2015 FY 2014 13.9% 14.2% 36.1% 37.3% 50.0% 48.5% Residential Roofing Non-Residential Roofing Complementary $- $100 $200 $300 $400 $500 $600 $700 $800 FY 2015 FY 2014 $755.6 $725.9 $182.0 $163.2 Sales Gross Profit / Margin 1 Quarterly Results Existing Market Product Mix Northeast 3.1% Mid-Atlantic 5.4% Southeast 22.1% Southwest 12.4% Midwest (4.4%) West 16.9% Canada (12.5%) Total 4.1% Organic Sales Growth (Decline) $ in millions Existing Market results above exclude branches acquired during the four quarters prior to the start of the fourth quarter of Fiscal 2015. 22.5% Existing Market Sales, Gross Profit & Gross Margin 24.1% Note: Some totals above may not foot due to rounding.
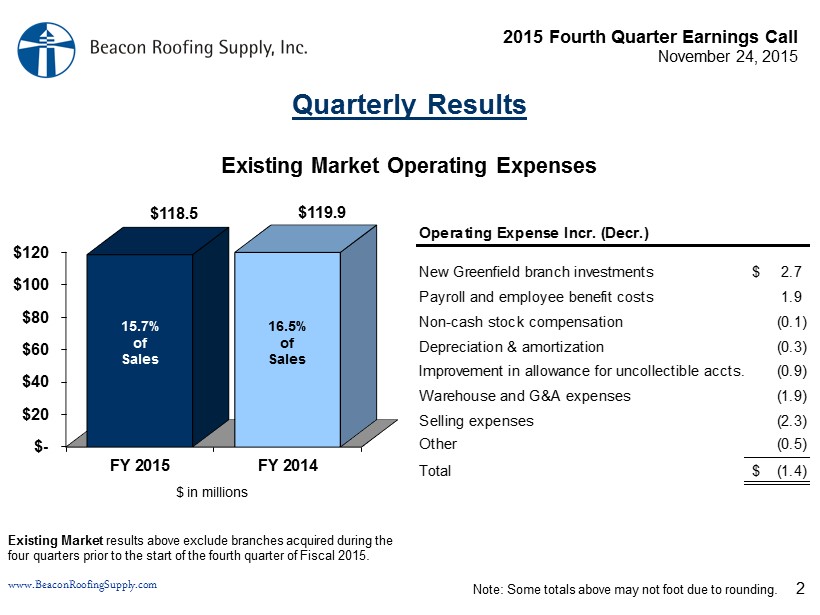
2015 Fourth Quarter Earnings Call November 24, 2015 www.BeaconRoofingSupply.com $- $20 $40 $60 $80 $100 $120 FY 2015 FY 2014 $118.5 $119.9 2 $ in millions 15.7% of Sales 16.5% of Sales Existing Market Operating Expenses Quarterly Results Note: Some totals above may not foot due to rounding. Existing Market results above exclude branches acquired during the four quarters prior to the start of the fourth quarter of Fiscal 2015. New Greenfield branch investments 2.7$ Payroll and employee benefit costs 1.9 Non-cash stock compensation (0.1) Depreciation & amortization (0.3) Improvement in allowance for uncollectible accts. (0.9) Warehouse and G&A expenses (1.9) Selling expenses (2.3) Other (0.5) Total (1.4)$ Operating Expense Incr. (Decr.)
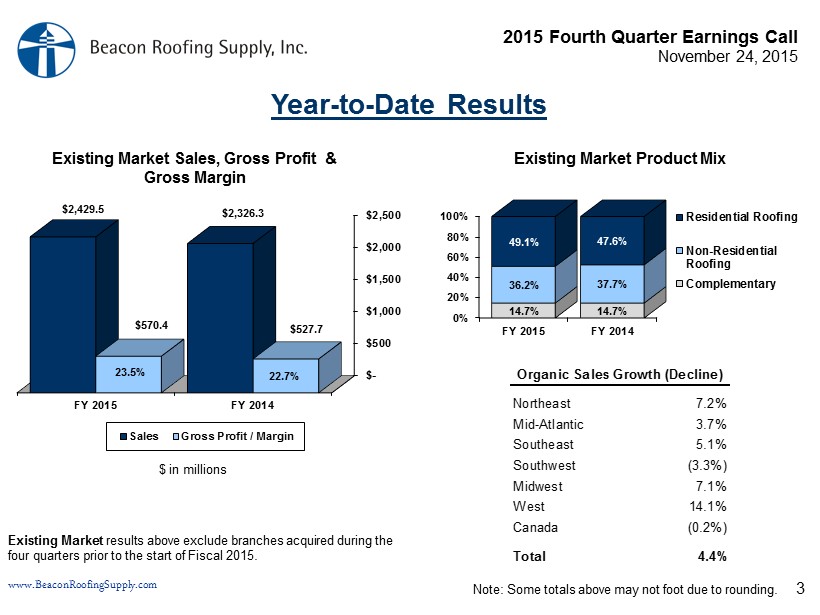
2015 Fourth Quarter Earnings Call November 24, 2015 www.BeaconRoofingSupply.com $- $500 $1,000 $1,500 $2,000 $2,500 FY 2015 FY 2014 $2,429.5 $2,326.3 $570.4 $527.7 Sales Gross Profit / Margin 0% 20% 40% 60% 80% 100% FY 2015 FY 2014 14.7% 14.7% 36.2% 37.7% 49.1% 47.6% Residential Roofing Non-Residential Roofing Complementary 3 Year - to - Date Results Northeast 7.2% Mid-Atlantic 3.7% Southeast 5.1% Southwest (3.3%) Midwest 7.1% West 14.1% Canada (0.2%) Total 4.4% Organic Sales Growth (Decline) $ in millions Existing Market results above exclude branches acquired during the four quarters prior to the start of Fiscal 2015. Existing Market Sales, Gross Profit & Gross Margin Existing Market Product Mix Note: Some totals above may not foot due to rounding. 22.7% 23.5%
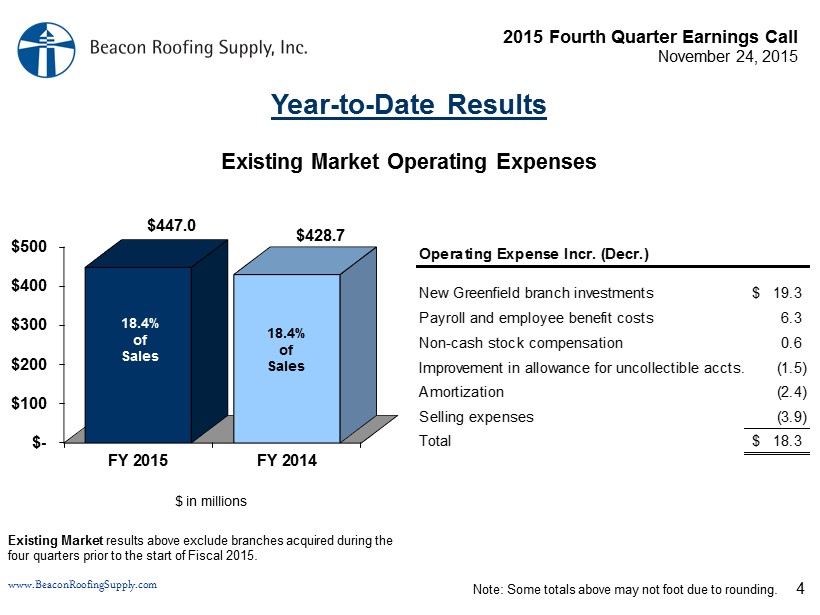
2015 Fourth Quarter Earnings Call November 24, 2015 www.BeaconRoofingSupply.com $- $100 $200 $300 $400 $500 FY 2015 FY 2014 $447.0 $428.7 4 $ in millions 18.4% of Sales 18.4% of Sales Existing Market Operating Expenses Year - to - Date Results Note: Some totals above may not foot due to rounding. Existing Market results above exclude branches acquired during the four quarters prior to the start of Fiscal 2015. New Greenfield branch investments 19.3$ Payroll and employee benefit costs 6.3 Non-cash stock compensation 0.6 Improvement in allowance for uncollectible accts. (1.5) Amortization (2.4) Selling expenses (3.9) Total 18.3$ Operating Expense Incr. (Decr.)
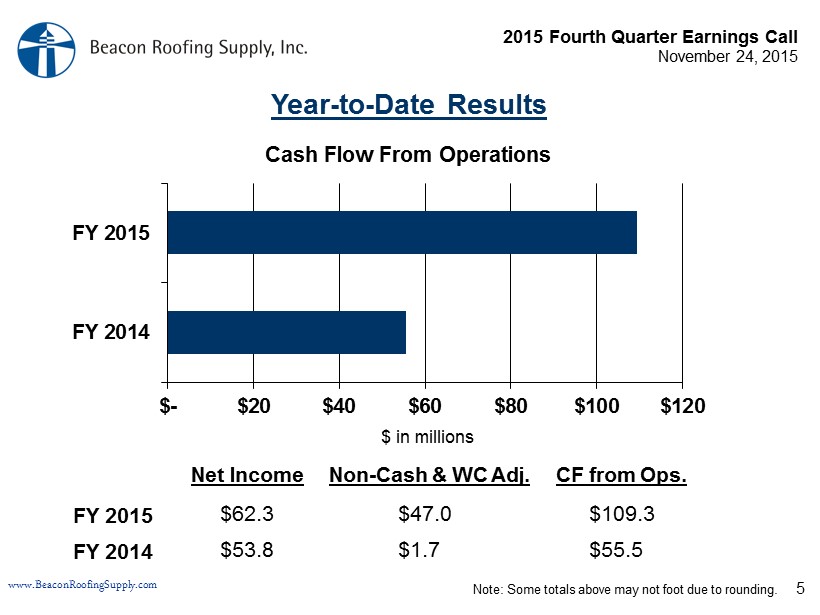
2015 Fourth Quarter Earnings Call November 24, 2015 www.BeaconRoofingSupply.com $- $20 $40 $60 $80 $100 $120 FY 2014 FY 2015 5 $109.3 $55.5 $ in millions Cash Flow From Operations Year - to - Date Results Note: Some totals above may not foot due to rounding. CF from Ops. $47.0 $1.7 Non - Cash & WC Adj. $62.3 $53.8 Net Income FY 2015 FY 2014