Attached files
| file | filename |
|---|---|
| EX-23.4 - EX-23.4 - Albertsons Companies, Inc. | d74618dex234.htm |
| EX-23.6 - EX-23.6 - Albertsons Companies, Inc. | d74618dex236.htm |
| EX-23.7 - EX-23.7 - Albertsons Companies, Inc. | d74618dex237.htm |
| EX-23.5 - EX-23.5 - Albertsons Companies, Inc. | d74618dex235.htm |
| EX-23.2 - EX-23.2 - Albertsons Companies, Inc. | d74618dex232.htm |
| EX-23.3 - EX-23.3 - Albertsons Companies, Inc. | d74618dex233.htm |
Table of Contents
As filed with the Securities and Exchange Commission on November 23, 2015
Registration No. 333–205546
UNITED STATES
SECURITIES AND EXCHANGE COMMISSION
Washington, D.C. 20549
AMENDMENT NO. 4
TO
FORM S-1
REGISTRATION STATEMENT
UNDER THE SECURITIES ACT OF 1933
Albertsons Companies, Inc.
(Exact name of registrant as specified in its charter)
| Delaware | 5411 | 47-4376911 | ||
| (State or other jurisdiction of incorporation or organization) |
(Primary Standard Industrial Classification Code Number) |
(I.R.S. Employer Identification No.) |
250 Parkcenter Blvd.
Boise, ID 83706
208-395-6200
(Address, including zip code, and telephone number, including area code, of registrant’s principal executive offices)
Robert A. Gordon, Esq.
Executive Vice President and General Counsel
Albertsons Companies, Inc.
250 Parkcenter Blvd.
Boise, ID 83706
(208) 395-6200
(Name, address, including zip code, and telephone number, including area code, of agent for service)
Copies to:
| Stuart D. Freedman, Esq. Michael R. Littenberg, Esq. Schulte Roth & Zabel LLP 919 Third Avenue New York, NY 10022 Phone: (212) 756-2000 Fax: (212) 593-5955 |
William M. Hartnett, Esq. Jonathan A. Schaffzin, Esq. William J. Miller, Esq. Cahill Gordon & Reindel LLP 80 Pine Street New York, NY 10005 Phone: (212) 701-3000 Fax: (212) 378-2500 |
Approximate date of commencement of proposed sale to the public: As soon as practicable after the effectiveness of this Registration Statement.
If any of the securities being registered on this Form are to be offered on a delayed or continuous basis pursuant to Rule 415 under the Securities Act of 1933, check the following box. ¨
If this Form is filed to register additional securities for an offering pursuant to Rule 462(b) under the Securities Act, please check the following box and list the Securities Act registration statement number of the earlier effective registration statement for the same offering. ¨
If this Form is a post-effective amendment filed pursuant to Rule 462(c) under the Securities Act, check the following box and list the Securities Act registration statement number of the earlier effective registration statement for the same offering. ¨
If this Form is a post-effective amendment filed pursuant to Rule 462(d) under the Securities Act, check the following box and list the Securities Act registration statement number of the earlier effective registration statement for the same offering. ¨
Indicate by check mark whether the registrant is a large accelerated filer, an accelerated filer, a non-accelerated filer, or a smaller reporting company. See the definitions of “large accelerated filer,” “accelerated filer” and “smaller reporting company” in Rule 12b-2 of the Exchange Act. (Check one):
| Large accelerated filer | ¨ | Accelerated filer | ¨ | |||
| Non-accelerated filer | x (Do not check if a smaller reporting company) | Smaller reporting company | ¨ |
The registrant hereby amends this registration statement on such date or dates as may be necessary to delay its effective date until the registrant shall file a further amendment which specifically states that this registration statement shall thereafter become effective in accordance with section 8(a) of the Securities Act of 1933 or until the registration statement shall become effective on such date as the Commission, acting pursuant to said section 8(a), may determine.
Table of Contents
The information in this preliminary prospectus is not complete and may be changed. These securities may not be sold until the registration statement filed with the Securities and Exchange Commission is effective. This preliminary prospectus is not an offer to sell these securities and is not soliciting an offer to buy these securities in any jurisdiction where such offer or sale is not permitted.
Subject to completion. Dated November 23, 2015
65,306,122 Shares

Albertsons Companies, Inc.
Common Stock
This is an initial public offering of our common stock. We are offering 65,306,122 shares of our common stock. All of the shares of common stock are being sold by us.
We expect the initial public offering price to be between $23.00 and $26.00 per share. Currently, no public market exists for our common stock. We have been approved to list our common stock on the New York Stock Exchange (“NYSE”) under the symbol “ABS.”
Investing in our common stock involves a high degree of risk. See “Risk Factors” beginning on page 23 of this prospectus to read the factors you should consider before buying shares of the common stock.
Neither the Securities and Exchange Commission nor any state securities commission has approved or disapproved of these securities or passed upon the adequacy or accuracy of this prospectus. Any representation to the contrary is a criminal offense.
| Per Share | Total | |||||||
| Initial public offering price |
$ | $ | ||||||
| Underwriting discount and commissions(1) |
$ | $ | ||||||
| Proceeds, before expenses, to us |
$ | $ | ||||||
| (1) | The underwriters will also be reimbursed for certain expenses incurred in the offering. See “Underwriting (Conflicts of Interest)” for additional information regarding underwriting compensation. |
The underwriters may also purchase up to an additional 9,795,918 shares of common stock from us at the initial public offering price, less the underwriting discount and commissions, within 30 days from the date of this prospectus.
The underwriters expect to deliver the shares of our common stock to investors against payment on or about through the book-entry facilities of The Depository Trust Company.
| Goldman, Sachs & Co. | BofA Merrill Lynch | Citigroup | Morgan Stanley |
| Deutsche Bank Securities | Credit Suisse | Barclays |
| Lazard | Guggenheim Securities | Jefferies | RBC Capital Markets | Wells Fargo Securities |
| BMO Capital Markets | SunTrust Robinson Humphrey |
| Telsey Advisory Group | Academy Securities | Ramirez & Co., Inc. | Blaylock Beal Van, LLC |
The date of this prospectus is .
Table of Contents

Table of Contents
Prospectus
| Page | ||||
| 1 | ||||
| 23 | ||||
| 50 | ||||
| 52 | ||||
| 53 | ||||
| 54 | ||||
| 56 | ||||
| 58 | ||||
| 60 | ||||
| Supplemental Selected Historical Financial Information of Safeway |
61 | |||
| Unaudited Pro Forma Condensed Consolidated Financial Information |
62 | |||
| 73 | ||||
| Supplemental Management’s Discussion and Analysis of Results of Operations of Safeway |
104 | |||
| 112 | ||||
| 132 | ||||
| 142 | ||||
| 168 | ||||
| 176 | ||||
| 178 | ||||
| 184 | ||||
| 187 | ||||
| Certain U.S. Federal Income and Estate Tax Considerations to Non-U.S. Holders |
201 | |||
| 204 | ||||
| 211 | ||||
| 211 | ||||
| 211 | ||||
| F-1 | ||||
Until (25 days after the date of this prospectus), all dealers that buy, sell, or trade shares of our common stock, whether or not participating in our initial public offering, may be required to deliver a prospectus. This delivery requirement is in addition to the obligation of dealers to deliver a prospectus when acting as underwriters and with respect to their unsold allotments or subscriptions.
Unless indicated otherwise, the information included in this prospectus assumes that (i) the shares of common stock to be sold in this offering are sold at $24.50 per share, which is the midpoint of the estimated offering range set forth on the cover page of this prospectus and (ii) all shares offered by us in this offering are sold.
We and the underwriters have not authorized anyone to provide any information other than that contained in this prospectus or in any free writing prospectus prepared by or on behalf of us or to which we have referred you. We and the underwriters take no responsibility for, and can provide no assurance as to the reliability of, any other information that others may give you. We and the underwriters are offering to sell, and seeking offers to buy, shares of our common stock only in jurisdictions where offers and sales are permitted. The information in this prospectus is accurate only as of the date of this prospectus, regardless of the time of delivery of this prospectus or any sale of shares of our common stock.
i
Table of Contents
EXPLANATORY NOTE
Albertsons Companies, Inc., the registrant whose name appears on the cover of this registration statement, is a newly formed Delaware corporation. Shares of common stock of Albertsons Companies, Inc. are being offered by the prospectus that forms a part of this registration statement. AB Acquisition LLC (“AB Acquisition”) is a Delaware limited liability company. Albertsons Companies, Inc. was formed solely for the purpose of reorganizing the organizational structure of AB Acquisition and its direct and indirect consolidated subsidiaries in order for the registrant to be a corporation rather than a limited liability company. In connection with, and prior to and/or concurrently with the closing of, this offering, each member of AB Acquisition will directly or indirectly contribute all of its equity interests in AB Acquisition to Albertsons Companies, Inc. in exchange for shares of common stock of Albertsons Companies, Inc. As a result, AB Acquisition and its direct and indirect consolidated subsidiaries will become wholly-owned subsidiaries of Albertsons Companies, Inc. See “IPO-Related Transactions and Organizational Structure” for additional information.
As used in this prospectus, unless the context otherwise requires, references to (i) the terms “company,” “AB Acquisition,” “Albertsons Companies, Inc.,” “we,” “us” and “our” refer to AB Acquisition LLC and its consolidated subsidiaries for periods prior to the consummation of the IPO-Related Transactions (as defined herein), and, for periods as of and following the consummation of the IPO-Related Transactions, to Albertsons Companies, Inc. and its consolidated subsidiaries, (ii) the terms “Albertsons” and “Albertson’s Holdings” refer to Albertson’s LLC and Albertson’s Holdings LLC, and, where appropriate, their subsidiaries, (iii) the term “NAI” refers to New Albertson’s, Inc., and, where appropriate, its subsidiaries, (iv) the term “NAI Holdings” refers to NAI Holdings LLC, and, where appropriate, its subsidiaries, (v) the term “United” refers to United Supermarkets, LLC, (vi) the term “Safeway” refers to Safeway Inc. and, where appropriate, its subsidiaries, and (vii) references to our “Sponsors” or the “Cerberus-led Consortium” refer to, collectively, Cerberus Capital Management, L.P. (“Cerberus”), Kimco Realty Corporation (“Kimco Realty”), Klaff Realty, LP (“Klaff Realty”), Lubert-Adler Partners, L.P. (“Lubert-Adler”), Schottenstein Stores Corporation (“Schottenstein Stores”) and their respective controlled affiliates and investment funds. For the convenience of the reader, except as the context otherwise requires, all information included in this prospectus is presented giving effect to the consummation of the IPO-Related Transactions.
BASIS OF PRESENTATION
Prior to or concurrently with this offering, we will effect the IPO-Related Transactions described under “IPO-Related Transactions and Organizational Structure.” The consolidated financial statements and consolidated financial data included in the prospectus are those of AB Acquisition and its consolidated subsidiaries and do not give effect to the IPO-Related Transactions. Other than the audited balance sheet, dated as of June 23, 2015, and the unaudited balance sheets, dated as of September 12, 2015, the historical financial information of Albertsons Companies, Inc. has not been included in this prospectus as it is a newly incorporated entity, has had no business transactions or activities to date and had no assets or liabilities during the periods presented in this prospectus.
We acquired Safeway on January 30, 2015, United on December 29, 2013 and NAI on March 21, 2013. Accordingly, this prospectus also includes the following historical financial statements:
| • | audited balance sheets of Safeway as of January 3, 2015 and December 28, 2013 and audited consolidated statements of income, comprehensive income (loss), stockholders’ equity and cash flows of Safeway for the 53 weeks ended January 3, 2015 and the 52 weeks ended December 28, 2013 and December 29, 2012; |
ii
Table of Contents
| • | audited balance sheets of NAI as of February 21, 2013 and February 23, 2012 and combined statements of operations and comprehensive income (loss), parent company deficit and cash flows of NAI for the 52 weeks ended February 21, 2013, February 23, 2012 and February 24, 2011; and |
| • | audited balance sheets of United as of December 28, 2013 and January 26, 2013 and statements of comprehensive income, members’ equity and cash flows of United for the 48 weeks ended December 28, 2013 and the year ended January 26, 2013. |
We use a 52 or 53 week fiscal year ending on the last Saturday in February each year. Prior to fiscal year 2014, we used a 52 or 53 week fiscal year ending on the closest Thursday before the last Saturday in February each year. For ease of reference, unless the context otherwise indicates, we identify our fiscal years in this prospectus by reference to the calendar year of the first day of such fiscal year. For example, “fiscal 2014” refers to our fiscal year ended February 28, 2015 and “fiscal 2015” refers to our fiscal year ending February 27, 2016. Our first quarter consists of 16 weeks, and our second, third and fourth quarters generally consist of 12 weeks. For the fiscal year ended February 28, 2015, the fourth quarter included 13 weeks, and the fiscal year included 53 weeks. The fiscal years ended February 20, 2014, February 21, 2013, February 23, 2012 and February 24, 2011 included 52 weeks. Safeway’s last three fiscal years prior to the Safeway acquisition consisted of the 53-week period ended January 3, 2015, the 52-week period ended December 28, 2013 and the 52-week period ended December 29, 2012.
IDENTICAL STORE SALES
As used in this prospectus, the term “identical store sales” is defined as stores operating during the same period in both the current year and the prior year, comparing sales on a daily basis. Fuel sales are excluded from identical store sales, and internet sales are included in identical store sales of the store from which the products are sourced. Fiscal 2014 is compared with the 53-week period ending February 27, 2014. Acquired stores become identical on the one-year anniversary date of their acquisition. Stores that are open during remodeling are included in identical store sales. The stores divested in order to secure Federal Trade Commission (“FTC”) clearance of the Safeway acquisition are excluded from the identical store sales calculation beginning on December 19, 2014, the announcement date of the divestitures. Also included in this prospectus, where noted, are supplemental identical store sales measures for acquired stores calculated irrespective of their acquisition dates.
PRO FORMA INFORMATION
This prospectus contains unaudited pro forma financial information prepared in accordance with Article 11 of Regulation S-X. The unaudited pro forma condensed consolidated statement of continuing operations for fiscal 2014 gives pro forma effect to:
| • | our January 2015 acquisition of Safeway and the related financing, including the effects of FTC-mandated divestitures and the sale of Property Development Centers, LLC (“PDC”) (collectively, the “Safeway Transactions”); |
| • | the IPO-Related Transactions; and |
| • | the issuance of 65,306,122 shares of common stock in this offering and the application of the estimated net proceeds from the sale of such shares to repay certain existing debt and to pay fees and expenses related to this offering, as described in “Use of Proceeds,” |
in each case as if such transactions had been consummated on February 21, 2014, the first day of fiscal 2014. The unaudited pro forma condensed consolidated statement of continuing operations for
iii
Table of Contents
the first two quarters of fiscal 2014 gives pro forma effect to the Safeway Transactions as if they had been consummated on February 21, 2014, the first day of fiscal 2014. The unaudited pro forma condensed consolidated statement of continuing operations for the first two quarters of fiscal 2015 gives pro forma effect to the Safeway Transactions, the IPO-Related Transactions and this offering as if such transactions had occurred on February 21, 2014, the first day of fiscal 2014. The unaudited pro forma condensed consolidated balance sheet as of September 12, 2015 gives pro forma effect to the IPO-Related Transactions and this offering as if such transactions had occurred on September 12, 2015. See “Unaudited Pro Forma Condensed Consolidated Financial Information.”
TRADEMARKS AND TRADE NAMES
This prospectus includes our trademarks and service marks, including ALBERTSONS®, SAFEWAY®, ACME®, AMIGOS®, CARRS®, JEWEL-OSCO®, MARKET STREET®, PAVILIONS®, RANDALLS®, SAV-ON®, SHAW’S®, STAR MARKET®, TOM THUMB®, UNITED EXPRESS®, UNITED SUPERMARKETS®, VONS®, EATING RIGHT®, LUCERNE®, O ORGANICS®, OPEN NATURE®, MyMixx® and just for U®, which are protected under applicable intellectual property laws and are the property of our company and its subsidiaries. This prospectus also contains trademarks, service marks, trade names and copyrights of other companies, which are the property of their respective owners. Solely for convenience, trademarks and trade names referred to in this prospectus may appear without the ® or TM symbols. We do not intend our use or display of other parties’ trademarks, trade names or service marks to imply, and such use or display should not be construed to imply, a relationship with, or endorsement or sponsorship of us by, these other parties.
MARKET, INDUSTRY AND OTHER DATA
This prospectus includes market and industry data and outlook, which are based on publicly available information, reports from government agencies, reports by market research firms and/or our own estimates based on our management’s knowledge of and experience in the markets and businesses in which we operate. We believe this information to be reasonable based on the information available to us as of the date of this prospectus. However, we have not independently verified market and industry data from third-party sources. Historical information regarding supermarket and grocery industry revenues, including online grocery revenues, was obtained from IBISWorld. Forecasts regarding Food-at-Home inflation were obtained from the U.S. Department of Agriculture. Information with respect to our market share was obtained from Nielsen ACView All Outlets Combined (Food, Mass and Dollar but excluding Drug) for the first and second quarters of 2015. This information may prove to be inaccurate because of the method by which we obtained some of the data for our estimates or because this information cannot always be verified with complete certainty due to limits on the availability and reliability of raw data, the voluntary nature of the data gathering process and other limitations and uncertainties inherent in a survey of market size. In addition, market conditions, customer preferences and the competitive landscape can and do change significantly. As a result, you should be aware that the market and industry data included in this prospectus and our estimates and beliefs based on such data may not be reliable. We do not make any representations as to the accuracy of such industry and market data.
In addition, the market value reported in the appraisals of the properties described herein are an estimate of value, as of the date stated in each appraisal. The appraisals were subject to the following assumption: The estimate of market value as is, is based on the assumption that the existing occupant/user remains in occupancy in the foreseeable future, commensurate with the typical tenure of a user of this type, and is paying market rent as of the effective date of appraisal. Changes since the appraisal date in external and market factors or in the property itself can significantly affect the conclusions. As
iv
Table of Contents
an opinion, the reported values are not necessarily a measure of current market value and may not reflect the amount which would be received if the property were sold today. While we and the underwriters are not aware of any misstatements regarding any appraisals, market, industry or similar data presented herein, such data involves risks and uncertainties and is subject to change based on various factors, including those discussed under the sections entitled “Special Note Regarding Forward-Looking Statements” and “Risk Factors” in this prospectus.
NON-GAAP FINANCIAL MEASURES
We define EBITDA as generally accepted accounting principles (“GAAP”) earnings (net income (loss)) before interest, income taxes, depreciation, and amortization. We define Adjusted EBITDA as earnings (net income (loss)) before interest, income taxes, depreciation, and amortization, further adjusted to eliminate the effects of items management does not consider in assessing our ongoing performance. We define Adjusted Net Income as GAAP net income (loss) adjusted to eliminate the effects of items management does not consider in assessing ongoing performance. See “Prospectus Summary—Summary Consolidated Historical and Pro Forma Financial and Other Data” for further discussion and a reconciliation of Adjusted EBITDA and Adjusted Net Income.
EBITDA, Adjusted EBITDA and Adjusted Net Income (collectively, the “Non-GAAP Measures”) are performance measures that provide supplemental information we believe is useful to analysts and investors to evaluate our ongoing results of operations, when considered alongside other GAAP measures such as net income, operating income and gross profit. These Non-GAAP Measures exclude the financial impact of items management does not consider in assessing our ongoing operating performance, and thereby facilitate review of our operating performance on a period-to-period basis. Other companies may have different capital structures or different lease terms, and comparability to our results of operations may be impacted by the effects of acquisition accounting on our depreciation and amortization. As a result of the effects of these factors and factors specific to other companies, we believe EBITDA, Adjusted EBITDA and Adjusted Net Income provide helpful information to analysts and investors to facilitate a comparison of our operating performance to that of other companies. We also use Adjusted EBITDA, as further adjusted for additional items defined in our debt instruments, for board of director and bank compliance reporting. Our presentation of Non-GAAP Measures should not be construed as an inference that our future results will be unaffected by unusual or non-recurring items.
Non-GAAP Measures have limitations as analytical tools, and you should not consider them in isolation or as substitutes for analysis of our operating results or cash flows as reported under GAAP. Some of these limitations are:
| • | Non-GAAP Measures do not reflect the anticipated synergies associated with the Safeway acquisition; |
| • | Non-GAAP Measures do not reflect certain one-time or non-recurring cash costs to achieve the anticipated synergies associated with the Safeway acquisition; |
| • | Non-GAAP Measures do not reflect changes in, or cash requirements for, our working capital needs; |
| • | EBITDA and Adjusted EBITDA do not reflect the significant interest expense or the cash requirements necessary to service interest or principal payments on our debt; |
| • | Although depreciation and amortization are non-cash charges, the assets being depreciated or amortized may have to be replaced in the future, and EBITDA and Adjusted EBITDA and, with respect to acquired intangible assets, Adjusted Net Income, do not reflect any cash requirements for such replacements; |
v
Table of Contents
| • | Non-GAAP Measures are adjusted for certain non-recurring and non-cash income or expense items that are reflected in our statements of operations; |
| • | Non-GAAP Measures do not reflect our cash expenditures or future requirements for capital expenditures or contractual commitments; and |
| • | Other companies in our industry may calculate these measures differently than we do, limiting their usefulness as comparative measures. |
Because of these limitations, Non-GAAP Measures should not be considered as measures of discretionary cash available to us to invest in the growth of our business. We compensate for these limitations by relying primarily on our GAAP results and using Non-GAAP Measures only for supplemental purposes. Please see our consolidated financial statements contained in this prospectus.
Pro Forma Adjusted EBITDA and Pro Forma Adjusted Net Income, as presented in this prospectus, are also supplemental measures of our performance that are not required by or presented in accordance with GAAP. See “Prospectus Summary—Summary Consolidated Historical and Pro Forma Financial and Other Data” for additional information.
vi
Table of Contents
This summary highlights the information contained elsewhere in this prospectus. This summary may not contain all of the information that may be important to you or that you should consider before buying shares of our common stock. You should read the entire prospectus carefully. The following summary is qualified in its entirety by, and should be read in conjunction with, the more detailed information appearing elsewhere in this prospectus. In particular, you should read the sections entitled “Risk Factors,” “Unaudited Pro Forma Condensed Consolidated Financial Information,” “Management’s Discussion and Analysis of Financial Condition and Results of Operations of AB Acquisition” and “Supplemental Management’s Discussion and Analysis of Results of Operations of Safeway” included elsewhere in this prospectus and our consolidated financial statements and the related notes.
OUR COMPANY
We are one of the largest food and drug retailers in the United States, with both strong local presence and national scale. As of September 12, 2015, we operated 2,196 stores across 33 states and the District of Columbia under 18 well-known banners, including Albertsons, Safeway, Vons, Jewel-Osco, Shaw’s, Acme, Tom Thumb, Randalls, United Supermarkets, Pavilions, Star Market and Carrs. We operate in 120 Metropolitan Statistical Areas in the United States (“MSAs”) and are ranked #1 or #2 by market share in 68% of them. We provide our customers with a service-oriented shopping experience, including convenient and value-added services through 1,702 pharmacies and 379 adjacent fuel centers. We have approximately 265,000 talented and dedicated employees serving on average more than 33 million customers each week.
Our operating philosophy is simple: we run great stores with a relentless focus on driving sales growth. We believe that our management team, with decades of collective experience in the food and drug retail industry, has developed a proven and successful operating playbook that differentiates us from our competitors.
We implement our playbook through a decentralized management structure. We believe this approach allows our division and district-level leadership teams to create a superior customer experience and deliver outstanding operating performance. These leadership teams are empowered and incentivized to make decisions on product assortment, placement, pricing, promotional plans and capital spending in the local communities and neighborhoods they serve. Our store directors are responsible for implementing our operating playbook on a daily basis and ensuring that our employees remain focused on delivering outstanding service to our customers.
We believe that the execution of our operating playbook, among other factors, including improved economic conditions and consumer confidence, has enabled us to grow sales, profitability and free cash flow across our business. During fiscal 2014 and the first and second quarters of fiscal 2015, excluding Safeway, our identical store sales grew at 6.8%, 5.1% and 5.7%, respectively. At Safeway, prior to our acquisition, the rate of identical store sales growth was 3.0% in fiscal 2014 and accelerated in the first and second quarters of fiscal 2015 to 3.8% and 4.9%, respectively. The rates of identical store sales growth for our stores, excluding Safeway, for fiscal 2014 and the second quarter of fiscal 2015 have been adjusted for the positive sales impact in one of our divisions within NAI during the second quarter of fiscal 2014 resulting from a labor dispute at a competitor that caused a temporary closure of its stores. Without adjusting for this impact, identical store sales growth for our stores, excluding Safeway, during fiscal 2014 and the second quarter of fiscal 2015 would have been 7.2% and 3.9%, respectively. We are currently executing on an annual synergy plan of approximately $800
1
Table of Contents
million related to the acquisition of Safeway, which we expect to achieve by the end of fiscal 2018. We expect to deliver annual run-rate synergies of approximately $440 million by the end of fiscal 2015.
For fiscal 2014 on a pro forma basis, we would have generated net sales of $57.5 billion, Adjusted EBITDA of $2.4 billion and free cash flow (which we define as Adjusted EBITDA less capital expenditures) of $1.5 billion. For the 12 months ended September 12, 2015, on a pro forma basis, we would have generated net sales of $58.1 billion, Adjusted EBITDA of $2.5 billion and free cash flow of $1.6 billion. For the first two quarters of fiscal 2015, we generated net sales of $31.5 billion, Adjusted EBITDA of $1.3 billion and free cash flow of $817 million. In addition to realizing increased sales, profitability and free cash flow through the implementation of our operating playbook, we expect synergies from the Safeway acquisition to enhance our profitability and free cash flow over the next few years.
OUR INTEGRATION HISTORY
Over the past nine years, we have completed a series of acquisitions, beginning with our purchase of Albertson’s LLC in 2006 (the “Legacy Albertsons Stores”). This was followed in March 2013 by our acquisition of NAI from SUPERVALU INC. (“SuperValu”), which included the Albertsons stores that we did not already own (the “SVU Albertsons Stores” and, together with the Legacy Albertsons Stores, the “Albertsons Stores”) and stores operating under the Acme, Jewel-Osco, Shaw’s and Star Market banners (the “NAI Stores”). In December 2013, we acquired United, a regional grocery chain in North and West Texas. In January 2015, we acquired Safeway in a transaction that significantly increased our scale and geographic reach. We have also completed the divestiture of 168 stores required by the FTC in connection with the Safeway acquisition.
OUR OPERATING PLAYBOOK
Our operating playbook covers every major facet of store-level operations and is executed by local leadership under the supervision of our executive management team. Our playbook is based on the following key concepts:
| • | Operate Our Stores to the Highest Standards. We ensure that our stores are always “full, fresh, friendly and clean.” Our efforts are driven through our rigorous G.O.L.D. (Grand Opening Look Daily) program that is focused on delivering fresh offerings, well-stocked shelves, and clean and brightly lit departments. |
| • | Deliver Superior Customer Service. We focus on providing superior customer service. We consistently invest in store labor and training, and our simple and well-understood sales- and EBITDA-based bonus structure ensures that our employees are properly incentivized. We measure customer satisfaction scores weekly and hold management accountable for continuous improvement. Our focus on customer service is reflected in our improving customer satisfaction scores and identical store sales growth. |
| • | Provide a Compelling Product Offering. We focus on providing the highest quality fresh, natural and organic assortments to meet the demands of our customers, including through our private label brands, which we refer to as our own brands, such as Open Nature and O Organics. In addition, we offer high-volume, high-quality and differentiated signature products, including fresh fruit and vegetables cut in-store, cookies and fried chicken prepared using our proprietary recipes, in-store roasted turkey and freshly baked bread. Our decentralized operating structure enables our divisions to offer products that are responsive to local tastes and preferences. |
2
Table of Contents
| • | Offer an Attractive Value Proposition to Our Customers. We maintain price competitiveness through systematic, selective and thoughtful price investment to drive customer traffic and basket size. We also use our loyalty programs, including just for U, MyMixx and our fuel-based rewards programs, as well as our strong own brand assortment, to improve customer perception of our value proposition. |
| • | Drive Innovation Across our Network of Stores. We focus on innovation to enhance our customers’ in-store experience, generate customer loyalty and drive traffic and sales growth. We ensure that our stores benefit from modern décor, fixtures and store layout. We systematically monitor emerging trends in food and source new and innovative products to offer in our stores. In addition, we are focused on continuing to deliver personalized and promotional offers to further develop our relationship with our customers and on expanding our online and home delivery options. |
| • | Make Disciplined Capital Investments. We believe that our store base is modern and in excellent condition. We apply a disciplined approach to our capital investments, undertaking a rigorous cost-benefit analysis and targeting an attractive return on investment. Our capital budgets are subject to approval at the corporate level, but we empower our division leadership to prudently allocate capital to projects that will generate the highest return. |
3
Table of Contents
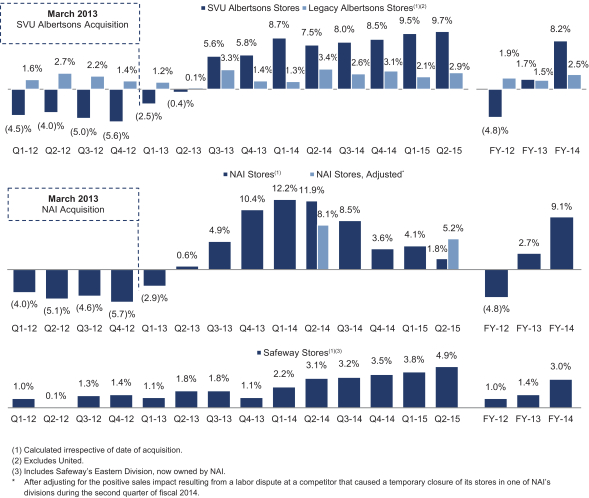
IDENTICAL STORES SALES
We believe that the execution of our operating playbook has been an important factor in the acceleration of identical store sales growth across the SVU Albertsons Stores, the NAI Stores and the Safeway stores. The charts below illustrate historical identical store sales growth across the Albertsons Stores, the NAI Stores and the Safeway stores:
4
Table of Contents
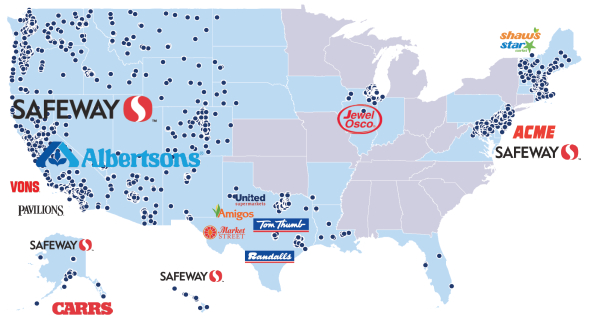
The following illustrative map represents our regional banners and combined store network as of September 12, 2015. We also operate 30 strategically located distribution centers and 21 manufacturing facilities. Approximately 48% of our operating stores are owned or ground-leased. Together, our owned and ground-leased properties have a value of approximately $10.5 billion.
OUR COMPETITIVE STRENGTHS
We believe the following strengths differentiate us from our competitors and contribute to our ongoing success:
Powerful Combination of Strong Local Presence and National Scale. We operate a portfolio of well-known banners with both strong local presence and national scale. We have leading positions in many of the largest and fastest-growing MSAs in the United States. Given the long operating history of our banners, many of our stores form an important part of the local communities and neighborhoods in which they operate and occupy “First-and-Main” locations. We believe that our combination of local presence and national scale provides us with competitive advantages in brand recognition, customer loyalty and purchasing, marketing and advertising and distribution efficiencies.
Best-in-Class Management Team with a Proven Track Record. We have assembled a best-in-class management team with decades of operating experience in the food and drug retail industry. Our Chairman and Chief Executive Officer, Bob Miller, has over 50 years of food and drug retail experience, including serving as Chairman and CEO of Fred Meyer and Rite Aid and Vice Chairman of Kroger. We have created an Office of the CEO to set long-term strategy and annual objectives for our 14 divisions. The Office of the CEO is comprised of Bob Miller, Wayne Denningham (Chief Operating Officer), Justin Dye (Chief Administrative Officer) and Shane Sampson (Chief Marketing and Merchandising Officer), each of whom brings significant leadership and operational experience with long tenures at our company and within the industry. Our Executive and Senior Vice Presidents and our division, district and store-level leadership teams are also critical to the success of our business. Our nine Executive Vice Presidents, 15 Senior Vice Presidents and 14 division Presidents have an average of almost 23, 24 and 32 years of service, respectively, with our company.
5
Table of Contents
Proven Operating Playbook. We believe that the execution of our operating playbook has been an important factor in enabling us to accelerate identical store sales growth. In the first and second quarters of fiscal 2015, we delivered identical store sales growth of 9.5% and 9.7%, respectively, across the SVU Albertsons Stores, and 4.1% and 5.2%, respectively, across the NAI Stores, compared to positive identical store sales growth of 8.7% and 7.5%, across the SVU Albertsons Stores and 12.2% and 8.1%, respectively, across the NAI Stores, in the first and second quarters of fiscal 2014. Our Safeway stores delivered identical store sales growth of 3.0% in fiscal 2014, and 3.8% and 4.9% identical store sales growth in the first and second quarters of fiscal 2015, respectively. The rates of identical store sales growth for the NAI Stores for the second quarters of fiscal 2014 and 2015 have been adjusted for the positive sales impact during the second quarter of fiscal 2014 resulting from a labor dispute at a competitor that caused a temporary closure of its stores. Without adjusting for this impact, the NAI Stores’ identical store sales growth for the second quarters of fiscal 2014 and 2015 would have been 11.9% and 1.8%, respectively.
Strong Free Cash Flow Generation. Our strong operating results, in combination with our disciplined approach to capital allocation, have resulted in the generation of strong free cash flow. On a pro forma basis, we would have generated free cash flow of approximately $1.5 billion in fiscal 2014. Our ability to grow free cash flow will be enhanced by the synergies we expect to achieve from our acquisition of Safeway. We expect to deliver approximately $800 million of annual synergies by the end of fiscal 2018, including approximately $440 million on an annual run-rate basis by the end of fiscal 2015.
Significant Acquisition and Integration Expertise. Growth through acquisition is an important component of our strategy, both to enhance our competitiveness in existing markets (as with recent acquisitions for our Jewel-Osco banner) and to expand our footprint into new markets (as with the United acquisition). On July 19, 2015, we entered into an agreement with The Great Atlantic & Pacific Tea Company, Inc. (“A&P”) pursuant to which we are acquiring 71 stores for our Acme banner. We continually review acquisition opportunities that we believe are synergistic with our existing store network. We have developed a proprietary and repeatable blueprint for integration, including a clearly defined plan for the first 100 days. We believe that our ability to integrate acquisitions is significantly enhanced by our decentralized approach, which allows us to leverage the expertise of incumbent local management teams. We have also developed significant expertise in synergy planning and delivery. We believe that the acquisition and integration experience of our management team, together with the considerable transactional expertise of our equity sponsors, positions us well for future acquisitions as the food and drug retail industry continues to consolidate.
OUR STRATEGY
Our operating philosophy is simple: we run great stores with a relentless focus on sales growth. We believe there are significant opportunities to grow sales and enhance profitability and free cash flow through execution of the following strategies:
Continue to Drive Identical Store Sales Growth. Consistent with our operating playbook, we plan to deliver identical store sales growth by implementing the following initiatives:
| • | Enhancing and Upgrading Our Fresh, Natural and Organic Offerings and Signature Products. We continue to enhance and upgrade our fresh, natural and organic offerings across our meat, produce, service deli and bakery departments to meet the changing tastes and preferences of our customers. We also believe that continued innovation and expansion of our high-volume, high-quality and differentiated signature products will contribute to stronger sales growth. |
6
Table of Contents
| • | Expanding Our Own Brand Offerings. We continue to drive sales growth and profitability by extending our own brand offerings across our banners, including high-quality and recognizable brands such as O Organics, Open Nature, Eating Right and Lucerne. |
| • | Leveraging Our Effective and Scalable Loyalty Programs. We believe we can grow basket size and improve the shopping experience for our customers by expanding our just for U, MyMixx and fuel-based loyalty programs. In addition, we believe we can further enhance our merchandising and marketing programs by utilizing our customer analytics capabilities, including advanced digital marketing and mobile applications, and through the expansion of our online and home delivery options. |
| • | Capitalizing on Demand for Health and Wellness Services. We intend to leverage our portfolio of pharmacies and our growing network of wellness clinics to capitalize on increasing customer demand for health and wellness services. Pharmacy customers are among our most loyal, and their average weekly spend is over 2.5x that of our non-pharmacy customers. We plan to continue to grow our pharmacy script counts through new patient prescription transfer programs and initiatives such as clinic, hospital and preferred network partnerships, which we believe will expand our access to patients. We believe that these efforts will drive sales growth and generate customer loyalty. |
| • | Continuously Evaluating and Upgrading Our Store Portfolio. We plan to pursue a disciplined capital allocation strategy to upgrade, remodel and relocate stores to attract customers to our stores and to increase store volumes. We believe that our store base is in excellent condition, and we have developed a remodel strategy that is both cost-efficient and effective. |
| • | Driving Innovation. We intend to drive traffic and sales growth through constant innovation. We will remain focused on identifying emerging trends in food and sourcing new and innovative products. We will also seek to build new, and enhance existing, customer relationships through our digital capabilities. |
| • | Sharing Best Practices Across Divisions. Our division leaders collaborate to ensure the rapid sharing of best practices. Recent examples include the expansion of our O Organics offering across banners, the accelerated roll-out of signature products such as Albertsons’ fresh fruit and vegetables cut in-store and a broader assortment and new fixtures for our wine and floral shops, implementing Safeway’s successful strategy across many of our banners. |
We believe the combination of these actions and initiatives, together with the attractive industry trends described in more detail under “Business—Our Industry,” will continue to drive identical store sales growth.
Enhance Our Operating Margin. Our focus on identical store sales growth provides an opportunity to enhance our operating margin by leveraging our fixed costs. We plan to realize further margin benefit through added scale from partnering with vendors and by achieving efficiencies in manufacturing and distribution. In addition, we maintain a disciplined approach to expense management and budgeting.
Implement Our Synergy Realization Plan. We are currently executing on an annual synergy plan of approximately $800 million from the acquisition of Safeway, which we expect to achieve by the end of fiscal 2018, with associated one-time costs of approximately $690 million (net of estimated synergy-related asset sale proceeds). Our detailed synergy plan was developed on a bottom-up, function-by-function basis by combined Albertsons and Safeway teams. The plan includes capturing opportunities from corporate and division cost savings, simplifying business processes and rationalizing headcount. Over time, Safeway’s information technology systems will support all of our
7
Table of Contents
stores, distribution centers and systems, including financial reporting and payroll processing, as we wind down our transition services agreement for our Albertsons, Acme, Jewel-Osco, Shaw’s and Star Market banners with SuperValu on a store-by-store basis. We anticipate extending the expansive and high-quality own brand program developed at Safeway across all of our banners. We believe our increased scale will help us to optimize and improve our vendor relationships. We also plan to achieve marketing and advertising savings from lower print, production and broadcast rates in overlapping regions and reduced agency spend. Finally, we intend to consolidate managed care provider reimbursement programs, increase vaccine penetration and leverage our combined scale. We expect to achieve synergies from the Safeway acquisition of approximately $200 million during fiscal 2015, or $440 million on an annual run-rate basis, by the end of fiscal 2015. Approximately 80% of our $800 million annual synergy target is independent of sales growth, which we believe significantly reduces the risk of achieving our target.
Selectively Grow Our Store Base Organically and Through Acquisition. We intend to continue to grow our store base organically through disciplined investment in new stores. We believe our healthy balance sheet and decentralized structure also provide us with strategic flexibility and a strong platform to make further acquisitions. We evaluate strategic acquisition opportunities on an ongoing basis as we seek to strengthen our competitive position in existing markets or expand our footprint into new markets. We believe selected acquisitions and our successful track record of integration and synergy delivery provide us with an opportunity to further enhance sales growth, leverage our cost structure and increase profitability and free cash flow.
OUR INDUSTRY
We operate in the $584 billion U.S. food and drug retail industry, a highly fragmented sector with a large number of companies competing locally and a limited number of companies with a national footprint. From 2010 through 2014, food and drug retail industry revenues increased at an average annual rate of 1.3%, driven in part by improving macroeconomic factors, including gross domestic product, household disposable income, consumer confidence and employment. Food-at-Home inflation is forecasted to be 1.5% to 2.5% in 2015, and 2.0% to 3.0% in 2016, which should also benefit industry sales. In addition to macroeconomic factors, the following trends, in particular, are expected to drive sales growth across the industry:
| • | Customer Focus on Fresh, Natural and Organic Offerings. Evolving customer tastes and preferences have caused food retailers to improve the breadth and quality of their fresh, natural, and organic offerings. This, in turn, has resulted in the increasing convergence of product selections between conventional and alternative format food retailers. |
| • | Converging Approach to Health and Wellness. Customers increasingly view their food shopping experience as part of a broader approach to health and wellness. As a result, food retailers are seeking to drive sales growth and customer loyalty by incorporating pharmacy and wellness clinic offerings in their stores. |
| • | Increased Customer Acceptance of Own Brand Offerings. Increased customer acceptance has driven growth in demand for own brand offerings, including the introduction of premium store brands. In general, own brand offerings have a higher gross margin than similarly positioned products of national brands. |
| • | Loyalty Programs and Personalization. To remain competitive and generate customer loyalty, food retailers are increasing their focus on loyalty programs that target the delivery of personalized offers to their customers. |
8
Table of Contents
| • | Convenience as a Differentiator. Industry participants are addressing customers’ desire for convenience through in-store amenities, including store-within-store sites such as coffee bars, banks and ATMs. |
RISKS RELATED TO OUR BUSINESS AND THIS OFFERING
An investment in our common stock involves a high degree of risk. You should carefully consider the risks highlighted in the section entitled “Risk Factors” following this prospectus summary before making an investment decision. These risks include, among others, the following:
| • | Various operating factors and general economic conditions affecting the food retail industry may adversely affect our business and operating results. |
| • | Competition in our industry is intense, and our failure to compete successfully may adversely affect our profitability and results of operations. |
| • | Increased commodity prices may adversely impact our profitability. |
| • | Integrating acquisitions may be time-consuming and create costs that could reduce our net income and cash flows. |
| • | We may be adversely affected by risks related to our dependence on information technology (“IT”) systems. Any future intrusion into these IT systems, even if we are compliant with industry security standards, could materially adversely affect our reputation, financial condition and operating results. |
| • | We may not be able to achieve the full amount of synergies that are anticipated, or achieve the synergies on the schedule anticipated, from the Safeway acquisition. |
| • | Our substantial level of indebtedness could adversely affect our financial condition and prevent us from fulfilling our obligations under our indebtedness. |
| • | Our debt instruments limit our flexibility in operating our business. |
| • | There is no existing market for our common stock, and we do not know if one will develop to provide you with adequate liquidity. If our stock price fluctuates after this offering, you could lose a significant part of your investment. |
9
Table of Contents
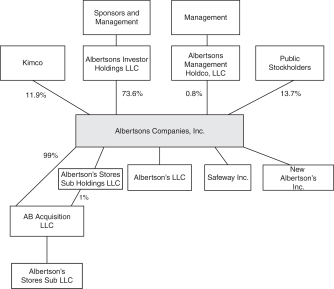
OUR CORPORATE STRUCTURE
Our business is currently conducted through our operating subsidiaries, which are wholly-owned by AB Acquisition. The equity interests of AB Acquisition immediately prior to the IPO-Related Transactions were owned (directly and indirectly) by entities affiliated with our Sponsors and certain current and former members of our management, whom we refer to as our “Existing Owners.” Albertsons Companies, Inc. is a newly formed entity.
In order to effectuate this offering, we expect to effect the following series of transactions prior to and/or concurrently with the closing of this offering that will result in the reorganization of our business so that it is owned by Albertsons Companies, Inc. Specifically, (i) our Existing Owners, other than KRS AB Acquisition, LLC and KRS ABS, LLC (collectively, “Kimco”) and Albertsons Management Holdco, LLC (“Management Holdco”), will contribute all of their direct and indirect equity interests in AB Acquisition to Albertsons Investor Holdings LLC (“Albertsons Investor”), including their interests in NAI Group Holdings Inc. (“NAI Group Holdings”) and Safeway Group Holdings Inc. (“Safeway Group Holdings”), (ii) Albertsons Investor, Kimco and Management Holdco will contribute all of their equity interests in AB Acquisition to Albertsons Companies, Inc. in exchange for common stock of Albertsons Companies, Inc., (iii) NAI Group Holdings, Safeway Group Holdings and other special purpose corporations owned by certain of the Sponsors through which they invested in AB Acquisition will be merged with and into Albertsons Companies, Inc., with Albertsons Companies, Inc. remaining as the surviving corporation in the mergers and (iv) certain stores owned by Albertson’s LLC will be contributed to a newly formed subsidiary, Albertson’s Stores Sub LLC, which subsidiary will be distributed to its ultimate owner AB Acquisition, AB Acquisition will transfer all of its equity interests in Albertson’s Holdings LLC and NAI Holdings LLC to Albertsons Companies, Inc. and Albertson’s Holdings LLC will be merged with and into Albertsons Companies, Inc. with Albertsons Companies, Inc. remaining as the surviving corporation in the merger. In addition, we expect to effect the merger of NAI Holdings LLC with and into Albertsons Companies, Inc. following the closing of this offering. As a result of the foregoing transactions, an aggregate of 349,832,761, 56,429,497 and 3,570,701 shares of our common stock will be owned by Albertsons Investor, Kimco and Management Holdco, respectively.
The chart below summarizes our corporate structure after giving effect to this offering and the IPO-Related Transactions, but before giving effect to dilution from outstanding restricted stock units or the exercise of the underwriters’ option to purchase additional shares:
For a further discussion of the IPO-Related Transactions, see “IPO-Related Transactions and Organizational Structure.”
10
Table of Contents
RECENT DEVELOPMENTS
A&P Transaction
On July 19, 2015, we entered into an asset purchase agreement, pursuant to which our wholly owned subsidiary, Acme Markets, Inc. (“Acme Markets”) agreed to acquire 76 stores operated by A&P pursuant to Section 363 of Chapter 11 of the United States Bankruptcy Code. We have exercised our right to exclude certain stores from our purchase and, as a result, we will purchase 71 stores. The purchase price for the 71 stores is approximately $319 million, including the cost of acquired inventory. In addition, we will assume certain operating leases with a gross lease obligation of $323 million. The acquired stores, which are principally located in the northern New York City suburbs, northern New Jersey and the greater Philadelphia area, are complementary to Acme Markets existing store and distribution base and will be re-bannered as Acme stores. The 71 stores had sales of $1.45 billion during A&P’s last fiscal year ended April 30, 2015. For the trailing twelve month period ended May 23, 2015, the acquired stores contributed approximately $103 million to A&P’s EBITDA (defined as earnings before interest, taxes, depreciation and amortization as further adjusted for certain quality of earnings adjustments (as determined by our management)). We expect to incur approximately $126 million of one-time opening and transition costs and capital expenditures to remodel and remerchandise the stores and to invest in price and labor. We anticipate achieving annual synergies of approximately $47 million within four years of completion of the acquisition. We funded an initial deposit of approximately $64 million into an escrow account on July 20, 2015. On November 10, 2015, NAI entered into an amendment to the NAI Term Loan Agreement (as defined herein) and borrowed an additional $300 million to fund the balance of the purchase price. We refer to this acquisition in this prospectus as the “A&P Transaction.”
The A&P Transaction received approval from the United States Bankruptcy Court for the Southern District of New York on September 21, 2015 and the waiting period under the Hart-Scott-Rodino Antitrust Improvements Act terminated on September 15, 2015. We have completed the acquisition of 65 A&P stores as of November 13, 2015, and we expect the acquisition of the remaining A&P stores to be completed during the third quarter of fiscal 2015.
Our company and A&P participate in four of the same multiemployer pension plans. The bankruptcy of A&P is expected to adversely affect the funding of these pension plans. Our bid also includes some of the A&P stores that contribute to five plans to which we do not contribute. We estimate that our share of the unfunded actuarial liability in the four plans to which we and A&P both contribute would increase by approximately $58 million for the stores we intend to acquire, and that our share of the unfunded actuarial liability in the additional five plans would be approximately $23 million. The A&P Transaction involves certain risks associated with integrating this acquisition with our business and the achievement of expected synergies. See “Risk Factors—Risks Related to the Safeway and A&P Acquisitions and Integration.”
Anticipated Refinancing
We have had preliminary discussions with potential lenders, financial intermediaries and advisors and following the consummation of this offering, subject to market conditions, we intend to enter into new financing facilities, consisting of a new $4,000 million senior secured ABL facility (the “New ABL Agreement”), a new senior secured term loan facility (which we expect to be in the form of an amended and restated version of the existing ABS/Safeway Term Loan Agreement (as defined herein) (the “New Term Loan Agreement,” and together with the New ABL Loan Agreement, the “New Credit Facilities”)), and new senior unsecured notes (the “New Notes,” and together with the New Credit Facilities, the
11
Table of Contents
“New Financing Facilities”). We refer to these refinancings as the “Anticipated Refinancing.” If we enter into the New Financing Facilities, we may use the proceeds thereof to repay all amounts outstanding under, and to terminate, the ABS/Safeway ABL Agreement, the NAI ABL Agreement and the Letter of Credit Facility Agreement (each as defined herein and collectively, the “Specified Existing Facilities”) and all amounts outstanding under the existing ABS/Safeway Term Loan Agreement. This offering is not contingent upon our entering into the New Financing Facilities, and there can be no assurance that we will enter into the New Financing Facilities and terminate the Specified Existing Facilities following the consummation of this offering, or at all, and we may elect not to proceed with the Anticipated Refinancing. See “Description of Indebtedness—Anticipated Refinancing Facilities” and “Risk Factors—Risks Relating to Our Indebtedness—We may be unable to complete the Anticipated Refinancing, or we may decide not to pursue the Anticipated Refinancing.”
CORPORATE INFORMATION
Albertsons Companies, Inc. is a Delaware corporation that was incorporated on June 23, 2015 to undertake this offering. Our principal executive offices are located at 250 Parkcenter Blvd., Boise, ID 83706. Our telephone number is (208) 395-6200 and our internet address is www.albertsons.com. Our website and the information contained thereon are not part of this prospectus and should not be relied upon by prospective investors in connection with any decision to purchase our common shares.
OUR EQUITY SPONSORS
We believe that one of our strengths is our relationship with our Sponsors. We believe we will benefit from our Sponsors’ experience in the retail industry, their expertise in mergers and acquisitions and real estate, and their support on various near-term and long-term strategic initiatives.
Cerberus. Established in 1992, Cerberus and its affiliated group of funds and companies comprise one of the world’s leading private investment firms with approximately $29 billion of capital under management in four primary strategies: control and non-control private equity investments, distressed securities and assets, commercial mid-market lending, and real estate-related investments. In addition to its New York headquarters, Cerberus has offices throughout the United States, Europe and Asia.
Kimco Realty. Kimco Realty is a real estate investment trust headquartered in New Hyde Park, New York that owns and operates North America’s largest publicly traded portfolio of neighborhood and community shopping centers. As of March 31, 2015, Kimco Realty owned interests in 745 shopping centers comprising 108 million square feet of leasable space across 39 states, Puerto Rico, Canada, Mexico and Chile. Publicly traded on the NYSE since 1991, and included in the S&P 500 Index, Kimco Realty has specialized in shopping center acquisitions, development and management for more than 50 years.
Klaff Realty. Klaff Realty is a privately-owned real estate investment company based in Chicago, Illinois that engages in the acquisition, redevelopment and management of commercial real estate throughout the United States and South America, with a primary focus on retail and office. Klaff Realty has established a leadership position in the acquisition of distressed retail space. To date, Klaff Realty affiliates have acquired properties and invested in operating entities that control in excess of 200 million square feet with a value in excess of $17 billion.
12
Table of Contents
Lubert-Adler. Lubert-Adler was co-founded in 1997 by Ira Lubert and Dean Adler, who collectively have over 60 years of experience in underwriting, acquiring, repositioning, refinancing and disposing of real estate assets. Lubert-Adler has more than 20 investment professionals and has invested $7.5 billion of equity into assets valued at over $17 billion.
Schottenstein Stores. Schottenstein Stores, together with its affiliate Schottenstein Property Group, is a privately-owned operator, acquirer and redeveloper of high quality power/big box, community and neighborhood shopping centers located throughout the United States predominantly anchored by national retailers.
Our Sponsors will indirectly control us through their respective ownership of Albertsons Investor and Kimco and will continue to be able to control the election of our directors, determine our corporate and management policies and determine, without the consent of our other stockholders, the outcome of any corporate transaction or other matter submitted to our stockholders for approval, including potential mergers or acquisitions, asset sales and other significant corporate transactions. Following the completion of the IPO-Related Transactions and this offering, our Sponsors will indirectly own approximately 80.3% of our common stock, or 78.7% if the underwriters exercise their option to purchase additional shares in full. As a result, we expect to be a “controlled company” within the meaning of the corporate governance standards of the NYSE on which we have been approved to list our shares and, as a result, will qualify for, and intend to rely on, exemptions from certain corporate governance requirements. As a result, our stockholders will not have the same protections afforded to stockholders of companies that are subject to such requirements. Following the completion of the IPO-Related Transactions and this offering, we will be required to appoint to our board of directors individuals designated by Albertsons Investor. Furthermore, if we cease to be a controlled company under the applicable rules of the NYSE, but Albertsons Investor, Kimco and Management Holdco collectively own at least 35% of our then-outstanding common stock, Albertsons Investor shall have the right to designate a number of members of our board of directors equal to one director fewer than 50% of our board of directors and Albertsons Investor shall cause its directors appointed to our board of directors to vote in favor of maintaining a 13-person board. In connection with this offering, Albertsons Companies, Inc. will enter into a stockholders agreement with Albertsons Investor, Kimco and Management Holdco (the “Stockholders’ Agreement”), and if a permitted transferee or assignee of such party that succeeds to such party’s rights under the Stockholders’ Agreement (each transferee or assignee, a “Holder” and, collectively, the “Holders”) has beneficial ownership of less than 35% but at least 20% of our then-outstanding common stock, such Holder shall have the right to designate a number of members of our board of directors equal to the greater of (a) three or (b) 25% of the size of our board of directors (rounded up to the next whole number). If a Holder has beneficial ownership of less than 20% but at least 15% of our then-outstanding common stock, such Holder shall have the right to designate a number of directors equal to the greater of (a) two or (b) 15% of the size of our board of directors (rounded up to the next whole number). If a Holder has beneficial ownership of less than 15% but at least 10% of our then-outstanding common stock, such Holder shall have the right to designate one director to our board of directors.
The limited liability company agreement of AB Acquisition provides for the Cerberus-led Consortium to receive annual management fees of $13.75 million from our company over a 48-month period beginning on January 30, 2015, the date of the consummation of the Safeway acquisition. We paid the Cerberus-led Consortium management fees totaling $15 million for fiscal 2014, $6 million of which was paid under the previous limited liability company agreement of AB Acquisition and $9 million of which was paid upon the closing of the Safeway acquisition. We have paid management fees to the Cerberus-led Consortium totaling $13.75 million for fiscal 2015. In exchange for the management fees, the Cerberus-led Consortium has provided strategic advice to management, including with respect to
13
Table of Contents
acquisitions and financings. As of September 12, 2015, management fees over the remainder of the 48-month period total $41.25 million. Consistent with the terms of the limited liability company agreement of AB Acquisition, the remaining management fees will be paid in full upon the closing of this offering. We do not expect to pay any further management fees to the Cerberus-led Consortium following the completion of this offering.
The interests of our Sponsors may not coincide with the interests of other holders of our common stock. Additionally, our Sponsors are in the business of making investments in companies and may, from time to time, acquire and hold interests in businesses that compete directly or indirectly with us. Our Sponsors may also pursue acquisition opportunities that may be complementary to our business, and as a result, those acquisition opportunities may not be available to us. So long as the Cerberus-led Consortium continues to own a significant amount of the outstanding shares of our common stock through Albertsons Investor and Kimco, the Cerberus-led Consortium will continue to be able to strongly influence or effectively control our decisions, including potential mergers or acquisitions, asset sales and other significant transactions.
See “Risk Factors—Risks Related to This Offering and Owning Our Common Stock.”
14
Table of Contents
THE OFFERING
| Issuer |
Albertsons Companies, Inc. |
| Common stock outstanding immediately before this offering |
409,832,959 shares.(1) |
| Common stock offered by us |
65,306,122 shares. |
| Common stock to be outstanding immediately after this offering |
475,139,081 shares.(1) |
| Option to purchase additional shares |
We have granted to the underwriters a 30-day option to purchase up to 9,795,918 additional shares of our common stock at the initial public offering price less the underwriting discount and commissions. |
| Use of proceeds |
We estimate that our net proceeds from this offering, after deducting underwriting discounts and approximately $13.0 million of estimated offering expenses, will be approximately $1,531 million, assuming the shares are offered at $24.50 per share, which is the midpoint of the estimated offering range set forth on the cover page of this prospectus. |
| We intend to use the net proceeds from this offering (i) to repay all amounts outstanding under NAI’s existing $850 million term loan facility (the “NAI Term Loan Facility”) (including $843.6 million of principal, plus accrued and unpaid interest thereon), (ii) to redeem $243.8 million of the outstanding principal amount of our 7.750% senior secured notes maturing October 15, 2022 (the “ABS/Safeway Notes”) (at a redemption price of 107.750% of the principal amount of the ABS/Safeway Notes redeemed), plus accrued and unpaid interest thereon and (iii) to repay $406.8 million of principal, plus accrued and unpaid interest thereon, under the ABS/Safeway Term Loan Facilities (as defined herein). To the extent we use the net proceeds from this offering to repay the additional $300 million borrowed under the NAI Term Loan Facility on November 10, 2015, the amount repaid under the ABS/Safeway Term Loan Facilities would be reduced by a corresponding amount. |
| See “Use of Proceeds.” |
| Dividend policy |
We do not intend to pay dividends for the foreseeable future. The declaration and payment of any future dividends will be at the sole discretion of our board of directors and will depend upon, among other things, our earnings, financial condition, capital requirements, level of indebtedness, contractual restrictions with respect to payment of dividends, and other considerations that our board of directors deems relevant. |
| See “Dividend Policy.” |
15
Table of Contents
| NYSE trading symbol |
“ABS.” |
| Conflicts of Interest |
A portion of the net proceeds from this offering will be used to repay borrowings outstanding under the ABS/Safeway Term Loan Facilities. Because one or more funds or accounts managed or advised by an investment management affiliate of Guggenheim Securities, LLC are lenders under the ABS/Safeway Term Loan Facilities and may receive 5% or more of the net proceeds from this offering, Guggenheim Securities, LLC is deemed to have a “conflict of interest” within the meaning of Rule 5121 (“Rule 5121”) of the Financial Industry Regulatory Authority, Inc. (“FINRA”). As such, this offering is being conducted in accordance with the applicable requirements of Rule 5121. Rule 5121 requires that a “qualified independent underwriter” meeting certain standards participate in the preparation of the registration statement and prospectus and exercise the usual standards of due diligence with respect thereto. Goldman, Sachs & Co. will act as a “qualified independent underwriter” within the meaning of Rule 5121 in connection with this offering. Goldman, Sachs & Co. will not receive any additional fees for serving as a qualified independent underwriter in this offering. We have agreed, subject to certain terms and conditions, to indemnify Goldman, Sachs & Co. against certain liability incurred in connection with it acting as a qualified independent underwriter in this offering, including liabilities under the Securities Act of 1933, as amended (the “Securities Act”). Guggenheim Securities, LLC will not confirm sales to accounts in which it exercises discretionary authority without the prior written consent of the customer. See “Underwriting (Conflicts of Interest).” |
| Risk factors |
For a discussion of risks relating to our company, our business and an investment in our common stock, see “Risk Factors” and all other information set forth in this prospectus before investing in our common stock. |
| Directed Share Program |
At our request, the underwriters have reserved for sale, at the initial public offering price, up to 5% of the shares offered by this prospectus for sale within the United States to some of our directors, officers, employees, business associates and related persons. If these persons purchase reserved shares, it will reduce the number of shares available for sale to the general public. Any reserved shares that are not so purchased will be offered by the underwriters to the general public on the same terms as the other shares offered by this prospectus. |
Unless otherwise indicated, all information in this prospectus excludes up to 9,795,918 shares of our common stock that may be sold by us if the underwriters exercise in full their option to purchase additional shares of our common stock.
16
Table of Contents
| (1) | The number of shares of common stock outstanding immediately before this offering takes into account the conversion of profits interests and assumes (i) the shares are offered at $24.50, which is the midpoint of the estimated offering range set forth on the cover page of this prospectus and (ii) all shares offered by us in this offering are sold. An initial public offering price of $26.00, which is the high point of the estimated offering range set forth on the cover page of this prospectus, would increase the common stock outstanding immediately before this offering by 300,493 shares. An initial public offering price of $23.00, which is the low point of the estimated offering range set forth on the cover page of this prospectus, would decrease the common stock outstanding immediately before this offering by 339,687 shares. See “Principal Stockholders.” |
17
Table of Contents
SUMMARY CONSOLIDATED HISTORICAL AND PRO FORMA FINANCIAL AND OTHER DATA
The following tables summarize our consolidated historical and pro forma financial and other data and should be read together with “Selected Historical Financial Information of AB Acquisition,” “Supplemental Selected Historical Financial Information of Safeway,” “Unaudited Pro Forma Condensed Consolidated Financial Information,” “Management’s Discussion and Analysis of Financial Condition and Results of Operations of AB Acquisition,” “Supplemental Management’s Discussion and Analysis of Results of Operations of Safeway” and our consolidated financial statements and related notes included elsewhere in this prospectus. We have derived the summary balance sheet data as of September 12, 2015 and the consolidated statement of operations data for the first two quarters of fiscal 2015 and the first two quarters of fiscal 2014 from our unaudited condensed consolidated financial statements included elsewhere in this prospectus and our consolidated statements of operations data for fiscal 2014, fiscal 2013 and fiscal 2012 from our audited consolidated financial statements included elsewhere in this prospectus. Our historical results set forth below are not necessarily indicative of results to be expected for any future period.
Our consolidated financial statements for fiscal 2012 and for the period from February 22, 2013 to March 20, 2013 reflect only the historic results of the Legacy Albertsons Stores prior to the 2013 acquisition of NAI. Commencing on March 21, 2013, our consolidated financial statements also include the financial position, results of operations and cash flows of NAI. In December 2013, we acquired United. Commencing on December 29, 2013, our consolidated financial statements also include the financial position, results of operations and cash flows of United. In addition, on January 30, 2015, we acquired Safeway. Commencing on January 31, 2015, our consolidated financial statements also include the financial position, results of operations and cash flows of Safeway.
18
Table of Contents
The Safeway acquisition had a material impact on our results of operations. Accordingly, we have included in this prospectus pro forma information which gives effect to the Safeway acquisition, this offering and the IPO-Related Transactions, as more fully described in the notes below. See “Unaudited Pro Forma Condensed Consolidated Financial Information” for additional information (in millions, except per share amounts).
| 28 Weeks Ended September 12, 2015 |
28 Weeks Ended September 4, 2014 |
12 Months Ended September 12, 2015 |
Fiscal 2014 | |||||||||||||||||||||||||||||||||
| Pro Forma(2)(7) |
Actual | Pro Forma(2) |
Actual | Pro Forma(2) |
Pro Forma(2) |
Actual(1) | Fiscal 2013(3) |
Fiscal 2012(3) |
||||||||||||||||||||||||||||
| Results of Operations: |
||||||||||||||||||||||||||||||||||||
| Sales and other revenue |
$ | 31,044 | $ | 31,489 | $ | 30,397 | $ | 12,821 | $ | 58,144 | $ | 57,497 | $ | 27,199 | $ | 20,055 | $ | 3,712 | ||||||||||||||||||
| Gross profit |
$ | 8,361 | $ | 8,494 | $ | 8,000 | $ | 3,519 | $ | 15,844 | $ | 15,483 | $ | 7,503 | $ | 5,399 | $ | 938 | ||||||||||||||||||
| Selling & administrative expenses |
8,296 | 8,406 | 7,795 | 3,450 | 15,692 | 15,191 | 8,152 | 5,874 | 899 | |||||||||||||||||||||||||||
| Bargain purchase gain |
— | — | — | — | — | — | — | (2,005 | ) | — | ||||||||||||||||||||||||||
|
|
|
|
|
|
|
|
|
|
|
|
|
|
|
|
|
|
|
|||||||||||||||||||
| Operating income (loss) |
65 | 88 | 205 | 69 | 152 | 292 | (649 | ) | 1,530 | 39 | ||||||||||||||||||||||||||
| Interest expense |
461 | 508 | 447 | 243 | 863 | 849 | 633 | 390 | 7 | |||||||||||||||||||||||||||
| Other (income) expense, net |
(9 | ) | (10 | ) | (31 | ) | 43 | 3 | (19 | ) | 96 | — | — | |||||||||||||||||||||||
|
|
|
|
|
|
|
|
|
|
|
|
|
|
|
|
|
|
|
|||||||||||||||||||
| (Loss) income before income taxes |
(387 | ) | (410 | ) | (211 | ) | (217 | ) | (714 | ) | (538 | ) | (1,378 | ) | 1,140 | 32 | ||||||||||||||||||||
| Income tax (benefit) expense |
(150 | ) | (87 | ) | (81 | ) | (30 | ) | (277 | ) | (208 | ) | (153 | ) | (573 | ) | 2 | |||||||||||||||||||
|
|
|
|
|
|
|
|
|
|
|
|
|
|
|
|
|
|
|
|||||||||||||||||||
| (Loss) income from continuing operations, net of tax |
(237 | ) | (323 | ) | (130 | ) | (187 | ) | (437 | ) | (330 | ) | (1,225 | ) | 1,713 | 30 | ||||||||||||||||||||
| Income from discontinued operations, net of tax |
— | — | — | — | — | — | — | 20 | 49 | |||||||||||||||||||||||||||
|
|
|
|
|
|
|
|
|
|
|
|
|
|
|
|
|
|
|
|||||||||||||||||||
| Net (loss) income |
$ | (237 | ) | $ | (323 | ) | $ | (130 | ) | $ | (187 | ) | $ | (437 | ) | $ | (330 | ) | $ | (1,225 | ) | $ | 1,733 | $ | 79 | |||||||||||
|
|
|
|
|
|
|
|
|
|
|
|
|
|
|
|
|
|
|
|||||||||||||||||||
| Per Share Data: |
||||||||||||||||||||||||||||||||||||
| Net income (loss) per share—basic and diluted(4) |
(0.50 | ) | (0.27 | ) | (0.92 | ) | (0.69 | ) | ||||||||||||||||||||||||||||
| Weighted average shares outstanding—basic and diluted(4) |
475 | 475 | 475 | 475 | ||||||||||||||||||||||||||||||||
| Other Financial Data: |
||||||||||||||||||||||||||||||||||||
| Adjusted EBITDA(5) |
$ | 1,274 | $ | 1,298 | $ | 1,117 | $ | 462 | $ | 2,524 | $ | 2,367 | $ | 1,099 | $ | 586 | $ | 65 | ||||||||||||||||||
| Adjusted Net Income(5) |
120 | 135 | 31 | (4 | ) | 328 | 239 | 58 | 174 | 39 | ||||||||||||||||||||||||||
| Adjusted Net Income per share—basic and diluted(5) |
0.25 | 0.07 | 0.69 | 0.50 | ||||||||||||||||||||||||||||||||
| Capital expenditures |
481 | 481 | 424 | 151 | 905 | 848 | 328 | 128 | 29 | |||||||||||||||||||||||||||
| Free cash flow(6) |
793 | 817 | 693 | 311 | 1,619 | 1,519 | 771 | 458 | 36 | |||||||||||||||||||||||||||
| Other Operating Data: |
||||||||||||||||||||||||||||||||||||
| Identical store sales |
4.4% | 4.5% | 5.0% | 8.7% | 4.4% | 4.6% | 7.2% | 1.6% | 1.9% | |||||||||||||||||||||||||||
| Store count (at end of fiscal period) |
2,196 | 2,196 | 2,233 | 1,081 | 2,196 | 2,229 | 2,382 | 1,075 | 192 | |||||||||||||||||||||||||||
| Gross square footage (at end of fiscal period) (in millions) |
110 | 110 | 111 | 56 | 110 | 111 | 118 | 56 | 11 | |||||||||||||||||||||||||||
| Fuel sales |
$ | 1,797 | $ | 1,799 | $ | 2,362 | $ | 115 | $ | 3,404 | $ | 3,969 | $ | 387 | $ | 47 | $ | — | ||||||||||||||||||
| Balance Sheet Data (at end of period): |
||||||||||||||||||||||||||||||||||||
| Cash and equivalents |
$ | 778 | $ | 778 | $ | 959 | $ | 778 | $ | 1,126 | $ | 307 | $ | 37 | ||||||||||||||||||||||
| Total assets |
24,008 | 24,008 | 10,350 | 24,008 | 25,771 | 9,359 | 586 | |||||||||||||||||||||||||||||
| Total members’ equity (deficit) |
3,380 | 1,917 | 1,566 | 3,380 | 2,169 | 1,760 | (247 | ) | ||||||||||||||||||||||||||||
| Total debt |
10,533 | 11,977 | 5,002 | 10,533 | 12,569 | 3,694 | 120 | |||||||||||||||||||||||||||||
| Fiscal 2015 | Fiscal 2014 | Fiscal 2013 | Fiscal 2012 | |||||||||||||||||||||||||||||||||||||||||||||||||||||
| Identical Store Sales(a) |
Q2’15 | Q1’15 | Q4’14 | Q3’14 | Q2’14 | Q1’14 | Q4’13 | Q3’13 | Q2’13 | Q1’13 | Q4’12 | Q3’12 | Q2’12 | Q1’12 | ||||||||||||||||||||||||||||||||||||||||||
| Legacy Albertsons Stores |
2.9 | % | 2.1 | % | 3.1 | % | 2.6 | % | 3.4 | % | 1.3 | % | 1.4 | % | 3.3 | % | 0.1 | % | 1.2 | % | 1.4 | % | 2.2 | % | 2.7 | % | 1.6 | % | ||||||||||||||||||||||||||||
| SVU Albertsons Stores |
9.7 | % | 9.5 | % | 8.5 | % | 8.0 | % | 7.5 | % | 8.7 | % | 5.8 | % | 5.6 | % | (0.4 | )% | (2.5 | )% | (5.6 | )% | (5.0 | )% | (4.0 | )% | (4.5 | )% | ||||||||||||||||||||||||||||
| NAI Stores(b) |
1.8 | % | 4.1 | % | 3.6 | % | 8.5 | % | 11.9 | % | 12.2 | % | 10.4 | % | 4.9 | % | 0.6 | % | (2.9 | )% | (5.7 | )% | (4.6 | )% | (5.1 | )% | (4.0 | )% | ||||||||||||||||||||||||||||
| Safeway(c) |
4.9 | % | 3.8 | % | 3.5 | % | 3.2 | % | 3.1 | % | 2.2 | % | 1.1 | % | 1.8 | % | 1.8 | % | 1.1 | % | 1.4 | % | 1.3 | % | 0.1 | % | 1.0 | % | ||||||||||||||||||||||||||||
| (a) | Actuals include acquired stores irrespective of date of acquisition and exclude United. |
| (b) | After adjusting for the positive sales impact in one of NAI’s divisions during the second quarter of fiscal 2014 resulting from a labor dispute at a competitor that caused a temporary closure of its stores, identical store sales growth for the NAI Stores during fiscal 2014 and the second quarter of fiscal 2015 would have been 8.1% and 5.2%, respectively. |
| (c) | Includes Safeway’s Eastern Division, now owned by NAI. |
19
Table of Contents
| (1) | For the period from February 21, 2014 to January 30, 2015, our consolidated financial statements include the financial position, results of operations and cash flows of Albertsons, NAI and United. Commencing on January 31, 2015, our consolidated financial statements also include the financial position, results of operations and cash flows of Safeway. |
| (2) | The pro forma information for fiscal 2014, the 28 weeks ended September 4, 2014, the 28 weeks ended September 12, 2015 and the 12 months ended September 12, 2015 includes the pre-combination results of operations of Safeway and pro forma adjustments for the effects of the Safeway Transactions, as if the Safeway Transactions had been consummated on the first day of fiscal 2014. Additionally, the pro forma information for fiscal 2014, the 28 weeks ended September 4, 2014, the 28 weeks ended September 12, 2015 and the 12 months ended September 12, 2015 reflects the IPO-Related Transactions and the issuance of shares of our common stock in this offering and the application of the estimated net proceeds thereof (as described in “Use of Proceeds”), as if these events had occurred on the first day of fiscal 2014. This assumes net proceeds of this offering to us of $1,531 million (assuming no exercise of the underwriters’ option to purchase additional shares), based on an initial public offering price of $24.50 per share, the midpoint of the estimated price range set forth on the cover page of this prospectus, after deducting estimated underwriting discounts and commissions and estimated offering expenses. See “Unaudited Pro Forma Condensed Consolidated Financial Information” for a presentation of such pro forma financial data for fiscal 2014. |
For the 28 weeks ended September 12, 2015, a $1.00 increase in the assumed initial public offering price of $24.50 per share (the midpoint of the price range set forth on the cover page of this prospectus) would have resulted in pro forma net loss of $236 million and pro forma net loss per share-basic of $0.50, and a $1.00 decrease in the assumed initial public offering price of $24.50 per share would have resulted in pro forma net loss of $238 million and pro forma net loss per share-basic of $0.50, in each case, assuming that the number of shares offered by us, as set forth on the cover page of this prospectus, remained the same and after deducting the estimated underwriting discounts and commissions and estimated offering expenses. Similarly, a decrease of one million shares in the number of shares offered by us, as set forth on the cover of this prospectus, would have resulted in pro forma net loss of $237 million and pro forma net loss per share-basic of $0.50, assuming the assumed initial public offering price of $24.50 per share (the midpoint of the price range set forth on the cover page of this prospectus) remained the same and after deducting the estimated underwriting discounts and commissions and estimated expenses. An increase of one million shares in the number of shares offered by us, as set forth on the cover page of this prospectus, assuming no change in the assumed initial public offering price of $24.50 per share, would have resulted in pro forma net loss of $236 million and pro forma net loss per share—basic of $0.50. The above assumes that any resulting change in net proceeds increases or decreases the amount used to repay indebtedness.
For fiscal 2014, a $1.00 increase in the assumed initial public offering price of $24.50 per share (the midpoint of the price range set forth on the cover page of this prospectus) would have resulted in pro forma net loss of $328 million and pro forma net loss per share-basic of $0.69, and a $1.00 decrease in the assumed initial public offering price of $24.50 per share would have resulted in pro forma net loss of $332 million and pro forma net loss per share-basic of $0.70, in each case, assuming that the number of shares offered by us, as set forth on the cover page of this prospectus, remained the same and after deducting the estimated underwriting discounts and commissions and estimated offering expenses. Similarly, a decrease of one million shares in the number of shares offered by us, as set forth on the cover of this prospectus, would have resulted in pro forma net loss of $331 million and pro forma net loss per share-basic of $0.70, assuming the assumed initial public offering price of $24.50 per share (the midpoint of the price range set forth on the cover page of this prospectus) remained the same and after deducting the estimated underwriting discounts and commissions and estimated expenses. An increase of one million shares in the number of shares offered by us, as set forth on the cover page of this prospectus, assuming no change in the assumed initial public offering price of $24.50 per share, would have resulted in pro forma net loss of $329 million and pro forma net loss per share—basic of $0.69. The above assumes that any resulting change in net proceeds increases or decreases the amount used to repay indebtedness.
| (3) | The results of operations for fiscal 2012 and the period from February 22, 2013 through March 20, 2013 reflect the financial position, results of operations and cash flows of the Legacy Albertsons Stores acquired on June 2, 2006. Commencing on March 21, 2013, our consolidated financial statements also include the financial position, results of operations and cash flows of the SVU Albertsons Stores and the NAI Stores. Commencing on December 29, 2013, our consolidated financial statements also include the financial position, results of operations and cash flows of United. |
| (4) | Gives effect to the items described in note 2 above as if they had occurred on the first day of fiscal 2014. See “Unaudited Pro Forma Condensed Consolidated Financial Information” for a presentation of such pro forma financial data. |
| (5) | Adjusted EBITDA is a Non-GAAP Measure defined as earnings (net income (loss)) before interest, income taxes, depreciation and amortization, further adjusted to eliminate the effects of items management does not consider in assessing ongoing performance. Adjusted Net Income is a Non-GAAP Measure defined as (net income (loss)) adjusted to eliminate the effects of items management does not consider in assessing ongoing performance. Pro forma amounts give effect to the items described in note 2 above, as applicable, as if they had occurred on the first day of our fiscal 2014. |
20
Table of Contents
Adjusted EBITDA and Adjusted Net Income are Non-GAAP Measures that provide supplemental information we believe is useful to analysts and investors to evaluate our ongoing results of operations, when considered alongside other GAAP measures such as net income, operating income and gross profit. These Non-GAAP Measures exclude the financial impact of items management does not consider in assessing our ongoing operating performance, and thereby facilitate review of our operating performance on a period-to-period basis. Other companies may have different capital structures or different lease terms, and comparability to our results of operations may be impacted by the effects of acquisition accounting on our depreciation and amortization. As a result of the effects of these factors and factors specific to other companies, we believe Adjusted EBITDA and Adjusted Net Income provide helpful information to analysts and investors to facilitate a comparison of our operating performance to that of other companies. Set forth below is a reconciliation of Adjusted Net Income and Adjusted EBITDA to net income (in millions):
| 28 Weeks Ended September 12, 2015 |
28 Weeks Ended September 4, 2014 |
12 Months Ended September 12, 2015 |
Fiscal 2014 | |||||||||||||||||||||||||||||||||
| Pro Forma |
Actual | Pro Forma |
Actual | Pro Forma |
Pro Forma |
Actual | Fiscal 2013 |
Fiscal 2012 |
||||||||||||||||||||||||||||
| Net (Loss) Income |
$ | (237 | ) | $ | (323 | ) | $ | (130 | ) | $ | (187 | ) | $ | (437 | ) | $ | (330 | ) | $ | (1,225 | ) | $ | 1,733 | $ | 79 | |||||||||||
| Adjustments: |
||||||||||||||||||||||||||||||||||||
| Bargain purchase gain |
$ | — | $ | — | $ | — | $ | — | $ | — | $ | — | $ | — | $ | (2,005 | ) | $ | — | |||||||||||||||||
| (Gain) loss on interest rate and commodity swaps, net |
1 | 1 | — | 43 | 3 | 2 | 98 | — | — | |||||||||||||||||||||||||||
| Store transition and related costs(a) |
— | — | — | — | — | — | — | 167 | — | |||||||||||||||||||||||||||
| Acquisition and integration costs(b) |
180 | 180 | 3 | 28 | 290 | 113 | 352 | 174 | 7 | |||||||||||||||||||||||||||
| Termination of long-term incentive plan |
— | — | — | — | 78 | 78 | 78 | — | — | |||||||||||||||||||||||||||
| Non-cash equity-based compensation expense |
68 | 68 | 3 | 4 | 233 | 168 | 344 | 6 | — | |||||||||||||||||||||||||||
| Net (gain) loss on property dispositions, asset impairments and lease exit costs |
48 | 48 | 9 | (5 | ) | 52 | 13 | 228 | (2 | ) | (46 | ) | ||||||||||||||||||||||||
| LIFO expense |
11 | 11 | 19 | 19 | 30 | 38 | 43 | 12 | 2 | |||||||||||||||||||||||||||
| Amortization and write-off of debt discount, deferred financing costs and loss on extinguishment of debt |
33 | 33 | 33 | 39 | 62 | 62 | 72 | 75 | 1 | |||||||||||||||||||||||||||
| Non-cash pension and post-retirement expense (income), net(c) |
6 | 6 | 23 | (7 | ) | 35 | 52 | (3 | ) | (8 | ) | — | ||||||||||||||||||||||||
| Amortization of intangible assets resulting from acquisitions |
196 | 196 | 198 | 70 | 372 | 374 | 149 | 116 | — | |||||||||||||||||||||||||||
| Other(d) |
39 | 39 | (26 | ) | (8 | ) | 93 | 28 | (14 | ) | 12 | (4 | ) | |||||||||||||||||||||||
| Tax impact of adjustments to Adjusted Net Income(e) |
(225 | ) | (124 | ) | (101 | ) | — | (483 | ) | (359 | ) | (64 | ) | (106 | ) | — | ||||||||||||||||||||
|
|
|
|
|
|
|
|
|
|
|
|
|
|
|
|
|
|
|
|||||||||||||||||||
| Adjusted Net Income |
$ | 120 | $ | 135 | $ | 31 | $ | (4 | ) | $ | 328 | $ | 239 | $ | 58 | $ | 174 | $ | 39 | |||||||||||||||||
| Adjustments: |
||||||||||||||||||||||||||||||||||||
| Tax impact of adjustments to Adjusted Net Income(e) |
$ | 225 | $ | 124 | $ | 101 | $ | — | 483 | $ | 359 | $ | 64 | $ | 106 | $ | — | |||||||||||||||||||
| Income tax (benefit) |
(150 | ) | (87 | ) | (81 | ) | (30 | ) | (277 | ) | (208 | ) | (153 | ) | (573 | ) | 2 | |||||||||||||||||||
| Amortization and write-off of original issue discount, deferred financing costs and loss on extinguishment of debt |
(33 | ) | (33 | ) | (33 | ) | (39 | ) | (62 | ) | (62 | ) | (72 | ) | (75 | ) | (1 | ) | ||||||||||||||||||
| Interest expense – continued operations |
461 | 508 | 447 | 243 | 863 | 849 | 633 | 390 | 7 | |||||||||||||||||||||||||||
| Interest expense – discontinued operations |
— | — | — | — | — | — | — | 4 | 1 | |||||||||||||||||||||||||||
| Amortization of intangible assets resulting from acquisitions |
(196 | ) | (196 | ) | (198 | ) | (70 | ) | (372 | ) | (374 | ) | (149 | ) | (116 | ) | — | |||||||||||||||||||
| Depreciation and amortization |
847 | 847 | 850 | 362 | 1,561 | 1,564 | 718 | 676 | 17 | |||||||||||||||||||||||||||
|
|
|
|
|
|
|
|
|
|
|
|
|
|
|
|
|
|
|
|||||||||||||||||||
| Adjusted EBITDA |
$ | 1,274 | $ | 1,298 | $ | 1,117 | $ | 462 | $ | 2,524 | $ | 2,367 | $ | 1,099 | $ | 586 | $ | 65 | ||||||||||||||||||
|
|
|
|
|
|
|
|
|
|
|
|
|
|
|
|
|
|
|
|||||||||||||||||||
| (a) | Includes costs related to the transition of stores acquired in the NAI acquisition by improving store conditions and enhancing product offerings. |
| (b) | Includes costs related to the Safeway acquisition (including the charge associated with the settlement of appraisal rights litigation) and the NAI and United acquisitions. |
| (c) | Excludes the company’s one-time cash contribution of $260 million to the Safeway Employee Retirement Plan (the “Safeway ERP”) under a settlement with the Pension Benefit Guaranty Corporation (the “PBGC”) in connection with the closing of the Safeway acquisition. |
21
Table of Contents
| (d) | Primarily includes non-cash lease adjustments related to deferred rents and deferred gains on lease expenses related to closed stores and discontinued operations. Fiscal 2014 Pro Forma also includes amortization of unfavorable leases on acquired Safeway surplus properties. |
| (e) | The tax impact was determined based on the taxable status of the subsidiary to which each of the above adjustments relates. |
| (6) | We define “free cash flow” as Adjusted EBITDA less capital expenditures. See “Management’s Discussion and Analysis of Financial Condition and Results of Operations of AB Acquisition,” included elsewhere in this prospectus, for a reconciliation of cash flow from operating activities to free cash flow. |
| (7) | The pro forma balance sheet data as of September 12, 2015 gives effect to pro forma adjustments to reflect the IPO-Related Transactions and the issuance of 62,489,795 shares of common stock in this offering (excluding the remaining 2,816,327 shares of common stock being issued in this offering, which are deemed to have been used to pay underwriting discounts and offering expenses) and the application of $1,531 million of the proceeds to us from the sale of such shares by us to repay certain existing debt, as described in “Use of Proceeds,” as if these events had occurred on September 12, 2015. This assumes net proceeds from this offering to us of $1,531 million (assuming no exercise of the underwriters’ option to purchase additional shares), based on an initial public offering price of $24.50 per share, the midpoint of the price range set forth on the cover page of this prospectus, after deducting underwriter discounts and commissions and estimated offering expenses. See “Unaudited Pro Forma Condensed Consolidated Financial Information” for a presentation of such unaudited pro forma condensed consolidated balance sheet data. |
| A $1.00 increase (decrease) in the assumed initial public offering price of $24.50 per share (the midpoint of the price range set forth on the front cover of this prospectus) would not result in a change in cash and cash equivalents or total assets and would (decrease) increase total long-term debt by ($63) million and would increase (decrease) total stockholders’ equity by $63 million, in each case assuming no exercise of the underwriters’ option to purchase additional shares and assuming that the number of shares offered by us, as set forth on the cover page of this prospectus, remained the same and after deducting the estimated underwriting discounts and commissions and estimated offering expenses. Similarly, a one million share increase (decrease) in the number of shares offered by us, as set forth on the front cover of this prospectus, would not result in a change in cash and cash equivalents or total assets and would (decrease) increase total long-term debt by ($23) million and would increase (decrease) total stockholders’ equity by $23 million, in each case assuming no exercise of the underwriters’ option to purchase additional shares and assuming the initial public offering price of $24.50 per share (the midpoint of the price range set forth on the front cover page of this prospectus) remained the same and after deducting the estimated underwriting discounts and commissions and estimated offering expenses. The above assumes that any resulting change in net proceeds increases or decreases the amount used to repay indebtedness. |
22
Table of Contents
An investment in our common stock involves a high degree of risk. You should carefully consider the following information, together with other information in this prospectus, before buying shares of our common stock. If any of the following risks or uncertainties actually occur, our business, financial condition, prospects, results of operations and cash flow could be materially adversely affected. Additional risks or uncertainties not currently known to us, or that we deem immaterial, may also impair our business operations. We cannot assure you that any of the events discussed in the risk factors below will not occur. In that case, the market price of our common stock could decline and you may lose all or a part of your investment.
Risks Related to Our Business and Industry
Various operating factors and general economic conditions affecting the food retail industry may affect our business and may adversely affect our business and operating results.
Our operations and financial performance are affected by economic conditions such as macroeconomic conditions, credit market conditions and the level of consumer confidence. While the combination of improved economic conditions, the trend towards lower unemployment, higher wages and lower gasoline prices have contributed to improved consumer confidence, there is continued uncertainty about the strength of the economic recovery. If the economy does not continue to improve or if it weakens, or if gasoline prices rebound, consumers may reduce spending, trade down to a less expensive mix of products or increasingly rely on food discounters, all of which could impact our sales. In addition, consumers’ perception or uncertainty related to the economic recovery and future fuel prices could also dampen overall consumer confidence and reduce demand for our product offerings. Both inflation and deflation affect our business. Food deflation could reduce sales growth and earnings, while food inflation could reduce gross profit margins. We are unable to predict if the economy will continue to improve or predict the rate at which the economy may improve or the direction of gasoline prices. If the economy does not continue to improve or if it weakens or fuel prices increase, our business and operating results could be adversely affected.
Competition in our industry is intense, and our failure to compete successfully may adversely affect our profitability and results of operations.
The food and drug retail industry is large and dynamic, characterized by intense competition among a collection of local, regional and national participants. We face strong competition from other food and/or drug retailers, supercenters, club stores, discount stores, online providers, specialty and niche supermarkets, drug stores, general merchandisers, wholesale stores, convenience stores and restaurants. Shifts in the competitive landscape, consumer preference or market share may have an adverse effect on our profitability and results of operations.
As a result of consumers’ growing desire to shop online, we also face increasing competition from both our existing competitors who have incorporated the internet as a direct-to-consumer channel and internet-only providers that sell grocery products. Although we have a growing internet presence and offer our customers the ability to shop online for both home delivery and in-store pick-up, there is no assurance that these online initiatives will be successful. In addition, these initiatives may have an adverse impact on our profitability as a result of lower gross profits or greater operating costs to compete.
Our ability to attract customers is dependent, in large part, upon a combination of channel preference, location, store conditions, quality, price, service and selection. In each of these areas, traditional and non-traditional competitors compete with us and may successfully attract our customers to their stores by matching or exceeding what we offer. In recent years, many of our competitors have
23
Table of Contents
added locations and adopted a multi-channel approach to marketing and advertising. Our responses to competitive pressures, such as additional promotions, increased advertising, additional capital investment and the development of our internet offerings, could adversely affect our profitability and cash flow. We cannot guarantee that our competitive response will succeed in increasing or maintaining our share of retail food sales.
An increasingly competitive industry and a low level of inflation in food prices have made it difficult for food retailers to achieve positive identical store sales growth on a consistent basis. Our competitors have attempted to maintain or grow their share of retail food sales through capital and price investment, increased promotional activity and new store growth, creating a more difficult environment to consistently increase year-over-year sales. Several of our primary competitors are larger than we are or have greater financial resources available to them and, therefore, may be able to devote greater resources to invest in price, promotional activity and new or remodeled stores in order to grow their share of retail food sales. Price investment by our competitors has also, from time to time, adversely affected our operating margins. In recent years, we have invested in price in order to remain competitive and generate sales growth; however, there can be no assurance this strategy will continue to be successful.
Because we face intense competition, we need to anticipate and respond to changing consumer preferences and demands more effectively than our competitors. We devote significant resources to differentiating our banners in the local markets where we operate and invest in loyalty programs to drive traffic. Our local merchandising teams spend considerable time working with store directors to make sure we are satisfying consumer preferences. In addition, we strive to achieve and maintain favorable recognition of our own brands and offerings, and market these offerings to consumers and maintain and enhance a perception of value for consumers. While we seek to continuously respond to changing consumer preferences, there is no assurances that our responses will be successful.
Our continued success is dependent upon our ability to control operating expenses, including managing health care and pension costs stipulated by our collective bargaining agreements to effectively compete in the food retail industry. Several of our primary competitors are larger than we are, or are not subject to collective bargaining agreements, allowing them to more effectively leverage their fixed costs or more easily reduce operating expenses. Finally, we need to source, market and merchandise efficiently. Changes in our product mix also may negatively affect our profitability. Failure to accomplish our objectives could impair our ability to compete successfully and adversely affect our profitability.
Profit margins in the food retail industry are low. In order to increase or maintain our profit margins, we develop operating strategies to increase revenues, increase gross margins and reduce costs, such as new marketing programs, new advertising campaigns, productivity improvements, shrink reduction initiatives, distribution center efficiencies, manufacturing efficiencies, energy efficiency programs and other similar strategies. Our failure to achieve forecasted revenue growth, gross margin improvement or cost reductions could have a material adverse effect on our profitability and operating results.
Increased commodity prices may adversely impact our profitability.
Many of our own and sourced products include ingredients such as wheat, corn, oils, milk, sugar, proteins, cocoa and other commodities. Commodity prices worldwide have been volatile. Any increase in commodity prices may cause an increase in our input costs or the prices our vendors seek from us. Although we typically are able to pass on modest commodity price increases or mitigate vendor efforts to increase our costs, we may be unable to continue to do so, either in whole or in part, if commodity prices increase materially. If we are forced to increase prices, our customers may reduce their purchases at our stores or trade down to less profitable products. Both may adversely impact our profitability as a result of reduced revenue or reduced margins.
24
Table of Contents
Fuel prices and availability may adversely affect our results of operations.
We currently operate 379 fuel centers that are adjacent to many of our store locations. As a result, we sell a significant amount of gasoline. Increased regulation or significant increases in wholesale fuel costs could result in lower gross profit on fuel sales, and demand could be affected by retail price increases as well as by concerns about the effect of emissions on the environment. We are unable to predict future regulations, environmental effects, political unrest, acts of terrorism and other matters that may affect the cost and availability of fuel, and how our customers will react, which could adversely affect our results of operations.
Our stores rely heavily on sales of perishable products, and product supply disruptions may have an adverse effect on our profitability and operating results.
Reflecting consumer preferences, we have a significant focus on perishable products. Sales of perishable products accounted for approximately 40.6% of our total sales in fiscal 2014. We rely on various suppliers and vendors to provide and deliver our perishable product inventory on a continuous basis. We could suffer significant perishable product inventory losses and significant lost revenue in the event of the loss of a major supplier or vendor, disruption of our distribution network, extended power outages, natural disasters or other catastrophic occurrences.
Severe weather and natural disasters may adversely affect our business.
Severe weather conditions such as hurricanes, earthquakes, floods, extended winter storms, heat waves or tornadoes, as well as other natural disasters, in areas in which we have stores or distribution centers or from which we source or obtain products may cause physical damage to our properties, closure of one or more of our stores, manufacturing facilities or distribution centers, lack of an adequate work force in a market, temporary disruption in the manufacture of products, temporary disruption in the supply of products, disruption in the transport of goods, delays in the delivery of goods to our distribution centers or stores, a reduction in customer traffic and a reduction in the availability of products in our stores. In addition, adverse climate conditions and adverse weather patterns, such as drought or flood, that impact growing conditions and the quantity and quality of crops yielded by food producers may adversely affect the availability or cost of certain products within the grocery supply chain. Any of these factors may disrupt our business and adversely affect our business.
Threats or potential threats to security of food and drug safety, the occurrence of a widespread health epidemic or regulatory concerns in our supply chain may adversely affect our business.
Acts or threats, whether perceived or real, of war or terror or other criminal activity directed at the food or drug store industry or the transportation industry, whether or not directly involving our stores, could increase our operating costs and operations, or impact general consumer behavior and consumer spending. Other events that give rise to actual or potential food contamination, drug contamination or food-borne illnesses, or a widespread regional, national or global health epidemic, such as pandemic flu, could have an adverse effect on our operating results or disrupt production and delivery of our products, our ability to appropriately staff our stores and potentially cause customers to avoid public gathering places or otherwise change their shopping behaviors.
We source our products from vendors and suppliers and related networks across the globe who may be subject to regulatory actions or face criticism due to actual or perceived social injustices, including human trafficking, child labor or environmental, health and safety violations. A disruption in our supply chain due to any regulatory action or social injustice could have an adverse impact on our supply chain and ultimately our business, including potential harm to our reputation.
25
Table of Contents
We could be affected if consumers lose confidence in the food supply chain or the quality and safety of our products.
We could be adversely affected if consumers lose confidence in the safety and quality of certain food products. Adverse publicity about these types of concerns, whether valid or not, may discourage consumers from buying our products or cause production and delivery disruptions. The real or perceived sale of contaminated food products by us could result in product liability claims, a loss of consumer confidence and product recalls, which could have a material adverse effect on our business.
Certain risks are inherent in providing pharmacy services, and our insurance may not be adequate to cover any claims against us.
We currently operate 1,702 in-store pharmacies, and, as a result, we are exposed to risks inherent in the packaging, dispensing, distribution, and disposal of pharmaceuticals and other healthcare products, such as risks of liability for products which cause harm to consumers, as well as increased regulatory risks and related costs. Although we maintain insurance, we cannot guarantee that the coverage limits under our insurance programs will be adequate to protect us against future claims, or that we will be able to maintain this insurance on acceptable terms in the future, or at all. Our results of operations, financial condition or cash flows may be materially adversely affected if in the future our insurance coverage proves to be inadequate or unavailable, or there is an increase in the liability for which we self-insure, or we suffer harm to our reputation as a result of an error or omission.
We are subject to numerous federal and state regulations. Each of our in-store pharmacies must be licensed by the state government. The licensing requirements vary from state to state. An additional registration certificate must be granted by the U.S. Drug Enforcement Administration (“DEA”), and, in some states, a separate controlled substance license must be obtained to dispense controlled substances. In addition, pharmacies selling controlled substances are required to maintain extensive records and often report information to state and federal agencies. If we fail to comply with existing or future laws and regulations, we could suffer substantial civil or criminal penalties, including the loss of our licenses to operate pharmacies and our ability to participate in federal and state healthcare programs. As a consequence of the severe penalties we could face, we must devote significant operational and managerial resources to complying with these laws and regulations.
In 2014, Safeway received two subpoenas from the DEA concerning its record keeping, reporting and related practices associated with the loss or theft of controlled substances. The two subpoenas have resulted in essentially a single investigation by the DEA. We are cooperating with the DEA on these matters. Application of federal and state laws and regulations could subject our current practices to allegations of impropriety or illegality, or could require us to make significant changes to our operations. In addition, we cannot predict the impact of future legislation and regulatory changes on our pharmacy business or assure that we will be able to obtain or maintain the regulatory approvals required to operate our business.
Integrating acquisitions may be time-consuming and create costs that could reduce our net income and cash flows.
Part of our strategy includes pursuing acquisitions that we believe will be accretive to our business. If we consummate an acquisition, the process of integrating the acquired business may be complex and time consuming, may be disruptive to the business and may cause an interruption of, or a distraction of management’s attention from, the business as a result of a number of obstacles, including but not limited to:
| • | a failure of our due diligence process to identify significant risks or issues; |
| • | the loss of customers of the acquired company or our company; |
| • | negative impact on the brands or banners of the acquired company or our company; |
| • | a failure to maintain or improve the quality of customer service; |
26
Table of Contents
| • | difficulties assimilating the operations and personnel of the acquired company; |
| • | our inability to retain key personnel of the acquired company; |
| • | the incurrence of unexpected expenses and working capital requirements; |
| • | our inability to achieve the financial and strategic goals, including synergies, for the combined businesses; and |
| • | difficulty in maintaining internal controls, procedures and policies. |
Any of the foregoing obstacles, or a combination of them, could decrease gross profit margins or increase selling, general and administrative expenses in absolute terms and/or as a percentage of net sales, which could in turn negatively impact our net income and cash flows.
We may not be able to consummate acquisitions in the future on terms acceptable to us, or at all. In addition, future acquisitions are accompanied by the risk that the obligations and liabilities of an acquired company may not be adequately reflected in the historical financial statements of that company and the risk that those historical financial statements may be based on assumptions which are incorrect or inconsistent with our assumptions or approach to accounting policies. Any of these material obligations, liabilities or incorrect or inconsistent assumptions could adversely impact our results of operations and financial condition.
A significant majority of our employees are unionized, and our relationship with unions, including labor disputes or work stoppages, could have an adverse impact on our operations and financial results.
As of February 28, 2015, approximately 174,000 of our employees were covered by collective bargaining agreements. During fiscal 2014, collective bargaining agreements covering approximately 50,000 employees were renegotiated. During fiscal 2015, collective bargaining agreements covering approximately 73,000 employees are scheduled to expire. In future negotiations with labor unions, we expect that health care, pension costs and/or contributions and wage costs, among other issues, will be important topics for negotiation. If, upon the expiration of such collective bargaining agreements, we are unable to negotiate acceptable contracts with labor unions, it could result in strikes by the affected workers and thereby significantly disrupt our operations. As part of our collective bargaining agreements, we may need to fund additional pension contributions, which would negatively impact our free cash flow. Further, if we are unable to control health care and pension costs provided for in the collective bargaining agreements, we may experience increased operating costs and an adverse impact on our financial results.
Increased pension expenses, contributions and surcharges may have an adverse impact on our financial results.
In connection with the Safeway acquisition, we assumed Safeway’s defined benefit retirement plans for substantially all Safeway employees not participating in multiemployer pension plans. We also assumed defined benefit retirement plans in connection with the United and NAI acquisitions. The funded status of these plans (the difference between the fair value of the plan assets and the projected benefit obligation) is a significant factor in determining annual pension expense and cash contributions to fund the plans. In recent years, cash contributions have declined due to improved market conditions and the impact of the pension funding stabilization legislation, which increased the discount rate used to determine pension funding. However, in the fourth quarter of fiscal 2014, under a settlement agreement with the PBGC in connection with the closing of the Safeway acquisition, Safeway contributed $260 million to its largest pension plan. As a result, we do not expect to make additional contributions to this plan until 2018.
27
Table of Contents
If financial markets do not continue to improve or if financial markets decline, increased pension expense and cash contributions may have an adverse impact on our financial results. Under the Employee Retirement Income Security Act of 1974, as amended (“ERISA”), the PBGC has the authority to petition a court to terminate an underfunded pension plan under limited circumstances. In the event that our defined benefit pension plans are terminated for any reason, we could be liable to the PBGC for the entire amount of the underfunding, as calculated by the PBGC based on its own assumptions (which likely would result in a larger obligation than that based on the actuarial assumptions used to fund such plans). Under ERISA and the Internal Revenue Code of 1986, as amended (the “Code”), the liability under these defined benefit plans is joint and several with all members of the control group, such that each member of the control group would be liable for the defined benefit plans of each other member of the control group.
In addition, we participate in various multiemployer pension plans for substantially all employees represented by unions that require us to make contributions to these plans in amounts established under collective bargaining agreements. Under the Pension Protection Act of 2006 (the “PPA”), contributions in addition to those made pursuant to a collective bargaining agreement may be required in limited circumstances in the form of a surcharge that is equal to 5% of the contributions due in the first year and 10% each year thereafter until the applicable bargaining agreement expires.
Pension expenses for multiemployer pension plans are recognized by us as contributions are made. Benefits generally are based on a fixed amount for each year of service. Our contributions to multiemployer plans were $33.1 million, $74.2 million and $351.7 million during fiscal 2012, fiscal 2013 and, on a pro forma basis, fiscal 2014, respectively. In fiscal 2015, we expect to contribute approximately $370.0 million to multiemployer pension plans, subject to collective bargaining conditions, exclusive of additional amounts we may be required to contribute relating to A&P.
Based on an assessment of the most recent information available, the company believes that most of the multiemployer plans to which it contributes are underfunded. The company is only one of a number of employers contributing to these plans, and the underfunding is not a direct obligation or liability of the company. However, the company has attempted, as of February 28, 2015, to estimate its share of the underfunding of multiemployer plans to which the company contributes, based on the ratio of its contributions to the total of all contributions to these plans in a year. As of February 28, 2015, our estimate of the company’s share of the underfunding of multiemployer plans to which it contributes was $3.0 billion. The company’s share of underfunding described above is an estimate and could change based on the results of collective bargaining efforts, investment returns on the assets held in the plans, actions taken by trustees who manage the plans’ benefit payments, interest rates, if the employers currently contributing to these plans cease participation, and requirements under the PPA, the Multiemployer Pension Reform Act of 2014 and applicable provisions of the Code.
Additionally, underfunding of the multiemployer plans means that, in the event we were to exit certain markets or otherwise cease making contributions to these plans, we could trigger a substantial withdrawal liability. Any accrual for withdrawal liability will be recorded when a withdrawal is probable and can be reasonably estimated, in accordance with GAAP. All trades or businesses in the employer’s control group are jointly and severally liable for the employer’s withdrawal liability.
As a part of the Safeway acquisition, we assumed withdrawal liabilities related to Safeway’s previous closure of its Dominick’s division. The respective pension plans have asserted that we may become obligated to pay an estimated maximum withdrawal liability of approximately $510 million if one of the pension plans, the UFCW & Employers Midwest Pension Fund (the “UFCW Midwest Plan”), were to experience a mass withdrawal. A mass withdrawal would require monthly installment payments to be made by us in perpetuity. Our installment payments would be limited to 20 years if we are not part of, or the UFCW Midwest Plan does not experience, a mass withdrawal. Upon the Safeway acquisition, we recorded a $221.8 million multiemployer pension withdrawal liability related to Safeway’s withdrawal from these plans, a difference of $288.2 million from the maximum withdrawal
28
Table of Contents
liability. Our current estimate of the withdrawal liability is based on the fact that a mass withdrawal from the UFCW Midwest Plan has not occurred and our management’s belief that a mass withdrawal liability is remote. We are also disputing in arbitration certain factors used to determine the allocation of the unfunded vested benefits and therefore the annual pension payment installments due to the UFCW Midwest Plan. Our estimated liability reflects our best estimate of the probable outcome of this arbitration. Based on the current facts and circumstances, we believe it is reasonably possible that the estimated liability could change from the amount currently recorded as a result of the arbitration, but because our management believes that a mass withdrawal from the UFCW Midwest Plan is remote, it believes the payment of the maximum liability of $510 million is also remote.
On July 19, 2015, A&P filed a Chapter 11 petition in the United States Bankruptcy Court. Our company and A&P participate in four of the same multiemployer pension plans. The bankruptcy of A&P is expected to adversely affect the funding of these pension plans. Our subsidiary, Acme Markets, entered into a definitive agreement to purchase 71 A&P stores. We are purchasing some but not all of the A&P stores that have contribution obligations to the four plans. Our bid also includes some of the A&P stores that contribute to five plans to which we do not contribute. We estimate that our share of the unfunded actuarial accrued liability in the four plans to which we and A&P both contribute would increase by approximately $58 million for the stores we intend to acquire, and that our share of the unfunded actuarial accrued liability in the additional five plans would be approximately $23 million. A&P and Acme Markets represent approximately 96% of all contributions to one of these plans (although there are approximately eight other contributing employers) and that plan’s unfunded actuarial accrued liability is currently estimated as $296 million based on that plan’s latest disclosure as of December 31, 2013. If the A&P stores we do not purchase withdraw from the four plans in which we participate because no entity purchases them or the stores are sold to a buyer who is not obligated to contribute to the plans, our contingent liability for the underfunding of these plans will increase further because liability for the plans’ underfunding will be shifted to the remaining employers in each of the plans.
See Note 14—Employee Benefit Plans and Collective Bargaining Agreements in our consolidated financial statements, included elsewhere in this prospectus, for more information relating to our participation in these multiemployer pension plans.
Unfavorable changes in government regulation may have a material adverse effect on our business.
Our stores are subject to various federal, state, local and foreign laws, regulations and administrative practices. We must comply with numerous provisions regulating health and sanitation standards, food labeling, energy, environmental, equal employment opportunity, minimum wages and licensing for the sale of food, drugs and alcoholic beverages. We cannot predict either the nature of future laws, regulations, interpretations or applications, or the effect either additional government laws, regulations or administrative procedures, when and if promulgated, or disparate federal, state, local and foreign regulatory schemes would have on our future business. In addition, regulatory changes could require the reformulation of certain products to meet new standards, the recall or discontinuance of certain products not able to be reformulated, additional record keeping, expanded documentation of the properties of certain products, expanded or different labeling and/or scientific substantiation. Any or all of such requirements could have an adverse effect on our business.
The minimum wage continues to increase and is subject to factors outside of our control.
A considerable number of our employees are paid at rates related to the federal minimum wage. Additionally, many of our stores are located in states, including California, where the minimum wage is greater than the federal minimum wage and where a considerable number of employees receive compensation equal to the state’s minimum wage. For example, as of September 12, 2015, we employed approximately 69,000 associates in California, where the current minimum wage was recently increased to $9.00 per hour, and will increase to $10.00 per hour effective January 1, 2016. In
29
Table of Contents
Maryland, where we employed approximately 7,700 associates as of September 12, 2015, the minimum wage was recently increased to $8.25 per hour, and will gradually increase to $10.10 per hour by July 1, 2018. Moreover, municipalities may set minimum wages above the applicable state standards. For example, the minimum wage in Seattle, Washington, where we employed approximately 1,900 associates as of September 12, 2015, was recently increased to $11.00 per hour, and will increase to $15.00 per hour effective January 1, 2017 for employers with more than 500 employees nationwide. In Chicago, Illinois, where we employed approximately 5,900 associates as of September 12, 2015, the minimum wage was recently increased to $10.00 per hour, and will gradually increase to $13.00 per hour by July 1, 2019. Any further increases in the federal minimum wage or the enactment of additional state or local minimum wage increases could increase our labor costs, which may adversely affect our results of operations and financial condition.
The food retail industry is labor intensive. Our ability to meet our labor needs, while controlling wage and labor-related costs, is subject to numerous external factors, including the availability of qualified persons in the workforce in the local markets in which we are located, unemployment levels within those markets, prevailing wage rates, changing demographics and health and other insurance costs. In the event of increasing wage rates, if we fail to increase our wages competitively, the quality of our workforce could decline, causing our customer service to suffer, while increasing wages for our employees could cause our profit margins to decrease. If we are unable to hire and retain employees capable of meeting our business needs and expectations, our business and brand image may be impaired. Any failure to meet our staffing needs or any material increase in turnover rates of our employees may adversely affect our business, results of operations and financial condition.
Our historical financial statements may not be indicative of future performance.
In light of our acquisitions of NAI in March 2013, United in December 2013, and Safeway in January 2015, our operating results only reflect the impact of those acquisitions from those respective dates, and therefore comparisons with prior periods are difficult. As a result, our limited historical financial performance as owners of NAI, United and Safeway may make it difficult for stockholders to evaluate our business and results of operations to date and to assess our future prospects and viability. Furthermore, given the nature of the assets acquired, our recent operating history has resulted in revenue and profitability growth rates that may not be indicative of our future results of operations.
In addition, Safeway completed the distribution of its remaining shares of Blackhawk Network Holdings, Inc. (“Blackhawk”) in April 2014, the sale of the net assets of Canada Safeway Limited in November 2013 and closed or sold its Dominick’s stores in the fourth quarter of 2013. In addition, PDC was sold in December 2014, and Safeway’s 49% interest (the “Casa Ley Interest”) in Casa Ley, S.A. de C.V. (“Casa Ley”), a Mexico-based food and general merchandise retailer, is expected to be divested, with the net proceeds being paid to Safeway’s former stockholders.
As a result of the foregoing transactions and the implementation of new business initiatives and strategies, our historical results of operations are not necessarily indicative of our ongoing operations and the operating results to be expected in the future.
Our unaudited pro forma condensed consolidated pro forma financial information may not be representative of our future results.
The pro forma financial information included in this prospectus is constructed from our consolidated financial statements and the historical consolidated financial statements of Safeway prior to the Safeway acquisition and does not purport to be indicative of the financial information that will result from our future operations. In addition, the pro forma financial information presented in this prospectus is based in part on certain assumptions that we believe are reasonable. We cannot assure you that our assumptions will prove to be accurate over time. Accordingly, the pro forma financial
30
Table of Contents
information included in this prospectus does not purport to be indicative of what our results of operations and financial condition would have been had AB Acquisition and Safeway been a combined entity during the period presented, or what our results of operations and financial condition will be in the future. The challenges associated with integrating previously independent businesses makes evaluating our business and our future financial prospects difficult. Our potential for future business success and operating profitability must be considered in light of the risks, uncertainties, expenses and difficulties typically encountered by other companies following business combinations.
Unfavorable changes in, failure to comply with or increased costs to comply with environmental laws and regulations could adversely affect us. The storage and sale of petroleum products could cause disruptions and expose us to potentially significant liabilities.
Our operations, including our 379 fuel centers, are subject to various laws and regulations relating to the protection of the environment, including those governing the storage, management, disposal and cleanup of hazardous materials. Some environmental laws, such as the Comprehensive Environmental Response, Compensation and Liability Act and similar state statutes, impose strict, and under certain circumstances joint and several, liability for costs to remediate a contaminated site, and also impose liability for damages to natural resources.
Federal regulations under the Clean Air Act require phase out of the production of ozone-depleting refrigerants that include hydrochlorofluorocarbons, the most common of which is R-22. By 2020, production of new R-22 refrigerant gas will be completely phased out; however, recovered and recycled/reclaimed R-22 will be available for servicing systems after 2020. The company is reducing its R-22 footprint while continuing to repair leaks, thus extending the useful lifespan of existing equipment. For fiscal 2015, $3.3 million has been budgeted for system retrofits, and we budgeted approximately $3 million in subsequent years. Leak repairs are part of the ongoing refrigeration maintenance budget. We may be required to spend additional capital above and beyond what is currently budgeted for system retrofits and leak repairs which could have a significant impact on our business, results of operations and financial condition.
Third-party claims in connection with releases of or exposure to hazardous materials relating to our current or former properties or third-party waste disposal sites can also arise. In addition, the presence of contamination at any of our properties could impair our ability to sell or lease the contaminated properties or to borrow money using any of these properties as collateral. The costs and liabilities associated with any such contamination could be substantial, and could have a material adverse effect on our business. Under current environmental laws, we may be held responsible for the remediation of environmental conditions regardless of whether we lease, sublease or own the stores or other facilities and regardless of whether such environmental conditions were created by us or a prior owner or tenant. In addition, the increased focus on climate change, waste management and other environmental issues may result in new environmental laws or regulations that negatively affect us directly or indirectly through increased costs on our suppliers. There can be no assurance that environmental contamination relating to prior, existing or future sites or other environmental changes will not adversely affect us through, for example, business interruption, cost of remediation or adverse publicity.
We are subject to, and may in the future be subject to, legal or other proceedings that could have a material adverse effect on us.
From time to time, we are a party to legal proceedings, including matters involving personnel and employment issues, personal injury, antitrust claims, intellectual property claims and other proceedings arising in or outside of the ordinary course of business. In addition, there are an increasing number of cases being filed against companies generally, which contain class-action allegations under federal and state wage and hour laws. We estimate our exposure to these legal proceedings and establish reserves for the estimated liabilities. Assessing and predicting the outcome of these matters involves
31
Table of Contents
substantial uncertainties. Although not currently anticipated by management, unexpected outcomes in these legal proceedings or changes in management’s forecast assumptions or predictions, could have a material adverse impact on our results of operations.
We may be adversely affected by risks related to our dependence on IT systems. Any future intrusion into these IT systems, even if we are compliant with industry security standards, could materially adversely affect our reputation, financial condition and operating results.
We have complex IT systems that are important to the success of our business operations and marketing initiatives. If we were to experience failures, breakdowns, substandard performance or other adverse events affecting these systems, or difficulties accessing the proprietary business data stored in these systems, or in maintaining, expanding or upgrading existing systems or implementing new systems, we could incur significant losses due to disruptions in our systems and business.
Our ability to effectively manage the day-to-day business of approximately 900 Albertsons and NAI stores depends significantly on IT services and systems provided by SuperValu pursuant to two transition services agreements (the “SVU TSAs”). It is intended that SuperValu will also provide IT services and systems for the stores Acme Markets acquires pursuant to the A&P Transaction. Prior to Albertsons’ and NAI’s transition onto Safeway’s IT systems, the failure of SuperValu’s systems to operate effectively or to integrate with other systems, or unauthorized access into SuperValu’s systems, could cause us to incur significant losses due to disruptions in our systems and business.
We receive and store personal information in connection with our marketing and human resources organizations. The protection of our customer and employee data is critically important to us. Despite our considerable efforts to secure our respective computer networks, security could be compromised, confidential information could be misappropriated or system disruptions could occur, as has occurred with a number of other retailers. If we (or through SuperValu) experience a data security breach, we could be exposed to government enforcement actions, possible assessments from the card brands if credit card data was involved and potential litigation. In addition, our customers could lose confidence in our ability to protect their personal information, which could cause them to stop shopping at our stores altogether. The loss of confidence from a data security breach involving our employees could hurt our reputation and cause employee recruiting and retention challenges.
Improper activities by third parties, exploitation of encryption technology, new data-hacking tools and discoveries and other events or developments may result in future intrusions into or compromise of our networks, payment card terminals or other payment systems. In particular, the techniques used by criminals to obtain unauthorized access to sensitive data change frequently and often cannot be recognized until launched against a target; accordingly, we may not be able to anticipate these frequently changing techniques or implement adequate preventive measures for all of them. Any unauthorized access into our customers’ sensitive information, or data belonging to us or our suppliers, even if we are compliant with industry security standards, could put us at a competitive disadvantage, result in deterioration of our customers’ confidence in us, and subject us to potential litigation, liability, fines and penalties and consent decrees, resulting in a possible material adverse impact on our financial condition and results of operations.
As merchants who accept debit and credit cards for payment, we are subject to the Payment Card Industry (“PCI”) Data Security Standard (“PCI DSS”) issued by the PCI Council. PCI DSS contains compliance guidelines and standards with regard to our security surrounding the physical administrative and technical storage, processing and transmission of individual cardholder data. By accepting debit cards for payment, we are also subject to compliance with American National Standards Institute (“ANSI”) data encryption standards and payment network security operating guidelines. In addition, we are required to comply with PCI DSS version 3.0 for our 2015 assessment, and are replacing or enhancing our in-store systems to comply with these standards. Failure to be PCI
32
Table of Contents
compliant or to meet other payment card standards may result in the imposition of financial penalties or the allocation by the card brands of the costs of fraudulent charges to us. Despite our efforts to comply with these or other payment card standards and other information security measures, we cannot be certain that all of our (or through SuperValu) IT systems will be able to prevent, contain or detect all cyber-attacks or intrusions from known malware or malware that may be developed in the future. To the extent that any disruption results in the loss, damage or misappropriation of information, we may be adversely affected by claims from customers, financial institutions, regulatory authorities, payment card associations and others. In addition, the cost of complying with stricter privacy and information security laws and standards, including PCI DSS version 3.0 and ANSI data encryption standards, could be significant.
Termination of the SuperValu transition services agreement or the failure of SuperValu to perform its obligations thereunder could adversely affect our business, financial results and financial condition.
Our ability to effectively monitor and control the operations of Albertsons and NAI depends to a large extent on the proper functioning of our IT and business support systems. In connection with our acquisition of NAI, Albertsons and NAI each entered into a comprehensive transition services agreement with SuperValu. Pursuant to the SVU TSAs, Albertsons and NAI each pay fees to SuperValu for certain services, including back office, administrative, IT, procurement, insurance and accounting services. The SVU TSAs limit the liability of SuperValu to instances in which SuperValu has committed gross negligence in regard to the provision of services or has breached its obligations under the SVU TSAs. The SVU TSAs terminated and replaced a transition services agreement providing for substantially similar services, which we had previously entered into with SuperValu in connection with our June 2006 acquisition of the Legacy Albertsons Stores. We plan to complete the transition of our Albertsons and NAI stores, distribution centers and systems onto Safeway’s IT systems by mid-2018, but may suffer disruptions as part of that process. In addition, we are dependent upon SuperValu to continue to provide these services to Albertsons and NAI until we transition Albertsons and NAI onto Safeway’s IT system and otherwise replace SuperValu as a service provider to Albertsons and NAI. In addition, we may depend on SuperValu to manage IT services and systems for additional stores we acquire, including the A&P stores we are acquiring, until we are able to transition such stores onto Safeway’s IT system. The failure by SuperValu to perform its obligations under the SVU TSAs prior to Albertsons’ and NAI’s transition onto Safeway’s IT systems and to other service providers (external or internal) could adversely affect our business, financial results, prospects and results of operations.
Furthermore, SuperValu manages and operates NAI’s distribution center located in the Lancaster, Pennsylvania area. Under the Lancaster Agreement (as defined herein), SuperValu supplies NAI’s Acme and Shaw’s stores from the distribution center under a shared costs arrangement. The failure by SuperValu to perform its obligations under the Lancaster Agreement could adversely affect our business, financial results and financial condition.
Our third-party IT services provider discovered unauthorized computer intrusions in 2014. These intrusions could adversely affect our brands and could discourage customers from shopping in our Albertsons and NAI stores.
Our third-party IT services provider for Albertsons and NAI, SuperValu, informed us in the summer of 2014 that it discovered unlawful intrusions to approximately 800 Shaw’s, Star Market, Acme, Jewel-Osco and Albertsons banner stores in an attempt to obtain payment card data. We have contacted the appropriate law enforcement authorities regarding these incidents and have coordinated with our merchant bank and payment processors to address the situation. We maintain insurance to address potential liabilities for cyber risks and, in the case of Albertsons and NAI, are self-insured for cyber risks for periods prior to August 11, 2014. We have also notified our various insurance carriers of these incidents and are providing further updates to the carriers as the investigation continues.
33
Table of Contents
We believe the intrusions may have been an attempt to collect payment card data. The unlawful intrusions have given rise to putative class action litigation complaints against SuperValu and our company on behalf of customers. On October 6, 2015, we received a letter from the Office of Attorney General of the Commonwealth of Pennsylvania stating that the Illinois and Pennsylvania Attorneys General Offices are leading a multistate group that includes the Attorneys General for 14 other states requesting specified information concerning the two data breach incidents. We are in the process of providing the requested information. In addition, the payment card networks required that forensic investigations be conducted of the intrusions. The forensic firm retained by us to conduct an investigation has issued separate reports for each intrusion (copies of which have been provided to the payment card networks). In both reports, the forensic firm found that not all of the PCI DSS standards had been met and that some of this non-compliance may have contributed to or caused at least some portion of the compromise that occurred during the intrusions. We believe it is probable that the payment card networks will make claims against us. These claims will likely include amounts for incremental counterfeit fraud losses and non-ordinary course operating expenses (such as card reissuance costs) that the payment card networks assert they or their issuing banks have incurred. If the payment card networks assert claims against us, we currently intend to dispute those claims and assert available defenses. At the present time, we believe that it is probable that we will incur a loss in connection with the potential claims from the payment card networks. We have recorded an estimated liability for probable losses that we expect to incur in connection with the potential claims to be made by the payment card networks. The estimated liability is based on information currently available to us and may change as new information becomes available or when the payment card networks assert their claims against us. We will continue to evaluate information as it becomes known and will record an estimate of loss when it is both probable that a loss has been incurred and the amount of the loss is reasonably estimable. Currently, the potential range of any loss above our currently recorded amount cannot be reasonably estimated given no claims have yet been asserted and because significant factual and legal issues remain unresolved. On October 20, 2015, we agreed with one of our third-party payment card administrators to post a $15 million letter of credit to cover potential fines and penalties from certain card brands and to maintain a minimum level of card processing until the potential claims from the card brands are resolved.
There can be no assurance that we will not suffer a similar criminal attack in the future or that unauthorized parties will not gain access to personal information of our customers. While we have recently implemented additional security software and hardware designed to provide additional protections against unauthorized intrusions, there can be no assurance that unauthorized individuals will not discover a means to circumvent our security. Computer intrusions could adversely affect our brands, have caused us to incur legal and other fees, may cause us to incur additional expenses for additional security measures and could discourage customers from shopping in our stores.
We use a combination of insurance and self-insurance to address potential liabilities for workers’ compensation, automobile and general liability, property risk (including earthquake and flood coverage), director and officers’ liability, employment practices liability, pharmacy liability and employee health care benefits.
We use a combination of insurance and self-insurance to address potential liabilities for workers’ compensation, automobile and general liability, property risk (including earthquake and flood coverage), director and officers’ liability, employment practices liability, pharmacy liability and employee health care benefits and cyber and terrorism risks. We estimate the liabilities associated with the risks retained by us, in part, by considering historical claims experience, demographic and severity factors and other actuarial assumptions which, by their nature, are subject to a high degree of variability. Among the causes of this variability are unpredictable external factors affecting future inflation rates, discount rates, litigation trends, legal interpretations, benefit level changes and claim settlement patterns.
34
Table of Contents
The majority of our workers’ compensation liability is from claims occurring in California. California workers’ compensation has received intense scrutiny from the state’s politicians, insurers, employers and providers, as well as the public in general.
Our long-lived assets, primarily stores, are subject to periodic testing for impairment.
Our long-lived assets, primarily stores, are subject to periodic testing for impairment. Safeway incurred significant impairment charges to earnings in the past, including in Safeway’s fiscal years ended January 3, 2015, December 28, 2013 and December 29, 2012. Failure to achieve sufficient levels of cash flow at reporting units could result in impairment charges on long-lived assets.
Our operations are dependent upon the availability of a significant amount of energy and fuel to manufacture, store, transport and sell products.
Our operations are dependent upon the availability of a significant amount of energy and fuel to manufacture, store, transport and sell products. Energy and fuel costs are influenced by international, political and economic circumstances and have experienced volatility over time. To reduce the impact of volatile energy costs, we have entered into contracts to purchase electricity and natural gas at fixed prices to satisfy a portion of our energy needs. We also manage our exposure to changes in energy prices utilized in the shipping process through the use of short-term diesel fuel derivative contracts. Volatility in fuel and energy costs that exceeds offsetting contractual arrangements could adversely affect our results of operations.
Haggen has asserted claims against us, which, if adversely determined, would subject us to significant liabilities.
On September 1, 2015, following FTC-mandated divestitures of certain of our stores to Haggen, Haggen commenced a lawsuit against Albertson’s LLC and Albertson’s Holdings LLC in the United States District Court for the District of Delaware, alleging claims for violation of Section 7 of the Clayton Act, attempted monopolization under the Sherman Act, breach of contract, indemnification, breach of implied covenant of good faith and fair dealing, fraud, unfair competition, misappropriation of trade secrets under the Uniform Trade Secrets Acts, conversion and violation of the Washington Consumer Protection Act. In the complaint, Haggen alleged that we, among other actions set out in the complaint, misused Haggen’s confidential information to draw customers away from Haggen stores, provided inaccurate, incomplete and misleading inventory data and pricing information on products transferred to Haggen, deliberately understocked and overstocked inventory in stores acquired by Haggen and wrongfully cut off advertising prior to the transfer of stores to Haggen. Furthermore, Haggen alleged that, if it is destroyed as a competitor, its damages may exceed $1 billion, and asserted it is entitled to treble and punitive damages and to seek rescission of the asset purchase agreement. In addition, on September 17, 2015, we received a letter from the legal counsel of another purchaser of a small number of our FTC-mandated divested stores, alleging claims similar to those presented in Haggen’s lawsuit. We believe that the claims asserted by Haggen and the additional purchaser are without merit and intend to vigorously defend against the claims. Based on the proceedings to date, we are unable to determine the probability of the outcome of this matter or the range of reasonably possible loss, if any. An unfavorable resolution of the litigation could subject us to significant liabilities.
We may have liability under certain operating leases that were assigned to third parties.
We may have liability under certain operating leases that were assigned to third parties. If any of these third parties fail to perform their obligations under the leases, we could be responsible for the lease obligation. In connection with FTC-mandated divestitures, we assigned leases with respect to 93 store properties to Haggen. On August 14, 2015, Haggen announced that it intended to close 26 stores
35
Table of Contents
(including 18 leased stores and one ground-leased store) that we sold to it and that it may close or sell additional stores in the future. On September 8, 2015, Haggen commenced a case under Chapter 11 of the U.S. Bankruptcy Code in the United States Bankruptcy Court for the District of Delaware, and on September 14, 2015, Haggen filed a motion in its bankruptcy case for an order authorizing and approving procedures for the rejection of unexpired leases (but stating that the motion did not seek to assume or reject any particular lease). On September 24, 2015, Haggen filed a motion to implement procedures to close 99 additional stores that we sold to it (including 56 leased stores and nine ground-leased stores) and on October 19, 2015, Haggen secured Bankruptcy Court approval of bidding procedures for the sale of 130 stores that we sold to it (including 72 leased stores and 11 ground leased stores), including 36 stores (including 26 leased stores) to two stalking-horse bidders. Pursuant to the bidding procedures order and following FTC and state attorneys general clearance, we submitted binding bids to re-acquire 37 store leases (of which 22 were leases we assigned to Haggen and 15 were fee properties we sold to Haggen which Haggen subsequently sold and now leases). On November 13, 2015, we submitted an asset purchase agreement to re-acquire 29 store leases for which we were determined to have submitted the highest or best bid for an aggregate purchase price of $14.3 million, and we continue to pursue the acquisition of four additional stores at an aggregate purchase price of $500,000 for which our purchase is contingent on lease modifications. At the auction, other food retailers, store operators and landlords were determined to be the highest or best bid for an additional 18 store leases that we had assigned to Haggen. The two stalking horse bids for 36 stores (26 of which were store leases we assigned to Haggen) were also determined to be the highest or best bids. On November 13, 2015, the Bankruptcy Court approved the two stalking horse bids. Our asset purchase agreement and the other bids are subject to approval by the Bankruptcy Court, which is set for hearing on November 24, 2015. Landlords have objected to certain lease sales. Should Haggen reject its obligations under the assigned leases that are not sold, or otherwise default on its lease obligations, or if landlord obligations with respect to certain store lease sales are upheld, we could be responsible for the obligations of Haggen under such leases. The aggregate undiscounted lease obligations under the store leases assigned to Haggen for which no bids have been submitted to date is approximately $90 million, which includes contingent lease liability with respect to eight leased stores that Haggen has identified as “core.” Haggen has filed a motion for Bankruptcy Court approval of bidding procedures to sell the core stores. We do not know the extent to which Haggen will reject or default on its lease obligations to third parties or whether Haggen will be successful in selling these remaining store leases to third parties. We also do not know what defenses may be available to us, including any loss mitigation obligations of Haggen’s landlords under the terms of the leases or applicable law. As a result, we are currently unable to estimate our losses with respect to any potential contingent liability with respect to the Haggen leases.
With respect to other leases we have assigned to third parties (other than Haggen), because of the wide dispersion among third parties and the variety of remedies available, we believe that if an assignee became insolvent it would not have a material effect on our financial condition, results of operations or cash flows. No liability has been recorded for assigned leases in our consolidated balance sheet related to these contingent obligations.
We may be unable to attract and retain key personnel, which could adversely impact our ability to successfully execute our business strategy.
The continued successful implementation of our business strategy depends in large part upon the ability and experience of members of our senior management. In addition, our performance is dependent on our ability to identify, hire, train, motivate and retain qualified management, technical, sales and marketing and retail personnel. We cannot assure you that we will be able to retain such personnel on acceptable terms or at all. If we lose the services of members of our senior management or are unable to continue to attract and retain the necessary personnel, we may not be able to successfully execute our business strategy, which could have an adverse effect on our business.
36
Table of Contents
Risks Related to the Safeway and A&P Acquisitions and Integration
We may not be able to successfully integrate and combine Safeway with Albertsons and NAI, which could cause our business to suffer.
We may not be able to successfully integrate and combine the operations, management, personnel and technology of Safeway with the operations of Albertsons and NAI. If the integration is not managed successfully by our management, we may experience interruptions in our business activities, a deterioration in our employee and customer relationships, increased costs of integration and harm to our reputation with consumers, all of which could have a material adverse effect on our business. We may also experience difficulties in combining corporate cultures, maintaining employee morale and retaining key employees. In addition, the integration of our businesses will impose substantial demands on our management. There is no assurance that the benefits of consolidation will be achieved as a result of the Safeway acquisition or that our businesses will be successfully integrated in a timely manner.
We may not be able to achieve the full amount of synergies that are anticipated, or achieve the synergies on the schedule anticipated, from the Safeway acquisition.
Although we currently expect to achieve annual synergies from the Safeway acquisition of approximately $800 million by the end of fiscal 2018, with associated one-time costs of approximately $1.1 billion, or $690 million, net of estimated synergy-related asset sale proceeds, inclusion of the projected cost synergies in this prospectus should not be viewed as a representation that we in fact will achieve this annual synergy target by the end of fiscal 2018, or at all. Although we currently expect to achieve synergies from the Safeway acquisition of approximately $200 million during fiscal 2015, or $440 million on an annual run-rate basis, by the end of fiscal 2015, the inclusion of these expected cost synergy targets in this prospectus should not be viewed as a representation that we will in fact achieve these synergies by the end of fiscal 2015, or at all. To the extent we fail to achieve these synergies, our results of operations may be impacted, and any such impact may be material.
We have identified various synergies including corporate and division overhead savings, our own brands, vendor funds, the conversion of Albertsons and NAI onto Safeway’s IT systems, marketing and advertising cost reduction and operational efficiencies within our back office, distribution and manufacturing organizations. Actual synergies, the expenses and cash required to realize the synergies and the sources of the synergies could differ materially from these estimates, and we cannot assure you that we will achieve the full amount of synergies on the schedule anticipated, or at all, or that these synergy programs will not have other adverse effects on our business. In light of these significant uncertainties, you should not place undue reliance on our estimated synergies.
We have incurred, and will continue to incur, significant integration costs in connection with Safeway.
We expect that we will continue to incur a number of costs associated with integrating the operations of Safeway, including associated one-time costs of approximately $1.1 billion, or $690 million, net of estimated synergy-related asset sale proceeds, to achieve expected synergies. The substantial majority of these costs will be non-recurring expenses resulting from the Safeway acquisition and will consist of our transition of Albertsons and NAI to Safeway’s IT systems, consolidation costs and employment-related costs. Anticipated synergies are expected to require approximately $300 million of one-time integration-related capital expenditures in fiscal 2015, in advance of anticipated sales of surplus assets. Additional unanticipated costs may be incurred in the integration of Safeway’s business and proceeds from the sale of surplus assets may be lower than anticipated. Although we expect that the elimination of duplicative costs, as well as the realization of other efficiencies related to the integration of the businesses, may offset incremental transaction and merger-related costs over time, this net benefit may not be achieved in the near term, or at all.
37
Table of Contents
New business initiatives and strategies may be less successful than anticipated and could adversely affect our business.
The introduction, implementation, success and timing of new business initiatives and strategies, including, but not limited to, initiatives to increase revenue or reduce costs, may be less successful or may be different than anticipated, which could adversely affect our business.
We are currently party to appraisal proceedings related to our acquisition of Safeway which, if adversely determined, could subject us to significant liabilities.
In connection with the Safeway acquisition, five petitions for appraisal were filed in the Court of Chancery of the State of Delaware on behalf of all former holders of Safeway common stock who had demanded appraisal. The petitioners, who held approximately 17.7 million shares of Safeway common stock prior to its acquisition by the company, refused to accept the per share merger consideration that was paid to other stockholders in the acquisition and have instead requested an appraisal of the fair value of those shares pursuant to Section 262 of the Delaware General Corporation Law (the “DGCL”), requesting a determination that the per share merger consideration payable in the Safeway acquisition does not represent fair value for their shares. In May 2015, five of the seven petitioners dismissed their claims in exchange for additional merger consideration. The appraisal action is ongoing with respect to the two remaining petitioners, with trial on the merits set to commence in April 2016. These remaining petitioners, representing approximately 3.7 million shares of Safeway common stock, have previously accepted a tender offer of the cash portion of the merger consideration of $34.92 per share, which stops statutory interest from accruing on the amount of any recovery. A reserve for outstanding appraisal claims has been established by the company. If the remaining petitioners are successful, we could be required to pay those petitioners more for their stock than the per share merger consideration payable in the Safeway acquisition, which amount may be in excess of the liability that we have recorded.
We will be required to make payments under the contingent value rights within agreed periods even if the sale of the Casa Ley Interest is not completed within those periods.
If the Casa Ley Interest is not sold prior to January 30, 2018, we are obligated to make a cash payment to the holders of contingent value rights (the “Casa Ley CVRs”) in an amount equal to the fair market value of the unsold Casa Ley Interest, minus certain fees, expenses and assumed taxes that would have been deducted from the proceeds of a sale of the Casa Ley Interest. The sale process for the Casa Ley Interest will be conducted by a committee, or person controlled by a committee, as representative of the former Safeway stockholders, and we cannot control such sales process. If we are required to make a payment under the contingent value rights agreement with respect to the Casa Ley CVRs, our liquidity may be adversely affected.
We have not provided any detailed financial information with respect to A&P or any pro forma information reflecting the A&P Transaction in this prospectus.
Pursuant to applicable Securities and Exchange Commission (“SEC”) rules, this prospectus does not include or incorporate by reference any detailed financial information with respect to the assets to be acquired pursuant to the A&P Transaction. In addition, in accordance with applicable SEC rules, we are not required to provide and have not provided any pro forma information giving effect to the A&P Transaction. A&P’s financial condition and results of operations for periods prior to its entry into bankruptcy are of limited utility in assessing the potential impact of the A&P Transaction on our financial condition because we are only purchasing certain assets and assuming certain liabilities of A&P.
We will incur significant acquisition-related costs in connection with the A&P Transaction.
We expect to incur a number of costs associated with integrating the operations of the acquired A&P stores. We expect to spend approximately $126 million of one-time opening and transition costs
38
Table of Contents
and capital expenditures to remodel and remerchandise the stores and to invest in price and labor. The amount of expenditures required to improve store conditions and reposition the stores is greater on a per store basis than our previous acquisitions. Although we expect that the elimination of duplicative costs, as well as the realization of other efficiencies related to the integration of the acquired A&P stores may offset these costs over time, this net benefit may not be achieved in the near term, or at all.
We may not be able to achieve the full amount of synergies that are anticipated or achieve the synergies on the schedule anticipated from the A&P Transaction.
Although we currently expect to achieve annual synergies from the A&P Transaction of approximately $47 million by the end of fiscal 2019, inclusion of the projected cost synergies in this prospectus should not be viewed as a representation that we in fact will achieve this annual synergy target by the end of fiscal 2019, or at all. To the extent we fail to achieve these synergies, our results of operations may be impacted, and any such impact may be material.
We have identified various synergies including sourcing, distribution and IT. Actual synergies, the expenses and cash required to realize the synergies and the sources of the synergies could differ materially from our estimates, and we cannot assure you that we will achieve the full amount of synergies on the schedule anticipated, or at all. In light of these significant uncertainties, you should not place undue reliance on our estimated synergies from the A&P Transaction.
Risks Relating to Our Indebtedness
Our substantial level of indebtedness could adversely affect our financial condition and prevent us from fulfilling our obligations under our indebtedness.
We have a significant amount of indebtedness. As of September 12, 2015 and after giving pro forma effect to this offering and the application of the use of the net proceeds of this offering (but without giving effect to the Anticipated Refinancing), we would have had $10.1 billion of debt outstanding, and we would have been able to borrow an additional $2.4 billion under our revolving credit facilities.
Our substantial indebtedness could have important consequences to you. For example, it could:
| • | adversely affect the market price of our common stock; |
| • | increase our vulnerability to general adverse economic and industry conditions; |
| • | require us to dedicate a substantial portion of our cash flow from operations to payments on our indebtedness, thereby reducing the availability of our cash flow to fund working capital, capital expenditures and other general corporate purposes, including acquisitions; |
| • | limit our flexibility in planning for, or reacting to, changes in our business and the industry in which we operate; |
| • | place us at a competitive disadvantage compared to our competitors that have less debt; and |
| • | limit our ability to borrow additional funds. |
In addition, we cannot assure you that we will be able to refinance any of our debt or that we will be able to refinance our debt on commercially reasonable terms. If we were unable to make payments or refinance our debt or obtain new financing under these circumstances, we would have to consider other options, such as:
| • | sales of assets; |
| • | sales of equity; or |
| • | negotiations with our lenders to restructure the applicable debt. |
39
Table of Contents
Our debt instruments (including those that would be applicable to the Anticipated Refinancing) may restrict, or market or business conditions may limit, our ability to use some of our options.
Despite our significant indebtedness levels, we may still be able to incur substantially more debt, which could further exacerbate the risks associated with our substantial leverage.
We and our subsidiaries may be able to incur substantial additional indebtedness in the future. The terms of the credit agreements that govern the ABS/Safeway ABL Facility, the NAI ABL Facility, the ABS/Safeway Term Loan Facilities and the NAI Term Loan Facility (each as defined herein and, collectively, the “Senior Secured Credit Facilities”) and the indentures that govern the NAI Notes (as defined herein), the Safeway Notes (as defined herein) and the ABS/Safeway Notes permit, and, if we consummate the Anticipated Refinancing, the credit agreements that will govern the New Credit Facilities and the indenture that will govern the New Notes will permit, us to incur significant additional indebtedness, subject to certain limitations. If new indebtedness is added to our and our subsidiaries’ current debt levels, the related risks that we and they now face would intensify. See “Description of Indebtedness.”
We may be unable to complete the Anticipated Refinancing, or we may decide not to pursue the Anticipated Refinancing.
Subject to market conditions, we intend to pursue the Anticipated Refinancing after the consummation of this offering. The Anticipated Refinancing is expected to extend the weighted average maturity of our indebtedness, reduce the amount of our secured indebtedness and provide us with more flexibility to pursue various transactions than we have under the restrictive covenants in our existing debt instruments. The terms of the Anticipated Refinancing may be adversely affected by economic, market, geopolitical and other conditions prevailing at the time we propose to consummate such transactions, most of which are beyond our control. There can be no assurance that we will be able to complete the Anticipated Refinancing on terms favorable to us, or at all, and we may decide not to pursue the Anticipated Refinancing before its completion. If we are unable to complete, or elect not to pursue, the Anticipated Refinancing, there can be no assurance that we will be able to refinance our existing indebtedness prior to maturity on terms and conditions favorable to us, or at all.
Our debt instruments limit our flexibility in operating our business.
Our debt instruments contain (and the debt instruments that would be applicable to the Anticipated Refinancing are expected to contain) various covenants that limit our and our restricted subsidiaries’ ability to engage in specified types of transactions, including, among other things:
| • | incur additional indebtedness or provide guarantees in respect of obligations of other persons, or issue disqualified or preferred stock; |
| • | pay dividends on, repurchase or make distributions in respect of our capital stock or make other restricted payments; |
| • | prepay, redeem or repurchase debt; |
| • | make loans, investments and capital expenditures; |
| • | sell or otherwise dispose of certain assets; |
| • | incur liens; |
| • | engage in sale and leaseback transactions; |
| • | restrict dividends, loans or asset transfers from our subsidiaries; |
| • | consolidate, merge, sell or otherwise dispose of all or substantially all of our assets; |
40
Table of Contents
| • | enter into a new or different line of business; and |
| • | enter into certain transactions with our affiliates. |
A breach of any of these covenants could result in a default under our debt instruments. In addition, any debt agreements we enter into in the future may further limit our ability to enter into certain types of transactions. In addition, the restrictive covenants in the revolving portion of our Senior Secured Credit Facilities (as defined herein) require us (and if the Anticipated Refinancing is consummated, the New Credit Facilities are expected to require us), in certain circumstances, to maintain a specific fixed charge coverage ratio. Our ability to meet that financial ratio can be affected by events beyond our control, and we cannot assure you that we will meet it. A breach of this covenant could result in a default under our Senior Secured Credit Facilities (or under the New Credit Facilities if we consummate the Anticipated Refinancing). Moreover, the occurrence of a default under our Senior Secured Credit Facilities (or under the New Credit Facilities if we consummate the Anticipated Refinancing) could result in an event of default under our other indebtedness. Upon the occurrence of an event of default under our Senior Secured Credit Facilities or the New Credit Facilities, the lenders could elect to declare all amounts outstanding under our Senior Secured Credit Facilities or the New Credit Facilities to be immediately due and payable and terminate all commitments to extend further credit. Even if we are able to obtain new financing, it may not be on commercially reasonable terms, or terms that are acceptable to us. See “Description of Indebtedness.”
We may not have the ability to raise the funds necessary to finance the change of control offer required by the indentures governing the 2016 Safeway Notes, the 2017 Safeway Notes, the 2019 Safeway Notes, the 2020 Safeway Notes, the ABS/Safeway Notes and, if we consummate the Anticipated Refinancing, the New Notes (each as defined herein and, collectively, the “CoC Notes”).
Upon the occurrence of certain kinds of change of control events, we will be required to offer to repurchase outstanding CoC Notes at 101% of the principal amount thereof plus accrued and unpaid interest to the date of repurchase. However, it is possible that we will not have sufficient funds at the time of the change of control to make the required repurchase of the CoC Notes or that restrictions in our debt instruments (including those that would be applicable to the Anticipated Refinancing) will not allow such repurchases. Our failure to purchase the tendered notes would constitute an event of default under the indentures governing the CoC Notes which, in turn, would constitute a default under our Senior Secured Credit Facilities (or under the New Credit Facilities if we consummate the Anticipated Refinancing). In addition, the occurrence of a change of control would also constitute a default under our Senior Secured Credit Facilities (or under the New Credit Facilities if we consummate the Anticipated Refinancing). A default under our Senior Secured Credit Facilities (or under the New Credit Facilities if we consummate the Anticipated Refinancing) would result in a default under our indentures if the lenders accelerate the debt under our Senior Secured Credit Facilities.
Moreover, our debt instruments restrict, and any future indebtedness we incur (including the New Credit Facilities if we consummate the Anticipated Refinancing) may restrict, our ability to repurchase the notes, including following a change of control event. As a result, following a change of control event, we may not be able to repurchase the CoC Notes unless we first repay all indebtedness outstanding under our Senior Secured Credit Facilities (or under the New Credit Facilities if we consummate the Anticipated Refinancing) and any of our other indebtedness that contains similar provisions, or obtain a waiver from the holders of such indebtedness to permit us to repurchase the CoC Notes. We may be unable to repay all of that indebtedness or obtain a waiver of that type. Any requirement to offer to repurchase the outstanding CoC Notes may therefore require us to refinance our other outstanding debt, which we may not be able to do on commercially reasonable terms, if at all. These repurchase requirements may also delay or make it more difficult for others to obtain control of us.
41
Table of Contents
Substantially all of our assets are pledged as collateral under the Senior Secured Credit Facilities, the NAI Notes, the Safeway Notes, the ABS/Safeway Notes and, if we consummate the Anticipated Refinancing, the New Credit Facilities.
As of September 12, 2015, our total indebtedness was approximately $11.6 billion, and after giving effect to this offering and the application of the use of the net proceeds of this offering (but without giving effect to the Anticipated Refinancing), our total indebtedness as of September 12, 2015 would have been approximately $10.1 billion on a pro forma basis, including $5.8 billion of indebtedness outstanding under our Senior Secured Credit Facilities, $1.8 billion outstanding under the NAI Notes, $1.5 billion outstanding under the Safeway Notes, and $365.8 million aggregate principal amount outstanding under the ABS/Safeway Notes. In addition, as of September 12, 2015, we had $637.2 million of outstanding standby letters of credit under our Senior Secured Credit Facilities. Substantially, all of our and our subsidiaries’ assets are pledged as collateral (and if we consummate the Anticipated Refinancing, will be pledged as collateral) for this Indebtedness (other than the New Notes). As of September 12, 2015 and after giving pro forma effect to this offering and the application of the use of the net proceeds of this offering (but without giving effect to the Anticipated Refinancing), our revolving credit facilities would have permitted additional borrowings of up to a maximum of $2.4 billion under the borrowing bases as of that date. If we are unable to repay all secured borrowings when due, whether at maturity or if declared due and payable following a default, the trustee or the lenders, as applicable, would have the right to proceed against the collateral pledged to secure the indebtedness and may sell the assets pledged as collateral in order to repay those borrowings, which could have a material adverse effect on our business, financial condition, results of operations or cash flows.
Increases in interest rates and/or a downgrade of our credit ratings could negatively affect our financing costs and our ability to access capital.
We have exposure to future interest rates based on the variable rate debt under our credit facilities (and if we consummate the Anticipated Refinancing, under our New Credit Facilities) and to the extent we raise additional debt in the capital markets to meet maturing debt obligations, to fund our capital expenditures and working capital needs and to finance future acquisitions. Daily working capital requirements are typically financed with operational cash flow and through the use of various committed lines of credit. The interest rate on these borrowing arrangements is generally determined from the inter-bank offering rate at the borrowing date plus a pre-set margin. Although we employ risk management techniques to hedge against interest rate volatility, significant and sustained increases in market interest rates could materially increase our financing costs and negatively impact our reported results.
We rely on access to bank and capital markets as sources of liquidity for cash requirements not satisfied by cash flows from operations. A downgrade in our credit ratings from the internationally recognized credit rating agencies could negatively affect our ability to access the bank and capital markets, especially in a time of uncertainty in either of those markets. A rating downgrade could also impact our ability to grow our business by substantially increasing the cost of, or limiting access to, capital.
Risks Related to This Offering and Owning Our Common Stock
There is no existing market for our common stock, and we do not know if one will develop to provide you with adequate liquidity. If the stock price fluctuates after this offering, you could lose a significant part of your investment.
Prior to this offering, there has not been a public market for our common stock. We cannot predict the extent to which investor interest in our company will lead to the development of an active trading
42
Table of Contents
market on the NYSE or otherwise or how liquid that market might become. If an active trading market does not develop, you may have difficulty selling shares of our common stock that you buy. The initial public offering price for the shares will be determined by negotiations between us and the underwriters and may not be indicative of prices that will prevail in the open market following this offering. The market price of our common stock may be influenced by many factors, some of which are beyond our control, including:
| • | the failure of securities analysts to cover our common stock after this offering, or changes in financial estimates by analysts; |
| • | changes in, or investors’ perception of, the food and drug retail industry; |
| • | the activities of competitors; |
| • | future sales of our common stock; |
| • | our quarterly or annual earnings or those of other companies in our industry; |
| • | the public’s reaction to our press releases, our other public announcements and our filings with the SEC; |
| • | regulatory or legal developments in the United States; |
| • | litigation involving us, our industry, or both; |
| • | general economic conditions; and |
| • | other factors described elsewhere in these “Risk Factors.” |
As a result of these factors, you may not be able to resell your shares of our common stock at or above the initial offering price. In addition, the stock market often experiences extreme price and volume fluctuations that have often been unrelated or disproportionate to the operating performance of a particular company. These broad market fluctuations and industry factors may materially reduce the market price of our common stock, regardless of our operating performance.
The Cerberus-led Consortium controls us and may have conflicts of interest with other stockholders in the future.
After the completion of this offering, and assuming an offering of 65,306,122 shares by us, the Cerberus-led Consortium will indirectly control approximately 80.3% of our common stock. As a result, the Cerberus-led Consortium will continue to be able to control the election of our directors, determine our corporate and management policies and determine, without the consent of our other stockholders, the outcome of any corporate transaction or other matter submitted to our stockholders for approval, including potential mergers or acquisitions, asset sales and other significant corporate transactions. Eight of our 12 directors are either employees of, or advisors to, members of the Cerberus-led Consortium, as described under “Management.” The Cerberus-led Consortium, through Albertsons Investor and Kimco, will also have sufficient voting power to amend our organizational documents. The interests of the Cerberus-led Consortium may not coincide with the interests of other holders of our common stock. Additionally, Cerberus and the members of the Cerberus-led Consortium are in the business of making investments in companies and may, from time to time, acquire and hold interests in businesses that compete directly or indirectly with us. Cerberus and the members of the Cerberus-led Consortium may also pursue, for its own members’ accounts, acquisition opportunities that may be complementary to our business, and as a result, those acquisition opportunities may not be available to us. So long as the Cerberus-led Consortium continues to own a significant amount of the outstanding shares of our common stock through Albertsons Investor and Kimco, the Cerberus-led Consortium will continue to be able to strongly influence or effectively control our decisions, including potential mergers or acquisitions, asset sales and other significant corporate transactions.
43
Table of Contents
We will incur increased costs as a result of being a publicly traded company.
After the completion of this offering, we will be subject to the reporting requirements of the Securities Exchange Act of 1934, as amended (the “Exchange Act”), the Sarbanes-Oxley Act of 2002, as amended (the “Sarbanes-Oxley Act”), the Dodd-Frank Wall Street Reform and Consumer Protection Act of 2010 and the rules and regulations of the stock market on which our common stock is traded. Being subject to these rules and regulations will result in additional legal, accounting and financial compliance costs, will make some activities more difficult, time-consuming and costly and may also place significant strain on management, systems and resources.
These laws and regulations also could make it more difficult or costly for us to obtain certain types of insurance, including director and officer liability insurance, and we may be forced to accept reduced policy limits and coverage or incur substantially higher costs to obtain the same or similar coverage. These laws and regulations could also make it more difficult for us to attract and retain qualified persons to serve on our board of directors, our board committees or as our executive officers. Furthermore, if we are unable to satisfy our obligations as a public company, we could be subject to delisting of our common stock, fines, sanctions and other regulatory action and potentially civil litigation.
We are a “controlled company” within the meaning of the NYSE rules and, as a result, will qualify for, and intend to rely on, exemptions from certain corporate governance requirements. You will not have the same protections afforded to stockholders of companies that are subject to such requirements.
Upon completion of this offering, Albertsons Investor, Kimco and Management Holdco, as a group, will control a majority of our outstanding common stock. As a result, we are a “controlled company” within the meaning of the NYSE rules. Under the NYSE rules, a company of which more than 50% of the voting power is held by an individual, group or another company is a “controlled company” and may elect not to comply with certain corporate governance requirements, including:
| • | the requirement that a majority of the board of directors consist of independent directors; |
| • | the requirement that we have a nominating and corporate governance committee that is composed entirely of independent directors with a written charter addressing the committee’s purpose and responsibilities; |
| • | the requirement that we have a compensation committee that is composed entirely of independent directors with a written charter addressing the committee’s purpose and responsibilities; and |
| • | the requirement for an annual performance evaluation of the nominating and corporate governance and compensation committees. |
Following this offering, we intend to utilize these exemptions. As a result, we will not have a majority of independent directors nor will our nominating and corporate governance and compensation committees consist entirely of independent directors. Accordingly, you will not have the same protections afforded to stockholders of companies that are subject to all of the NYSE corporate governance requirements.
We are currently not required to meet the standards required by Section 404 of the Sarbanes-Oxley Act (“Section 404”), and failure to meet and maintain effective internal control over financial reporting in accordance with Section 404 could have a material adverse effect on our business, financial condition and results of operations.
As a privately held company, we are not currently required to document or test our compliance with internal controls over financial reporting on a periodic basis in accordance with Section 404. We
44
Table of Contents
are in the process of addressing our internal control procedures to satisfy the requirements of Section 404, which requires an annual management assessment of the effectiveness of our internal control over financial reporting. If we are not able to implement the requirements of Section 404 in a timely manner or with adequate compliance, our independent registered public accounting firm may not be able to attest to the effectiveness of our internal control over financial reporting. If we are unable to maintain adequate internal control over financial reporting, we may be unable to report our financial information on a timely basis, may suffer adverse regulatory consequences or violations of applicable stock exchange listing rules and may breach the covenants under our credit facilities. We will be unable to issue securities in the public markets through the use of a shelf registration statement if we are not in compliance with the applicable provisions of Section 404. There could also be a negative reaction in the financial markets due to a loss of investor confidence in us and the reliability of our financial statements.
In addition, we may incur additional costs in order to improve our internal control over financial reporting and comply with Section 404, including increased auditing and legal fees and costs associated with hiring additional accounting and administrative staff.
Provisions in our charter documents, certain agreements governing our indebtedness, the Stockholders’ Agreement (as defined herein) and Delaware law could make an acquisition of us more difficult and may prevent attempts by our stockholders to replace or remove our current management, even if beneficial to our stockholders.
Provisions in our certificate of incorporation and, upon the completion of the IPO-Related Transactions, our bylaws, may discourage, delay or prevent a merger, acquisition or other change in control that some stockholders may consider favorable, including transactions in which you might otherwise receive a premium for your shares of our common stock. These provisions could also limit the price that investors might be willing to pay in the future for shares of our common stock, possibly depressing the market price of our common stock.
In addition, these provisions may frustrate or prevent any attempts by our stockholders to replace members of our board of directors. Because our board of directors is responsible for appointing the members of our management team, these provisions could in turn affect any attempt by our stockholders to replace members of our management team. Examples of such provisions are as follows:
| • | from and after such date that Albertsons Investor, Kimco, Management Holdco and their respective Affiliates (as defined in Rule 12b-2 of the Exchange Act), or any person who is an express assignee or designee of Albertsons Investor, Kimco or Management Holdco’s respective rights under our certificate of incorporation (and such assignee’s or designee’s Affiliates) (of these entities, the entity that is the beneficial owner of the largest number of shares is referred to as the “Designated Controlling Stockholder”) ceases to own, in the aggregate, at least 50% of the then-outstanding shares of our common stock (the “50% Trigger Date”), the authorized number of our directors may be increased or decreased only by the affirmative vote of two-thirds of the then-outstanding shares of our common stock or by resolution of our board of directors; |
| • | prior to the 50% Trigger Date, only our board of directors and the Designated Controlling Stockholder are expressly authorized to make, alter or repeal our bylaws and, from and after the 50% Trigger Date, our stockholders may only amend our bylaws with the approval of at least two-thirds of all of the outstanding shares of our capital stock entitled to vote; |
| • | from and after the 50% Trigger Date, the manner in which stockholders can remove directors from the board will be limited; |
| • | from and after the 50% Trigger Date, stockholder actions must be effected at a duly called stockholder meeting and actions by our stockholders by written consent will be prohibited; |
45
Table of Contents
| • | from and after such date that Albertsons Investor, Kimco, Management Holdco and their respective Affiliates (or any person who is an express assignee or designee of Albertsons Investor, Kimco or Management Holdco’s respective rights under our certificate of incorporation (and such assignee’s or designee’s Affiliates)) ceases to own, in the aggregate, at least 35% of the then-outstanding shares of our common stock (the “35% Trigger Date”), advance notice requirements for stockholder proposals that can be acted on at stockholder meetings and nominations to our board of directors will be established; |
| • | limits on who may call stockholder meetings; |
| • | requirements on any stockholder (or group of stockholders acting in concert), other than, prior to the 35% Trigger Date, the Designated Controlling Stockholder, who seeks to transact business at a meeting or nominate directors for election to submit a list of derivative interests in any of our company’s securities, including any short interests and synthetic equity interests held by such proposing stockholder; |
| • | requirements on any stockholder (or group of stockholders acting in concert) who seeks to nominate directors for election to submit a list of “related party transactions” with the proposed nominee(s) (as if such nominating person were a registrant pursuant to Item 404 of Regulation S-K, and the proposed nominee was an executive officer or director of the “registrant”); and |
| • | our board of directors is authorized to issue preferred stock without stockholder approval, which could be used to institute a “poison pill” that would work to dilute the stock ownership of a potential hostile acquiror, effectively preventing acquisitions that have not been approved by our board of directors. |
Our certificate of incorporation authorizes our board of directors to issue up to 30,000,000 shares of preferred stock. The preferred stock may be issued in one or more series, the terms of which may be determined by our board of directors at the time of issuance or fixed by resolution without further action by the stockholders. These terms may include voting rights, preferences as to dividends and liquidation, conversion rights, redemption rights, and sinking fund provisions. The issuance of preferred stock could diminish the rights of holders of our common stock, and therefore could reduce the value of our common stock. In addition, specific rights granted to holders of preferred stock could be used to restrict our ability to merge with, or sell assets to, a third party. The ability of our board of directors to issue preferred stock could delay, discourage, prevent, or make it more difficult or costly to acquire or effect a change in control, thereby preserving the current stockholders’ control.
In addition, under the credit agreements governing our Senior Secured Credit Facilities (and, if we consummate the Anticipated Refinancing, under the credit agreements governing our New Credit Facilities), a change in control may lead the lenders to exercise remedies such as acceleration of the loan, termination of their obligations to fund additional advances and collection against the collateral securing such loans. Also, under the indentures governing the CoC Notes, a change of control may require us to offer to repurchase all of the CoC Notes for cash at a premium to the principal amount of the CoC Notes.
Furthermore, in connection with this offering, Albertsons Companies, Inc. will enter into the Stockholders’ Agreement with Albertsons Investor, Kimco and Management Holdco. Pursuant to the Stockholders’ Agreement, we will be required to appoint to our Board of Directors individuals designated by Albertsons Investor upon the closing of the IPO-Related Transactions. Pursuant to a limited liability company agreement entered into by the Cerberus-led Consortium, other than Kimco, and certain other individuals who agreed to co-invest with them through Albertsons Investor (the “Albertsons Investor LLC Agreement”), such appointees shall be selected by Albertsons Investor’s board of managers so long as Albertsons Companies, Inc. is a controlled company under the
46
Table of Contents
applicable rules of the NYSE. See “Certain Relationships and Related Party Transactions—Albertsons Investor Limited Liability Company Agreement.”
The Stockholders’ Agreement will provide that, except as otherwise required by applicable law, from the date on which (a) Albertsons Companies, Inc. is no longer a controlled company under the applicable rules of the NYSE but prior to the 35% Trigger Date, Albertsons Investor will have the right to designate a number of individuals who satisfy the Director Requirements (as defined herein) equal to one director fewer than 50% of our board of directors at any time and shall cause its directors appointed to our board of directors to vote in favor of maintaining a 13-person board of directors unless the management board of Albertsons Investor otherwise agrees by the affirmative vote of 80% of the management board of Albertsons Investor; (b) a Holder (as defined herein) has beneficial ownership of at least 20% but less than 35% of our outstanding common stock, the Holder will have the right to designate a number of individuals who satisfy the Director Requirements equal to the greater of three or 25% of the size of our board of directors at any time (rounded up to the next whole number); (c) a Holder has beneficial ownership of at least 15% but less than 20% of our outstanding common stock, the Holder will have the right to designate the greater of two or 15% of the size of our board of directors at any time (rounded up to the next whole number); and (d) a Holder has beneficial ownership of at least 10% but less than 15% of our outstanding common stock, it will have the right to designate one individual who satisfies the Director Requirements. The ability of Albertsons Investor or a Holder to appoint one or more directors could make an acquisition of us more difficult and may prevent attempts by our stockholders to replace or remove our current management, even if beneficial to our stockholders.
Our certificate of incorporation designates the Court of Chancery of the State of Delaware as the sole and exclusive forum for certain types of actions and proceedings that may be initiated by our stockholders, which could limit our stockholders’ ability to obtain a favorable judicial forum for disputes with us or our directors, officers or other employees.
Our certificate of incorporation provides that, unless we consent in writing to the selection of an alternative forum, the Court of Chancery of the State of Delaware will be the exclusive forum for: (a) any derivative action or proceeding brought on our behalf; (b) any action asserting a claim for breach of a fiduciary duty owed by any of our directors, officers, employees or agents to us or our stockholders; (c) any action asserting a claim arising pursuant to any provision of the DGCL, our certificate of incorporation or our bylaws; or (d) any action asserting a claim governed by the internal affairs doctrine. Any person or entity purchasing or otherwise acquiring any interest in shares of our capital stock is deemed to have received notice of and consented to the foregoing provisions. This choice of forum provision may limit a stockholder’s ability to bring a claim in a judicial forum that it finds more favorable for disputes with us or our directors, officers or other employees, which may discourage such lawsuits against us and our directors, officers and employees. Alternatively, if a court were to find this choice of forum provision inapplicable to, or unenforceable in respect of, one or more of the specified types of actions or proceedings, we may incur additional costs associated with resolving such matters in other jurisdictions, which could adversely affect our business, financial condition or results of operations.
If a substantial number of shares becomes available for sale and are sold in a short period of time, the market price of our common stock could decline.
If our Existing Owners sell substantial amounts of our common stock in the public market following this offering, the market price of our common stock could decrease. The perception in the public market that our Existing Owners might sell shares of common stock could also create a perceived overhang and depress our market price. Upon completion of this offering, we will have 475,139,081 shares of common stock outstanding of which 409,832,959 shares will be held by our current stockholders. Prior to this offering, we and our Existing Owners will have agreed with the underwriters to a “lock-up” period, meaning that such parties may not, subject to certain exceptions,
47
Table of Contents
sell any of their existing shares of our common stock without the prior written consent of representatives of the underwriters for at least 180 days after the date of this prospectus. Pursuant to this agreement, among other exceptions, we may enter into an agreement providing for the issuance of our common stock in connection with the acquisition, merger or joint venture with another publicly traded entity during the 180-day restricted period after the date of this prospectus. In addition, all of our Existing Owners will be subject to the holding period requirement of Rule 144 (“Rule 144”) under the Securities Act, as described in “Shares Eligible for Future Sale.” When the lock-up agreements expire, these shares will become eligible for sale, in some cases subject to the requirements of Rule 144.
In addition, the Cerberus-led Consortium, through Albertsons Investor, will have substantial demand and incidental registration rights, as described in “Certain Relationships and Related Party Transactions—Stockholders’ Agreement.” The market price for shares of our common stock may drop when the restrictions on resale by our Existing Owners lapse. We intend to file one or more registration statements on Form S-8 under the Securities Act to register shares of our common stock or securities convertible into or exchangeable for shares of our common stock issued pursuant to our 2015 Equity and Incentive Award Plan (the “2015 Incentive Plan”) and our Restricted Stock Unit Plan (the “Restricted Stock Unit Plan”). Any such Form S-8 registration statements will automatically become effective upon filing. Accordingly, shares registered under such registration statements will be available for sale in the open market. We expect that the initial registration statement on Form S-8 will cover 7.3% of the shares of our common stock. A decline in the market price of our common stock might impede our ability to raise capital through the issuance of additional shares of our common stock or other equity securities.
If equity research analysts do not publish research or reports about our business or if they issue unfavorable commentary or downgrade our common shares, the market price of our common stock could decline.
The trading market for our common shares likely will be influenced by the research and reports that equity and debt research analysts publish about the industry, us and our business. The market price of our common stock could decline if one or more securities analysts downgrade our shares or if those analysts issue a sell recommendation or other unfavorable commentary or cease publishing reports about us or our business. If one or more of the analysts who elect to cover us downgrade our shares, the market price of our common stock would likely decline.
Because we do not intend to pay dividends for the foreseeable future, you may not receive any return on investment unless you sell your common stock for a price greater than that which you paid for it.
We do not intend to pay dividends for the foreseeable future, and our stockholders will not be guaranteed, or have contractual or other rights, to receive dividends. Our board of directors may, in its discretion, modify or repeal our dividend policy. The declaration and payment of dividends depends on various factors, including: our net income, financial condition, cash requirements, future prospects and other factors deemed relevant by our board of directors.
In addition, we are a holding company that does not conduct any business operations of our own. As a result, we are dependent upon cash dividends and distributions and other transfers from our subsidiaries to make dividend payments. Our subsidiaries’ ability to pay dividends is restricted by agreements governing their debt instruments, and may be restricted by agreements governing any of our subsidiaries’ future indebtedness. Furthermore, our subsidiaries are permitted under the terms of their debt agreements to incur additional indebtedness that may severely restrict or prohibit the payment of dividends. See “Description of Indebtedness.”
48
Table of Contents
Under the DGCL, our board of directors may not authorize payment of a dividend unless it is either paid out of our surplus, as calculated in accordance with the DGCL, or if we do not have a surplus, it is paid out of our net profits for the fiscal year in which the dividend is declared and/or the preceding fiscal year.
If you purchase shares of common stock sold in this offering, you will experience immediate and substantial dilution.
Our existing stockholders have paid substantially less than the initial public offering price of our common stock. The initial public offering price of our common stock will be substantially higher than the tangible book deficit per share of our outstanding common stock. Assuming an initial public offering price of $24.50 per share, the midpoint of the range on the cover of this prospectus, purchasers of our common stock will effectively incur dilution of $28.41 per share in the net tangible book value of their purchased shares. The shares of our common stock owned by existing stockholders will receive a material decrease in the net tangible book deficit per share. You may experience additional dilution if we issue common stock in the future. As a result of this dilution, you may receive significantly less than the full purchase price you paid for the shares in the event of a liquidation. See “Dilution.”
You may be diluted by the future issuance of additional common stock in connection with our equity incentive plans, acquisitions or otherwise.
After this offering, we will have 524,860,919 shares of common stock authorized but unissued under our certificate of incorporation. We will be authorized to issue these shares of common stock and options, rights, warrants and appreciation rights relating to common stock for consideration and on terms and conditions established by our board of directors in its sole discretion, whether in connection with acquisitions or otherwise. We have reserved up to 7.3% of the shares of our common stock that will be available as of the consummation of this offering for issuance under existing restricted stock unit awards (following the conversion of our outstanding Phantom Unit awards granted under our Phantom Unit Plan (as defined herein)) and for future awards that may be issued under our 2015 Incentive Plan. See “Executive Compensation—Incentive Plans” and “Shares Eligible for Future Sale—Incentive Plans.” Any common stock that we issue, including under our 2015 Incentive Plan or other equity incentive plans that we may adopt in the future, would dilute the percentage ownership held by the investors who purchase common stock in this offering.
In the future, we may also issue our securities in connection with investments or acquisitions. The amount of shares of our common stock issued in connection with an investment or acquisition could constitute a material portion of our then-outstanding shares of common stock. Any issuance of additional securities in connection with investments or acquisitions may result in additional dilution to you.
49
Table of Contents
SPECIAL NOTE REGARDING FORWARD-LOOKING STATEMENTS
This prospectus contains forward-looking statements. All statements other than statements of historical facts contained in this prospectus, including statements regarding our future operating results and financial position, business strategy, and plans and objectives of management for future operations, are forward-looking statements. In many cases, you can identify forward-looking statements by terms such as “may,” “should,” “expects,” “plans,” “anticipates,” “could,” “intends,” “target,” “projects,” “contemplates,” “believes,” “estimates,” “predicts,” “potential,” or “continue” or the negative of these terms or other similar expressions. Forward-looking statements contained in this prospectus include, but are not limited to, statements about:
| • | the competitive nature of the industry in which we conduct our business; |
| • | general business and economic conditions, including the rate of inflation or deflation, consumer spending levels, population, employment and job growth and/or losses in our markets; |
| • | failure to successfully integrate Safeway or achieve anticipated synergies from the acquisition and integration of Safeway; |
| • | failure to successfully integrate the acquired A&P stores or to achieve anticipated synergies from the integration of the acquired A&P stores; |
| • | pricing pressures and competitive factors, which could include pricing strategies, store openings, remodels or acquisitions by our competitors; |
| • | our ability to increase identical store sales, expand our own brands, maintain or improve operating margins, revenue and revenue growth rate, control or reduce costs, improve buying practices and control shrink; |
| • | labor costs, including benefit plan costs and severance payments, or labor disputes that may arise from time to time and work stoppages that could occur in areas where certain collective bargaining agreements have expired or are on indefinite extensions or are scheduled to expire in the near future; |
| • | disruptions in our manufacturing facilities’ or distribution centers’ operations, disruption of significant supplier relationships, or disruptions to our produce or product supply chains; |
| • | results of any ongoing litigation in which we are involved or any litigation in which we may become involved; |
| • | data security, or the failure of our (or through SuperValu) IT systems; |
| • | increased costs as the result of being a public company; |
| • | the effects of government regulation; |
| • | our ability to raise additional capital to finance the growth of our business; |
| • | our ability to service our debt obligations, and restrictions in our debt agreements; |
| • | financing sources; |
| • | dividends; and |
| • | plans for future growth and other business development activities. |
We caution you that the foregoing list may not contain all of the forward-looking statements made in this prospectus.
You should not rely upon forward-looking statements as predictions of future events. We have based the forward-looking statements contained in this prospectus primarily on our current expectations and projections about future events and trends that we believe may affect our business,
50
Table of Contents
financial condition, results of operations and prospects. The outcome of the events described in these forward-looking statements is subject to risks, uncertainties and other factors described in the section entitled “Risk Factors” and elsewhere in this prospectus. Moreover, we operate in a very competitive and rapidly changing environment. New risks and uncertainties emerge from time to time and it is not possible for us to predict all risks and uncertainties that could have an impact on the forward-looking statements contained in this prospectus. We cannot assure you that the results, events and circumstances reflected in the forward-looking statements will be achieved or occur, and actual results, events or circumstances could differ materially from those described in the forward-looking statements.
The forward-looking statements made in this prospectus relate only to events as of the date on which the statements are made. We undertake no obligation to update any forward-looking statements made in this prospectus to reflect events or circumstances after the date of this prospectus or to reflect new information or the occurrence of unanticipated events, except as required by law. We may not actually achieve the plans, intentions or expectations disclosed in our forward-looking statements and you should not place undue reliance on our forward-looking statements. Our forward-looking statements do not reflect the potential impact of any future acquisitions, mergers, dispositions, joint ventures or investments we may make.
51
Table of Contents
We will receive net proceeds from the offering of approximately $1,531 million (approximately $1,763 million if the underwriters exercise their option to purchase additional shares in full), assuming that the common stock is offered at $24.50 per share, the midpoint of the range set forth on the cover page of this prospectus, and after deducting the estimated underwriting discounts and commissions and approximately $13.0 million of our estimated expenses related to this offering. A $1.00 increase (decrease) in the assumed initial public offering price of $24.50 per share would increase (decrease) the net proceeds to us from this offering by approximately $63 million, after deducting the estimated underwriting discounts and commissions and estimated aggregate offering expenses payable by us and assuming no exercise of the underwriters’ option to purchase additional shares and no other change to the number of shares offered by us as set forth on the cover page of this prospectus.
We intend to use the net proceeds from this offering (i) to repay all amounts outstanding under our NAI Term Loan Facility (including $843.6 million of principal, plus accrued and unpaid interest thereon), (ii) to redeem $243.8 million of the outstanding principal amount of our ABS/Safeway Notes (at a redemption price of 107.750% of the principal amount of the ABS/Safeway Notes redeemed), plus accrued and unpaid interest thereon and (iii) to repay $406.8 million of principal, plus accrued and unpaid interest thereon, under the ABS/Safeway Term Loan Facilities. To the extent we use the net proceeds from this offering to repay the additional $300 million borrowed under the NAI Term Loan Facility on November 10, 2015, the amount repaid under the ABS/Safeway Term Loan Facilities would be reduced by a corresponding amount.
The principal amount outstanding under the NAI Term Loan Facility currently bears interest, at our option, at a rate per annum equal to (i) the base rate, plus 2.75% or (ii) the LIBOR rate (subject to a 1.00% floor) plus 3.75%. The final maturity date of the NAI Term Loan Facility is June 27, 2021.
The ABS/Safeway Term Loan Agreement was dated as of August 25, 2014 and made effective as of January 30, 2015. The proceeds from the ABS/Safeway Term Loan Facilities were used to finance the Safeway acquisition and pay fees and expenses related to the foregoing. As of September 12, 2015, $6.2 billion in aggregate principal amount was outstanding under the ABS/Safeway Term Loan Facilities, which currently bear interest, at our option, at a rate per annum equal to (i) the base rate plus a margin ranging from 3% to 3.375% (depending upon the tranche) or (ii) the LIBOR rate (subject to a 1.00% floor) plus a margin ranging from 4% to 4.5% (depending upon the tranche). The maturity dates for the ABS/Safeway Term Loan B-2, the ABS/Safeway Term Loan B-3 and the ABS/Safeway Term Loan B-4 (each as defined herein) are March 21, 2019, August 25, 2019 and August 25, 2021, respectively. For more information, see “Description of Indebtedness.”
On October 23, 2014, we issued the ABS/Safeway Notes. As of September 12, 2015, $609.6 million in aggregate principal amount was outstanding under the ABS/Safeway Notes, which bear interest at a rate per annum equal to 7.750%. The ABS/Safeway Notes mature on October 15, 2022. The proceeds from the issuance of the ABS/Safeway Notes were used, together with equity contributions and borrowings under our Senior Secured Credit Facilities, to (i) finance the Safeway acquisition, (ii) refinance pre-existing debt and (iii) pay fees and expenses related to the foregoing as well as the sale of PDC and Casa Ley.
One or more funds or accounts managed or advised by an investment management affiliate of Guggenheim Securities, LLC are lenders under the ABS/Safeway Term Loan Facilities and may receive 5% or more of the net proceeds of this offering. See “Underwriting (Conflict of Interest).” Affiliates of Goldman, Sachs & Co., Morgan Stanley & Co. LLC, Wells Fargo Securities, LLC and BMO Capital Markets Corp. are also lenders under the NAI Term Loan Facility and/or ABS/Safeway Term Loan Facilities and may receive a portion of the proceeds from this offering that are used to repay borrowings under such facilities. In addition, an affiliate of RBC Capital Markets, LLC is a holder of ABS/Safeway Notes and may receive a portion of the proceeds from this offering that are used to redeem ABS/Safeway Notes.
52
Table of Contents
We do not intend to pay dividends for the foreseeable future. We are not required to pay dividends, and our stockholders will not be guaranteed, or have contractual or other rights to receive, dividends. The declaration and payment of any future dividends will be at the sole discretion of our board of directors and will depend upon, among other things, our earnings, financial condition, capital requirements, level of indebtedness, contractual restrictions with respect to the payment of dividends, and other considerations that our board of directors deems relevant. Our board of directors may decide, in its discretion, at any time, to modify or repeal the dividend policy or discontinue entirely the payment of dividends.
The ability of our board of directors to declare a dividend is also subject to limits imposed by Delaware corporate law. Under Delaware law, our board of directors and the boards of directors of our corporate subsidiaries incorporated in Delaware may declare dividends only to the extent of our “surplus,” which is defined as total assets at fair market value minus total liabilities, minus statutory capital, or if there is no surplus, out of net profits for the fiscal year in which the dividend is declared and/or the preceding fiscal year. See “Risk Factors—Risks Related to This Offering and Owning Our Common Stock—Because we do not intend to pay dividends for the foreseeable future, you may not receive any return on investment unless you sell your common stock for a price greater than that which you paid for it.”
We are a holding company that does not conduct any business operations of our own. As a result, we are dependent upon cash dividends and distributions and other transfers from our subsidiaries to make dividend payments. Following the consummation of the IPO-Related Transactions, Albertsons Companies, Inc. will be subject to restrictions under agreements governing its debt instruments and it and its subsidiaries will be subject to general restrictions imposed on dividend payments under the laws of their jurisdictions of incorporation or organization. If the Anticipated Refinancing is consummated, Albertsons Companies, Inc. will also be an obligor under the New Financing Facilities, which are expected to subject Albertsons Companies, Inc. to similar restrictions. See “Risk Factors—Risks Related to Our Indebtedness—Our debt instruments limit our flexibility in operating our business.”
53
Table of Contents
IPO-RELATED TRANSACTIONS AND ORGANIZATIONAL STRUCTURE
Our business is currently conducted through our operating subsidiaries, which are wholly-owned by AB Acquisition. The equity interests of AB Acquisition immediately prior to the IPO-Related Transactions were owned (directly and indirectly) by our Existing Owners.
Albertsons Companies, Inc. is a newly formed entity, formed for the purpose of effecting the IPO-Related Transactions and this offering, and has engaged in no business or activities other than in connection with the IPO-Related Transactions and this offering.
In order to effectuate this offering, we expect to effect the following series of transactions prior to and/or concurrently with the closing of this offering, which will result in a reorganization of our business so that it is owned by Albertsons Companies, Inc. (the “IPO-Related Transactions”):
| • | our Existing Owners, other than Kimco and Management Holdco, will contribute all of their direct and indirect equity interests in AB Acquisition to Albertsons Investor, including their interests in NAI Group Holdings and Safeway Group Holdings; |
| • | Albertsons Investor, Kimco and Management Holdco will contribute all of their equity interests in AB Acquisition to Albertsons Companies, Inc. in exchange for common stock of Albertsons Companies, Inc.; |
| • | NAI Group Holdings, Safeway Group Holdings and other special purpose corporations owned by certain of the Sponsors through which they invested in AB Acquisition will be merged with and into Albertsons Companies, Inc., with Albertsons Companies, Inc. remaining as the surviving corporation in the mergers; and |
| • | Certain stores owned by Albertson’s LLC will be contributed to a newly formed subsidiary, Albertson’s Stores Sub LLC, which subsidiary will be distributed to its ultimate owner AB Acquisition, AB Acquisition will transfer all of its equity interests in Albertson’s Holdings LLC and NAI Holdings LLC to Albertsons Companies, Inc. and Albertson’s Holdings LLC will be merged with and into Albertsons Companies, Inc. with Albertsons Companies, Inc. remaining as the surviving corporation in the mergers. In addition, we expect to effect the merger of NAI Holdings LLC with and into Albertsons Companies, Inc. following the closing of this offering. |
As a result of the IPO-Related Transactions and this offering, (i) Albertsons Companies, Inc., the issuer of common stock in this offering, will be a holding company with no material assets other than its ownership of AB Acquisition and its subsidiaries, (ii) an aggregate of 349,832,761, 56,429,497 and 3,570,701 shares of our common stock will be owned by Albertsons Investor, Kimco and Management Holdco, respectively, and such parties will enter the Stockholders’ Agreement with Albertsons Companies, Inc., (iii) our Existing Owners, other than Kimco and Management Holdco, will become holders of equity interests in our controlling stockholder, Albertsons Investor and (iv) the capital stock of Albertsons Companies, Inc. will consist of (y) common stock, entitled to one vote per share on all matters submitted to a vote of stockholders and (z) undesignated and unissued preferred stock. See the section of this prospectus entitled “Description of Capital Stock” for additional information. Investors in this offering will only receive, and this prospectus only describes the offering of, shares of common stock of Albertsons Companies, Inc.
54
Table of Contents
The following charts summarize our ownership structure (i) prior to the IPO-Related Transactions and (ii) after giving effect to the IPO-Related Transactions and this offering (before giving effect to dilution from outstanding restricted stock units and assuming no exercise of the underwriters’ option to purchase additional shares).
Ownership Structure Prior to the IPO-Related Transactions
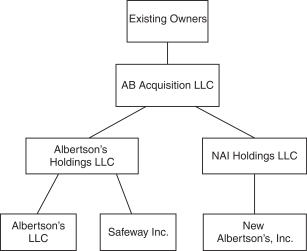
Ownership Structure After Giving Effect to the IPO-Related Transactions
55
Table of Contents
The following table sets forth our cash and cash equivalents and capitalization as of September 12, 2015:
| • | on an actual basis; and |
| • | on a pro forma basis to reflect the IPO-Related Transactions and the completion of this offering and the application of the estimated net proceeds from this offering, as described in “Use of Proceeds.” |
The table below does not give effect to the Anticipated Refinancing. The information below is illustrative only and our capitalization following this offering will be adjusted based on the actual initial public offering price and other terms of this offering determined at pricing. You should read this table together with “Selected Historical Financial Information of AB Acquisition” and “Management’s Discussion and Analysis of Financial Condition and Results of Operations of AB Acquisition” and our consolidated financial statements and related notes included elsewhere in this prospectus.
| As of September 12, 2015 | ||||||||
| Actual | Pro Forma(9) | |||||||
| (dollars in millions) | ||||||||
| Cash and cash equivalents |
$ | 777.7 | $ | 777.7 | ||||
|
|
|
|
|
|||||
| Debt, including current maturities, net of debt discounts and deferred financing costs(1) |
||||||||
| ABS/Safeway ABL Facility(2) |
$ | 481.0 | $ | 481.0 | ||||
| NAI ABL Facility(3) |
— | — | ||||||
| ABS/Safeway Term Loan Facilities |
6,023.0 | 5,631.8 | ||||||
| NAI Term Loan Facility(4) |
819.7 | — | ||||||
| ABS/Safeway Notes |
583.5 | 350.1 | ||||||
| Safeway Notes(5) |
1,452.6 | 1,452.6 | ||||||
| NAI Notes(6) |
1,509.2 | 1,509.2 | ||||||
| Capital leases |
964.1 | 964.1 | ||||||
| Other notes payable, unsecured(7) |
120.2 | 120.2 | ||||||
| Other debt(8) |
23.6 | 23.6 | ||||||
|
|
|
|
|
|||||
| Total Debt |
$ | 11,976.9 | $ | 10,532.6 | ||||
|
|
|
|
|
|||||
| Stockholders’ equity: |
||||||||
| Common stock, $0.01 par value; no shares authorized, no shares issued and outstanding on an actual basis; 1,000,000,000 shares authorized, 475,139,081 shares issued and outstanding on a pro forma basis |
— | 4.8 | ||||||
| Additional paid-in capital |
||||||||
| Members’ investment |
1,938.0 | 3,464.2 | ||||||
| Accumulated other comprehensive income |
42.2 | 42.2 | ||||||
| Accumulated deficit |
(62.8 | ) | (131.7 | ) | ||||
|
|
|
|
|
|||||
| Total stockholders’ equity |
$ | 1,917.4 | $ | 3,379.5 | ||||
|
|
|
|
|
|||||
| Total capitalization |
$ | 13,894.3 | $ | 13,912.1 | ||||
|
|
|
|
|
|||||
| (1) | Debt discounts and deferred financing costs totaled $354.2 million and $192.1 million, respectively, as of September 12, 2015. |
| (2) | As of September 12, 2015, the ABS/Safeway ABL Facility provided for a $3,000.0 million revolving credit facility. As of September 12, 2015, the aggregate borrowing base on the credit facility was approximately $2,736.9 million, which was reduced by (i) $143.1 million of outstanding standby letters of credit and (ii) a $481.0 million outstanding loan balance and $0.7 million of |
56
Table of Contents
| interest, resulting in a net borrowing base availability of approximately $2,112.1 million. See “Description of Indebtedness—ABS/Safeway ABL Agreement.” |
| (3) | As of September 12, 2015, the NAI ABL Facility provided for a $1,100.0 million revolving credit facility. As of September 12, 2015, the aggregate borrowing base on the credit facility was approximately $835.1 million, which was reduced by $494.1 million of outstanding standby letters of credit and $3.3 million of accrued fees, resulting in a net borrowing base availability of approximately $337.7 million. See “Description of Indebtedness—NAI ABL Agreement.” |
| (4) | Does not reflect incremental debt of $300 million borrowed under the NAI Term Loan Facility on November 10, 2015 to fund the A&P Transaction. Such incremental debt would result in approximately $14 million in annual incremental interest expense. |
| (5) | Consists of the 2016 Safeway Notes, 2017 Safeway Notes, 2019 Safeway Notes, 2020 Safeway Notes, 2021 Safeway Notes, 2027 Safeway Notes and 2031 Safeway Notes (each as defined herein). |
| (6) | Consists of the NAI Medium-Term Notes, 2026 NAI Notes, 2029 NAI Notes, 2030 NAI Notes and 2031 NAI Notes (each as defined herein). |
| (7) | Consists of unsecured build-to-suit PDC-related obligations and the ASC Notes. |
| (8) | Consists of mortgage notes payable. |
| (9) | A $1.00 increase (decrease) in the assumed initial public offering price of $24.50 per share (the midpoint of the price range set forth on the cover of this prospectus) would increase (decrease) additional paid-in capital by $63 million, decrease (increase) long-term debt by $63 million and increase (decrease) total stockholders’ equity by $63 million, assuming no exercise of the underwriters’ option to purchase additional shares and assuming the number of shares offered by us, as set forth on the cover page of this prospectus, remained the same and after deducting the underwriting discount and estimated offering expenses payable by us. Similarly, a one million share increase (decrease) in the number of shares offered by us, as set forth on the cover of this prospectus, would increase (decrease) additional paid-in capital by $23 million, decrease (increase) long-term debt by $23 million and increase (decrease) total stockholders’ equity by $23 million, assuming no exercise of the underwriters’ option to purchase additional shares and assuming the initial public offering price of $24.50 per share (the midpoint of the price range set forth on the cover of this prospectus) remained the same and after deducting the underwriting discount and estimated offering expenses payable by us. The above assumes that any resulting change in net proceeds increases or decreases the amount used to repay indebtedness. |
57
Table of Contents
Purchasers of the common stock in this offering will suffer an immediate dilution. Dilution is the amount by which the price paid by the purchasers of common stock in this offering will exceed the net tangible book deficit per share of common stock immediately after this offering.
Our historical net tangible book deficit at September 12, 2015 was $(3,357) million, or $(8.19) per share of common stock. Net tangible book deficit per share represents our total assets, excluding goodwill, intangibles, net, and deferred financing costs of $68 million included in other assets (related to our asset based loan facilities), less total liabilities, excluding deferred financing costs of $192 million included as a reduction of long term debt, divided by the number of shares of common stock outstanding as of September 12, 2015.
After giving effect to the IPO-Related Transactions and the completion of this offering, assuming an initial public offering price of $24.50 per share, the midpoint of the range on the cover of this prospectus, and the application of the net proceeds therefrom as described in this prospectus, our net tangible book deficit as of September 12, 2015 would have been $(1,857) million, or $(3.91) per share of common stock. This represents an immediate decrease in net tangible book deficit to existing stockholders of $4.28 per share of common stock and an immediate dilution to new investors of $28.41 per share of common stock. The following table illustrates this per share dilution:
| Assumed initial public offering price per share |
$ | 24.50 | ||
| Historical net tangible book deficit per share as of September 12, 2015(1) |
$ | (8.19 | ) | |
| Decrease in net tangible book deficit per share attributable to investors in this offering |
$ | 4.28 | ||
| Pro forma net tangible book deficit per share after this offering |
$ | (3.91 | ) | |
| Dilution per share to new investors |
$ | 28.41 |
| (1) | Based on the historical book deficit of the company as of September 12, 2015 divided by the number of shares of common stock expected to be issued in the IPO-Related Transactions but before giving effect to this offering. |
A $1.00 increase or decrease in the assumed initial public offering price of $24.50 per share, the midpoint of the range on the cover of this prospectus, would increase or decrease our net tangible book deficit by $63 million, the net tangible book deficit per share of common stock after this offering by $0.13 per share of common stock, and the dilution per share of common stock to new investors by $0.87 per share of common stock, assuming that the number of shares offered by us, as set forth on the front cover of this prospectus (assuming that the IPO-Related Transactions had taken place), remains the same and after deducting the commissions and discounts and estimated offering expenses payable by us.
The following table summarizes, on the pro forma basis set forth above as of September 12, 2015, the difference between the total cash consideration paid and the average price per share paid by existing stockholders and the purchasers of common stock in this offering with respect to the number of shares of common stock purchased from us, before deducting estimated underwriting discounts, commissions and offering expenses payable by us.
| Shares Purchased | Total Consideration | Average Price Per Share |
||||||||||||||||||
| Number | Percent | Amount | Percent | |||||||||||||||||
| Existing stockholders |
409,832,959 | 86.3 | % | $ | 1,154,796,135 | 41.9 | % | $ | 2.82 | |||||||||||
| Purchasers of common stock in this offering |
65,306,122 | 13.7 | % | $ | 1,600,000,000 | 58.1 | % | $ | 24.50 | |||||||||||
|
|
|
|
|
|
|
|
|
|||||||||||||
| Total |
475,139,081 | 100.0 | % | $ | 2,754,796,135 | 100.0 | % | $ | 5.80 | |||||||||||
|
|
|
|
|
|
|
|
|
|||||||||||||
58
Table of Contents
A $1.00 increase or decrease in the assumed initial public offering price of $24.50 per share, the midpoint of the range on the cover of this prospectus, would increase or decrease total consideration paid by new investors and total consideration paid by all stockholders by $63 million, assuming that the number of shares offered by us, as set forth on the front cover of this prospectus (assuming that the IPO-Related Transactions had taken place), remains the same and after deducting the commissions and discounts and estimated offering expenses payable by us. An increase or decrease of 1.0 million shares in the number of shares offered by us from the number of shares set forth on the cover page of this prospectus would increase or decrease the total consideration paid to us by new investors and total consideration paid to us by all stockholders by $23 million, assuming the assumed initial public offering price of $24.50 per share, the midpoint of the range on the cover of this prospectus, remains the same and after deducting the commissions and discounts and estimated offering expenses payable by us.
The tables above are based on 475,139,081 shares of common stock outstanding as of September 12, 2015 (assuming that the IPO-Related Transactions had taken place) and assume an initial public offering price of $24.50 per share, the midpoint of the range on the cover of this prospectus.
The tables above do not give effect to our reservation of up to 7.3% of the shares of our common stock that will be available as of the consummation of this offering for issuance under existing restricted stock unit awards (following the conversion of our outstanding Phantom Unit awards granted under our Phantom Unit Plan) and for future awards that may be issued under our 2015 Incentive Plan. Any common stock that we issue, including under our 2015 Incentive Plan or other equity incentive plans that we may adopt in the future, would further dilute the percentage ownership held by the investors who purchase common stock in this offering.
If the underwriters exercise their option to purchase additional shares from us, the following will occur:
| • | the pro forma percentage of shares of our common stock held by existing stockholders will decrease to approximately 84.5% of the total number of pro forma shares of our common stock outstanding after this offering; and |
| • | the pro forma number of shares of our common stock held by new public investors will increase to 75,102,040, or approximately 15.5% of the total pro forma number of shares of our common stock outstanding after this offering. |
59
Table of Contents
SELECTED HISTORICAL FINANCIAL INFORMATION OF AB ACQUISITION
The information below should be read along with “Unaudited Pro Forma Condensed Consolidated Financial Information,” “Management’s Discussion and Analysis of Financial Condition and Results of Operations of AB Acquisition,” “Business” and the historical financial statements and accompanying notes included elsewhere in this prospectus. Our historical results set forth below are not necessarily indicative of results to be expected for any future period.
The selected consolidated financial information set forth below is derived from AB Acquisition’s annual consolidated financial statements for the periods indicated below, including the consolidated balance sheets at February 28, 2015 and February 20, 2014 and the related consolidated statements of operations and comprehensive (loss) income and cash flows for the 53-week period ended February 28, 2015 and each of the 52-week periods ended February 20, 2014 and February 21, 2013 and notes thereto appearing elsewhere in this prospectus. The data for the first two quarters of fiscal 2015 and the first two quarters of fiscal 2014 is derived from our unaudited condensed consolidated financial statements included elsewhere in this prospectus and which, in the opinion of management, include all adjustments necessary for a fair statement of the results of the applicable interim periods.
| First Two Quarters | Fiscal 2014(1) |
Fiscal 2013(2) |
Fiscal 2012 |
Fiscal 2011 |
Fiscal 2010 |
|||||||||||||||||||||||
| (in millions) |
Fiscal 2015 | Fiscal 2014 | ||||||||||||||||||||||||||
| Results of Operations |
||||||||||||||||||||||||||||
| Net sales and other revenue |
$ | 31,488.9 | $ | 12,821.6 | $ | 27,198.6 | $ | 20,054.7 | $ | 3,712.0 | $ | 3,746.4 | $ | 3,676.6 | ||||||||||||||
|
|
|
|
|
|
|
|
|
|
|
|
|
|
|
|||||||||||||||
| Gross profit |
$ | 8,494.4 | $ | 3,519.0 | $ | 7,502.8 | $ | 5,399.0 | $ | 937.7 | $ | 890.1 | $ | 877.1 | ||||||||||||||
| Selling and administrative expenses |
8,406.4 | 3,449.8 | 8,152.2 | 5,874.1 | 899.0 | 860.2 | 849.9 | |||||||||||||||||||||
| Bargain purchase gain |
— | — | — | (2,005.7 | ) | — | — | — | ||||||||||||||||||||
|
|
|
|
|
|
|
|
|
|
|
|
|
|
|
|||||||||||||||
| Operating income (loss) |
88.0 | 69.2 | (649.4 | ) | 1,530.6 | 38.7 | 29.9 | 27.2 | ||||||||||||||||||||
| Interest expense, net |
507.7 | 242.5 | 633.2 | 390.1 | 7.2 | 7.3 | 10.7 | |||||||||||||||||||||
| Other (income) expense |
(9.3 | ) | 43.2 | 96.0 | — | — | — | — | ||||||||||||||||||||
|
|
|
|
|
|
|
|
|
|
|
|
|
|
|
|||||||||||||||
| (Loss) income before income taxes |
(410.4 | ) | (216.5 | ) | (1,378.6 | ) | 1,140.5 | 31.5 | 22.6 | 16.5 | ||||||||||||||||||
| Income tax (benefit) expense |
(87.4 | ) | (29.8 | ) | (153.4 | ) | (572.6 | ) | 1.7 | 1.5 | 1.3 | |||||||||||||||||
|
|
|
|
|
|
|
|
|
|
|
|
|
|
|
|||||||||||||||
| (Loss) income from continuing operations, net of tax |
(323.0 | ) | (186.7 | ) | (1,225.2 | ) | 1,713.1 | 29.8 | 21.1 | 15.2 | ||||||||||||||||||
| Income from discontinued operations, net of tax |
— | — | — | 19.5 | 49.2 | 51.3 | 79.5 | |||||||||||||||||||||
|
|
|
|
|
|
|
|
|
|
|
|
|
|
|
|||||||||||||||
| Net (loss) income |
$ | (323.0 | ) | $ | (186.7 | ) | $ | (1,225.2 | ) | $ | 1,732.6 | $ | 79.0 | $ | 72.4 | $ | 94.7 | |||||||||||
|
|
|
|
|
|
|
|
|
|
|
|
|
|
|
|||||||||||||||
| Balance Sheet Data (at end of period) |
||||||||||||||||||||||||||||
| Cash and equivalents |
$ | 777.7 | $ | 958.5 | $ | 1,125.8 | $ | 307.0 | $ | 37.0 | $ | 61.3 | $ | 80.3 | ||||||||||||||
| Total assets |
24,007.5 | 10,349.7 | 25,771.4 | 9,359.0 | 586.1 | 612.5 | 649.0 | |||||||||||||||||||||
| Total members’ equity (deficit) |
1,917.4 | 1,565.7 | 2,168.5 | 1,759.6 | (247.2 | ) | (276.1 | ) | (248.3 | ) | ||||||||||||||||||
| Total debt, including capital leases |
11,976.9 | 5,001.7 | 12,569.0 | 3,694.2 | 120.2 | 136.7 | 119.1 | |||||||||||||||||||||
| (1) | Includes results from four weeks for the stores purchased in the Safeway acquisition on January 30, 2015. |
| (2) | Includes results from 48 weeks for the stores purchased in the NAI acquisition on March 21, 2013 and eight weeks for the stores purchased in the United acquisition on December 29, 2013. |
60
Table of Contents
SUPPLEMENTAL SELECTED HISTORICAL FINANCIAL INFORMATION OF SAFEWAY
You should read the information set forth below along with “Unaudited Pro Forma Condensed Consolidated Financial Information,” “Supplemental Management’s Discussion and Analysis of Results of Operations of Safeway” and Safeway’s historical consolidated financial statements and related notes included elsewhere in this prospectus.
The supplemental selected historical financial information of Safeway set forth below has been derived from Safeway’s historical consolidated financial statements. Safeway’s historical consolidated financial statements as of January 3, 2015 and December 28, 2013 and for the fiscal years ended January 3, 2015, December 28, 2013 and December 29, 2012 have been included in this prospectus.
| (in millions) |
Fiscal 2014 |
Fiscal 2013 |
Fiscal 2012 |
Fiscal 2011 |
Fiscal 2010 |
|||||||||||||||
| Results of Operations |
||||||||||||||||||||
| Net sales and other revenue |
$ | 36,330.2 | $ | 35,064.9 | $ | 35,161.5 | $ | 34,655.7 | $ | 33,011.3 | ||||||||||
|
|
|
|
|
|
|
|
|
|
|
|||||||||||
| Gross profit |
$ | 9,682.0 | $ | 9,231.5 | $ | 9,229.1 | $ | 9,277.7 | $ | 9,261.1 | ||||||||||
| Operating & administrative expense |
(9,147.5 | ) | (8,680.0 | ) | (8,593.7 | ) | (8,628.8 | ) | (8,508.4 | ) | ||||||||||
|
|
|
|
|
|
|
|
|
|
|
|||||||||||
| Operating profit |
534.5 | 551.5 | 635.4 | 648.9 | 752.7 | |||||||||||||||
| Interest expense |
(198.9 | ) | (273.0 | ) | (300.6 | ) | (268.1 | ) | (295.0 | ) | ||||||||||
| Loss on extinguishment of debt |
(84.4 | ) | (10.1 | ) | — | — | — | |||||||||||||
| Loss on foreign currency translation |
(131.2 | ) | (57.4 | ) | — | — | — | |||||||||||||
| Other income, net |
45.0 | 40.6 | 27.4 | 17.2 | 17.0 | |||||||||||||||
|
|
|
|
|
|
|
|
|
|
|
|||||||||||
| Income before income taxes |
165.0 | 251.6 | 362.2 | 398.0 | 474.7 | |||||||||||||||
| Income taxes |
(61.8 | ) | (34.5 | ) | (113.0 | ) | (68.5 | ) | (162.7 | ) | ||||||||||
|
|
|
|
|
|
|
|
|
|
|
|||||||||||
| Income from continuing operations, net of tax |
103.2 | 217.1 | 249.2 | 329.5 | 312.0 | |||||||||||||||
| Income from discontinued operations, net of tax(1) |
9.3 | 3,305.1 | 348.9 | 188.7 | 278.6 | |||||||||||||||
|
|
|
|
|
|
|
|
|
|
|
|||||||||||
| Net income before allocation to noncontrolling interests |
112.5 | 3,522.2 | 598.1 | 518.2 | 590.6 | |||||||||||||||
| Noncontrolling interests |
0.9 | (14.7 | ) | (1.6 | ) | (1.5 | ) | (0.8 | ) | |||||||||||
|
|
|
|
|
|
|
|
|
|
|
|||||||||||
| Net income |
$ | 113.4 | $ | 3,507.5 | $ | 596.5 | $ | 516.7 | $ | 589.8 | ||||||||||
|
|
|
|
|
|
|
|
|
|
|
|||||||||||
| (1) | See Note B to Safeway’s historical consolidated financial statements included elsewhere in this prospectus. |
61
Table of Contents
UNAUDITED PRO FORMA CONDENSED CONSOLIDATED FINANCIAL INFORMATION
The following unaudited pro forma condensed consolidated financial information presents the unaudited pro forma condensed consolidated balance sheet as of September 12, 2015 and unaudited pro forma condensed consolidated statements of continuing operations for the 53 weeks ended February 28, 2015 (“fiscal 2014”) and the 28 weeks ended September 12, 2015 and September 4, 2014 based upon the consolidated historical financial statements of AB Acquisition and Safeway, after giving effect to the following transactions (collectively the “Transactions”):
| • | the Safeway acquisition, including the following related transactions: |
| • | the sale of PDC prior to the closing of the Safeway acquisition (in the case of fiscal 2014 and the 28 weeks ended September 4, 2014 only); and |
| • | the divestiture of certain stores required by the FTC that was a condition of closing the Safeway acquisition; |
| • | the IPO-Related Transactions; and |
| • | the issuance of 65,306,122 shares of common stock in the initial public offering of Albertsons Companies, Inc. and the application of $1,531 million of the net proceeds from the sale of such shares (assuming the midpoint of the price range set forth on the cover page of this prospectus) to repay certain indebtedness as described in “Use of Proceeds” (the “IPO Transactions”). |
The unaudited pro forma financial information contained in this prospectus does not give effect to the Anticipated Refinancing.
The Safeway acquisition closed on January 30, 2015, and, therefore, the fair value of the assets acquired and liabilities assumed are already included in AB Acquisition’s historical condensed consolidated balance sheet as of September 12, 2015. The unaudited pro forma condensed consolidated balance sheet gives effect to the IPO-Related Transactions and the IPO Transactions as if they had occurred on September 12, 2015. The unaudited pro forma condensed consolidated statement of continuing operations for fiscal 2014 and the 28 weeks ended September 4, 2014 gives effect to the Transactions as if they had been consummated on February 21, 2014, the first day of fiscal 2014. The unaudited pro forma condensed consolidated statement of continuing operations for the 28 weeks ended September 12, 2015 gives pro forma effect to the Safeway Transactions, the IPO-Related Transactions and the IPO Transactions as if they had occurred on February 21, 2014.
AB Acquisition’s historical financial and operating data for fiscal 2014 and the 28 weeks ended September 4, 2014 and the 28 weeks ended September 12, 2015 is derived from the financial data in its audited consolidated financial statements for fiscal 2014 and the unaudited condensed consolidated financial statements for the 28 weeks ended September 4, 2014 and the 28 weeks ended September 12, 2015, respectively. Safeway is included in the historical operating results of AB Acquisition for the 28 weeks ended September 12, 2015 and for the four-week period from January 31, 2015 through February 28, 2015. The adjusted fiscal 2014 historical financial information for Safeway for the 49 weeks ended January 30, 2015 is derived by adding the financial data from Safeway’s audited consolidated statement of income for the 53 weeks ended January 3, 2015 and Safeway’s unaudited condensed consolidated statement of income for the four weeks ended January 30, 2015, and subtracting Safeway’s unaudited condensed consolidated statement of income for the eight weeks ended February 22, 2014. The adjusted 28 weeks ended September 4, 2014 historical financial information for Safeway is derived by subtracting Safeway’s unaudited condensed consolidated statement of income for the eight weeks ended February 22, 2014 from Safeway’s unaudited condensed consolidated statement of income for the 36 weeks ended September 6, 2014.
62
Table of Contents
The unaudited pro forma condensed consolidated financial information is prepared in accordance with Article 11 of Regulation S-X, using the assumptions set forth in the notes to the unaudited pro forma condensed consolidated financial information. The unaudited pro forma condensed consolidated financial information includes adjustments that give effect to events that are directly attributable to the Transactions described above, are factually supportable and, with respect to our statement of operations, are expected to have a continuing impact. The unaudited pro forma statement of continuing operations shows the impact on the consolidated statement of operations under the acquisition method of accounting in accordance with Accounting Standards Codification 805, Business Combinations.
The unaudited pro forma condensed consolidated financial information is provided for informational purposes only and is not necessarily indicative of the operating results that would have occurred if the Transactions had been completed as of the dates set forth above, nor is it indicative of the future results of the company. The unaudited pro forma condensed consolidated financial information also does not give effect to the potential impact of any anticipated synergies, operating efficiencies or cost savings that may result from the Safeway acquisition or any integration costs that do not have a continuing impact.
The unaudited pro forma condensed consolidated financial information should be read in conjunction with the consolidated financial statements of AB Acquisition and the consolidated financial statements of Safeway included elsewhere in this prospectus.
63
Table of Contents
AB ACQUISITION LLC AND SUBSIDIARIES
UNAUDITED PRO FORMA CONDENSED CONSOLIDATED STATEMENT OF CONTINUING OPERATIONS
53 WEEKS ENDED FEBRUARY 28, 2015
(in millions except share and per share amounts)
| AB Acquisition LLC |
Safeway Inc. | Period Alignment(1) |
Pro Forma Adjustments related to the Safeway Transactions(2) |
Pro Forma Adjustments for IPO-Related Transactions(3) |
Pro Forma Adjustments for IPO Transactions(4) |
AB Acquisition LLC Pro Forma |
||||||||||||||||||||||
| 53 Weeks Ended February 28, 2015 |
53 Weeks Ended January 3, 2015 |
53 Weeks Ended February 28, 2015 |
||||||||||||||||||||||||||
| Net sales and other revenue |
$ | 27,198.6 | $ | 36,330.2 | $ | (2,746.6 | ) | $ | (3,285.3 | )2(a) | $ | — | $ | — | $ | 57,496.9 | ||||||||||||
| Cost of sales |
19,695.8 | 26,648.2 | (2,060.2 | ) | (2,283.3 | )2(a) | — | — | 42,013.5 | |||||||||||||||||||
| 13.0 | 2(b) | |||||||||||||||||||||||||||
|
|
|
|
|
|
|
|
|
|
|
|
|
|
|
|||||||||||||||
| Gross profit |
7,502.8 | 9,682.0 | (686.4 | ) | (1,015.0 | ) | — | — | 15,483.4 | |||||||||||||||||||
| Selling and administrative expenses |
8,152.2 | 9,147.5 | (609.3 | ) | (1,068.3 | )2(a) | — | — | 15,191.1 | |||||||||||||||||||
| (431.0 | )2(c) | |||||||||||||||||||||||||||
|
|
|
|
|
|
|
|
|
|
|
|
|
|
|
|||||||||||||||
| Operating (loss) income |
(649.4 | ) | 534.5 | (77.1 | ) | 484.3 | — | — | 292.3 | |||||||||||||||||||
| Interest expense, net |
633.2 | 283.3 | (21.3 | ) | 43.4 | 2(d) | — | (88.7 | )4(a) | 849.9 | ||||||||||||||||||
| Other expense (income), net |
96.0 | 86.2 | (102.8 | ) | (98.1 | )2(e) | — | — | (18.7 | ) | ||||||||||||||||||
|
|
|
|
|
|
|
|
|
|
|
|
|
|
|
|||||||||||||||
| (Loss) income from continuing operations before income taxes |
(1,378.6 | ) | 165.0 | 47.0 | 539.0 | — | 88.7 | (538.9 | ) | |||||||||||||||||||
| Income tax (benefit) expense |
(153.4 | ) | 61.8 | 14.2 | (50.7 | )2(f) | (114.9 | )3(a) | 34.3 | 4(c) | (208.7 | ) | ||||||||||||||||
|
|
|
|
|
|
|
|
|
|
|
|
|
|
|
|||||||||||||||
| Net (loss) income from continuing operations |
$ | (1,225.2 | ) | $ | 103.2 | $ | 32.8 | $ | 589.7 | $ | 114.9 | $ | 54.4 | $ | (330.2 | ) | ||||||||||||
|
|
|
|
|
|
|
|
|
|
|
|
|
|
|
|||||||||||||||
| Pro forma loss per share, continuing operations |
||||||||||||||||||||||||||||
| Basic and diluted |
$ | (0.69 | )4(b) | |||||||||||||||||||||||||
| Pro forma weighted average shares outstanding |
||||||||||||||||||||||||||||
| Basic and diluted |
475,139,081 | 4(b) | ||||||||||||||||||||||||||
64
Table of Contents
AB ACQUISITION LLC AND SUBSIDIARIES
UNAUDITED PRO FORMA CONDENSED CONSOLIDATED STATEMENT OF CONTINUING OPERATIONS
28 WEEKS ENDED SEPTEMBER 12, 2015
(in millions except share and per share amounts)
| AB Acquisition LLC |
Pro Forma Adjustments related to the Safeway Transactions(2) |
Pro Forma Adjustments for IPO-Related Transactions(3) |
Pro Forma Adjustments for IPO Transactions(4) |
AB Acquisition LLC Pro Forma |
||||||||||||||||
| 28 Weeks Ended September 12, 2015 |
28 Weeks Ended September 12, 2015 |
|||||||||||||||||||
| Net sales and other revenue |
$ | 31,488.9 | $ | (444.5 | ) | $ | — | $ | — | $ | 31,044.4 | |||||||||
| Cost of sales |
22,994.5 | (310.5 | ) | — | — | 22,684.0 | ||||||||||||||
|
|
|
|
|
|
|
|
|
|
|
|||||||||||
| Gross profit |
8,494.4 | (134.0 | ) | — | — | 8,360.4 | ||||||||||||||
| Selling and administrative expenses |
8,406.4 | (110.9 | ) | — | — | 8,295.5 | ||||||||||||||
|
|
|
|
|
|
|
|
|
|
|
|||||||||||
| Operating profit |
88.0 | (23.1 | ) | — | — | 64.9 | ||||||||||||||
| Interest expense, net |
507.7 | — | — | (46.9 | )4(a) | 460.8 | ||||||||||||||
| Other (income) expense, net |
(9.3 | ) | — | — | — | (9.3 | ) | |||||||||||||
|
|
|
|
|
|
|
|
|
|
|
|||||||||||
| Loss from continuing operations before income taxes |
(410.4 | ) | (23.1 | ) | — | 46.9 | (386.6 | ) | ||||||||||||
| Income tax benefit |
(87.4 | ) | (3.2 | ) | (77.4 | )3(a) | 18.2 | 4(h) | (149.8 | ) | ||||||||||
|
|
|
|
|
|
|
|
|
|
|
|||||||||||
| Net loss from continuing operations |
$ | (323.0 | ) | $ | (19.9 | ) | $ | 77.4 | $ | 28.7 | $ | (236.8 | ) | |||||||
|
|
|
|
|
|
|
|
|
|
|
|||||||||||
| Pro forma loss per share, continuing operations |
$ | (0.50 | )4(b) | |||||||||||||||||
| Pro forma weighted average shares outstanding |
475,139,081 | 4(b) | ||||||||||||||||||
65
Table of Contents
AB ACQUISITION LLC AND SUBSIDIARIES
UNAUDITED PRO FORMA CONDENSED CONSOLIDATED STATEMENT OF CONTINUING OPERATIONS
28 WEEKS ENDED SEPTEMBER 4, 2014
(in millions except share and per share amounts)
| AB Acquisition LLC |
Safeway Inc. |
Period Alignment(1) |
Pro Forma Adjustments related to the Safeway Transactions(2) |
Pro Forma Adjustments for IPO-Related Transactions(3) |
Pro Forma Adjustments for IPO Transactions(4) |
AB Acquisition LLC Pro Forma |
||||||||||||||||||||||
| 28 Weeks Ended September 4, 2014 |
36 Weeks Ended September 6, 2014 |
28 Weeks Ended September 4, 2014 |
||||||||||||||||||||||||||
| Net sales and other revenue |
$ | 12,821.6 | $ | 24,652.8 | $ | (5,358.5 | ) | $ | (1,719.7 | )2(a) | $ | — | $ | — | $ | 30,396.2 | ||||||||||||
| Cost of sales |
9,302.6 | 18,229.4 | (3,944.4 | ) | (1,201.1 | )2(a) | — | — | 22,396.5 | |||||||||||||||||||
| 10.0 | 2(b) | |||||||||||||||||||||||||||
|
|
|
|
|
|
|
|
|
|
|
|
|
|
|
|||||||||||||||
| Gross profit |
3,519.0 | 6,423.4 | (1,414.1 | ) | (528.6 | ) | — | — | 7,999.7 | |||||||||||||||||||
| Selling and administrative expenses |
3,449.8 | 6,147.2 | (1,366.3 | ) | (439.1 | )2(a) | — | — | 7,794.6 | |||||||||||||||||||
| 3.0 | 2(c) | |||||||||||||||||||||||||||
|
|
|
|
|
|
|
|
|
|
|
|
|
|
|
|||||||||||||||
| Operating profit |
69.2 | 276.2 | (47.8 | ) | (92.5 | ) | — | — | 205.1 | |||||||||||||||||||
| Interest expense, net |
242.5 | 232.5 | (34.3 | ) | 53.9 | 2(d) | — | (46.9 | )4(a) | 447.7 | ||||||||||||||||||
| Other expense (income), net |
43.2 | 80.3 | (109.6 | ) | (45.2 | )2(e) | — | — | (31.3 | ) | ||||||||||||||||||
|
|
|
|
|
|
|
|
|
|
|
|
|
|
|
|||||||||||||||
| Loss from continuing operations before income taxes |
(216.5 | ) | (36.6 | ) | 96.1 | (101.2 | ) | — | 46.9 | (211.3 | ) | |||||||||||||||||
| Income tax benefit |
(29.8 | ) | (12.2 | ) | 33.6 | (53.3 | )2(f) | (38.3 | )3(a) | 18.2 | 4(h) | (81.8 | ) | |||||||||||||||
|
|
|
|
|
|
|
|
|
|
|
|
|
|
|
|||||||||||||||
| Net loss from continuing operations |
$ | (186.7 | ) | $ | (24.4 | ) | $ | 62.5 | $ | (47.9 | ) | $ | 38.3 | $ | 28.7 | $ | (129.5 | ) | ||||||||||
|
|
|
|
|
|
|
|
|
|
|
|
|
|
|
|||||||||||||||
| Pro forma loss per share, continuing operations |
||||||||||||||||||||||||||||
| Basic and diluted |
$ | (0.27 | )4(b) | |||||||||||||||||||||||||
| Pro forma weighted average shares outstanding |
||||||||||||||||||||||||||||
| Basic and diluted |
475,139,081 | 4(b) | ||||||||||||||||||||||||||
66
Table of Contents
AB ACQUISITION LLC AND SUBSIDIARIES
UNAUDITED PRO FORMA CONDENSED CONSOLIDATED BALANCE SHEET
AS OF SEPTEMBER 12, 2015
(in millions)
| AB Acquisition LLC |
Pro Forma Adjustments for IPO-Related Transactions(3) |
Pro Forma Adjustments for IPO Transactions(4) |
AB Acquisition LLC Pro Forma |
|||||||||||||
| Assets |
||||||||||||||||
| Current assets |
||||||||||||||||
| Cash and cash equivalents |
$ | 777.7 | $ | — | $ | — | $ | 777.7 | ||||||||
| Receivables, net |
645.0 | — | — | 645.0 | ||||||||||||
| Inventories, net |
4,252.1 | — | — | 4,252.1 | ||||||||||||
| Other current assets |
449.5 | — | — | 449.5 | ||||||||||||
|
|
|
|
|
|
|
|
|
|||||||||
| Total current assets |
6,124.3 | — | — | 6,124.3 | ||||||||||||
| Property and equipment, net |
11,752.0 | — | — | 11,752.0 | ||||||||||||
| Intangible assets, net |
4,001.0 | — | — | 4,001.0 | ||||||||||||
| Goodwill |
1,013.8 | — | — | 1,013.8 | ||||||||||||
| Other assets |
1,116.4 | — | — | 1,116.4 | ||||||||||||
|
|
|
|
|
|
|
|
|
|||||||||
| TOTAL ASSETS |
$ | 24,007.5 | $ | — | $ | — | $ | 24,007.5 | ||||||||
|
|
|
|
|
|
|
|
|
|||||||||
| Liabilities and Members’/Stockholders’ Equity |
||||||||||||||||
| Current liabilities |
||||||||||||||||
| Accounts payable and accrued liabilities |
$ | 3,734.9 | $ | — | $ | (17.8 | )4(d) | $ | 3,717.1 | |||||||
| Current maturities of long-term debt and capitalized lease obligations |
181.0 | — | (12.6 | )4(e) | 168.4 | |||||||||||
| Other current liabilities |
1,195.6 | — | — | 1,195.6 | ||||||||||||
|
|
|
|
|
|
|
|
|
|||||||||
| Total current liabilities |
5,111.5 | — | (30.4 | ) | 5,081.1 | |||||||||||
| Long-term debt and capitalized lease obligations |
11,795.9 | — | (1,431.7 | )4(f) | 10,364.2 | |||||||||||
| Long-term tax liabilities |
1,674.1 | — | — | 1,674.1 | ||||||||||||
| Other long-term liabilities |
3,508.6 | — | — | 3,508.6 | ||||||||||||
|
|
|
|
|
|
|
|
|
|||||||||
| TOTAL LIABILITIES |
22,090.1 | — | (1,462.1 | ) | 20,628.0 | |||||||||||
| Commitments and contingencies |
||||||||||||||||
| Members’ equity |
1,917.4 | (1,917.4 | )3(b) | — | — | |||||||||||
| Stockholders’ equity |
— | 1,917.4 | 3(b) | 1,531.0 | 4(g) | 3,379.5 | ||||||||||
| (68.9 | )4(h) | |||||||||||||||
|
|
|
|
|
|
|
|
|
|||||||||
| TOTAL MEMBERS’ / STOCKHOLDERS’ EQUITY |
1,917.4 | — | 1,462.1 | 3,379.5 | ||||||||||||
|
|
|
|
|
|
|
|
|
|||||||||
| TOTAL LIABILITIES AND MEMBERS’/STOCKHOLDERS’ EQUITY |
$ | 24,007.5 | $ | — | $ | — | $ | 24,007.5 | ||||||||
|
|
|
|
|
|
|
|
|
|||||||||
67
Table of Contents
1. Basis of Presentation
The historical financial information of AB Acquisition and Safeway was derived from financial statements of the respective companies included elsewhere in this prospectus. The historical financial information has been adjusted to give pro forma effect to events that are (i) directly attributable to the Safeway acquisition, (ii) factually supportable, and (iii) with respect to the unaudited pro forma condensed consolidated statement of continuing operations, expected to have a continuing impact on the consolidated results. Condensed consolidated statements of continuing operations data for the 28 weeks ended September 4, 2014 and September 12, 2015 and summary balance sheet data as of September 12, 2015 are derived from our unaudited condensed consolidated financial statements for the periods then ended also included elsewhere in this prospectus. Safeway is included in the historical operating results of AB Acquisition for the period from January 31, 2015 through September 12, 2015. The adjusted historical financial information for Safeway for the 49 weeks ended January 30, 2015 is derived by adding the financial data from Safeway’s audited consolidated statement of income for the 53 weeks ended January 3, 2015 and Safeway’s unaudited condensed consolidated statement of income for the four weeks ended January 30, 2015, and subtracting Safeway’s unaudited condensed consolidated statement of income for the eight weeks ended February 22, 2014. The adjusted historical Safeway financial information for the 28 weeks ended September 4, 2014 was derived from the Safeway pre-acquisition unaudited financial statements for the 36 weeks ended September 6, 2014 and subtracting Safeway’s unaudited condensed consolidated statement of income for the eight weeks ended February 22, 2014.
2. Pro Forma for Safeway Transactions
The Safeway acquisition was accounted for in accordance with Accounting Standards Codification 805, Business Combinations, with AB Acquisition considered the acquirer of Safeway for accounting purposes. The Safeway acquisition closed on January 30, 2015, and, therefore, the fair value of the assets acquired and liabilities assumed are already reflected in AB Acquisition’s historical condensed consolidated balance sheet as of September 12, 2015. The unaudited pro forma condensed consolidated statements of continuing operations reflects the adjustments as if the Safeway acquisition occurred on February 21, 2014, the first day of fiscal 2014 (collectively referred to as “Pro Forma Adjustments related to the Safeway Transactions”).
The Pro Forma Adjustments related to the Safeway Transactions consist of the following:
| (a) | FTC divestiture |
In connection with the Safeway acquisition, Albertson’s Holdings, together with Safeway, announced that they entered into agreements to sell 111 Albertsons and 57 Safeway stores across eight states to four separate buyers. Divestiture of these stores was required by the FTC as a condition of closing the Safeway acquisition and was contingent on the completion of the Safeway acquisition. The divestitures were completed by the end of the company’s fiscal 2015 first quarter ended June 20, 2015. The pro forma adjustments reflect:
Fiscal 2014:
| (i) | a reduction in Net sales and other revenue of $3,285.3 million and the related reductions in Cost of sales of $2,283.3 million; and |
| (ii) | a decrease in Selling and administrative expenses of $1,068.3 million, which includes the $233.4 million impairment loss related to the divested stores. |
For the 28 weeks ended September 12, 2015:
| (iii) | a reduction in Net sales and other revenue of $444.5 million and the related reductions in Cost of sales of $310.5 million; and |
| (iv) | a decrease in Selling and administrative expenses of $110.9 million. |
68
Table of Contents
For the 28 weeks ended September 4, 2014:
| (v) | a reduction in Net sales and other revenue of $1,719.7 million and the related reductions in Cost of sales of $1,201.1 million; and |
| (vi) | a decrease in Selling and administrative expense of $439.1 million. |
| (b) | Cost of sales |
Adjustments have been included in the unaudited pro forma condensed consolidated statement of continuing operations to eliminate Safeway’s historical depreciation and amortization expense and record depreciation and amortization expense for the assets acquired related to the Safeway acquisition in Cost of sales:
| Fiscal 2014 | 28 weeks ended September 4, 2014 |
|||||||
| (in millions) | (in millions) | |||||||
| Elimination of Safeway’s historical depreciation and amortization expense |
$ | (97.0 | ) | $ | (52.9 | ) | ||
| Depreciation and amortization expense for assets acquired |
110.0 | 62.9 | ||||||
|
|
|
|
|
|||||
| Pro forma adjustment to increase Cost of sales |
$ | 13.0 | $ | 10.0 | ||||
|
|
|
|
|
|||||
| (c) | Selling and administrative expenses |
The net pro forma adjustments to Selling and administrative expenses are comprised of the following items:
| Fiscal 2014 | 28 weeks ended September 4, 2014 |
|||||||
| (in millions) | (in millions) | |||||||
| Depreciation and amortization |
||||||||
| Elimination of Safeway’s historical depreciation and amortization expense |
$ | (743.0 | ) | $ | (426.2 | ) | ||
| Depreciation and amortization expense for acquired assets |
808.3 | 461.9 | ||||||
|
|
|
|
|
|||||
| Adjustment to increase depreciation and amortization |
65.3 | 35.7 | ||||||
| PDC properties |
||||||||
| Elimination of Safeway’s gain on sale of PDC and the PDC properties’ historical depreciation expense, net |
$ | 17.3 | $ | (4.2 | ) | |||
| Period alignment adjustment |
2.0 | 1.0 | ||||||
| Rent expense for leaseback of PDC properties |
18.8 | 9.9 | ||||||
|
|
|
|
|
|||||
| Total adjustments for PDC properties |
38.1 | 6.7 | ||||||
| Other eliminations |
||||||||
| Transaction and related costs1 for the Safeway acquisition incurred by Albertsons. |
$ | (283.2 | ) | $ | (29.0 | ) | ||
| Transaction costs related to the Safeway acquisition incurred by Safeway |
(59.6 | ) | (10.4 | ) | ||||
| Non-employee equity-based compensation related to Safeway acquisition |
(191.6 | ) | — | |||||
|
|
|
|
|
|||||
| Total transaction costs elimination |
(534.4 | ) | (39.4 | ) | ||||
|
|
|
|
|
|||||
| Pro forma adjustment to (decrease) increase Selling and administrative expenses |
$ | (431.0 | ) | $ | 3.0 | |||
|
|
|
|
|
|||||
| 1 | Includes direct acquisition costs and loss on the settlement of appraisal rights litigation related to the Safeway acquisition. |
69
Table of Contents
| (d) | Interest expense, net |
The net pro forma adjustment to Interest expense, net, is primarily driven by AB Acquisition’s funding of the Safeway acquisition through borrowings of $4,859.0 million under the ABS/Safeway Term Loan Facilities, $850.0 million under the NAI Term Loan Facility, net borrowings of $609.6 million under the ABS/Safeway Notes and an additional $776.0 million under the ABS/Safeway ABL Facility, net of estimated payments on long-term borrowings related to the proceeds from the FTC divestitures.
| Fiscal 2014 | 28 weeks ended September 4, 2014 |
|||||||
| (in millions) | (in millions) | |||||||
| Interest expense, net |
||||||||
| Interest expense related to outstanding debt and capital lease obligations of AB Acquisition |
$ | 938.6 | $ | 494.6 | ||||
| Elimination of historical interest expense related to historical debt and capital lease obligations |
(916.5 | ) | (475.0 | ) | ||||
| Period alignment adjustment |
21.3 | 34.3 | ||||||
|
|
|
|
|
|||||
| Pro forma adjustment to increase Interest expense, net |
$ | 43.4 | $ | 53.9 | ||||
|
|
|
|
|
|||||
| (e) | Other expense, net |
The net pro forma adjustment to Other expense, net primarily reflects the elimination of the loss on the deal-contingent interest rate swap (the “Deal-Contingent Swap”). Prior to the Safeway acquisition, the swap was treated as an economic hedge with changes in fair value recorded through earnings. Upon closing of the Safeway acquisition, the interest rate swap was designated as a cash flow hedge, with any subsequent changes in fair value being recorded through Accumulated other comprehensive income.
| Fiscal 2014 | 28 weeks ended September 4, 2014 |
|||||||
| (in millions) | (in millions) | |||||||
| Other expense, net |
||||||||
| Elimination of loss on Deal-Contingent Swap |
$ | (96.1 | ) | $ | (43.2 | ) | ||
| Elimination of PDC properties’ historical Other expense |
(2.0 | ) | (2.0 | ) | ||||
|
|
|
|
|
|||||
| Pro forma adjustment to decrease Other expense, net |
$ | (98.1 | ) | $ | (45.2 | ) | ||
|
|
|
|
|
|||||
| (f) | Income tax (benefit) expense |
The unaudited pro forma condensed consolidated income tax (benefit) expense has been adjusted for the tax effect of the pro forma adjustments to income before income taxes by applying a blended federal and state statutory tax rate of 39.6% for Safeway.
3. Pro Forma Adjustments for IPO-Related Transactions
Unaudited Pro Forma Condensed Consolidated Statement of Continuing Operations
| (a) | As part of the IPO-Related Transactions, all of our operating subsidiaries will become subsidiaries of Albertsons Companies, Inc., a Delaware corporation, and as a result all of our operations will be taxable as part of a consolidated group for federal income tax purposes. The pro forma adjustment to Income tax (benefit) expense is derived by applying a combined federal and state statutory tax rate of 38.7% to the pro forma pre-tax earnings of the company, which assumes that all of the AB Acquisition entities are taxable as a group for federal and state income tax purposes effective February 21, 2014. |
70
Table of Contents
Unaudited Pro Forma Condensed Consolidated Balance Sheet
| (b) | As part of the IPO-Related Transactions, all of our operating subsidiaries will become subsidiaries of Albertsons Companies, Inc., a Delaware corporation. The pro forma adjustments to members’ equity and stockholders’ equity represent the creation of share capital, paid in capital and retained earnings upon the corporate reorganization and the elimination of the historical membership equity. Upon the corporate reorganization, the outstanding units will be exchanged into 409,832,959 shares of common stock. |
4. Pro Forma Adjustments for IPO Transactions
Unaudited Pro Forma Condensed Consolidated Statement of Continuing Operations
| (a) | The pro forma adjustment to Interest expense, net represents the decrease to pro forma interest expense related to the application of $1,531 million of the net proceeds to us from the sale of such shares to repay certain indebtedness as described in “Use of Proceeds” as if these events had occurred on February 21, 2014, the first day of fiscal 2014. The interest expense included in the unaudited pro forma condensed consolidated financial information reflects a weighted average interest rate of 7.90% (including amortization of debt discounts and deferred financing costs). |
| (b) | Pro forma Net loss per weighted average basic and diluted shares outstanding gives effect to the exchange of all our outstanding units into shares of our common stock as part of the IPO-Related Transactions and the issuance of 65,306,122 shares in this offering, based on an assumed initial public offering price of $24.50 per share (the midpoint of the price range set forth on the cover of this prospectus). |
| (c) | The pro forma adjustment to Income tax (benefit) expense is derived by applying a combined federal and state statutory tax rate of 38.7% to the pro forma adjustment to interest expense. |
No adjustment has been made to the unaudited pro forma condensed consolidated statement of continuing operations to reflect (a) the estimated $68.9 million loss on early extinguishment of debt, including the write off of deferred financing costs and debt discounts as these amounts are non-recurring charges incurred as a result of the repayment of certain debts, or (b) the Anticipated Refinancing.
Unaudited Pro Forma Condensed Consolidated Balance Sheet
The unaudited pro forma condensed consolidated balance sheet of AB Acquisition does not give effect to the Anticipated Refinancing, but reflects the Transactions, including the pro forma effects of the issuance of shares of common stock and the application of $1,531 million of the net proceeds from the sale of such shares to repay certain indebtedness as described in “Use of Proceeds” (excluding the remaining shares of common stock being issued in this offering) as if these events had occurred on September 12, 2015, as follows:
| (d) | The pro forma adjustment to Accounts payable and accrued liabilities represents the payment of accrued interest in connection with the repayment of certain existing debt. |
| (e) | The pro forma adjustment to Current maturities of long-term debt and capitalized lease obligations represents repayments of the current portion of certain debts outstanding with proceeds from this offering. |
| (f) | The pro forma adjustment to Long-term debt and capitalized lease obligations represents repayments of the long-term portion of certain debts outstanding with proceeds from this offering, including the write off of deferred financing costs and debt discounts. |
71
Table of Contents
| (g) | The pro forma adjustments to stockholders’ equity represent (i) the issuance of shares of common stock in this offering to fund the debt repayments discussed above and (ii) the deduction of the estimated underwriting discounts and commissions and estimated offering expenses. |
| (h) | The pro forma adjustment to stockholders’ equity represents the impact to retained earnings for the loss on early extinguishment of debt, including the write off of deferred financing costs and debt discounts, incurred as a result of the debt repayments. |
The following schedules represent the long-term debt being repaid with the net proceeds from this offering (but not the proceeds of the Anticipated Refinancing) and, on a pro forma basis, the amount of scheduled repayments remaining under the applicable debt instruments, including the scheduled maturities of such debt instruments and excluding deferred financing costs and debt discount of $50.0 million:
| Debt Instrument |
Amount (in millions) |
|||
| NAI Term Loan Facility |
$ | 843.6 | ||
| ABS/Safeway Notes |
243.8 | |||
| ABS/Safeway Term Loan Facilities |
406.8 | |||
|
|
|
|||
| Total debt repayments |
$ | 1,494.2 | ||
|
|
|
|||
| Debt Instrument (in millions) |
2015 | 2016 | 2017 | 2018 | 2019 | Thereafter | Total | |||||||||||||||||||||
| Long-term debt maturities, excluding deferred financing costs and debt discounts(1) |
$ | 36.4 | $ | 186.6 | $ | 314.7 | $ | 209.4 | $ | 2,322.8 | $ | 6,995.0 | $ | 10,064.9 | ||||||||||||||
| (1) | Does not reflect incremental debt of $300 million borrowed under the NAI Term Loan Facility on November 10, 2015 to fund the A&P Transaction. |
72
Table of Contents
MANAGEMENT’S DISCUSSION AND ANALYSIS OF
FINANCIAL CONDITION AND RESULTS OF OPERATIONS OF AB ACQUISITION
The following discussion and analysis of our financial condition and results of operations should be read in conjunction with “Selected Historical Financial Information of AB Acquisition,” “Unaudited Pro Forma Condensed Consolidated Financial Information” and our consolidated financial statements and related notes included elsewhere in this prospectus. This discussion contains forward-looking statements based upon current expectations that involve numerous risks and uncertainties, including those described in the “Risk Factors” section of this prospectus. Our actual results may differ materially from those contained in any forward-looking statements.
Our last three fiscal years consisted of the 53-week period ended February 28, 2015, the 52-week period ended February 20, 2014 and the 52-week period ended February 21, 2013. Our first fiscal quarter consists of 16 weeks. Our fiscal 2014 results include four weeks of Safeway’s financial results from January 31, 2015 through February 28, 2015. Comparability is affected by income and expense items that vary significantly between and among the periods, including as a result of our acquisition of Safeway during the fourth quarter of fiscal 2014, the acquisition of NAI in fiscal 2013 and an extra week in fiscal 2014.
Business Overview
We are one of the largest food and drug retailers in the United States, with strong local presence and national scale. Over the past three years, we have completed a series of acquisitions that has significantly increased our portfolio of stores. We operated 2,196, 2,382, 1,075 and 192 stores as of September 12, 2015, February 28, 2015, February 20, 2014 and February 21, 2013, respectively. In addition, as of September 12, 2015, we operated 379 adjacent fuel centers, 30 dedicated distribution centers and 21 manufacturing facilities. Our operations are predominantly located in the Western, Southern, Midwest, Northeast, and Mid-Atlantic regions of the United States under the banners Albertsons, Safeway, Jewel-Osco, Vons, Shaw’s, Star Market, Acme, Tom Thumb, Pavilions, Carrs, Randalls, United Supermarkets, Market Street, Amigos, United Express and Sav-On and are reported in a single reportable segment.
Our operations and financial performance are affected by U.S. economic conditions such as macroeconomic conditions, credit market conditions and the level of consumer confidence. While the combination of improved economic conditions, the trend towards lower unemployment, higher wages and lower gasoline prices have contributed to improved consumer confidence, there is continued uncertainty about the strength of the economic recovery. If the current economic situation does not continue to improve or if it weakens, or if gasoline prices rebound, consumers may reduce spending, trade down to a less expensive mix of products or increasingly rely on food discounters, all of which could impact our sales growth. In addition, consumers’ perception or uncertainty related to the economic recovery and future fuel prices could also dampen overall consumer confidence and reduce demand for our product offerings. Both inflation and deflation affect our business. Food deflation could reduce sales growth and earnings, while food inflation could reduce gross profit margins. We are unable to predict if the economy will continue to improve or predict the rate at which the economy may improve or the direction of gasoline prices. If the economy does not continue to improve or if it weakens or fuel prices increase, our business and results of operations could be adversely affected.
We currently expect to achieve approximately $800 million of annual synergies by the end of fiscal 2018, with associated one-time costs of approximately $1.1 billion, or $690 million, net of estimated synergy-related asset sale proceeds. Inclusion of the projected cost synergies in this prospectus should not be viewed as a representation that we in fact will achieve this annual synergy target by the end of fiscal 2018, or at all. In addition, although we currently expect to achieve synergies
73
Table of Contents
from the Safeway acquisition of approximately $200 million during fiscal 2015, or $440 million on an annual run-rate basis, by the end of fiscal 2015, the inclusion of these expected cost synergy targets in this prospectus should not be viewed as a representation that we will in fact achieve these synergies by the end of fiscal 2015, or at all. To the extent we fail to achieve these synergies, our results of operations may be impacted, and any such impact may be material.
We have identified various synergies including corporate and division overhead savings, our own brands, vendor funds, the conversion of Albertsons and NAI onto Safeway’s IT systems, marketing and advertising cost reduction and operational efficiencies within our back office, distribution and manufacturing organizations. Actual synergies, the expenses and cash required to realize the synergies and the sources of the synergies could differ materially from these estimates, and we cannot assure you that we will achieve the full amount of synergies on the schedule anticipated, or at all, or that these synergy programs will not have other adverse effects on our business. In light of these significant uncertainties, you should not place undue reliance on our estimated synergies.
Total debt, including both the current and long-term portions of capital lease obligations, increased to $12.6 billion as of the end of fiscal 2014. The increase in fiscal 2014 was primarily the result of the financing for the Safeway acquisition and the assumption of Safeway debt. Our substantial indebtedness could have important consequences for you. For example it could: adversely affect the market price of our common stock; increase our vulnerability to general adverse economic and industry conditions; require us to dedicate a substantial portion of our cash flow from operations to payments on our indebtedness, thereby reducing the availability of our cash flow to fund working capital, capital expenditures and other general corporate purposes, including acquisitions; limit our flexibility in planning for, or reacting to, changes in our business and the industry in which we operate; place us at a competitive disadvantage compared to our competitors that have less debt; and limit our ability to borrow additional funds. See “—Debt Management.” For fiscal 2014, our interest expense was approximately $633.2 million. We have exposure to future interest rates based on the variable rate debt under our credit facilities and to the extent we raise additional debt in the capital markets to meet maturing debt obligations, to fund our capital expenditures and working capital needs and to finance future acquisitions. Daily working capital requirements are typically financed with operational cash flow and through the use of various committed lines of credit. The interest rate on these borrowing arrangements is generally determined from the inter-bank offering rate at the borrowing date plus a pre-set margin. We manage our exposure to interest rate fluctuations through the use of interest rate swaps. Although we employ risk management techniques to hedge against interest rate volatility, significant and sustained increases in market interest rates could materially increase our financing costs and negatively impact our reported results. The interest rates we pay on future borrowings under the Senior Secured Credit Facilities are dependent on LIBOR. We believe a 100 basis point increase on our variable interest rates would not have a material impact on our interest expense. We rely on access to bank and capital markets as sources of liquidity for cash requirements not satisfied by cash flows from operations. A downgrade in our credit ratings from the internationally recognized credit rating agencies could negatively affect our ability to access the bank and capital markets, especially in a time of uncertainty in either of those markets. A rating downgrade could also impact our ability to grow our business by substantially increasing the cost of, or limiting access to, capital.
In fiscal 2015, we expect to spend approximately $850 million for capital expenditures, or 1.5% of our fiscal 2014 sales on a pro forma basis, including 115 upgrade and remodel projects and excluding approximately $300 million of initial Safeway integration-related capital expenditures in fiscal 2015, in advance of anticipated sales of surplus assets. This amount excludes approximately $126 million of initial opening and transition costs and capital expenditures that we expect to spend by the end of fiscal 2016 to remodel and remerchandise the stores and to invest in price and labor related to the A&P Transaction, and approximately $47 million of initial opening and transition costs and capital expenditures that we expect to spend by the end of fiscal 2016 to replace equipment and stock the 29 stores being acquired from Haggen.
74
Table of Contents
Reflecting consumer preferences, we have a significant focus on perishable products. Sales of perishable products accounted for approximately 40.6% of our total sales in fiscal 2014. We could suffer significant perishable product inventory losses and significant lost revenue in the event of the loss of a major supplier or vendor, disruption of our distribution network, extended power outages, natural disasters or other catastrophic occurrences. See “Risks Related to Our Business and Industry—Our stores rely heavily on sales of perishable products, and product supply disruptions may have an adverse effect on our profitability and operating results.”
We employed a diverse workforce of approximately 265,000, 265,000, 123,000 and 19,000 associates as of September 12, 2015, February 28, 2015, February 20, 2014 and February 21, 2013, respectively. As of February 28, 2015, approximately 174,000 of our employees were covered by collective bargaining agreements. During fiscal 2015, collective bargaining agreements covering approximately 73,000 employees are scheduled to expire. If, upon the expiration of such collective bargaining agreements, we are unable to negotiate acceptable contracts with labor unions, it could increase our operating costs and disrupt our operations.
A considerable number of our employees are paid at rates related to the federal minimum wage. Additionally, many of our stores are located in states, including California, where the minimum wage is greater than the federal minimum wage and where a considerable number of employees receive compensation equal to the state’s minimum wage. For example, as of September 12, 2015, we employed approximately 69,000 associates in California, where the current minimum wage was recently increased to $9.00 per hour, and will increase to $10.00 per hour effective January 1, 2016. In Maryland, where we employed approximately 7,700 associates as of September 12, 2015, the minimum wage was recently increased to $8.25 per hour, and will gradually increase to $10.10 per hour by July 1, 2018. Moreover, municipalities may set minimum wages above the applicable state standards. For example, the minimum wage in Seattle, Washington, where we employed approximately 1,900 associates as of September 12, 2015, was recently increased to $11.00 per hour, and will increase to $15.00 per hour effective January 1, 2017 for employers with more than 500 employees nationwide. In Chicago, Illinois, where we employed approximately 5,900 associates as of September 12, 2015, the minimum wage was recently increased to $10.00 per hour, and will gradually increase to $13.00 per hour by July 1, 2019. Any further increases in the federal minimum wage or the enactment of state or local minimum wage increases could also increase our labor costs, which may adversely affect our results of operations and financial condition.
We participate in various multiemployer pension plans for substantially all employees represented by unions that require us to make contributions to these plans in amounts established under collective bargaining agreements. In fiscal 2015, we expect to contribute approximately $370.0 million to multiemployer pension plans, subject to collective bargaining conditions, exclusive of additional amounts we may be required to contribute relating to A&P. Based on an assessment of the most recent information available, the company believes that most of the multiemployer plans to which it contributes are underfunded. As of February 28, 2015, our estimate of the company’s share of the underfunding of multiemployer plans to which it contributes was $3.0 billion. The company’s share of underfunding described above is an estimate and could change based on the results of collective bargaining efforts, investment returns on the assets held in the plans, actions taken by trustees who manage the plans’ benefit payments, interest rates, if the employers currently contributing to these plans cease participation, and requirements under the PPA, the Multiemployer Pension Reform Act of 2014 and applicable provisions of the Code. Additionally, underfunding of the multiemployer plans means that, in the event we were to exit certain markets or otherwise cease making contributions to these plans, we could trigger a substantial withdrawal liability. See “Risks Related to Our Business and Industry—Increased pension expenses, contributions and surcharges may have an adverse impact on our financial results.”
75
Table of Contents
A&P Transaction
On July 19, 2015, AB Acquisition announced that it entered into an asset purchase agreement pursuant to which our indirect wholly owned subsidiary, Acme Markets, agreed to acquire 76 stores operated by A&P pursuant to Section 363 of Chapter 11 of the United States Bankruptcy Code. We have exercised our right to exclude certain stores from our purchase and, as a result, we will purchase 71 stores. The purchase price for the 71 stores is approximately $319.0 million, including the cost of acquired inventory. The acquired stores, which are principally located in the northern New York City suburbs, northern New Jersey and the greater Philadelphia area, are complementary to Acme Markets’ existing store and distribution base and will be re-bannered as Acme stores. We funded an initial deposit of approximately $63.9 million into an escrow account on July 20, 2015. On November 10, 2015, NAI entered into an amendment to the NAI Term Loan Agreement and borrowed an additional $300 million thereunder, the proceeds of which will be used to fund the balance of the purchase price of the A&P Transaction. The A&P Transaction received approval from the United States Bankruptcy Court for the Southern District of New York on September 21, 2015, and the waiting period under the Hart-Scott-Rodino Antitrust Improvements Act terminated on September 15, 2015. We have completed the acquisition of 65 stores as of November 13, 2015, and we expect to complete the acquisition of the remaining stores during the third quarter of fiscal 2015.
Safeway Acquisition
On January 30, 2015, the company completed its acquisition of Safeway by acquiring all of the outstanding shares of Safeway for cash consideration of $34.92 per share or $8,263.5 million and issuing contingent value rights with an estimated fair value of $1.03 and $0.05 per share relating to Safeway’s 49% interest in Casa Ley and deferred considerations related to Safeway’s previous sale of the PDC assets, respectively, for an aggregate fair value of $270.9 million. At the time of the Safeway acquisition, Safeway operated 1,325 retail food stores under the banners Safeway, Vons, Tom Thumb, Pavilions, Randalls and Carrs located principally in California, Hawaii, Oregon, Washington, Alaska, Colorado, Arizona, Texas, and the Mid-Atlantic region. In addition, at the time of the Safeway acquisition, Safeway had 353 fuel centers, 15 distribution centers and 19 manufacturing facilities.
As a condition to approving the Safeway acquisition, the FTC required the sale of 111 Albertsons stores and 57 Safeway stores. Haggen purchased 146 stores in Arizona, California, Nevada, Oregon and Washington; Associated Wholesale Grocers purchased 12 stores in Texas; Associated Food Stores purchased eight stores in Montana and Wyoming; and SuperValu purchased two stores in Washington. The aggregate sales price of these stores was $525.8 million, including the book value of inventory. The company recorded an impairment loss on the sale of the 111 Albertsons banner stores during the fourth quarter of fiscal 2014. The company recorded the assets and liabilities associated with the 57 Safeway stores at fair value less costs to sell as part of its accounting for the Safeway acquisition. The transfer of these stores to the respective buyers commenced following the closing of the Safeway acquisition and was completed in the first quarter of fiscal 2015 in accordance with the asset purchase agreements.
Haggen has withheld payment of approximately $41 million due for purchased inventory at 38 stores. On September 8, 2015, Haggen filed a petition for protection under Chapter 11 of the U.S. Bankruptcy Code. See “Risks Related to Our Business and Industry—We may have liability under certain operating leases that were assigned to third parties.” In addition, on September 1, 2015, Haggen commenced a lawsuit against Albertson’s LLC and Albertson’s Holdings LLC in the United States District Court for the District of Delaware, alleging claims for violation of Section 7 of the Clayton Act, attempted monopolization under the Sherman Act, breach of contract, indemnification, breach of implied covenant of good faith and fair dealing, fraud, unfair competition, misappropriation of trade secrets under the Uniform Trade Secrets Acts, conversion and violation of the Washington Consumer
76
Table of Contents
Protection Act. In the complaint, Haggen alleged that we, among other actions set out in the complaint, misused Haggen’s confidential information to draw customers away from Haggen stores, provided inaccurate, incomplete and misleading inventory data and pricing information on products transferred to Haggen, deliberately understocked and overstocked inventory in stores acquired by Haggen and wrongfully cut off advertising prior to the transfer of the stores to Haggen. Furthermore, Haggen alleged that, if it is destroyed as a competitor, its damages may exceed $1 billion, and asserted it is entitled to treble and punitive damages and to seek rescission of the asset purchase agreement. In addition, on September 17, 2015, we received a letter from legal counsel of another purchaser of a small number of our FTC-mandated divested stores, alleging claims similar to those presented in Haggen’s lawsuit. See “Risks Related to the Safeway and A&P Acquisitions—Haggen has asserted claims against us which, if adversely determined, would subject us to significant liabilities.”
NAI Acquisition
On March 21, 2013, the company acquired all of the issued and outstanding shares of NAI from SuperValu pursuant to a stock purchase agreement for a total purchase consideration of $253.6 million, including $69.9 million of working capital adjustments, and assumed debt and capital lease obligations with a carrying value prior to the acquisition date of $3.2 billion. The purchase consideration was primarily cash and a short-term payable that was fully paid as of February 20, 2014. At the time of the NAI acquisition, NAI operated 871 retail food stores under its Jewel-Osco, ACME, Shaw’s, Star Market and Albertsons banners, primarily located in the Northeast, Midwest, Mid-Atlantic and Western regions of the United States. In addition, we acquired NAI’s 10 distribution centers.
United Acquisition
On December 29, 2013, we acquired United Supermarkets for $362.1 million in cash, expanding our presence in North and West Texas, in a transaction that offered significant synergies and added a differentiated upscale store format, “Market Street,” to the Albertsons portfolio. At the time of the United acquisition, United operated 51 traditional, specialty and Hispanic retail food stores under its United Supermarkets, Market Street and Amigos banners, seven convenience stores and 26 fuel centers under its United Express banner and three distribution centers. United is located in 30 markets across North and West Texas.
The following table shows stores operated, acquired, opened, divested and closed during the periods presented:
| First Two Quarters Fiscal 2015 |
Fiscal 2014(1) |
Fiscal 2013(2) |
Fiscal 2012 |
|||||||||||||
| Stores, beginning of period |
2,382 | 1,075 | 192 | 205 | ||||||||||||
| Acquired |
— | 1,330 | 926 | — | ||||||||||||
| Divested |
(153 | ) | (15 | ) | — | — | ||||||||||
| Opened |
3 | 4 | 1 | — | ||||||||||||
| Closed |
(36 | ) | (12 | ) | (44 | ) | (13 | ) | ||||||||
|
|
|
|
|
|
|
|
|
|||||||||
| Stores, end of period |
2,196 | 2,382 | 1,075 | 192 | ||||||||||||
|
|
|
|
|
|
|
|
|
|||||||||
| (1) | Primarily includes the 1,325 stores acquired through the Safeway acquisition on January 30, 2015. |
| (2) | Stores acquired during this period include 871 stores acquired through the NAI acquisition on March 21, 2013, four stores acquired from Vons REIT, Inc. on October 10, 2013, and 51 stores acquired through the United acquisition on December 29, 2013. |
77
Table of Contents
Our Strategy
Our operating philosophy is simple: we run great stores with a relentless focus on sales growth. We believe there are significant opportunities to grow sales and enhance profitability and free cash flow, through execution of the following strategies:
Continue to Drive Identical Store Sales Growth. Consistent with our operating playbook, we plan to deliver identical store sales growth by implementing the following initiatives:
| • | Enhancing and Upgrading Our Fresh, Natural and Organic Offerings and Signature Products. We continue to enhance and upgrade our fresh, natural and organic offerings across our meat, produce, service deli and bakery departments to meet the changing tastes and preferences of our customers. We also believe that continued innovation and expansion of our high-volume, high-quality and differentiated signature products will contribute to stronger sales growth. |
| • | Expanding Our Own Brand Offerings. We continue to drive sales growth and profitability by extending our own brand offering across our banners, including high-quality and recognizable brands such as O Organics, Open Nature, Eating Right and Lucerne. |
| • | Leveraging Our Effective and Scalable Loyalty Programs. We believe we can grow basket size and improve the shopping experience for our customers by expanding our just for U, MyMixx and fuel-based loyalty programs. In addition, we believe we can further enhance our merchandising and marketing programs by utilizing our customer analytics capabilities, including advanced digital marketing and mobile applications, and through the expansion of our online and home delivery options. |
| • | Capitalizing on Demand for Health and Wellness Services. We intend to leverage our portfolio of pharmacies and our growing network of wellness clinics to capitalize on increasing customer demand for health and wellness services. Pharmacy customers are among our most loyal, and their average weekly spend is over 2.5x that of our non-pharmacy customers. We plan to continue to grow our pharmacy script counts through new patient prescription transfer programs and initiatives such as clinic, hospital and preferred network partnerships, which we believe will expand our access to patients. We believe that these efforts will drive sales growth and generate customer loyalty. |
| • | Continuously Evaluating and Upgrading Our Store Portfolio. We plan to pursue a disciplined capital allocation strategy to upgrade, remodel and relocate stores to attract customers to our stores and to increase store volumes. We believe that our store base is in excellent condition, and we have developed a remodel strategy that is both cost-efficient and effective. |
| • | Driving Innovation. We intend to drive traffic and sales growth through constant innovation. We will remain focused on identifying emerging trends in food and sourcing new and innovative products. We will also seek to build new, and enhance existing, customer relationships through our digital capabilities. |
| • | Sharing Best Practices Across Divisions. Our division leaders collaborate closely to ensure the rapid sharing of best practices. Recent examples include the expansion of our O Organics offering across banners, the accelerated roll-out of signature products such as Albertsons’ fresh fruit and vegetables cut in-store and a broader assortment and new fixtures for our wine and floral shops, implementing Safeway’s successful strategy across many of our banners. |
We believe the combination of these actions and initiatives, together with the attractive industry trends described in more detail under “Business—Our Industry,” will continue to drive identical store sales growth.
78
Table of Contents
Following the NAI acquisition, we implemented our operating playbook focused on decentralizing operations, improving the overall customer and store experience, expanding and upgrading fresh food offerings, increasing store-level accountability and selected investment in price. The SVU Albertsons Stores were averaging negative 4.8% identical store sales in fiscal 2012 (prior to their acquisition). The SVU Albertsons Stores averaged positive 5.7% identical store sales during the final 24 weeks of fiscal 2013, with momentum continuing into fiscal 2014 with positive 8.7%, 7.5%, 8.0% and 8.5% identical store sales growth in the first, second, third and fourth quarter of fiscal 2014, respectively. The NAI Stores were averaging negative 4.8% identical store sales, compared to positive 7.7% identical store sales during the final 24 weeks of fiscal 2013 with momentum continuing into fiscal 2014 with positive 12.2%, 11.9%, 8.5% and 3.6% identical store sales growth in the first, second, third and fourth quarters of fiscal 2014, respectively.
Enhance Our Operating Margin. Our focus on identical store sales growth provides an opportunity to enhance our operating margin by leveraging our fixed costs. We plan to realize further margin benefit through added scale from partnering with vendors and by achieving efficiencies in manufacturing and distribution. In addition, we maintain a disciplined approach to expense management and budgeting.
Implement Our Synergy Realization Plan. We are currently executing on an annual synergy plan of approximately $800 million from the acquisition of Safeway, which we expect to achieve by the end of fiscal 2018, with associated one-time costs of approximately $1.1 billion, or $690 million (net of estimated synergy-related asset sale proceeds). Anticipated synergies are expected to require approximately $300 million of one-time integration-related capital expenditures in fiscal 2015, in advance of anticipated sales of surplus assets. Our detailed synergy plan was developed on a bottom-up, function-by-function basis by combined Albertsons and Safeway teams. The plan includes capturing opportunities from corporate and division cost savings, simplifying business processes and rationalizing headcount. Over time, Safeway’s information technology systems will support all of our stores, distribution centers and systems, including financial reporting and payroll processing, as we wind down our transition services agreement for our Albertsons, Acme, Jewel-Osco, Shaw’s and Star Market stores with SuperValu on a store-by-store basis. We anticipate extending the expansive and high-quality own brand program developed at Safeway across all of our banners. We believe our increased scale will optimize and improve our vendor relationships. We also plan to achieve marketing and advertising savings from lower print, production and broadcast rates in overlapping regions and reduced agency spend. Finally, we intend to consolidate managed care provider reimbursement programs and leverage our combined scale for volume discounts on branded and generic drugs. We expect to achieve synergies from the Safeway acquisition of approximately $200 million in fiscal 2015, or $440 million on an annual run rate basis, by the end of fiscal 2015, principally from corporate and division overhead savings, our own brands, vendor funds and marketing and advertising cost reductions. Approximately 80% of our $800 million annual synergy target is independent of sales growth, which we believe significantly reduces the risk of achieving our target.
Selectively Grow Our Store Base Organically and Through Acquisition. We intend to grow our store base organically through disciplined investment in new stores. On July 19, 2015, we entered into an agreement with A&P pursuant to which we are acquiring 71 stores for our Acme banner. We continually review acquisition opportunities that we believe are synergistic with our existing store network. We believe our healthy balance sheet and decentralized structure also provide us with strategic flexibility and a strong platform to make further acquisitions. We evaluate strategic acquisition opportunities on an ongoing basis as we seek to strengthen our competitive position in existing markets or expand our footprint into new markets. We believe selected acquisitions and our successful track record of integration and synergy delivery provide us with an opportunity to further enhance sales growth, leverage our cost structure and increase profitability and free cash flow.
79
Table of Contents
Results of Operations
The following discussion sets forth certain information and comparisons regarding the components of our consolidated statements of operations for the 28 weeks ended September 12, 2015, the 28 weeks ended September 4, 2014 and fiscal 2014, fiscal 2013 and fiscal 2012.
Comparison of 28 Weeks Ended September 12, 2015 to 28 Weeks Ended September 4, 2014:
The following table and related discussion set forth certain information and comparisons regarding the components of our Condensed Consolidated Statements of Operations for the 28 weeks ended September 12, 2015 (“first two quarters of fiscal 2015”) and September 4, 2014 (“first two quarters of fiscal 2014”). As of the end of the first two quarters of fiscal 2015 and the first two quarters of fiscal 2014, we operated 2,196 and 1,081 stores, respectively.
| 28 weeks ended | ||||||||||||||||
| (Dollars in Millions) | ||||||||||||||||
| September 12, 2015 | % of Sales | September 4, 2014 | % of Sales | |||||||||||||
| Net sales and other revenue |
$ | 31,488.9 | 100.0 | % | $ | 12,821.6 | 100.0 | % | ||||||||
| Cost of sales |
22,994.5 | 73.0 | % | 9,302.6 | 72.6 | % | ||||||||||
|
|
|
|
|
|
|
|
|
|||||||||
| Gross profit |
8,494.4 | 27.0 | % | 3,519.0 | 27.4 | % | ||||||||||
| Selling and administrative expenses |
8,406.4 | 26.7 | % | 3,449.8 | 26.9 | % | ||||||||||
|
|
|
|
|
|
|
|
|
|||||||||
| Operating income |
88.0 | 0.3 | % | 69.2 | 0.5 | % | ||||||||||
| Interest expense |
507.7 | 1.6 | % | 242.5 | 1.9 | % | ||||||||||
| Other (income) expense, net |
(9.3 | ) | — | % | 43.2 | 0.3 | % | |||||||||
|
|
|
|
|
|
|
|
|
|||||||||
| Loss before income taxes |
(410.4 | ) | (1.3 | )% | (216.5 | ) | (1.7 | )% | ||||||||
| Income tax benefit |
(87.4 | ) | (0.3 | )% | (29.8 | ) | (0.2 | )% | ||||||||
|
|
|
|
|
|
|
|
|
|||||||||
| Net loss |
$ | (323.0 | ) | (1.0 | )% | $ | (186.7 | ) | (1.5 | )% | ||||||
|
|
|
|
|
|
|
|
|
|||||||||
Identical Store Sales, Excluding Fuel
| 28 weeks ended | ||||||||
| September 12, 2015 |
September 4, 2014 |
|||||||
| AB Acquisition LLC(1) |
4.5 | % | 8.7 | % | ||||
| (1) | The SVU Albertsons Stores and the acquired NAI Stores became identical on March 21, 2014, and the acquired United stores became identical on December 29, 2014. The Safeway stores are not considered identical for any periods presented above. |
Net Sales and Other Revenue
Sales and other revenue increased to $31.5 billion for the first 28 weeks of fiscal 2015 from $12.8 billion for the first 28 weeks of fiscal 2014. The increase in sales was driven primarily by the Safeway acquisition and the ID sales increase, which contributed increases of $19.0 billion and $517.2 million, respectively. These increases were partially offset by a $777.8 million decline in sales from the Albertsons stores sold as part of the FTC divestiture process.
Gross Profit
Gross profit represents the portion of sales and other revenue remaining after deducting the cost of goods sold during the period, including purchase and distribution costs. These costs include inbound
80
Table of Contents
freight charges, purchasing and receiving costs, warehouse inspection costs, warehousing costs and other costs associated with our distribution network. Advertising, promotional expenses and vendor allowances are also components of cost of goods sold.
For the first 28 weeks of fiscal 2015, gross profit margin decreased to 27.0% compared to 27.4% for the first 28 weeks of fiscal 2014. The 40 basis point reduction in gross profit margin primarily reflects the addition of low-margin fuel sales from Safeway fuel centers, partially offset by our acquisition of additional stores in higher margin markets as a result of the Safeway acquisition.
Selling and Administrative Expenses
Selling and administrative expenses consist primarily of store level costs, including wages, employee benefits, rent, depreciation and utilities, in addition to certain back-office expenses related to our corporate and division offices.
For the first 28 weeks of fiscal 2015, selling and administrative expenses decreased to 26.7% of sales, compared to 26.9% of sales for the first 28 weeks of fiscal 2014. The 20 basis point reduction in selling and administrative expenses is primarily due to improved leverage of employee-related expenses and other fixed operating costs driven by the growth in ID store sales, partially offset by higher acquisition- and integration-related costs, increased non-cash equity-based compensation expense and the loss on property dispositions consisting primarily of the additional $41.1 million loss on the properties sold to Haggen. Acquisition- and integration-related costs, net includes a $29.6 million non-cash write-off of a tax indemnification asset due to the reduction of a related estimated tax liability in the second quarter of fiscal 2015. The tax indemnification asset and related estimated tax liability were both initially recorded as a part of the NAI acquisition. During the second quarter of fiscal 2015, and as further discussed below, the estimated tax liability was reduced and recorded as an income tax benefit with the write-off of the associated tax indemnification asset being recorded within Selling and administrative expenses.
Interest Expense, Net
Interest expense was $507.7 million for the first 28 weeks of fiscal 2015 compared to $242.5 million for the first 28 weeks of fiscal 2014. The increase in interest expense was due to significantly higher average outstanding borrowings related to the financing of the Safeway acquisition.
Other (Income)/Expense, Net
For the first 28 weeks of fiscal 2015, Other income, net, was $9.3 million and consisted primarily of income from our equity investment in Casa Ley and a gain on the change in fair value of the Casa Ley CVR, partially offset by a foreign currency loss. This compared to Other expense, net of $43.2 million for the first 28 weeks of fiscal 2014, which consisted of a loss related to the change in fair value of the company’s deal-contingent interest rate swap. This swap became effective upon closing of the Safeway acquisition, at which time it was designated as a cash flow hedge with changes in fair value being marked to market through Accumulated other comprehensive income. Prior to closing the Safeway acquisition, the swap was treated as an economic hedge and was marked to market through earnings.
Income Tax Benefit
Income tax benefit was $87.4 million and $29.8 million, representing effective tax rates of 21.3% and 13.8%, for the first 28 weeks of fiscal 2015 and the first 28 weeks of fiscal 2014, respectively. The increase in the income tax benefit and effective tax rate for the first 28 weeks of fiscal 2015 as
81
Table of Contents
compared to first 28 weeks of fiscal 2014 was driven by the impact of newly acquired Safeway operations and a $29.6 million reduction to an estimated tax liability as the result of new tax regulations and the completion of a related tax study during the second quarter of 2015, partially offset by the effect of recording of an additional valuation allowance against deferred tax assets generated from operating losses of NAI.
We are organized as a partnership, which generally is not subject to entity level tax, and conduct our operations primarily through limited liability companies and Subchapter C corporations. We provide for federal and state income taxes on our Subchapter C corporations, which are subject to entity level tax, and state income taxes on our limited liability companies, where applicable. As such, our effective tax rate can fluctuate from period to period depending on the mix of pre-tax income or loss between our limited liability companies and Subchapter C corporations.
Supplemental Pro Forma Results of Operations of AB Acquisition for the 28 Weeks Ended September 12, 2015 compared to the Pro Forma Results of Operations of AB Acquisition for the 28 Weeks Ended September 4, 2014
The following table and related discussion sets forth supplemental information and comparisons regarding the components of our pro forma condensed consolidated statements of operations for the 28 weeks ended September 12, 2015 and September 4, 2014, which include the pro forma results of operations for our 28-week periods then ended. The supplemental pro forma financial information was derived from the unaudited pro forma condensed consolidated financial information included elsewhere in this prospectus. The supplemental pro forma results of operations are provided for informational purposes only and are not necessarily indicative of the operating results that would have occurred if the acquisition of Safeway, related divestitures and the offering had been completed at the commencement of our first quarter of fiscal 2014. The unaudited pro forma condensed consolidated financial information also does not give effect to the potential impact of any future anticipated synergies, future operating efficiencies or cost savings that may result from the Safeway acquisition or any integration costs that do not have a continuing impact.
As of September 12, 2015, we operated 2,196 stores, and as of September 4, 2014, on a pro forma basis, we operated 2,233 stores.
| 28 weeks ended | ||||||||||||||||
| (Dollars in Millions) | ||||||||||||||||
| September 12, 2015 (Pro Forma) |
% of Sales | September 4, 2014 (Pro Forma) |
% of Sales | |||||||||||||
| Net sales and other revenue |
$ | 31,044.4 | 100.0 | % | $ | 30,396.2 | 100.0 | % | ||||||||
| Cost of sales |
22,684.0 | 73.1 | % | 22,396.5 | 73.7 | % | ||||||||||
|
|
|
|
|
|
|
|
|
|||||||||
| Gross profit |
8,360.4 | 26.9 | % | 7,999.7 | 26.3 | % | ||||||||||
| Selling and administrative expenses |
8,295.5 | 26.7 | % | 7,794.6 | 25.6 | % | ||||||||||
|
|
|
|
|
|
|
|
|
|||||||||
| Operating income |
64.9 | 0.2 | % | 205.1 | 0.7 | % | ||||||||||
| Interest expense |
460.8 | 1.5 | % | 447.7 | 1.5 | % | ||||||||||
| Other income, net |
(9.3 | ) | — | % | (31.3 | ) | (0.1 | )% | ||||||||
|
|
|
|
|
|
|
|
|
|||||||||
| Loss before income taxes |
(386.6 | ) | (1.3 | )% | (211.3 | ) | (0.7 | )% | ||||||||
| Income tax benefit |
(149.8 | ) | (0.5 | )% | (81.8 | ) | (0.3 | )% | ||||||||
|
|
|
|
|
|
|
|
|
|||||||||
| Net loss |
$ | (236.8 | ) | (0.8 | )% | $ | (129.5 | ) | (0.4 | )% | ||||||
|
|
|
|
|
|
|
|
|
|||||||||
82
Table of Contents
Identical Store Sales, Excluding Fuel
On a pro forma basis, identical store sales increased 4.4% during the 28 weeks ended September 12, 2015 compared to the 28 weeks ended September 4, 2014. The increase in pro forma identical store sales was driven by an increase of 2.6% in average ticket size and an increase of 1.8% in customer traffic. After adjusting for the positive sales impact in one of our divisions within NAI during the second quarter of fiscal 2014 resulting from a labor dispute at a competitor that caused a temporary closure of its stores, our estimated identical store sales growth for the 28 weeks ended September 12, 2015 would have been 4.7% on a pro forma combined basis.
Sales and Other Revenue
On a pro forma basis, sales and other revenue increased $648.2 million, or 2.1%, for the 28 weeks ended September 12, 2015 compared to the 28 weeks ended September 4, 2014. The increase was primarily attributable to a 4.4% increase in identical store sales, which drove an increase of $1.2 billion, partially offset by $565.4 million reduction in fuel sales. The reduction in fuel sales was the result of a decrease in retail fuel prices, reflecting the decrease in the product cost of fuel.
Gross Profit
On a pro forma basis, gross profit margin increased 60 basis points during the 28 weeks ended September 12, 2015 compared to the 28 weeks ended September 4, 2014. The increase was primarily attributable to higher fuel margins during the 28 weeks ended September 12, 2015 compared to the 28 weeks ended September 4, 2014. Excluding fuel, gross profit margin decreased 10 basis points compared to the prior year. The 10 basis point decrease was primarily attributable to higher shrink expense compared to the 28 weeks ended September 4, 2014. Shrink expense increased as Safeway increased its in-stock positions in order to increase customer traffic, as part of our implementation of our operating playbook.
Selling and Administrative Expense
On a pro forma basis, selling and administrative expenses as a percentage of sales increased by 110 basis points during the first 28 weeks ended September 12, 2015 compared to the 28 weeks ended September 4, 2014. The increase was primarily attributable to increases of $176.9 million primarily related to the transition and integration of the Safeway operations with our operations in addition to a $29.6 million non-cash write-off of a tax indemnification asset due to the reduction of a related estimated tax liability in the second quarter of fiscal 2015, $64.6 million in non-cash equity-based compensation expense and $39.4 million in losses on property dispositions primarily due to the additional loss of $41.1 million related to the FTC-mandated divestitures to Haggen. The increase in non-cash equity-based compensation was primarily the result of charges of $67.8 million for awards issued to members of management in the 28 weeks ended September 12, 2015 and a charge related to the modification of an award issued to an executive employee who transitioned to a non-employee consultant.
Interest Expense, Net
On a pro forma basis, interest expense, net was $460.8 million for the 28 weeks ended September 12, 2015 compared to $447.7 million for the 28 weeks ended September 4, 2014. Interest expense, net was substantially unchanged, reflecting similar average borrowings and average interest rates during the 28 weeks ended September 12, 2015.
83
Table of Contents
Other Income, Net
On a pro forma basis, other income, net, was $9.3 million during the 28 weeks ended September 12, 2015 compared to $31.3 million during the 28 weeks ended September 4, 2014. The decrease in other income, net for the 28 weeks ended September 12, 2015 was primarily driven by a foreign currency gain of Safeway during the 28 weeks ended September 4, 2014, compared to a foreign currency loss, which was offset by the gain from the change in fair value of the Casa Ley CVR, during the 28 weeks ended September 12, 2015.
Income Tax Benefit
On a pro forma basis, income tax was a benefit of $149.8 million for the 28 weeks ended September 12, 2015 and $81.8 million for the 28 weeks ended September 4, 2014, each reflecting a combined federal and state statutory tax rate of 38.7% to the pro forma pre-tax earnings of the company. As part of the IPO-Related Transactions, all of our operating subsidiaries will become subsidiaries of Albertsons Companies, Inc., and, as a result, all of our operations will be taxable as part of a consolidated group for federal and state income tax purposes.
Comparison of Fiscal Year 2014 to Fiscal Year 2013
Net Sales and Other Revenue
The company’s identical store sales increases for the past three fiscal years were as follows:
| Fiscal 2014 | Fiscal 2013 | Fiscal 2012 | ||||||||||
| Identical store sales increases |
7.2 | % | 1.6 | % | 1.9 | % | ||||||
Net sales and other revenue increased $7,143.9 million, or 35.6%, from $20,054.7 million in fiscal 2013 to $27,198.6 million in fiscal 2014. The components of the change in net sales and other revenue for fiscal 2014 were as follows (in millions):
| (dollars in millions) | ||||
| Net sales and other revenue for fiscal 2013 |
$ | 20,054.7 | ||
| Additional sales due to Safeway acquisition |
2,696.0 | |||
| Additional sales due to United acquisition |
1,439.9 | |||
| Identical store sales increase of 7.2% |
1,410.7 | |||
| Additional sales due to NAI acquisition |
1,357.0 | |||
| 53rd-week impact |
443.5 | |||
| Other(1) |
(203.2 | ) | ||
|
|
|
|||
| Net sales and other revenue for fiscal 2014 |
$ | 27,198.6 | ||
|
|
|
|||
| (1) | Primarily relates to changes in non-identical store sales and other revenue. |
Identical store sales increased $1,410.7 million, or 7.2%, primarily due to a 6.5% increase in customer traffic during fiscal 2014, as the stores we acquired in the NAI acquisition benefited from the implementation of our operating playbook including improving store layout and conditions, enhanced fresh, natural and organic offerings, improved levels of customer service and selected investment in price.
84
Table of Contents
Net sales and other revenue increased $16,342.7 million, or 440.3%, from $3,712.0 million in fiscal 2012 to $20,054.7 million in fiscal 2013. The components of the change in net sales and other revenue for fiscal 2013 were as follows (in millions):
| Net sales and other revenue for fiscal 2012 |
$ | 3,712.0 | ||
| Additional sales due to NAI acquisition |
16,071.0 | |||
| Additional sales due to United acquisition |
255.0 | |||
| Identical store sales increase of 1.6% |
56.0 | |||
| Other(1) |
(39.3 | ) | ||
|
|
|
|||
| Net sales and other revenue for fiscal 2013 |
$ | 20,054.7 | ||
|
|
|
| (1) | Primarily relates to changes in non-identical store sales and other revenue. |
Identical store sales also increased 1.6%. The stores acquired in the NAI acquisition experienced significant improvement during the second half of fiscal 2013, primarily driven by increased customer traffic.
Gross Profit
Gross profit represents the portion of net sales revenue remaining after deducting the cost of goods sold during the period, including purchase and distribution costs. These costs include inbound freight charges, purchasing and receiving costs, warehouse inspection costs, warehousing costs and other costs associated with our distribution network. Advertising and promotional expenses are also a component of cost of goods sold. Vendor allowances are classified as an element of cost of goods sold.
Our gross profit rate increased 70 basis points to 27.6% in fiscal 2014 from 26.9% in fiscal 2013, primarily driven by improvements in shrink and improved leverage of fixed warehouse cost over a larger store base. During fiscal 2013, we increased in-stock positions in fresh product to fully stock the stores we acquired from SuperValu to improve customer perception of the acquired stores in advance of increased customer traffic, resulting in higher shrink levels throughout fiscal 2013, especially in the first and second quarters of fiscal 2013. During fiscal 2014, customer traffic to our acquired stores increased resulting in reduced shrink levels as a result of increased turnover of products.
| Fiscal 2014 vs. Fiscal 2013 |
Basis point increase (decrease) |
|||
| Improvements in shrink |
46 | |||
| Warehouse cost |
33 | |||
| Lower advertising expense |
8 | |||
| Increased LIFO expense |
(10 | ) | ||
| Other |
(7 | ) | ||
|
|
|
|||
| Total |
70 | |||
|
|
|
|||
Our gross profit rate increased 160 basis points to 26.9% in fiscal 2013 from 25.3% in fiscal 2012, primarily driven by our entry into higher margin markets as a result of the NAI acquisition and improvement in merchandise pricing due to increased volume of purchasing. Both of these factors were driven by significant increases in our store portfolio resulting from the NAI acquisition.
85
Table of Contents
Selling and Administrative Expenses
Selling and administrative expenses consist primarily of store level costs, including wages, employee benefits, rent, depreciation and utilities, in addition to certain back-office expenses related to our corporate and division offices. Selling and administrative expenses increased 70 basis points to 30.0% of net sales and other revenue in fiscal 2014 from 29.3% in fiscal 2013.
| Fiscal 2014 vs. Fiscal 2013 |
Basis point increase (decrease) |
|||
| Non-cash equity-based compensation |
123 | |||
| Acquisition and integration costs (including the charge to terminate the long-term incentive plans) |
89 | |||
| Property dispositions, asset impairment and lease exit costs |
78 | |||
| Employee-related costs |
(88 | ) | ||
| Depreciation and amortization |
(68 | ) | ||
| Rent and occupancy |
(29 | ) | ||
| Legal and professional fees |
(18 | ) | ||
| Other |
(17 | ) | ||
|
|
|
|||
| Total |
70 | |||
|
|
|
|||
The Safeway acquisition resulted in additional non-cash equity-based compensation and increased acquisition and integration costs. In addition, the FTC-mandated divestitures resulted in increased impairment charges. These increases were offset by reductions in selling and administrative expense as a percentage of sales that were largely driven by increased sales from acquired stores and strong identical store sales.
Selling and administrative expenses increased 510 basis points to 29.3% of net sales and other revenue in fiscal 2013 from 24.2% in fiscal 2012:
| Fiscal 2013 vs. Fiscal 2012 |
Basis point increase (decrease) |
|||
| Depreciation and amortization |
266 | |||
| Employee-related costs |
155 | |||
| Acquisition and integration costs |
50 | |||
| Other |
39 | |||
|
|
|
|||
| Total |
510 | |||
|
|
|
|||
Selling and administrative expense increased 510 basis points primarily due to increased depreciation and amortization expense and increased employee-related costs. Depreciation and amortization expense increased in fiscal 2013 due to the recognition of the acquired properties and intangible assets at fair value as part of applying the acquisition method of accounting for the NAI acquisition. Employee-related costs increased as a percentage of net sales and other revenue reflecting higher labor rates in stores acquired in the NAI acquisition compared to our Legacy Albertsons Stores, together with additional investments in store labor to improve customer service in these acquired stores as part of our turnaround initiatives.
Interest Expense
Interest expense was $633.2 million in fiscal 2014, $390.1 million in fiscal 2013 and $7.2 million in fiscal 2012. Interest expense in fiscal 2014 increased as a result of an increase in total debt from
86
Table of Contents
$3,694.2 million in fiscal 2013 to $12,569.0 million in fiscal 2014. The increased debt level was primarily attributable to financing the Safeway acquisition and the assumption of $2,210.6 million of Safeway debt including capital lease obligations, net of $864.6 million of assumed debt that was immediately paid following the Safeway acquisition. The increase in interest expense in fiscal 2013, compared to fiscal 2012, resulted primarily from the assumption of debt and related financing of the NAI acquisition.
The following details our components of interest expense for the respective fiscal years (in millions):
| Fiscal 2014 | Fiscal 2013 | Fiscal 2012 | ||||||||||
| ABL facility, senior secured notes, term loans, notes and debentures |
$ | 454.1 | $ | 246.0 | $ | 2.8 | ||||||
| Capital lease obligations |
77.5 | 63.3 | 1.4 | |||||||||
| Loss on extinguishment of debt |
— | 49.1 | — | |||||||||
| Amortization and write off of deferred financing costs |
65.3 | 25.1 | 1.2 | |||||||||
| Amortization and write off of debt discount |
6.8 | 1.3 | — | |||||||||
| Other, net |
29.5 | 5.3 | 1.8 | |||||||||
|
|
|
|
|
|
|
|||||||
| Total interest expense, net |
$ | 633.2 | $ | 390.1 | $ | 7.2 | ||||||
|
|
|
|
|
|
|
|||||||
At February 28, 2015, the company had total debt, including capital lease obligations, outstanding of $12,569.0 million with a weighted average interest rate of 7.30%.
Other Expense, Net
For fiscal 2014, Other expense, net was $96.0 million, primarily driven by the loss on our deal-contingent interest rate swap. In April 2014, we entered into a deal-contingent interest rate swap to hedge against adverse fluctuations in the interest rate on anticipated variable rate debt planned to be incurred to finance the Safeway acquisition. Prior to the Safeway acquisition, the swap was treated as an economic hedge with changes in fair value recorded through earnings. Upon closing of the Safeway acquisition, the interest rate swap was designated as a cash flow hedge, with any subsequent changes in fair market value being marked to market through accumulated other comprehensive income. We did not have Other expense, net in fiscal 2013 or fiscal 2012.
Income Taxes
Income tax was a benefit of $153.4 million in fiscal 2014, $572.6 million in fiscal 2013 and immaterial in fiscal 2012. A substantial portion of the businesses and assets were held and operated by limited liability companies during these periods, which generally are not subject to entity-level federal or state income taxation. The income tax benefit of $153.4 million in fiscal 2014 is primarily driven by the tax benefits from the operating results of Safeway and NAI, both of which are subject to federal and state income taxes. This income tax benefit was reduced by nondeductible acquisition-related transaction costs and non-cash equity-based compensation. The income tax benefit of $572.6 million in fiscal 2013 is the result of the bargain purchase gain related to the NAI acquisition not being subject to income taxes; the effects of the accounting for income taxes related to the intercompany sale of the Albertsons banners from NAI to Albertson’s LLC immediately after the NAI acquisition; and the operating loss of NAI.
As part of the IPO-Related Transactions, all of our operating subsidiaries will become subsidiaries of Albertsons Companies, Inc., a Delaware corporation, and, as a result, all of our operations will be taxable as part of a consolidated group for federal and state income tax purposes. The consolidation of
87
Table of Contents
our operations will result in higher income taxes and an increase in income taxes paid. Pro forma income for fiscal 2014 reflects a combined federal and state statutory tax rate of 38.7%. See Note 3(b) to the “Unaudited Pro Forma Condensed Consolidated Financial Information.”
Operating Results Overview
Loss from continuing operations was $1,225.2 million in fiscal 2014, and income from continuing operations was $1,713.1 million in fiscal 2013, a decrease of $2,938.3 million. The decrease from fiscal 2013 was primarily attributable to the favorable impact of a bargain purchase gain of $2,005.7 million recognized in fiscal 2013 resulting from the NAI acquisition, the net decrease in fiscal 2014 in our income tax benefit over fiscal 2013 of $419.2 million and increased interest expense in fiscal 2014 of $243.1 million over fiscal 2013. Fiscal 2014 also included the impact of charges relating to non-cash equity-based compensation of $344.1 million, an increase in the net loss on property dispositions, asset impairment and lease exit costs of $230.1 million principally as a result of FTC-mandated divestitures in connection with the Safeway acquisition, a net loss on interest rate and commodity hedges of $98.2 million, a net increase from fiscal 2013 in acquisition and integration related costs of $178.5 million and a $78.0 million charge associated with the termination of the company’s long-term incentive plans.
Income from continuing operations was $1,713.1 million in fiscal 2013 and $29.8 million in fiscal 2012, an increase of $1,683.3 million. This increase was primarily attributable to the recognition of a bargain purchase gain of $2,005.7 million and income tax benefit of $572.6 million in fiscal 2013, partially offset by increased interest expense of $382.9 million in fiscal 2013 over fiscal 2012 and charges associated with store transition and related costs of $166.5 million and acquisition and integration costs of $173.5 million in fiscal 2013.
Adjusted EBITDA
Adjusted EBITDA is a non-GAAP operating financial measure that we define as earnings (net income (loss)) before interest, income taxes, depreciation and amortization, as further adjusted to eliminate the effects of items management does not consider in assessing ongoing performance. We believe that Adjusted EBITDA provides a meaningful representation of operating performance because it excludes the impact of items that could be considered “non-core” in nature. We use Adjusted EBITDA to measure overall performance and assess performance against peers. Adjusted EBITDA also provides useful information for our investors, securities analysts and other interested parties. Adjusted EBITDA is not a measure of performance under GAAP and should not be considered as a substitute for net earnings, cash flows from operating activities and other income or cash flow statement data. Our definition of Adjusted EBITDA may not be identical to similarly titled measures reported by other companies.
For the first 28 weeks of fiscal 2015, Adjusted EBITDA was $1,297.8 million, or 4.1% of sales, an increase of 180.9% compared to $462.0 million, or 3.6% of sales, for the first 28 weeks of fiscal 2014. The increase in Adjusted EBITDA for the first 28 weeks of fiscal 2015 reflects contributions from the Safeway acquisition as well as the improved operating performance of our Albertsons and NAI stores.
88
Table of Contents
The following is a reconciliation of Net loss to Adjusted EBITDA (in millions):
| 28 Weeks Ended | ||||||||
| September 12, 2015(1) | September 4, 2014 | |||||||
| Net loss |
$ | (323.0 | ) | $ | (186.7 | ) | ||
| Depreciation and amortization |
847.2 | 361.9 | ||||||
| Interest expense, net |
507.7 | 242.5 | ||||||
| Income tax benefit |
(87.4 | ) | (29.8 | ) | ||||
|
|
|
|
|
|||||
| EBITDA |
944.5 | 387.9 | ||||||
| Loss on interest rate and commodity hedges, net |
1.4 | 43.2 | ||||||
| Acquisition and integration costs(2) |
179.8 | 28.3 | ||||||
| Non-cash equity-based compensation expense |
67.8 | 3.6 | ||||||
| Net loss (gain) on property dispositions, asset impairment and lease exit costs(3) |
48.2 | (4.6 | ) | |||||
| LIFO expense |
10.8 | 18.7 | ||||||
| Facility closures and related transition costs(4) |
17.7 | — | ||||||
| Other(5) |
27.6 | (15.1 | ) | |||||
|
|
|
|
|
|||||
| Adjusted EBITDA |
$ | 1,297.8 | $ | 462.0 | ||||
|
|
|
|
|
|||||
| (1) | Includes results for the stores acquired in the Safeway acquisition. |
| (2) | Primarily includes costs related to acquisitions, integration of acquired businesses and adjustments to tax indemnification assets and liabilities and losses on acquired contingencies in connection with the Safeway acquisition. |
| (3) | Second quarter of fiscal 2015 includes additional losses of $41.1 million related to the Haggen divestitures and its related bankruptcy. |
| (4) | Includes costs related to facility closures and the transition to our decentralized operating model. |
| (5) | Primarily includes non-cash lease adjustments related to deferred rents and deferred gains on lease expenses related to closed stores. Also includes amortization of unfavorable leases on acquired Safeway surplus properties and non-cash pension and post-retirement expense, net. |
For fiscal 2014, Adjusted EBITDA was $1.1 billion, or 4.0% of sales, an increase of 87.5% compared to $585.9 million, or 2.9% of sales, for fiscal 2013. The increase in Adjusted EBITDA for fiscal 2014 reflects our improved operating performance as well as contributions from the Safeway and United acquisitions.
89
Table of Contents
Following is a reconciliation of GAAP Net (loss) income to Adjusted EBITDA (in millions) for each of fiscal 2014, fiscal 2013 and fiscal 2012:
| Fiscal 2014(1) | Fiscal 2013(2) | Fiscal 2012 | ||||||||||
| Net (loss) income |
$ | (1,225.2 | ) | $ | 1,732.6 | $ | 79.0 | |||||
| Depreciation and amortization |
718.1 | 676.4 | 16.9 | |||||||||
| Interest expense, net—continued operations |
633.2 | 390.1 | 7.2 | |||||||||
| Income tax (benefit) expense |
(153.4 | ) | (572.6 | ) | 1.7 | |||||||
| Interest expense—discontinued operations |
— | 3.9 | 0.8 | |||||||||
|
|
|
|
|
|
|
|||||||
| EBITDA |
$ | (27.3 | ) | $ | 2,230.4 | $ | 105.6 | |||||
| Bargain purchase gain |
— | (2,005.7 | ) | — | ||||||||
| Loss on interest rate and commodity swaps, net |
98.2 | — | — | |||||||||
| Store transition and related costs(3) |
— | 166.5 | — | |||||||||
| Acquisition and integration costs(4) |
352.0 | 173.5 | 7.1 | |||||||||
| Termination of long-term incentive plans |
78.0 | — | — | |||||||||
| Non-cash equity-based compensation expense |
344.1 | 6.2 | — | |||||||||
| Net loss (gain) on property dispositions, asset impairments and lease exit costs |
227.7 | (2.4 | ) | (45.6 | ) | |||||||
| LIFO expense |
43.1 | 11.6 | 2.1 | |||||||||
| Non-cash pension and postretirement expense(5) |
(3.0 | ) | (7.6 | ) | — | |||||||
| Other(6) |
(14.1 | ) | 13.4 | (4.2 | ) | |||||||
|
|
|
|
|
|
|
|||||||
| Adjusted EBITDA |
$ | 1,098.7 | $ | 585.9 | $ | 65.0 | ||||||
|
|
|
|
|
|
|
|||||||
| (1) | Includes results from four weeks for the stores purchased in the acquisition of Safeway on January 30, 2015. |
| (2) | Includes results from 48 weeks for the stores purchased in the acquisition of NAI on March 21, 2013 and eight weeks for the stores purchased in the acquisition of United on December 29, 2013. |
| (3) | Includes costs related to the transition of stores acquired in the NAI acquisition by improving store conditions and enhancing product offerings. |
| (4) | Includes costs related to the Safeway acquisition (including the charge associated with the settlement of appraisal rights litigation) and the NAI and United acquisitions. |
| (5) | Excludes the company’s one-time cash contribution of $260.0 million to the Safeway ERP under a settlement with the PBGC in connection with the closing of the Safeway acquisition. |
| (6) | Primarily includes non-cash lease adjustments related to deferred rents and deferred gains on leases, expenses related to closed stores and discontinued operations. |
90
Table of Contents
The following is a reconciliation of Cash Flow from Operating Activities to Free Cash Flow (in millions):
| 28 Weeks Ended | Fiscal 2014 |
Fiscal 2013 |
Fiscal 2012 |
|||||||||||||||||
| September 12, 2015 |
September 4, 2014 |
|||||||||||||||||||
| Cash flow provided by (used in) operating activities |
$ | 446.6 | $ | 209.1 | $ | (165.1 | ) | $ | 49.5 | $ | 32.5 | |||||||||
| Income tax (benefit) expense |
(87.4 | ) | (29.8 | ) | (153.4 | ) | (572.6 | ) | 1.7 | |||||||||||
| Deferred income taxes |
168.0 | 36.0 | 170.1 | 657.6 | — | |||||||||||||||
| Interest expense—continued operations |
507.7 | 242.5 | 633.2 | 390.1 | 7.2 | |||||||||||||||
| Interest expense—discontinued operations |
— | — | — | 3.9 | 0.8 | |||||||||||||||
| Changes in operating assets and liabilities |
68.2 | 37.7 | 39.3 | (202.1 | ) | 21.1 | ||||||||||||||
| Amortization and write-off of deferred financing costs |
(26.9 | ) | (37.7 | ) | (65.3 | ) | (25.1 | ) | (1.2 | ) | ||||||||||
| Loss on debt extinguishment |
— | — | — | (49.1 | ) | — | ||||||||||||||
| Store transition and related costs |
— | — | — | 166.5 | — | |||||||||||||||
| Acquisition and integration costs |
179.8 | 28.3 | 352.0 | 173.5 | 7.1 | |||||||||||||||
| Termination of long-term incentive plan |
— | — | 78.0 | — | — | |||||||||||||||
| Pension contribution in connection with Safeway acquisition |
— | — | 260.0 | — | — | |||||||||||||||
| Other adjustments |
41.8 | (24.1 | ) | (50.1 | ) | (6.3 | ) | (4.2 | ) | |||||||||||
|
|
|
|
|
|
|
|
|
|
|
|||||||||||
| Adjusted EBITDA |
1,297.8 | 462.0 | 1,098.7 | 585.9 | 65.0 | |||||||||||||||
| Less: capital expenditures |
(480.8 | ) | (150.8 | ) | (328.2 | ) | (128.2 | ) | (28.7 | ) | ||||||||||
|
|
|
|
|
|
|
|
|
|
|
|||||||||||
| Free cash flow |
$ | 817.0 | $ | 311.2 | $ | 770.5 | $ | 457.7 | $ | 36.3 | ||||||||||
|
|
|
|
|
|
|
|
|
|
|
|||||||||||
Liquidity and Financial Resources
Net Cash Provided By Operating Activities
Net cash provided by operating activities was $446.6 million for the first 28 weeks of fiscal 2015 compared to $209.1 million for the first 28 weeks of fiscal 2014. The increase in cash flow from operating activities was primarily due to improvements in operations of our Albertsons and NAI stores, additional contributions from the acquired Safeway stores and the receipt of income tax refunds of $91.6 million, primarily related to Safeway, partially offset by an increase of $249.5 million in interest paid.
Our net cash flow used in operating activities was $165.1 million in fiscal 2014 compared to net cash provided by operating activities of $49.5 million in fiscal 2013 and $32.5 million in fiscal 2012. Net cash flow used in operating activities increased by $214.6 million in fiscal 2014 compared to fiscal 2013. The increase was due to (i) our higher cash contributions to our pension and post-retirement benefits plans in fiscal 2014, primarily as a result of a $260.0 million contribution to the Safeway ERP under a settlement with the PBGC related to the Safeway acquisition, (ii) an increase in interest payments of $298.4 million due to the increased borrowings for acquisitions and (iii) an increase in payments for acquisition and integration costs related to the Safeway acquisition, offset by cash inflows related to improved operations and the additional Safeway operations. As a result of the $260.0 million cash contribution to the Safeway ERP, we do not expect to make additional contributions to the Safeway ERP until 2018.
Net cash flow provided by operating activities increased $17.0 million in fiscal 2013 compared to fiscal 2012 primarily due to cash inflows related to the expansion of our operations from the NAI and United acquisitions, partially offset by an increase in interest payments of $278.0 million and increases in acquisition and integration costs.
91
Table of Contents
Net Cash (Used In) Provided By Investing Activities
Net cash used in investing activities was $172.1 million for the first 28 weeks of fiscal 2015 primarily due to the merger consideration paid related to the Safeway acquisition appraisal settlement and capital expenditures, partially offset by proceeds from the divestiture of 168 stores as required by the FTC in connection with the Safeway acquisition and a net decrease in restricted cash of $191.8 million as a result of a $255.7 million decrease due to certain collateral requirements being eliminated, offset by an increase of $63.9 million of cash held in escrow for the A&P Transaction. For the 28 weeks ended September 4, 2014, we incurred a net use of cash of $807.3 million primarily due to an increase in restricted cash related to the debt issued to fund the Safeway acquisition and capital expenditures, partially offset by proceeds from the sale of assets.
Net cash flow used in investing activities was $5,945.0 million in fiscal 2014, consisting primarily of cash paid for the Safeway acquisition, net of cash acquired, of $5,673.4 million and cash paid for property additions of $328.2 million. Net cash flow used in investing activities was $781.5 million in fiscal 2013, consisting primarily of cash paid for the acquisition of NAI and United, net of cash acquired, of $463.9 million, cash paid for property additions of $128.2 million and changes in restricted cash of $246.0 million related to collateralized surety bonds and letters of credit obtained during fiscal 2013. Net cash flow provided by investing activities was $20.8 million in fiscal 2012, primarily consisting of proceeds of the sale of assets of $45.2 million, partially offset by cash paid for property additions of $28.7 million.
In fiscal 2015, the company expects to spend approximately $1,150.0 million in capital expenditures, including $300.0 million of expected initial Safeway-related integration-related capital expenditures, excluding approximately $126 million of expected initial opening and transition costs, capital expenditures, and investments in price and labor that we expect to spend by the end of fiscal 2016 related to the A&P Transaction, and excluding approximately $47 million of initial opening and transition costs and capital expenditures that we expect to spend by the end of fiscal 2016 to replace equipment and stock the 29 stores being acquired from Haggen, as follows (in millions):
| Projected Fiscal 2015 Capital Expenditures |
||||
| IT |
$ | 300.0 | ||
| Supply chain |
200.0 | |||
| Maintenance |
240.0 | |||
| New stores and remodels |
180.0 | |||
| Real estate and expansion capital |
200.0 | |||
| Other |
30.0 | |||
|
|
|
|||
| Total |
$ | 1,150.0 | ||
|
|
|
Net Cash (Used In) Provided By Financing Activities
Net cash used in financing activities was $622.6 million for the first 28 weeks of fiscal 2015, primarily due to payments on our ABL borrowings from proceeds of divestitures. For the first 28 weeks of fiscal 2014, net cash provided by financing activities was $1,249.7 million, primarily due to borrowings to fund the Safeway acquisition, partially offset by payments on long-term borrowings.
Net cash flow provided by financing activities was $6,928.9 million in fiscal 2014 and $1,002.0 million in fiscal 2013. Cash used in financing activities was $77.6 million in fiscal 2012. Net cash provided by financing activities increased in fiscal 2014 compared to fiscal 2013, primarily as a result of proceeds from the issuance of long-term debt and equity contributions used to finance the Safeway acquisition. Net cash provided by financing activities increased in fiscal 2013 compared to fiscal 2012, primarily as a result of proceeds from the issuance of long-term debt and equity contributions used to finance the NAI and United acquisitions.
92
Table of Contents
Proceeds from the issuance of long-term debt were $8,097.0 million in fiscal 2014, $2,485.0 million in fiscal 2013 and $55.0 million in fiscal 2012. In fiscal 2014, cash payments on long-term borrowings were $2,123.6 million, including $864.6 million of assumed debt that was immediately paid following the Safeway acquisition. In fiscal 2014, cash payments for debt financing costs were $229.1 million and cash payments on obligations under capital leases were $64.1 million. In fiscal 2013, cash payments on long-term borrowings were $923.3 million, cash payments on debt financing costs were $121.0 million and cash payments under capital leases were $24.5 million. In addition, we repurchased $619.9 million of debt under tender offers in fiscal 2013. In fiscal 2012, net cash payments on long-term borrowings were $75.0 million.
Proceeds from equity contributions were $1,283.2 million in fiscal 2014 and $250.0 million in fiscal 2013. There were no equity contributions in fiscal 2012. In addition, we made distributions to our equityholders of $34.5 million in fiscal 2014 and $50.0 million in fiscal 2012. There were no distributions in fiscal 2013.
Debt Management
Total debt, including both the current- and long-term portions of capital lease obligations, increased by $8.9 billion to $12.6 billion as of the end of fiscal 2014 compared to $3.7 billion as of the end of fiscal 2013. The increase in fiscal 2014 was primarily the result of the financing for the Safeway acquisition and the assumption of Safeway debt. In anticipation of the closing of the Safeway acquisition, we secured term-loan financing of $5.7 billion with interest rates ranging from 4.75% to 5.5% and completed the sale of $1,145.0 million of 7.750% second lien notes, of which $535.4 million was subsequently redeemed on February 9, 2015. We assumed notes and debentures with a fair value of $2.5 billion from Safeway and subsequently redeemed $864.6 million of the Safeway debt pursuant to change of control tender offers. We also increased the borrowings under our asset-based revolving credit agreements by approximately $800 million.
Outstanding debt, including current maturities and net of debt discounts and deferred financing costs, as of February 28, 2015 principally consists of (in millions):
| Term loans |
$ | 6,899.9 | ||
| Notes and debentures |
3,534.9 | |||
| Capital leases |
974.7 | |||
| ABL borrowings |
980.0 | |||
| Other notes payable and mortgages |
179.5 | |||
|
|
|
|||
| Total debt, including capital leases |
$ | 12,569.0 | ||
|
|
|
Total debt, including both the current and long-term portions of capital lease obligations, increased by $3.6 billion to $3.7 billion as of the end of fiscal 2013 compared to the end of fiscal 2012. This increase was primarily the result of the NAI acquisition and United acquisition and related financing. We assumed debt with a fair value of $2.6 billion as a result of the NAI acquisition and subsequently redeemed $592.0 million of the assumed debt. We also secured term loan financing of $1.2 billion in connection with the NAI acquisition and subsequently increased the borrowings under the term loan financing by $300 million to finance the United acquisition.
During the first 28 weeks of fiscal 2015 we used the proceeds from the FTC-required divestitures to reduce outstanding borrowings under the ABS/Safeway ABL Facility and the ABS/Safeway Term Loan Facilities.
On November 10, 2015, NAI entered into an amendment to the NAI Term Loan Agreement and borrowed an additional $300 million thereunder, the proceeds of which were to fund the A&P Transaction.
93
Table of Contents
See Note 8—Long-Term Debt in our consolidated financial statements, included elsewhere in this prospectus, for additional information related to our outstanding debt.
Anticipated Refinancing
We have had preliminary discussions with potential lenders, financial intermediaries and advisors and following the consummation of this offering, subject to market conditions, we intend to enter into new financing facilities, consisting of a new $4,000 million senior secured ABL facility, a new senior secured term loan facility (which we expect to be in the form of an amended and restated version of the existing ABS/Safeway Term Loan Agreement), and new senior unsecured notes. If we are able to enter into the New Financing Facilities, we may use the proceeds thereof to repay all amounts outstanding under, and to terminate, the existing ABS/Safeway ABL Agreement, the NAI ABL Agreement, the Letter of Credit Facility Agreement and all amounts under the ABS/Safeway Term Loan Agreement. This offering is not contingent upon our entering into the New Financing Facilities, and there can be no assurance that we will enter into the New Financing Facilities and terminate the Specified Existing Facilities following the consummation of this offering, or at all, and we may elect not to proceed with the Anticipated Refinancing. See “Description of Indebtedness—Anticipated Refinancing Facilities” and “Risk Factors—Risks Relating to Our Indebtedness—We may be unable to complete the Anticipated Refinancing, or we may decide not to pursue the Anticipated Refinancing.”
Liquidity and Factors Affecting Liquidity
We estimate our liquidity needs over the next fiscal year to be approximately $5.0 billion, which includes anticipated requirements for working capital, capital expenditures, interest payments and scheduled principal payments of debt, operating leases, capital leases and our TSA agreements with SuperValu. Based on current operating trends, we believe that cash flows from operating activities and other sources of liquidity, including borrowings under our asset-based revolving credit facilities, will be adequate to meet our liquidity needs for the next 12 months and for the foreseeable future. We believe we have adequate cash flow to continue to maintain our current debt ratings and to respond effectively to competitive conditions. There can be no assurance, however, that our business will continue to generate cash flow at or above current levels or that we will maintain our ability to borrow under our revolving credit facilities. See “—Contractual Obligations” for a more detailed description of our commitments as of the end of fiscal 2014.
As of September 12, 2015, we had approximately $481.0 million of borrowings outstanding under our asset-based revolving credit facilities and total availability of $2.4 billion (net of letter of credit usage). As of February 28, 2015, we had approximately $980.0 million of borrowings outstanding under our asset-based revolving credit facilities and total availability of approximately $1.8 billion (net of letter of credit usage).
The ABS/Safeway ABL Facility contains no financial covenants unless and until (i) an event of default under the ABS/Safeway ABL Facility has occurred and is continuing or (ii) the failure of Albertsons to maintain excess availability of at least 10.0% of the aggregate commitments at any time or (iii) excess availability is less than $200.0 million. If any such events occur, then Albertsons is required to maintain a fixed-charge coverage ratio of 1.0 to 1.0 until such event of default is cured or waived or the 30th day after the other trigger event ceases to exist.
The NAI ABL Facility contains no covenants unless and until (i) an event of default under the NAI ABL Facility has occurred and is continuing or (ii) the failure of NAI to maintain excess availability of at least 10.0% of the aggregate commitments at any time. If any of such events occur, NAI is required to maintain a fixed-charge coverage ratio of 1.0 to 1.0 until such event of default is cured or waived or the 30th day after the other trigger event ceases to exist.
94
Table of Contents
During fiscal 2014 and the first and second quarters of fiscal 2015, there were no financial covenants in effect under our asset-based revolving credit facilities because the conditions listed above had not been met.
Contractual Obligations
The table below presents our significant contractual obligations as of February 28, 2015 (in millions)(1):
| Payments Due Per Fiscal Year | ||||||||||||||||||||
| Total | 2015 | 2016-2017 | 2018-2019 | Thereafter | ||||||||||||||||
| Long-term debt(2) |
$ | 12,158.5 | $ | 503.4 | $ | 541.4 | $ | 2,505.6 | $ | 8,608.1 | ||||||||||
| Interest on long-term debt(3) |
5,579.5 | 675.0 | 1,323.4 | 1,183.9 | 2,397.2 | |||||||||||||||
| Operating leases(4) |
5,896.7 | 735.7 | 1,308.8 | 994.0 | 2,858.2 | |||||||||||||||
| Capital leases(4) |
1,508.3 | 202.2 | 363.6 | 273.0 | 669.5 | |||||||||||||||
| SVU TSAs(5) |
304.6 | 182.1 | 109.9 | 12.6 | — | |||||||||||||||
| Purchase obligations(6) |
1,839.6 | 1,407.2 | 432.4 | — | — | |||||||||||||||
| Other long-term liabilities(7) |
1,545.1 | 365.8 | 445.8 | 219.8 | 513.7 | |||||||||||||||
|
|
|
|
|
|
|
|
|
|
|
|||||||||||
| Total contractual obligations |
$ | 28,832.3 | $ | 4,071.4 | $ | 4,525.3 | $ | 5,188.9 | $ | 15,046.7 | ||||||||||
|
|
|
|
|
|
|
|
|
|
|
|||||||||||
| (1) | Excludes the estimated multiemployer pension plan withdrawal liability which was assumed as part of the Safeway acquisition in connection with Safeway’s closure of its Dominick’s division and contributions under various multiemployer pension plans which totaled $113.4 million in fiscal 2014. In fiscal 2015, we expect to contribute approximately $370.0 million to multiemployer pension plans, subject to collective bargaining conditions, exclusive of additional amounts we may be required to contribute relating to A&P. This table also excludes unrecognized tax benefits because a reasonably reliable estimate of the timing of future pension contributions and tax settlements cannot be determined. |
| (2) | Long-term debt amounts include asset-backed loans and exclude any debt discounts and deferred financing costs. See Note 8—Long-Term Debt in our consolidated financial statements, included elsewhere in this prospectus, for additional information. |
| (3) | Amounts include contractual interest payments using the interest rate as of February 28, 2015 applicable to our variable interest term debt instruments and stated fixed rates for all other debt instruments. See Note 8—Long-Term Debt in our consolidated financial statements, included elsewhere in this prospectus, for additional information. |
| (4) | Represents the minimum rents payable under operating and capital leases, excluding common area maintenance, insurance or tax payments, for which the company is also obligated. |
| (5) | Represents minimum contractual commitments expected to be paid under the SVU TSAs and the related amendment, executed on April 16, 2015. See Note 15—Related Parties in our consolidated financial statements, included elsewhere in this prospectus, for additional information. |
| (6) | Purchase obligations include various obligations that have annual purchase commitments. As of February 28, 2015, future purchase obligations primarily relate to fixed asset and information technology commitments. In addition, in the ordinary course of business, the company enters into supply contracts to purchase product for resale to consumers which are typically of a short-term nature with limited or no purchase commitments. The company also enters into supply contracts which typically include either volume commitments or fixed expiration dates, termination provisions and other customary contractual considerations. The supply contracts that are cancelable have not been included above. |
| (7) | Includes estimated self-insurance liabilities, which have not been reduced by insurance-related receivables, and fixed-price energy contracts. See Note 1—Description of Business, Basis of Presentation and Summary of Significant Accounting Policies in our consolidated financial statements, included elsewhere in this prospectus, for additional information. |
95
Table of Contents
Off-Balance Sheet Arrangements
Guarantees
The company is party to a variety of contractual agreements pursuant to which it may be obligated to indemnify the other party for certain matters. These contracts primarily relate to the company’s commercial contracts, operating leases and other real estate contracts, trademarks, intellectual property, financial agreements and various other agreements. Under these agreements, the company may provide certain routine indemnifications relating to representations and warranties (for example, ownership of assets, environmental or tax indemnifications) or personal injury matters. The terms of these indemnifications range in duration and may not be explicitly defined. The company believes that if it were to incur a loss in any of these matters, the loss would not have a material effect on the company’s financial statements.
Letters of Credit
The company had letters of credit of $637.2 million outstanding as of September 12, 2015. The letters of credit are maintained primarily to support performance, payment, deposit or surety obligations of the company. The company pays fees ranging from the London Interbank Offered Rate (“LIBOR”) plus 1.5% to LIBOR plus 3.0% plus a fronting fee of 0.125% on the face amount of the letters of credit.
New Accounting Policies Not Yet Adopted
See Note 1—Description of Business, Basis of Presentation and Summary of Significant Accounting Policies in our consolidated financial statements, included elsewhere in this prospectus, for new accounting pronouncements which have not yet been adopted.
Critical Accounting Policies and Estimates
The preparation of consolidated financial statements in conformity with GAAP requires management to make estimates and assumptions that affect the reported amounts of assets and liabilities and disclosure of contingent assets and liabilities as of the date of the consolidated financial statements and the reported amounts of revenues and expenses during the reporting period. Actual results could differ from those estimates.
We have chosen accounting policies that we believe are appropriate to report accurately and fairly our operating results and financial position, and we apply those accounting policies in a fair and consistent manner. See Note 1—Description of Business, Basis of Presentation and Summary of Significant Accounting Policies in our consolidated financial statements, included elsewhere in this prospectus, for a discussion of our significant accounting policies.
Management believes the following critical accounting policies reflect its more subjective or complex judgments and estimates used in the preparation of our consolidated financial statements.
Vendor Allowances
Consistent with standard practices in the retail industry, we receive allowances from many of the vendors whose products we buy for resale in our stores. These vendor allowances are provided to increase the sell-through of the related products. We receive vendor allowances for a variety of merchandising activities: placement of the vendors’ products in our advertising; display of the vendors’ products in prominent locations in our stores; supporting the introduction of new products into our retail stores and distribution systems; exclusivity rights in certain categories; and to compensate for
96
Table of Contents
temporary price reductions offered to customers on products held for sale at retail stores. We also receive vendor allowances for buying activities such as credits for purchasing products in advance of their need and cash discounts for the early payment of merchandise purchases. The majority of the vendor allowance contracts have terms of less than one year.
We recognize vendor allowances for merchandising activities as a reduction of cost of sales when the related products are sold. Vendor allowances that have been earned because of completing the required performance under the terms of the underlying agreements but for which the product has not yet been sold are recognized as reductions of inventory. The amount and timing of recognition of vendor allowances as well as the amount of vendor allowances to be recognized as a reduction of ending inventory requires management judgment and estimates. We determine these amounts based on estimates of current-year purchase volume using forecast and historical data and a review of average inventory turnover data. These judgments and estimates affect our reported gross profit, operating earnings (loss) and inventory amounts. Our historical estimates have been reliable in the past, and we believe the methodology will continue to be reliable in the future. Based on previous experience, we do not expect significant changes in the level of vendor support.
Self-Insurance Liabilities
We are primarily self-insured for workers’ compensation and general and automobile liability. The self-insurance liability is undiscounted and determined actuarially, based on claims filed and an estimate of claims incurred but not yet reported. We have established third-party coverage that limits our further exposure after a claim reaches the designated stop-loss threshold. In determining our self-insurance liabilities, we continually review our overall position and reserving techniques. Because recorded amounts are based on estimates, the ultimate cost of all incurred claims and related expenses may be more or less than the recorded liabilities.
Any actuarial projection of self-insured losses is subject to a high degree of variability. Litigation trends, legal interpretations, benefit level changes, claim settlement patterns and similar factors influenced historical development trends that were used to determine the current-year expense and, therefore, contributed to the variability in the annual expense. However, these factors are not direct inputs into the actuarial projection, and thus their individual impact cannot be quantified.
Long-Lived Asset Impairment
We regularly review our individual stores’ operating performance for indications of impairment. We also regularly review our distribution centers, manufacturing and intangible assets with finite lives. When events or changes in circumstances indicate that the carrying value of an asset group may not be recoverable, its future undiscounted cash flows are compared to the carrying value. If the carrying value of the asset group to be held and used is greater than the future undiscounted cash flows, an impairment loss is recognized to record the asset group at fair value. For property and equipment held for sale, we recognize impairment charges for the excess of the carrying value plus estimated costs of disposal over the fair value. Fair values are based on discounted cash flows or current market rates. These estimates of fair value can be significantly impacted by factors such as changes in the current economic environment and real estate market conditions.
On December 19, 2014, in connection with the Safeway acquisition, we, together with Safeway, announced that we had entered into agreements to sell 111 Albertsons and 57 Safeway stores across eight states to four separate buyers. The divestiture of these stores was required by the FTC as a condition of closing the Safeway acquisition and was contingent on the closing of the Safeway acquisition. As a result, we recorded an impairment loss on the Albertsons’ stores of $233.4 million during fiscal 2014.
97
Table of Contents
Business Combination Measurements
In accordance with ASC 805, Business Combinations, we estimate the fair value of acquired assets and assumed liabilities as of the acquisition date of business combinations. These fair value adjustments are input into the calculation of goodwill or bargain purchase gain.
The fair value of assets acquired and liabilities assumed are determined using market, income and cost approaches from the perspective of a market participant. The fair value measurements can be based on significant inputs that are not readily observable in the market. The market approach indicates value for a subject asset based on available market pricing for comparable assets. The market approach used includes prices and other relevant information generated by market transactions involving comparable assets, as well as pricing guides and other sources. The income approach indicates value for a subject asset based on the present value of cash flows projected to be generated by the asset. Projected cash flows are discounted at a required market rate of return that reflects the relative risk of achieving the cash flows and the time value of money. The cost approach, which estimates value by determining the current cost of replacing an asset with another of equivalent economic utility, was used, as appropriate, for certain assets for which the market and income approaches could not be applied due to the nature of the asset. The cost to replace a given asset reflects the estimated reproduction or replacement cost for the asset, adjusted for obsolescence, whether physical, functional or economic.
Goodwill
As of February 28, 2015, our goodwill totaled $1.0 billion, of which $942.3 million was recorded as part of our recent acquisition of Safeway. We review goodwill for impairment in the fourth quarter of each year, and also upon the occurrence of triggering events. We perform reviews of each of our reporting units that have goodwill balances. Fair value is determined using a multiple of earnings, or discounted projected future cash flows, and we compare fair value to the carrying value of a reporting unit for purposes of identifying potential impairment. We base projected future cash flows on management’s knowledge of the current operating environment and expectations for the future. If we identify potential for impairment, we measure the fair value of a reporting unit against the fair value of its underlying assets and liabilities, excluding goodwill, to estimate an implied fair value of the reporting unit’s goodwill. We recognize goodwill impairment for any excess of the carrying value of the reporting unit’s goodwill over the implied fair value. The impairment review requires the use of management judgment and financial estimates. Application of alternative estimates and assumptions, such as reviewing goodwill for impairment at a different level, could produce significantly different results. The cash flow projections embedded in our goodwill impairment reviews can be affected by several factors such as inflation, business valuations in the market, the economy and market competition.
The annual evaluation of goodwill performed for our reporting units during the fourth quarters of fiscal 2014, fiscal 2013 and fiscal 2012 did not result in impairment. Based on current and future expected cash flows, we believe goodwill impairments are not reasonably likely.
Equity-Based Compensation
We periodically grant membership interests to employees and non-employees in exchange for services. The membership interests we grant to employees are not traditional stock options or stock awards, but are equity interests in a privately held company that participate in earnings, subject to certain distribution thresholds. We account for these as equity-based awards in accordance with the applicable accounting guidance for equity awards issued to employees and non-employees, respectively. To value these awards, the company has determined that an option pricing model is the most appropriate method to measure the fair value of these awards.
In March 2013, we granted 103 Class C Units (2,641,428 Class C Units following a 25,598 for 1 split in January 2015) (the “Class C Units”) to certain key executives under the company’s Class C
98
Table of Contents
Incentive Unit Plan (the “Class C Plan”). Class C Units were accounted for as equity awards to employees in accordance with Accounting Standards Codification 718, Compensation—Stock Compensation (“ASC 718”). The fair value of these grants was based on the grant date fair value, which was based on the enterprise valuation at the date of grant and the residual cash flows distributed to Class C Unit holders after hurdles are met as defined in the limited liability company agreement of AB Acquisition. The fair value of the Class C Units was calculated using an assumed and expected term of three years and no forfeiture rate given the low likelihood that the recipients’ would discontinue working for the company.
The Class C Units granted were valued at $7.70 per unit with a $20.3 million aggregate fair value. Factors contributing to the March 2013 fair value included the acquisition of NAI, which significantly expanded the company’s operations, but whose store performance and expected synergies had not yet been proven.
In January 2015, we granted the following equity awards to employees and non-employees:
| • | 3,350,083 Series 1 Incentive Units (as defined herein) to a member of management under the Incentive Unit Plan, with an additional 16,750,420 authorized and reserved for future issuance. 50% of the Series 1 Incentive Units have a service vesting period of four years from the date awarded and vest 25% on each of the subsequent four anniversaries of such date. The remaining 50% have performance-based vesting terms, which vest 25% on the last day of the company’s fiscal year for each of the following four fiscal years, subject to specific performance targets. The units accelerate upon a qualifying change of control. |
| • | 3,350,084 fully vested, non-forfeitable Investor Incentive Units in exchange for services. The units convert into an equal number of ABS Units, NAI Units and Safeway Units based on the fair market value of the Investor Incentive Units on the conversion date after five years or upon a qualifying change of control. |
| • | 11,557,787 fully vested, non-forfeitable Investor Incentive Units to five institutional investors. The units granted and issued to our institutional investors were treated as non-employee compensation for merger consulting services and direct equity issuance costs related to the Safeway acquisition. The units vest immediately and convert into an equal number of ABS Units, NAI Units and Safeway Units based on the fair market value of the Investor Incentive Units on the conversion date after five years or upon a qualifying change of control. |
In the first quarter of fiscal 2015, we issued the following equity awards to employees and non-employees:
| • | 11,465,000 Phantom Units (as defined herein) to employees and directors of the company. Each Phantom Unit provides the participant with a contractual right to receive upon vesting one Incentive Unit under the terms and conditions of the Incentive Unit Plan. Generally, fifty percent of the Phantom Units are Time-Based Units that will vest in four annual installments of 25% on the last day of the company’s fiscal year, commencing with the last day of the fiscal year in which the units are granted, subject to continued service through each vesting date. The remaining 50% of the Phantom Units are Performance-Based Units that will vest in four annual installments of 25% on the last day of the company’s fiscal year, commencing with the last day of the fiscal year in which the units are granted, subject to continued service through each vesting date, and will also be subject to the achievement of annual performance targets established for each such fiscal year. Upon the consummation of an IPO, the unvested Phantom Units that are Performance-Based Units will convert into Phantom Units that are solely Time-Based Units. Following the consummation of the IPO-Related Transactions and this offering, all unvested Phantom Units will accelerate and become vested in the event of the termination of the participant’s employment due to death or disability or by the company without cause. |
There were no material amounts of awards issued during the second quarter of fiscal 2015.
99
Table of Contents
We determine fair value of unvested and issued awards on the grant date using an option pricing model, adjusted for a lack of marketability and using an expected term or time to liquidity based on judgments made by management. We also consider forfeitures for equity-based grants which are not expected to vest. Expected volatility is calculated based upon historical volatility data from a group of comparable companies over a time frame consistent with the expected life of the awards. The expected risk-free rate is based on the U.S. Treasury yield curve rates in effect at the time of the grant using the term most consistent with the expected life of the award. Dividend yield was estimated at zero as we do not anticipate making regular future distributions to stockholders. Changes in these inputs and assumptions can materially affect the measurement of the estimated fair value of our equity-based compensation expense.
We are required to estimate the enterprise value underlying our equity-based awards when performing fair value calculations. Due to the prior absence of a market for our equity interests, enterprise value is determined by management with the assistance of valuation specialists. The most recent valuation was performed as of January 2015 and uses a Market and Income approach weighted at 50% each. The Market Approach uses the Guideline Public Company Method, which focuses on comparing the subject entity to selected reasonably similar (or guideline) publicly traded companies. Under this method, valuation multiples are: (i) derived from the operating data of selected guideline companies; (ii) evaluated and adjusted based on the strengths and weaknesses of the subject entity relative to the selected guideline companies; and (iii) applied to the operating data of the subject entity to arrive at an indication of value. The Income Approach utilized the Discounted Cash Flow (“DCF”) Method. The DCF Method measures the value of the enterprise by estimating the present worth of the net economic benefit (cash receipts less cash outlays) to be received over the life of the company. The steps followed in applying this approach include estimating the expected after-tax cash flows attributable to the company over its life and discounts the cash flows using a rate of return that accounts for both the time value of money and investment risk factors. Management utilized future projections discounted using a present value factor of 9% and a long-term terminal growth rate of 2.4%. Grants subsequent to our initial public offering will be based on the trading value of our common stock.
The Series 1 Incentive Units and Investor Incentive Units granted in January 2015 were valued at $22.11 per unit with a $403.7 million aggregate fair value. Factors contributing to the January 2015 fair value included the significant improvement of the stores acquired as part of the NAI acquisition in 2013 and realization of operational synergies, the acquisition of United and the acquisition of Safeway, as well as market valuations of comparable publicly traded grocers, and general capital market conditions in the U.S.
The Phantom Units granted in the first quarter of fiscal 2015 were valued at $21.82 per unit with a $250.2 million aggregate fair value. The per unit fair value of the March 2015 unit grants approximated the January 2015 unit grants.
The following assumptions were used for the January and March 2015 equity awards issued and granted:
| First Quarter 2015 | Fiscal 2014 | |||||||
| Valuation Date |
March 2015 | January 2015 | ||||||
| Dividend yield |
0.0% | 0.0% | ||||||
| Expected volatility |
41.7% | 42.4% | ||||||
| Risk free interest rate |
0.6% | 0.47% | ||||||
| Expected term, in years |
1.9 years | 2.0 years | ||||||
| Discount for lack of marketability |
16.0% | 16.0% | ||||||
100
Table of Contents
Employee Benefit Plans and Collective Bargaining Agreements
Substantially all of our employees are covered by various contributory and non-contributory pension, profit sharing or 401(k) plans, in addition to a dedicated defined benefit plan for Safeway, a plan for NAI and a plan for United employees. Certain employees participate in a long-term retention incentive bonus plan. We also provide certain health and welfare benefits, including short-term and long-term disability benefits to inactive disabled employees prior to retirement. Most union employees participate in multiemployer retirement plans under collective bargaining agreements, unless the collective bargaining agreement provides for participation in plans sponsored by us.
We recognize a liability for the under-funded status of the defined benefit plans as a component of pension and post-retirement benefit obligations. Actuarial gains or losses and prior service costs or credits are recorded within Other comprehensive income (loss). The determination of our obligation and related expense for our sponsored pensions and other post-retirement benefits is dependent, in part, on management’s selection of certain actuarial assumptions in calculating these amounts. These assumptions include, among other things, the discount rate and expected long-term rate of return on plan assets.
The objective of our discount rate assumptions was intended to reflect the rates at which the pension benefits could be effectively settled. In making this determination, we take into account the timing and amount of benefits that would be available under the plans. Our methodology for selecting the discount rates was to match the plans’ cash flows to that of a hypothetical bond portfolio whose cash flows from coupons and maturities match the plans’ projected benefit cash flows. The discount rates are the single rates that produce the same present value of cash flows. We utilized weighted discount rates of 3.75% and 4.62% for our pension plan expenses for fiscal 2014 and fiscal 2013, respectively. To determine the expected rate of return on pension plan assets held by us for fiscal 2014, we considered current and forecasted plan asset allocations as well as historical and forecasted rates of return on various asset categories. Our weighted assumed pension plan investment rate of return was 6.97% for fiscal 2014 and 7.17% for fiscal 2013. See Note 14—Employee Benefit Plans and Collective Bargaining Agreements in our consolidated financial statements, included elsewhere in this prospectus, for more information on the asset allocations of pension plan assets.
Sensitivity to changes in the major assumptions used in the calculation of our pension and other post-retirement plan liabilities is illustrated below (in millions).
| Percentage Point Change |
Project Benefit Obligation Decrease / (Increase) |
Expense Decrease / (Increase) |
||||||||
| Discount rate |
+/- 1.00 | % | $336.0 / $(427.8) | $ | 7.8 / $(1.9) | |||||
| Expected return on assets |
+/- 1.00 | % | — / — | $ | 4.4 / $(4.4) | |||||
Safeway’s pension and post-retirement plans’ results were only included for the last four weeks of fiscal 2015 that followed the acquisition date. If the impact of a full year of Safeway’s results were included in the sensitivity table above, the results would be more significant. A 1% increase in discount rate would decrease pension expense by $12.3 million and a 1% decrease in discount rate would increase pension expense by $6.2 million. Additionally, a 1% increase in expected return on plan assets would decrease pension expense by $20.4 million and a 1% decrease in expected return on plan assets would increase pension expense by $20.3 million.
In the fourth quarter of fiscal 2014, we contributed $260.0 million to the Safeway ERP under a settlement with the PBGC in connection with the Safeway acquisition closing.
101
Table of Contents
Multiemployer Pension Plans
We contribute to various multiemployer pension plans. In conjunction with the Safeway acquisition, we assumed a multiemployer pension withdrawal liability in connection with Safeway’s closure of its Dominick’s division. These multiemployer plans generally provide retirement benefits to participants based on their service to contributing employers. The benefits are paid from assets held in trust for that purpose. Plan trustees typically are responsible for determining the level of benefits to be provided to participants as well as the investment of the assets and plan administration. Expense is recognized in connection with these plans as contributions are funded. We made contributions to these plans of $113.4 million, $74.2 million and $33.1 million in fiscal 2014, fiscal 2013 and fiscal 2012, respectively. In fiscal 2015, we expect to contribute approximately $370.0 million to multiemployer pension plans, subject to collective bargaining conditions, exclusive of additional amounts we may be required to contribute relating to A&P.
See Note 14—Employee Benefit Plans and Collective Bargaining Agreements in our consolidated financial statements, included elsewhere in this prospectus, for more information relating to our participation in these multiemployer pension plans.
Income Taxes and Uncertain Tax Positions
We review the tax positions taken or expected to be taken on tax returns to determine whether and to what extent a benefit can be recognized in our consolidated financial statements. See Note 13—Income Taxes in our consolidated financial statements, included elsewhere in this prospectus, for the amount of unrecognized tax benefits and other disclosures related to uncertain tax positions. Various taxing authorities periodically examine our income tax returns. These examinations include questions regarding our tax filing positions, including the timing and amount of deductions and the allocation of income to various tax jurisdictions. In evaluating these various tax filing positions, including state and local taxes. We assess our income tax positions and record tax benefits for all years subject to examination based upon management’s evaluation of the facts, circumstances and information available at the reporting date. For those tax positions where it is more likely than not that a tax benefit will be sustained, we have recorded the largest amount of tax benefit with a greater than 50% likelihood of being realized upon ultimate settlement with a taxing authority that has full knowledge of all relevant information. For those income tax positions where it is not more likely than not that a tax benefit will be sustained, no tax benefit has been recognized in our financial statements. A number of years may elapse before an uncertain tax position is examined and fully resolved. As of February 28, 2015, we are no longer subject to federal income tax examinations for fiscal years prior to 2007 and in most states are no longer subject to state income tax examinations for fiscal years before 2007. Tax years 2007 through 2014 remain under examination. The assessment of our tax position relies on the judgment of management to estimate the exposures associated with our various filing positions.
Quantitative and Qualitative Disclosures about Market Risk
We are exposed to market risk from a variety of sources, including changes in interest rates, foreign currency exchange rates and commodity prices. We have from time to time selectively used derivative financial instruments to reduce these market risks. We do not utilize financial instruments for trading or other speculative purposes, nor do we utilize leveraged financial instruments. Our market risk exposures related to interest rates, foreign currency and commodity prices are discussed below and have not materially changed from the prior fiscal year. In fiscal 2014, we began using derivative financial instruments to reduce these market risks related to interest rates.
102
Table of Contents
Interest Rate Risk and Long-Term Debt
We are exposed to market risk from fluctuations in interest rates. We manage our exposure to interest rate fluctuations through the use of interest rate swaps (“Cash Flow Hedges”). Our risk management objective and strategy is to utilize these interest rate swaps to protect the company against adverse fluctuations in interest rates by reducing its exposure to variability in cash flows relating to interest payments on a portion of its outstanding debt. We believe that we are meeting our objectives of hedging our risks in changes in cash flows that are attributable to changes in the LIBOR rate, which is the designated benchmark interest rate being hedged (the “hedged risk”), on an amount of the company’s debt principal equal to the then-outstanding swap notional amount.
Additionally, we had the Deal-Contingent Swap that was entered into on April 16, 2014 in order to reduce our exposure to anticipated variable rate debt issuances in connection with the Safeway acquisition. Upon consummation of the Safeway acquisition, the swap became effective and was designated as a cash flow hedge. In accordance with the swap agreement, we receive a floating rate of interest and pay a fixed rate of interest over the life of the contract.
Interest rate volatility could also materially affect the interest rate we pay on future borrowings under the Senior Secured Credit Facilities. The interest rate we pay on future borrowings under the Senior Secured Credit Facilities are dependent on LIBOR. We believe a 100 basis point increase or decrease on our variable interest rates would not be significant.
See Note 7—Derivative Financial Instruments in our consolidated financial statements, included elsewhere in this prospectus, for additional information.
The tables below provide information about our interest rate derivatives classified as Cash Flow Hedges, deal-contingent swaps and underlying debt portfolio as of February 28, 2015 (dollars in millions).
| Pay Fixed/Receive Variable | ||||||||||||||||||||||||
| Fiscal 2015 |
Fiscal 2016 |
Fiscal 2017 |
Fiscal 2018 |
Fiscal 2019 |
Thereafter | |||||||||||||||||||
| Cash Flow Hedges and Deal- Contingent Swap |
||||||||||||||||||||||||
| Average notional amount outstanding |
$ | 5,125 | $ | 4,628 | $ | 3,807 | $ | 2,925 | $ | 1,921 | $ | 1,357 | ||||||||||||
| Average pay rate |
6.79 | % | 6.86 | % | 6.82 | % | 6.77 | % | 7.19 | % | 7.19 | % | ||||||||||||
| Average receive rate |
5.34 | % | 5.37 | % | 5.92 | % | 6.39 | % | 6.67 | % | 6.97 | % | ||||||||||||
| Fiscal 2015 |
Fiscal 2016 |
Fiscal 2017 |
Fiscal 2018 |
Fiscal 2019 |
Thereafter | Total | Fair Value |
|||||||||||||||||||||||||
| Long-Term Debt |
||||||||||||||||||||||||||||||||
| Principal payments |
$ | 503.4 | $ | 217.1 | $ | 324.3 | $ | 219.1 | $ | 2,286.5 | $ | 8,608.1 | $ | 12,158.5 | $ | 12,095.2 | ||||||||||||||||
| Weighted average interest rate(1) |
3.15 | % | 4.56 | % | 5.77 | % | 5.23 | % | 5.24 | % | 5.68 | % | 5.43 | % | ||||||||||||||||||
| (1) | Excludes effect of interest rate swaps |
Commodity Price Risk
We have entered into fixed price contracts to purchase electricity and natural gas for a portion of our energy needs. Contracts entered into as of February 28, 2015 expire from 2015 through 2034 with a combined contract value of $99.9 million. We expect to take delivery of these commitments in the normal course of business, and, as a result, these commitments qualify as normal purchases. We do not believe that these energy and commodity swaps would cause a material change to the financial position of the company.
103
Table of Contents
SUPPLEMENTAL MANAGEMENT’S DISCUSSION AND ANALYSIS OF RESULTS OF OPERATIONS OF SAFEWAY
The following discussion should be read in conjunction with “Supplemental Selected Historical Financial Information of Safeway” and Safeway’s historical consolidated financial statements, and the accompanying notes contained therein, included elsewhere in this prospectus. This discussion contains forward-looking statements. Please see “Special Note Regarding Forward-Looking Statements” for a discussion of the risks, uncertainties and assumptions relating to these statements.
Safeway’s last three fiscal years prior to the Safeway acquisition consisted of the 53-week period ended January 3, 2015 (“fiscal 2014” or “2014”), the 52-week period ended December 28, 2013 (“fiscal 2013” or “2013”) and the 52-week period ended December 29, 2012 (“fiscal 2012” or “2012”).
Management Overview of Safeway
On January 30, 2015, Albertson’s Holdings’ wholly-owned subsidiary, Saturn Acquisition Merger Sub, Inc., merged with and into Safeway, with Safeway surviving the merger as a wholly-owned subsidiary of Albertson’s Holdings. See “Business—Our Integration History and Banners” and Note V to Safeway’s historical consolidated financial statements, included elsewhere in this prospectus, for additional information.
On December 23, 2014, Safeway and its wholly-owned real estate development subsidiary, PDC, sold substantially all of the net assets of PDC to Terramar Retail Centers, LLC (“Terramar”), an unrelated party. PDC’s assets were comprised of shopping centers that are completed or under development. Most of these centers included a grocery store that was leased back to Safeway. The sale was consummated pursuant to an asset purchase agreement dated as of December 22, 2014 by and among Safeway, PDC and Terramar. See Note D to Safeway’s historical consolidated financial statements, included elsewhere in this prospectus, for additional information.
Discontinued Operations
See Note B to Safeway’s historical consolidated financial statements, included elsewhere in this prospectus, for additional information on discontinued Safeway’s operations.
Reduction of Debt
In fiscal 2014, Safeway reduced its debt by $1.2 billion with net proceeds from the sale of its Canadian operations and free cash flow. In August 2014, Safeway paid $802.7 million to redeem $320.0 million of the 2016 Safeway Notes and $400.0 million of the 2017 Safeway Notes. In connection with the Safeway acquisition, Safeway contributed $40.0 million in cash to PDC in the second quarter of fiscal 2014. This cash was to be held in a reserve account until the earlier to occur of (i) payment in full of the mortgage indebtedness encumbering a shopping center in Lahaina, Hawaii and (ii) the release of Safeway from any guaranty obligations in connection with such indebtedness. During the third quarter of fiscal 2014, Safeway deposited $40.0 million with a trustee and achieved a full legal defeasance of the mortgage indebtedness and was released from the guaranty obligations associated with such indebtedness. Therefore, during the third quarter of fiscal 2014, Safeway extinguished the $40.8 million mortgage from its condensed consolidated balance sheet. In addition, Safeway repaid the $400.0 million outstanding under its term credit agreement during fiscal 2014.
104
Table of Contents
During fiscal 2013, Safeway reduced debt by $1.4 billion with a combination of net proceeds from the sale of its Canadian operations, free cash flow and net proceeds from the initial public offering of Blackhawk. Safeway repaid its $250.0 million floating rate senior notes on the December 12, 2013 maturity date and redeemed $500.0 million of 6.25% Senior Notes due March 15, 2014. Additionally, in the fourth quarter of fiscal 2013, Safeway deposited CAD304.5 million in an account with the trustee under the indenture governing the CAD300.0 million, 3.00% second series notes due March 31, 2014. Safeway met the conditions for satisfaction and discharge of Safeway’s obligations under the indenture and, as a result, extinguished the $287.9 million notes and $292.2 million cash from the consolidated balance sheet. In addition, Safeway reduced borrowings under its term credit agreement by $300.0 million.
Effect of the Acquisition on Liquidity
In connection with the closing of the Safeway acquisition, on January 30, 2015, Safeway became party to (i) the ABS/Safeway ABL Agreement (as defined herein) with borrowing capacity of up to $3.0 billion, $980.0 million of which was drawn as of January 30, 2015 and (ii) the $6.3 billion principal amount ABS/Safeway Term Loan Agreement. In addition, pursuant to the Safeway acquisition agreement, Safeway is an obligor and its domestic subsidiaries are guarantors of $609.6 million in principal amount of the 7.750% ABS/Safeway Notes (after repayment of a portion of those notes on February 9, 2015). The proceeds of this indebtedness, together with approximately $650 million of cash on hand, were used to pay a portion of the Safeway acquisition consideration and related fees and expenses of the Safeway acquisition and to provide working capital.
Results of Operations
Income from Continuing Operations
Income from continuing operations was $103.2 million ($0.44 per diluted share) in fiscal 2014, $217.1 million ($0.89 per diluted share) in fiscal 2013 and $249.2 million ($1.00 per diluted share) in fiscal 2012. Fiscal 2014 included a loss on foreign currency translation of $131.2 million, a loss on extinguishment of debt of $84.4 million and merger- and integration-related expenses of $48.8 million. Fiscal 2013 included a $57.4 million loss on foreign currency translation and a $30.0 million loss from the impairment of notes receivable. Fiscal 2012 included a $46.5 million gain from legal settlements.
Sales and Other Revenue
Safeway’s identical store sales increases for fiscal 2014, fiscal 2013 and fiscal 2012 were as follows:
| Fiscal 2014 |
Fiscal 2013 |
Fiscal 2012 |
||||||||||
| Identical store sales |
2.8 | % | 1.7 | % | 0.8 | % | ||||||
| Identical store sales (including fuel) |
1.7 | % | 0.2 | % | 1.6 | % | ||||||
Safeway’s sales increased 3.6% to $36,330.2 million in fiscal 2014 from $35,064.9 million in fiscal 2013. Identical store sales increased 2.8%, or $865 million, due to inflation and better merchandising. Average transaction size and transaction counts increased during fiscal 2014. The additional week in fiscal 2014 contributed $573 million in sales. Fuel sales decreased $206 million in fiscal 2014, as a result of the average retail price per gallon of fuel decreasing 2.9% and gallons sold decreasing 2.1%.
Safeway’s sales decreased 0.3% to $35,064.9 million in fiscal 2013 from $35,161.5 million in fiscal 2012. Identical store sales increased 1.7%, or $511 million, due to inflation and better
105
Table of Contents
merchandising. Warehouse and supply sales increased $35 million. Other revenue, primarily from gift and prepaid card sales, increased $13 million. Fuel sales declined $425.8 million in fiscal 2013, as a result of the average retail price per gallon of fuel decreasing 4.1% and gallons sold decreasing 5.4%. Sales declined $233 million due to the disposition of Safeway’s Genuardi’s stores in fiscal 2012. Store closures, net of new stores, decreased sales by $39 million. Average transaction size and transaction counts increased during fiscal 2013.
Gross Profit
Gross profit represents the portion of sales revenue remaining after deducting the cost of goods sold during the period, including purchase and distribution costs. These costs include inbound freight charges, purchasing and receiving costs, warehouse inspection costs, warehousing costs and other costs associated with Safeway’s distribution network. Advertising and promotional expenses are also a component of cost of goods sold. Additionally, all vendor allowances are classified as an element of cost of goods sold.
Safeway’s gross profit margin was 26.7% of sales in fiscal 2014, 26.3% of sales in fiscal 2013 and 26.3% in fiscal 2012.
Safeway’s gross profit margin increased 32 basis points to 26.7% of sales in fiscal 2014 from 26.3% of sales in fiscal 2013 primarily for the following reasons:
| Basis point increase (decrease) |
||||
| Impact of fuel sales |
53 | |||
| Lower advertising expense |
19 | |||
| Investments in price |
(25 | ) | ||
| Higher shrink expense |
(15 | ) | ||
|
|
|
|||
| Total |
32 | |||
|
|
|
|||
Safeway’s gross profit margin increased eight basis points to 26.33% of sales in fiscal 2013 from 26.25% of sales in fiscal 2012 primarily for the following reasons:
| Basis point increase (decrease) |
||||
| Impact of fuel sales |
35 | |||
| Lower advertising expense |
16 | |||
| Changes in product mix |
6 | |||
| Increased LIFO income(1) |
5 | |||
| Fuel partner discounts |
(15 | ) | ||
| Investments in price |
(18 | ) | ||
| Higher shrink expense |
(19 | ) | ||
| Other individually immaterial items |
(2 | ) | ||
|
|
|
|||
| Total |
8 | |||
|
|
|
|||
| (1) | “LIFO” is defined as last-in, first-out. |
Safeway’s shrink expense increased 15 basis points in fiscal 2014 and 19 basis points in fiscal 2013. In the second half of fiscal 2013, Safeway implemented a new strategy which focused more on increasing sales with less emphasis on controlling shrink, which led to higher shrink expense in fiscal 2014 and fiscal 2013.
106
Table of Contents
Safeway’s vendor allowances totaled $2.5 billion in fiscal 2014, $2.4 billion in fiscal 2013 and $2.3 billion in fiscal 2012 and can be grouped into the following broad categories: promotional allowances, slotting allowances and contract allowances.
Promotional allowances make up the vast majority of all of Safeway’s allowances. With promotional allowances, vendors pay Safeway to promote their product. The promotion may be any combination of a temporary price reduction, a feature in print ads, a feature in a Safeway circular or a preferred location in the store. Safeway’s promotions are typically one to two weeks long.
Slotting allowances are a very small portion of Safeway’s total allowances. With slotting allowances, the vendor reimburses Safeway for the cost of placing new product on the shelf. Safeway has no obligation or commitment to keep the product on the shelf for a minimum period.
Contract allowances make up the remainder of all of Safeway’s allowances. Under a typical contract allowance, a vendor pays Safeway to keep product on the shelf for a minimum period of time or when volume thresholds are achieved.
Promotional and slotting allowances are accounted for as a reduction in the cost of purchased inventory and are recognized when the related inventory is sold. Contract allowances are recognized as a reduction in the cost of goods sold as volume thresholds are achieved or through the passage of time.
Operating and Administrative Expense
Safeway’s operating and administrative expense consists primarily of store occupancy costs and backstage expenses, which, in turn, consist primarily of wages, employee benefits, rent, depreciation and utilities.
Safeway’s operating and administrative expense was 25.18% of sales in fiscal 2014 compared to 24.75% of sales in fiscal 2013 and 24.44% in fiscal 2012.
Safeway’s operating and administrative expense margin increased 43 basis points to 25.18% of sales in fiscal 2014 from 24.75% of sales in fiscal 2013 primarily for the following reasons:
| Basis point increase (decrease) |
||||
| Impact of fuel sales |
22 | |||
| Store occupancy costs |
(20 | ) | ||
| Write-off of $30 million of notes receivable in fiscal 2013 |
(10 | ) | ||
| Lower pension expense |
(14 | ) | ||
| Store labor |
(12 | ) | ||
| Higher bonus expense |
18 | |||
| Safeway acquisition- and integration-related expenses |
16 | |||
| Higher self-insurance expense |
15 | |||
| Lower property gains |
8 | |||
| Higher legal expenses |
8 | |||
| Other |
12 | |||
|
|
|
|||
| Total |
43 | |||
|
|
|
|||
107
Table of Contents
Safeway’s self-insurance expense increased $55.3 million to $153.9 million in fiscal 2014 from $98.6 million in fiscal 2013. A 25 basis point decline in the discount rate used to measure the present value of the self-insurance liability in fiscal 2014 increased Safeway’s self-insurance expense by approximately $6 million. The primary drivers leading to the increase in fiscal 2014 were a significant claim related to Safeway’s in-store pharmacy operations and two significant claims related to Safeway’s transportation operations. In fiscal 2013, a 100 basis point increase in the discount rate reduced fiscal 2013 expense by approximately $24 million. The remaining increase was due primarily to adverse claim development.
Safeway’s operating and administrative expense margin increased 31 basis points to 24.75% of sales in fiscal 2013 from 24.44% of sales in fiscal 2012 primarily for the following reasons:
| Basis point increase (decrease) |
||||
| Impact of fuel sales |
33 | |||
| $46.5 million gain from legal settlements in fiscal 2012 |
15 | |||
| Write-off of $30.0 million of notes receivable |
9 | |||
| Decline in self-insurance expense |
(16 | ) | ||
| Lower depreciation expense |
(11 | ) | ||
| Lower pension expense |
(5 | ) | ||
| Other individually immaterial items |
6 | |||
|
|
|
|||
| Total |
31 | |||
|
|
|
|||
Gain on Property Dispositions
Safeway’s operating and administrative expense included a net gain on property dispositions of $38.8 million in fiscal 2014, a net gain of $51.2 million in fiscal 2013 and a net gain of $48.3 million in fiscal 2012.
Interest Expense
Safeway’s interest expense was $198.9 million in fiscal 2014, compared to $273.0 million in fiscal 2013 and $300.6 million in fiscal 2012. The decrease in fiscal 2014 was due to lower average borrowings, partly offset by increased average interest rates. The decrease in interest expense in fiscal 2013 was due to lower average borrowing in fiscal 2013 compared to fiscal 2012, partly offset by slightly higher interest rates.
Average borrowings from continuing operations at Safeway were $3,680.5 million, $5,623.9 million and $6,378.9 million in fiscal 2014, fiscal 2013 and fiscal 2012, respectively. Average interest rates were 5.42%, 4.85% and 4.71% in fiscal 2014, fiscal 2013 and fiscal 2012, respectively.
Loss on Extinguishment of Debt
Safeway incurred a loss on extinguishment of debt of $84.4 million and $10.1 million in fiscal 2014 and fiscal 2013, respectively. See Note G to Safeway’s historical consolidated financial statements, included elsewhere in this prospectus, for additional information.
Loss on Foreign Currency Translation
After the sale of Safeway’s Canadian operations, the adjustments resulting from translation of assets and liabilities denominated in Canadian dollars are included in Safeway’s statement of income as a foreign currency gain or loss. Foreign currency loss at Safeway was $131.2 million in fiscal 2014 and $57.4 million in fiscal 2013.
108
Table of Contents
Other Income, Net
In fiscal 2014, Safeway’s other income, net consisted of interest income of $22.5 million, equity in earnings of unconsolidated affiliate of $16.2 million and gain on the sale of investments of $6.3 million. In fiscal 2013, Safeway’s other income, net consisted primarily of interest income of $14.8 million, equity in earnings from Safeway’s unconsolidated affiliate of $17.6 million and gain on the sale of investments of $8.6 million. In fiscal 2012, other income, net consists primarily of interest income of $9.9 million and equity in earnings of unconsolidated affiliates of $17.5 million.
Income Taxes
Safeway’s fiscal 2014 income tax expense was $61.8 million, or 37.5% of pre-tax income. In fiscal 2013, Safeway had income tax expense of $34.5 million, or 13.7% of pre-tax income. In fiscal 2013, Safeway withdrew $68.7 million from the accumulated cash surrender value of corporate-owned life insurance policies and determined that a majority of the remaining cash surrender value would be received in the future through tax-free death benefits. Consequently, Safeway reversed deferred taxes on that remaining cash surrender value and reduced fiscal 2013 income tax expense by $17.2 million. In fiscal 2012, income tax expense was $113.0 million, or 31.2%, of pre-tax income.
Adjusted EBITDA
“Adjusted EBITDA from Continuing Operations” is a non-GAAP operating financial measure that excludes the financial impact of items management does not consider in assessing ongoing performance. Management believes that Adjusted EBITDA from Continuing Operations provides a meaningful representation of operating performance because it excludes the impact of items that could be considered “non-core” in nature.
Management uses Adjusted EBITDA from Continuing Operations to measure overall operating performance and assess performance against Safeway’s peers. Since the levels of indebtedness, tax structures, discontinued operations, property impairment charges, methodologies in calculating LIFO expense and unconsolidated affiliates that other companies have are different from Safeway’s, we omit these amounts to facilitate investors’ ability to make these comparisons. Similarly, we omit depreciation and amortization because other companies may employ a greater or lesser amount of owned property, and because, in management’s experience, whether a store is new or one that is fully or mostly depreciated does not necessarily correlate to the contribution such store makes to operating performance.
Adjusted EBITDA from Continuing Operations also provides useful information to our investors, securities analysts and other interested parties.
109
Table of Contents
The computation of Adjusted EBITDA from Continuing Operations is provided below. Adjusted EBITDA from Continuing Operations should not be considered as an alternative to income from continuing operations, net of tax, or cash flow from operating activities (which are determined in accordance with GAAP). Other companies may define Adjusted EBITDA differently and, as a result, such measures may not be comparable to Safeway’s Adjusted EBITDA from Continuing Operations (dollars in millions).
| Fiscal 2014 |
Fiscal 2013 |
Fiscal 2012 |
||||||||||
| Income from continuing operations, net of tax (1) |
$ | 103.2 | $ | 217.1 | $ | 249.2 | ||||||
| Noncontrolling interest |
— | — | 0.3 | |||||||||
| Income taxes |
61.8 | 34.5 | 113.0 | |||||||||
| Interest expense |
198.9 | 273.0 | 300.6 | |||||||||
| Depreciation expense |
921.5 | 922.2 | 952.8 | |||||||||
| LIFO (income) / expense |
(5.0 | ) | (14.3 | ) | 0.7 | |||||||
| Share-based employee compensation |
24.7 | 50.4 | 48.4 | |||||||||
| Property impairment charges |
56.1 | 35.6 | 33.6 | |||||||||
| Equity in earnings of unconsolidated affiliate |
(16.2 | ) | (17.6 | ) | (17.5 | ) | ||||||
| Dividend from unconsolidated affiliate |
9.0 | 3.8 | 0.7 | |||||||||
| Impairment of notes receivables |
— | 30.0 | — | |||||||||
| Loss on foreign currency translation |
131.2 | 57.4 | — | |||||||||
| Loss on extinguishment of debt |
84.4 | 10.1 | — | |||||||||
| Acquisition and integration costs |
48.8 | 0.5 | — | |||||||||
|
|
|
|
|
|
|
|||||||
| Total Adjusted EBITDA from Continuing Operations |
$ | 1,618.4 | $ | 1,602.7 | $ | 1,681.8 | ||||||
|
|
|
|
|
|
|
|||||||
| (1) | Excludes discontinued operations of Blackhawk, Dominick’s and Canada Safeway. |
Liquidity and Financial Resources
Safeway’s net cash flow provided by operating activities was $1,387.7 million in fiscal 2014, $1,071.4 million in fiscal 2013 and $1,226.5 million in fiscal 2012. Net cash flow from operating activities increased in fiscal 2014 compared to fiscal 2013 primarily due to higher income taxes paid in fiscal 2013. The decrease in Safeway’s net cash flow provided by operating activities in fiscal 2013 from fiscal 2012 was due primarily to income taxes paid from continuing operations.
Safeway’s cash contributions to Safeway’s pension and post-retirement benefit plans are expected to be $268.0 million in fiscal 2015 and totaled $13.3 million in fiscal 2014, $56.3 million in fiscal 2013 and $110.3 million in fiscal 2012.
Safeway’s net cash flow used by investing activities, which consists principally of cash paid for property additions, was $115.6 million in fiscal 2014, $442.7 million in fiscal 2013 and $593.2 million in fiscal 2012. Safeway’s net cash flow used by investing activities declined in fiscal 2014 compared to fiscal 2013, primarily as a result of proceeds from the sale of PDC in fiscal 2014. Net cash flow used by investing activities declined in fiscal 2013 compared to fiscal 2012, primarily as a result of lower capital expenditures and higher proceeds from Safeway-owned life insurance policies in fiscal 2013.
110
Table of Contents
Safeway’s cash paid for property additions was $711.2 million in fiscal 2014, $738.2 million in fiscal 2013 and $800.1 million in fiscal 2012. Capital expenditures by major category of spending were as follows:
| (in millions) |
Fiscal 2014 |
Fiscal 2013 |
Fiscal 2012 |
|||||||||
| Remodels |
$ | 121.8 | $ | 227.9 | $ | 227.8 | ||||||
| Information technology |
123.3 | 117.0 | 96.1 | |||||||||
| New stores |
96.0 | 111.7 | 157.2 | |||||||||
| Property Development Centers |
107.3 | 105.0 | 177.2 | |||||||||
| Supply chain |
138.8 | 91.1 | 59.3 | |||||||||
| Others |
124.0 | 85.5 | 82.5 | |||||||||
|
|
|
|
|
|
|
|||||||
| Cash paid for property additions |
$ | 711.2 | $ | 738.2 | $ | 800.1 | ||||||
|
|
|
|
|
|
|
|||||||
Safeway’s net cash flow used by financing activities was $1,672.1 million in fiscal 2014, $2,003.9 million in fiscal 2013 and $1,329.1 million in fiscal 2012. In fiscal 2014, net cash payments on debt were $1,371.8 million. Safeway paid $82.0 million to extinguish certain debt and paid $251.8 million in dividends in fiscal 2014. In fiscal 2013, net cash payments on debt were $1,386.0 million. Safeway also repurchased $663.7 million of common stock, paid $181.4 million in dividends and received net proceeds of $240.1 million from the exercise of stock options in fiscal 2013. In fiscal 2012, net cash additions to debt were $117.5 million. Additionally, Safeway repurchased $1,274.5 million of common stock and paid $163.9 million in dividends in fiscal 2012.
111
Table of Contents
Our Company
We are one of the largest food and drug retailers in the United States, with both strong local presence and national scale. As of September 12, 2015, we operated 2,196 stores across 33 states and the District of Columbia under 18 well-known banners, including Albertsons, Safeway, Vons, Jewel-Osco, Shaw’s, Acme, Tom Thumb, Randalls, United Supermarkets, Pavilions, Star Market and Carrs. We operate in 120 MSAs and are ranked #1 or #2 by market share in 68% of them. We provide our customers with a service-oriented shopping experience, including convenient and value-added services through 1,702 pharmacies, 1,083 in-store branded coffee shops and 379 adjacent fuel centers. We have approximately 265,000 talented and dedicated employees serving on average more than 33 million customers each week.
Our operating philosophy is simple: we run great stores with a relentless focus on driving sales growth. We believe that our management team, with decades of collective experience in the food and drug retail industry, has developed a proven and successful operating playbook that differentiates us from our competitors.
We implement our playbook through a decentralized management structure. We believe this approach allows our division and district-level leadership teams to create a superior customer experience and deliver outstanding operating performance. These teams are empowered and incentivized to make decisions on product assortment, placement, pricing, promotional plans and capital spending in the local communities and neighborhoods they serve. Our store directors are responsible for implementing our operating playbook on a daily basis and ensuring that our employees remain focused on delivering outstanding service to our customers.
We believe that the execution of our operating playbook, among other factors, including improved economic conditions and consumer confidence, has enabled us to grow sales, profitability and free cash flow across our business. During fiscal 2014 and the first and second quarters of fiscal 2015, excluding Safeway, our identical store sales grew at 6.8%, 5.1% and 5.7%, respectively. At Safeway, prior to our acquisition, the rate of identical store sales growth was 3.0% in fiscal 2014, and accelerated in the first and second quarters of fiscal 2015 to 3.8% and 4.9%, respectively. The rates of identical store sales growth for our stores, excluding Safeway, for fiscal 2014 and the second quarter of fiscal 2015 have been adjusted for the positive sales impact in one of our divisions within NAI during the second quarter of fiscal 2014 resulting from a labor dispute at a competitor that caused a temporary closure of its stores. Without adjusting for this impact, identical store sales growth for our stores, excluding Safeway, during fiscal 2014 and the second quarter of fiscal 2015 would have been 7.2% and 3.9%, respectively. We are currently executing on an annual synergy plan of approximately $800 million related to the acquisition of Safeway, which we expect to achieve by the end of fiscal 2018. We expect to deliver annual run-rate synergies of approximately $440 million by the end of fiscal 2015.
For fiscal 2014 on a pro forma basis, we would have generated net sales of $57.5 billion, Adjusted EBITDA of $2.4 billion and free cash flow (which we define as Adjusted EBITDA less capital expenditures) of $1.5 billion. For the 12 months ended September 12, 2015 on a pro forma basis, we would have generated net sales of $58.1 billion, Adjusted EBITDA of $2.5 billion and free cash flow of $1.6 billion. For the first two quarters of fiscal 2015, we generated net sales of $31.5 billion, Adjusted EBITDA of $1.3 billion and free cash flow of $817 million. In addition to realizing increased sales, profitability and free cash flow through the implementation of our operating playbook, we expect synergies from the Safeway acquisition to enhance our profitability and free cash flow over the next few years.
112
Table of Contents
Our Integration History and Banners
Over the past nine years, we have completed a series of acquisitions, beginning with our purchase of Albertson’s LLC in 2006. This was followed in March 2013 by our acquisition of NAI from SuperValu, which included the Albertsons stores that we did not already own and stores operating under the Acme, Jewel-Osco, Shaw’s and Star Market banners. In December 2013, we acquired United, a regional grocery chain in North and West Texas. In January 2015, we acquired Safeway in a transaction that significantly increased our scale and geographic reach. We have also completed the divestiture of 168 stores required by the FTC in connection with the Safeway acquisition. On July 19, 2015, we entered into an agreement with A&P pursuant to which we are acquiring 71 stores currently operating under the A&P, Superfresh and Pathmark banners for our Acme banner. We continually review acquisition opportunities that we believe are synergistic with our existing store network.
The following illustrative map represents our regional banners and combined store network as of September 12, 2015. We also operate 30 strategically located distribution centers and 21 manufacturing facilities. Approximately 48% of our stores are owned or ground-leased. Together, our owned and ground-leased properties have a value of approximately $10.5 billion (see “—Properties”). Our principal banners are described in more detail below.
Albertsons
Under the Albertsons banner, which dates back to 1939, we operate 454 stores in 16 states across the Western and Southern United States. In addition to our broad grocery offering, approximately 372 Albertsons stores include in-store pharmacies (offering prescriptions, immunizations, online prescription refills and prescription savings plans), and we operate one fuel center adjacent to our Albertsons stores.
The operating performance of the Albertsons stores that we acquired in 2013 has significantly improved since acquisition. In fiscal 2012, prior to their acquisition, identical store sales at these stores
113
Table of Contents
declined by 4.8%, compared to positive 8.2% identical store sales growth during fiscal 2014 and positive 9.5% and 9.7% identical store sales growth during the first and second quarters of fiscal 2015, respectively.
Safeway
We operate 1,242 Safeway stores in 18 states across the Western, Southern and Mid-Atlantic regions of the United States, as well as the District of Columbia. We operate these stores under the Safeway banner, which dates back to 1926, as well as the Vons, Pavilions, Randalls, Tom Thumb and Carrs banners. Our Safeway stores also provide convenience to our customers through a network of 977 in-store pharmacies and 341 adjacent fuel centers.
The Safeway acquisition has better positioned us for long-term growth by providing us with a broader assortment of products, a more efficient supply chain, enhanced fresh and perishable offerings and a high-quality and expansive portfolio of own brand products. These improvements enable us to respond to changing customer tastes and preferences and compete more effectively in a highly competitive industry.
Safeway has achieved consistent positive identical store sales growth over the past 17 fiscal quarters, driven in part by continued investment in the store base (with approximately 81% of Safeway stores new or remodeled since 2003) and the implementation of local marketing programs to enhance sales. Safeway has also begun to experience an acceleration in identical store sales growth, from 1.4% in fiscal 2013 to 3.0% in fiscal 2014 and 3.8% and 4.9% in the first and second quarters of fiscal 2015, respectively.
Acme, Jewel-Osco, Shaw’s and Star Market
Under the Acme, Jewel-Osco, Shaw’s and Star Market banners, we operate 445 stores, 303 in-store pharmacies and five adjacent fuel centers in 12 states across the Mid-Atlantic, Midwest and Northeast regions of the United States. Each of these banners has an operating history going back more than 100 years, has excellent store locations and has a loyal customer base.
The operating performance of these banners has significantly improved since we acquired them in 2013. During the four fiscal quarters prior to their acquisition, our Acme, Jewel-Osco, Shaw’s and Star Market stores were averaging negative 4.8% identical store sales compared to positive 9.1% for fiscal 2014 and positive 4.1% and 1.8% for the first and second quarters of fiscal 2015, respectively. After adjusting for the positive sales impact in one of our divisions within NAI during the second quarter of fiscal 2014 resulting from a labor dispute at a competitor that caused a temporary closure of its stores, the estimated identical store sales growth for the Acme, Jewel-Osco, Shaw’s and Star Market stores for the 28 weeks ended September 12, 2015 would have been 5.2% on a pro forma combined basis.
United Supermarkets
In the North and West Texas area, we operate 53 stores under the United Supermarkets, Amigos and Market Street banners, together with 32 adjacent fuel centers and 12 United Express convenience stores. Our acquisition of United in December 2013 represented a unique opportunity to add a growing and profitable business in the growing Texas economy with an experienced and successful management team in place. Retaining the local management team was critical to our acquisition thesis. We have leveraged their abilities by both re-assigning and opening additional stores under their direct oversight. The United management team has considerable expertise in meeting the preferences of an upscale customer base with its Market Street format. United addresses its significant Hispanic customer base through its Amigos format, which we intend to leverage across other relevant regions going forward. We also benefit from distribution center and transportation efficiencies as a result of United’s adjacencies to our other operating divisions in the Southwest.
114
Table of Contents
Our Organizational Structure and Operating Playbook
Our Organizational Structure
We are organized across 14 operating divisions. We operate with a decentralized management structure. Our division and district-level leadership teams are responsible and accountable for their own sales, profitability and capital expenditures, and are empowered and incentivized to make decisions on product assortment, placement, pricing, promotional plans and capital spending to best serve the local communities and neighborhoods they serve. Our division leaders collaborate to facilitate the rapid sharing of best practices. Our local merchandising teams spend considerable time working with store directors to make sure we are satisfying consumer preferences. Our store directors are responsible for ensuring that our employees provide outstanding service to our customers. We believe that this aspect of our operating playbook, combined with ongoing investments in store labor, coordinated employee training and a simple, well-understood quarterly sales and EBITDA-based bonus structure, fosters an organization that is nimble and responsive to the local tastes and preferences of our customers.
Our executive management team sets long-term strategy and annual objectives for our 14 divisions. They also facilitate the sharing of expertise and best practices across our business, including through the operation of centers of excellence for areas such as our own brands, space planning, pricing analytics, promotional effectiveness, product category trends and consumer insights. They seek to leverage our national scale by driving our efforts to maintain and deepen strong relationships with large, national consumer products vendors. The executive management team also provides substantial data-driven analytical support for decision-making, providing division management teams with insights on their relative performance. Together, all of these elements reinforce our high standards of store-level execution and foster a collaborative, competitive and winning culture.
Our Operating Playbook
Our management team has developed and implemented a proven and successful operating playbook to drive sales growth, profitability and free cash flow. Our playbook covers every major facet of store-level operations and is based on the following key concepts:
| • | Operate Our Stores to the Highest Standards. We ensure that our stores are always “full, fresh, friendly and clean.” Our efforts are driven through our rigorous G.O.L.D. (Grand Opening Look Daily) program focused on delivering fresh offerings, well-stocked shelves, and clean and brightly lit departments. |
| • | Deliver Superior Customer Service. We focus on providing superior customer service. We consistently invest in store labor and training, and our simple and well-understood sales- and EBITDA-based bonus structure ensures that our employees are properly incentivized. We measure customer satisfaction scores weekly and hold management accountable for continuous improvement. Our focus on customer service is reflected in our improving customer satisfaction scores and identical store sales growth. |
| • | Provide a Compelling Product Offering. We focus on providing the highest quality fresh, natural and organic assortments to meet the demands of our customers, including through our private label brands, which we refer to as our own brands, such as Open Nature and O Organics. In addition, we offer high-volume, high-quality and differentiated signature products, including fresh fruit and vegetables cut in-store, cookies and fried chicken prepared using our proprietary recipes, in-store roasted turkey and freshly-baked bread. Our decentralized operating structure enables our divisions to offer products that are responsive to local tastes and preferences. |
115
Table of Contents
| • | Offer an Attractive Value Proposition to Our Customers. We maintain price competitiveness through systematic, selective and thoughtful price investment to drive customer traffic and basket size. We also use our loyalty programs, including just for U, MyMixx and our fuel-based rewards programs, as well as our strong own brand assortment to improve customer perception of our value proposition. |
| • | Drive Innovation Across our Network of Stores. We focus on innovation to enhance our customers’ in-store experience, generate customer loyalty and drive traffic and sales growth. We ensure that our stores benefit from modern décor, fixtures and store layout. We systematically monitor emerging trends in food and source new and innovative products to offer in our stores. In addition, we are focused on continuing to deliver personalized and promotional offers to further develop our relationship with our customers and on expanding our online and home delivery options. |
| • | Make Disciplined Capital Investments. We believe that our store base is modern and in excellent condition. We apply a disciplined approach to our capital investments, undertaking a rigorous cost-benefit analysis and targeting an attractive return on investment. Our capital budgets are subject to approval at the corporate level, but we empower our division leadership to prudently allocate capital to projects that will generate the highest return. |
116
Table of Contents
Identical Store Sales
We believe that the execution of our operating playbook has been an important factor in the acceleration of identical store sales growth across the SVU Albertsons Stores, the NAI Stores and the Safeway stores. The charts below illustrate historical identical store sales growth across the Albertsons Stores, the NAI Stores and the Safeway stores:
Our Competitive Strengths
We believe the following strengths differentiate us from our competitors and contribute to our ongoing success:
Powerful Combination of Strong Local Presence and National Scale. We operate a portfolio of well-known banners with both strong local presence and national scale. We have leading positions in many of the largest and fastest-growing MSAs in the United States. Given the long operating history of our banners, many of our stores form an important part of the local communities and neighborhoods in which they operate and occupy “First-and-Main” locations. We believe that our combination of local presence and national scale provides us with competitive advantages in brand recognition, customer loyalty and purchasing, marketing and advertising and distribution efficiencies.
117
Table of Contents
Best-in-Class Management Team with a Proven Track Record. We have assembled a best-in-class management team with decades of operating experience in the food and drug retail industry. Our Chairman and Chief Executive Officer, Bob Miller, has over 50 years of food and drug retail experience, including serving as Chairman and CEO of Fred Meyer and Rite Aid and Vice Chairman of Kroger. We have created an Office of the CEO to set long-term strategy and annual objectives for our 14 divisions. The Office of the CEO is comprised of Bob Miller, Wayne Denningham (Chief Operating Officer), Justin Dye (Chief Administrative Officer) and Shane Sampson (Chief Marketing and Merchandising Officer), each of whom brings significant leadership and operational experience with long tenures at our company and within the industry. Our Executive and Senior Vice Presidents and our division, district and store-level leadership teams are also critical to the success of our business. Our nine Executive Vice Presidents, 15 Senior Vice Presidents and 14 division Presidents have an average of almost 23, 24 and 32 years of service, respectively, with our company.
Proven Operating Playbook. We believe that the execution of our operating playbook has been an important factor in enabling us to accelerate identical store sales growth. In the first and second quarters of fiscal 2015, we delivered identical store sales growth of 9.5% and 9.7%, respectively, across the SVU Albertsons Stores, and 4.1% and 5.2%, respectively, across the NAI Stores, compared to positive identical store sales growth of 8.7% and 7.5%, respectively, across the SVU Albertsons Stores, and 12.2% and 8.1%, respectively, across the NAI Stores in the first and second quarters of fiscal 2014. Our Safeway stores delivered identical store sales growth of 3.0% in fiscal 2014, and 3.8% and 4.9% identical store sales growth in the first and second quarters of fiscal 2015, respectively. The rates of identical store sales growth for the NAI Stores for the second quarters of fiscal 2014 and 2015 have been adjusted for the positive sales impact during the second quarter of fiscal 2014 resulting from a labor dispute at a competitor that caused a temporary closure of its stores. Without adjusting for this impact, the NAI Stores’ identical store sales growth for the second quarters of fiscal 2014 and 2015 would have been 11.9% and 1.8%, respectively.
Strong Free Cash Flow Generation. Our strong operating results, in combination with our disciplined approach to capital allocation, have resulted in the generation of strong free cash flow. On a pro forma basis, we would have generated free cash flow of approximately $1.5 billion in fiscal 2014. Our ability to grow free cash flow will be enhanced by the synergies we expect to achieve from our acquisition of Safeway. We expect to deliver approximately $800 million of annual synergies by the end of fiscal 2018, including approximately $440 million on an annual run-rate basis by the end of fiscal 2015.
Significant Acquisition and Integration Expertise. Growth through acquisition is an important component of our strategy, both to enhance our competitiveness in existing markets (as with recent acquisitions for our Jewel-Osco banner) and to expand our footprint into new markets (as with the United acquisition). On July 19, 2015, we entered into an agreement with A&P pursuant to which we are acquiring 71 stores for our Acme banner. We continually review acquisition opportunities that we believe are synergistic with our existing store network. We have developed a proprietary and repeatable blueprint for integration, including a clearly defined plan for the first 100 days. We believe that our ability to integrate acquisitions is significantly enhanced by our decentralized approach, which allows us to leverage the expertise of incumbent local management teams. We have also developed significant expertise in synergy planning and delivery. We believe that the acquisition and integration experience of our management team, together with the considerable transactional expertise of our equity sponsors, positions us well for future acquisitions as the food and drug retail industry continues to consolidate.
For more information on our ability to achieve any expected synergies, see “Risk Factors—Risks Related to the Safeway and A&P Acquisitions and Integration—We may not be able to achieve the full amount of synergies that are anticipated, or achieve the synergies on the schedule anticipated, from the Safeway acquisition.”
118
Table of Contents
Our Strategy
Our operating philosophy is simple: we run great stores with a relentless focus on sales growth. We believe there are significant opportunities to grow sales and enhance profitability and free cash flow, through execution of the following strategies:
Continue to Drive Identical Store Sales Growth. Consistent with our operating playbook, we plan to deliver identical store sales growth by implementing the following initiatives:
| • | Enhancing and Upgrading Our Fresh, Natural and Organic Offerings and Signature Products. We continue to enhance and upgrade our fresh, natural and organic offerings across our meat, produce, service deli and bakery departments to meet the changing tastes and preferences of our customers. We also believe that continued innovation and expansion of our high-volume, high-quality and differentiated signature products will contribute to stronger sales growth. |
| • | Expanding Our Own Brand Offerings. We continue to drive sales growth and profitability by extending our own brand offerings across our banners, including high-quality and recognizable brands such as O Organics, Open Nature, Eating Right and Lucerne. |
| • | Leveraging Our Effective and Scalable Loyalty Programs. We believe we can grow basket size and improve the shopping experience for our customers by expanding our just for U, MyMixx and fuel-based loyalty programs. In addition, we believe we can further enhance our merchandising and marketing programs by utilizing our customer analytics capabilities, including advanced digital marketing and mobile applications, and through the expansion of our online and home delivery options. |
| • | Capitalizing on Demand for Health and Wellness Services. We intend to leverage our portfolio of 1,702 pharmacies and our growing network of wellness clinics to capitalize on increasing customer demand for health and wellness services. Pharmacy customers are among our most loyal, and their average weekly spend is over 2.5x that of our non-pharmacy customers. We plan to continue to grow our pharmacy script counts through new patient prescription transfer programs and initiatives such as clinic, hospital and preferred network partnerships, which we believe will expand our access to patients. We believe that these efforts will drive sales growth and generate customer loyalty. |
| • | Continuously Evaluating and Upgrading Our Store Portfolio. We plan to pursue a disciplined capital allocation strategy to upgrade, remodel and relocate stores to attract customers to our stores and to increase store volumes. We believe that our store base is in excellent condition, and we have developed a remodel strategy that is both cost-efficient and effective. |
| • | Driving Innovation. We intend to drive traffic and sales growth through constant innovation. We will remain focused on identifying emerging trends in food and sourcing new and innovative products. We will also seek to build new, and enhance existing, customer relationships through our digital capabilities. |
| • | Sharing Best Practices Across Divisions. Our division leaders collaborate to ensure the rapid sharing of best practices. Recent examples include the expansion of our O Organics offering across banners, the accelerated roll-out of signature products such as Albertsons’ fresh fruit and vegetables cut in-store and a broader assortment and new fixtures for our wine and floral shops, implementing Safeway’s successful strategy across many of our banners. |
We believe the combination of these actions and initiatives, together with the attractive industry trends described in more detail under “—Our Industry,” will continue to drive identical store sales growth.
119
Table of Contents
Enhance Our Operating Margin. Our focus on identical store sales growth provides an opportunity to enhance our operating margin by leveraging our fixed costs. We plan to realize further margin benefit through added scale from partnering with vendors and by achieving efficiencies in manufacturing and distribution. In addition, we maintain a disciplined approach to expense management and budgeting.
Implement Our Synergy Realization Plan. We are currently executing our annual synergy plan of approximately $800 million from the acquisition of Safeway, which we expect to achieve by the end of fiscal 2018, with associated one-time costs of approximately $690 million (net of estimated synergy-related asset sale proceeds). We expect to achieve synergies from the Safeway acquisition of approximately $200 million in fiscal 2015, or $440 million on an annual run-rate basis, by the end of fiscal 2015, principally from corporate and division overhead savings, our own brands, vendor funds and marketing and advertising cost reductions. Approximately 80% of our $800 million annual synergy target is independent of sales growth, which we believe significantly reduces the risk of achieving our target.
Our detailed synergy plan was developed on a bottom-up, function-by-function basis by combined Albertsons and Safeway teams. Synergies are expected to consist of approximately 28% from operational efficiencies within our back office, distribution and manufacturing operations, 21% from the conversion of Albertsons stores onto Safeway’s information technology systems, 14% from increased own brand penetration and improved cost synergies and 12% from improved vendor relationships. An additional 25% of synergies are expected to come from optimizing marketing and advertising spend in adjacent regions, as well as actionable synergies in pharmacy, utilities and insurance. A more detailed description of the expected sources of synergy is set out below:
| • | Corporate and Division Cost Savings. We are removing complexity from our business by simplifying business processes and rationalizing redundant positions. As part of this process, we have finalized the plans and timing of headcount reductions in connection with our acquisition of Safeway, and, as of September 12, 2015, these reductions were substantially complete. In addition, we are taking steps to reduce transportation costs due to reduced mileage, improved facility utilization and fleet rationalization. |
| • | IT Conversion. We are in the process of converting our Albertsons and NAI stores, distribution centers and systems onto Safeway’s IT systems, which we believe will result in significant savings as we wind down our transition services agreements with SuperValu. We have obtained Safeway systems access for Albertsons and NAI users, developed initial consolidated reporting, launched our Data Integrity/Validation team and consolidated email directories across the company. In addition, we hired a new Chief Information Security Officer in early 2015. |
| • | Own Brands. We are leveraging the high-quality and expansive portfolio of our own brand products, consumer brands and manufacturing facilities owned by Safeway to improve profitability across our company. We recently developed a plan to redesign and consolidate our own brand packaging, which will no longer be differentiated by banners. Upon completion, each of our banners will offer the same own brand products. |
| • | Vendor Funding. We believe our increased scale will provide optimized and improved vendor relationships, through which we receive allowances and credits for volume incentives, promotional allowances and new product placement. We intend to leverage our scale through our joint accelerated growth program with leading consumer packaged goods vendors. |
| • | Marketing and Advertising. We believe our scale provides opportunities for marketing and advertising savings, primarily from lower advertising rates in overlapping regions and reduced agency spend. We intend to leverage our scale, but operate locally. Our national team will |
120
Table of Contents
| execute cutting-edge merchandising programs, optimize best practice sharing across divisions and enhance consumer understanding through consumer insight and analysis. Our local marketing teams will set brand strategy and communicate brand message to customers through the use of direct mail, radio, email and web applications, just for U and MyMixx personalization, television, social media, display and signage, search engines and weekly inserts. We also intend to develop and leverage cutting-edge loyalty and digital marketing programs. Since the Safeway acquisition, we have outsourced tactical advertising functions and implemented a standardized consumer survey index across the company. |
| • | Pharmacy, Utilities and Insurance. We intend to consolidate managed care provider reimbursement programs, increase vaccine penetration and leverage our combined scale for volume discounts on branded and generic drugs. Recently, we entered into a five-year distribution agreement with McKesson Corporation (“McKesson”) to source and distribute both branded and generic pharmaceuticals, commencing on April 1, 2016. Assuming that this agreement had been effective during fiscal 2014, management estimates that our purchases from McKesson would have represented approximately 7% of our fiscal 2014 sales on a pro forma basis. We will also benefit from the conversion of our banners to Safeway’s leading energy purchasing program that will allow us to buy a portion of our electrical power needs at wholesale prices. In addition, we expect to lower our corporate insurance costs by leveraging best practices and scale across the combined company. In addition, in May 2015 we hired a new Senior Vice President of Pharmacy, Health and Wellness to help grow our pharmacy business. |
For more information on our ability to achieve any expected synergies, see “Risk Factors—Risks Related to the Safeway and A&P Acquisitions and Integration—We may not be able to achieve the full amount of synergies that are anticipated, or achieve the synergies on the schedule anticipated, from the Safeway acquisition.”
Selectively Grow Our Store Base Organically and Through Acquisition. We intend to continue to grow our store base organically through disciplined investment in new stores. On July 19, 2015, we entered into an agreement with A&P pursuant to which we are acquiring 71 stores for our Acme banner. We continually review acquisition opportunities that we believe are synergistic with our existing store network. We believe our healthy balance sheet and decentralized structure also provide us with strategic flexibility and a strong platform to make further acquisitions. We evaluate strategic acquisition opportunities on an ongoing basis as we seek to strengthen our competitive position in existing markets or expand our footprint into new markets. We believe selected acquisitions and our successful track record of integration and synergy delivery provide us with an opportunity to further enhance sales growth, leverage our cost structure and increase profitability and free cash flow.
121
Table of Contents
Our Industry
We operate in the $584 billion U.S. food and drug retail industry, a highly fragmented sector with a large number of companies competing locally and a limited number of companies with a national footprint. From 2010 through 2014, food and drug retail industry revenues increased at an average annual rate of 1.3%, driven in part by improving macroeconomic factors including gross domestic product, household disposable income, consumer confidence and employment. Food-at-Home inflation is forecasted to be 1.5% to 2.5% in 2015, and 2.0% to 3.0% in 2016, which should also benefit industry sales. In addition to macroeconomic factors, the following trends, in particular, are expected to drive sales growth across the industry:
| • | Customer Focus on Fresh, Natural and Organic Offerings. Evolving customer tastes and preferences have caused food retailers to improve the breadth and quality of their fresh, natural and organic offerings. This, in turn, has resulted in the increasing convergence of product selections between conventional and alternative format food retailers. |
| • | Converging Approach to Health and Wellness. Customers increasingly view their food shopping experience as part of a broader approach to health and wellness. As a result, food retailers are seeking to drive sales growth and customer loyalty by incorporating pharmacy and wellness clinic offerings in their stores. |
| • | Increased Customer Acceptance of Own Brand Offerings. Increased customer acceptance has driven growth in demand for own brand offerings, including the introduction of premium store brands. In general, own brand offerings have a higher gross margin than similarly positioned products of national brands. |
| • | Loyalty Programs and Personalization. To remain competitive and boost customer loyalty, food retailers are increasing their focus on loyalty programs that target the delivery of personalized offers to their customers. Food retailers are also expected to seek to strengthen customer loyalty and make the shopping experience more convenient by introducing mobile applications that allow customers to make purchases, access loyalty card data and check prices while in-store. |
| • | Convenience as a Differentiator. Industry participants are addressing customers’ desire for convenience through in-store amenities and services, including store-within-store sites such as coffee bars, fuel centers, banks and ATMs. Customer convenience is important for traditional grocers that must differentiate themselves from other mass retailers, club stores and other food retailers. The increasing penetration of e-commerce competition has prompted food retailers to develop or outsource online and mobile applications for home delivery, pickup and digital shopping solutions with customer convenience in mind. It has also resulted in the emergence of a number of online-only food and drug offerings. |
122
Table of Contents
Properties
As of September 12, 2015, we operated 2,196 stores located in 33 states and the District of Columbia as shown in the following table:
| Location |
Number of Stores |
Location |
Number of Stores |
Location |
Number of Stores |
|||||||||||
| Alaska |
25 | Iowa | 1 | Oregon | 117 | |||||||||||
| Arizona |
142 | Louisiana | 18 | Pennsylvania | 43 | |||||||||||
| Arkansas |
1 | Maine | 21 | Rhode Island | 8 | |||||||||||
| California |
583 | Maryland | 71 | South Dakota | 3 | |||||||||||
| Colorado |
117 | Massachusetts | 78 | Texas | 216 | |||||||||||
| Delaware |
16 | Montana | 38 | Utah | 5 | |||||||||||
| District of Columbia |
14 | Nebraska | 5 | Vermont | 19 | |||||||||||
| Florida |
3 | Nevada | 44 | Virginia | 41 | |||||||||||
| Hawaii |
21 | New Hampshire | 28 | Washington | 199 | |||||||||||
| Idaho |
38 | New Jersey | 47 | Wyoming | 16 | |||||||||||
| Illinois |
179 | New Mexico | 34 | |||||||||||||
| Indiana |
4 | North Dakota | 1 | |||||||||||||
The following table summarizes our stores by size as of September 12, 2015:
| Square Footage |
Number of Stores | Percent of Total | ||||||
| Less than 30,000 |
184 | 8.4 | % | |||||
| 30,000 to 50,000 |
786 | 35.8 | % | |||||
| More than 50,000 |
1,226 | 55.8 | % | |||||
|
|
|
|
|
|||||
| Total stores |
2,196 | 100.0 | % | |||||
|
|
|
|
|
|||||
Approximately 48% of our operating stores are owned or ground-leased properties. Together, our owned and ground-leased properties have a value of approximately $10.5 billion. Appraisals of our real estate were conducted by Cushman & Wakefield, Inc. between the fourth quarter of 2012 and the fourth quarter of 2014. The foregoing value estimate includes a third-party valuation of United properties relied on by management and is adjusted to give effect to FTC-mandated divestitures and other asset sales since the dates of the appraisals.
Our corporate headquarters are located in Boise, Idaho. We own our headquarters. The premises is approximately 250,000 square feet in size. In addition to our corporate headquarters, we have corporate offices in Pleasanton, California and Phoenix, Arizona. We are in the process of consolidating our corporate campuses and division offices to increase efficiency.
On December 23, 2014, Safeway and its wholly-owned real estate development subsidiary, PDC, sold substantially all of the net assets of PDC to Terramar Retail Centers, LLC, an unrelated party. PDC’s assets were comprised of shopping centers that are completed or under development. Most of these centers included grocery stores that are leased back to Safeway.
Products
Our stores offer grocery products, general merchandise, health and beauty care products, pharmacy, fuel and other items and services. We are not dependent on any individual supplier, and no third-party supplier represented more than 5% of our fiscal 2014 sales on a pro forma basis. During fiscal 2014, on a pro forma basis, approximately 20% of sales, excluding fuel and pharmacy, were from
123
Table of Contents
our own brand products. The following table represents sales by revenue by similar type of product (in millions). Year over year increases in volume reflect acquisitions as well as identical store sales growth.
| Fiscal Year | ||||||||||||||||||||||||
| 2014 | 2013 | 2012 | ||||||||||||||||||||||
| Amount | % of Total | Amount | % of Total | Amount | % of Total | |||||||||||||||||||
| Non-perishables(1) |
$ | 12,906 | 47.5 | % | $ | 9,956 | 49.7 | % | $ | 1,836 | 49.5 | % | ||||||||||||
| Perishables(2) |
11,044 | 40.6 | % | 7,842 | 39.1 | % | 1,441 | 38.8 | % | |||||||||||||||
| Pharmacy |
2,603 | 9.6 | % | 2,019 | 10.1 | % | 393 | 10.6 | % | |||||||||||||||
| Fuel |
387 | 1.4 | % | 47 | 0.2 | % | — | — | ||||||||||||||||
| Other(3) |
259 | 0.9 | % | 191 | 0.9 | % | 42 | 1.1 | % | |||||||||||||||
|
|
|
|
|
|
|
|
|
|
|
|
|
|||||||||||||
| Total |
$ | 27,199 | 100.0 | % | $ | 20,055 | 100.0 | % | $ | 3,712 | 100.0 | % | ||||||||||||
|
|
|
|
|
|
|
|
|
|
|
|
|
|||||||||||||
| (1) | Consists primarily of general merchandise, grocery and frozen foods. |
| (2) | Consists primarily of produce, dairy, meat, deli, floral and seafood. |
| (3) | Consists primarily of lottery and various other commissions and other miscellaneous income. |
Distribution
As of September 12, 2015, we operated 30 strategically located distribution centers, 70% of which are owned or ground-leased. Our distribution centers collectively provide approximately 86% of all products to our retail operating areas. We are in the process of consolidating our distribution centers and moving Albertsons and NAI stores, distribution centers and systems onto Safeway’s IT systems in order to operate our entire distribution network across one unified platform.
Manufacturing
As measured by dollars for fiscal 2014, on a pro forma basis, 12% of our own brand merchandise was manufactured in company-owned facilities, and the remainder of our own brand merchandise was purchased from third parties. We closely monitor make-versus-buy decisions on internally sourced products to optimize our profitability. In addition, we believe that our scale will provide opportunities to leverage our fixed manufacturing costs in order to drive innovation across our own brand portfolio.
We operated the following manufacturing and processing facilities as of September 12, 2015:
| Facility Type |
Number | |||
| Milk plants |
6 | |||
| Bakery plants |
5 | |||
| Soft drink bottling plants |
4 | |||
| Grocery/prepared food plants |
2 | |||
| Ice cream plants |
2 | |||
| Cake commissary |
1 | |||
| Ice plant |
1 | |||
|
|
|
|||
| Total |
21 | |||
|
|
|
|||
In addition, we operate laboratory facilities for quality assurance and research and development in certain plants and at our corporate offices.
124
Table of Contents
Marketing, Advertising and Online Sales
Our marketing efforts involve collaboration between our national marketing and merchandising team and local divisions and stores. We augment the local division teams with corporate resources and are focused on providing expertise, sharing best practices and leveraging scale in partnership with leading consumer packaged goods vendors. Our corporate teams support divisions by providing strategic guidance in order to drive key areas of our business, including pharmacy, general merchandise and our own brands. Our local marketing teams set brand strategy and communicate brand messages through our integrated digital and physical marketing and advertising channels. Our online ordering platform, www.safeway.com, was the third largest in the United States based on 2013 sales.
Relationship with SuperValu
Transition Services Agreements with SuperValu
Services. Currently, SuperValu provides certain business support services to Albertsons and NAI pursuant to the SVU TSAs. The services provided by SuperValu to Albertsons and NAI include back office, administrative, IT, procurement, insurance and accounting services. Albertsons provides records management and retention services and environmental services to SuperValu, and also provides office space to SuperValu at our Boise offices. NAI provides pharmacy services to SuperValu.
Fees. Albertsons’ and NAI’s fees under the SVU TSAs are 50% fixed and 50% variable, and are determined in part based on the number of stores and distribution centers receiving services, which number can be reduced by Albertsons and by NAI at any time upon five weeks’ notice, with a corresponding reduction in the variable portion of the fees due to SuperValu.
Albertsons, in its capacity as a recipient of services from SuperValu, paid total fees of $104.6 million for fiscal 2014. The expected fee due to SuperValu for fiscal 2015 is $91.3 million, $10 million of which was paid in advance. SuperValu reimburses Albertsons’ monthly expenses incurred in connection with providing office space to SuperValu at our Boise offices, as well as fees for records management and retention services, and environmental services.
NAI, in its capacity as a recipient of services from SuperValu, paid total fees of $86.2 million for fiscal 2014. The expected fee due to SuperValu for fiscal 2015 is $90.8 million, $10 million of which was paid in advance, exclusive of amounts payable with respect to acquired A&P stores. SuperValu pays NAI fees based on the number of operating SuperValu pharmacies receiving services.
Term. The provision of services commenced in March 2013 and terminates on September 21, 2016. Each of SuperValu, Albertsons and NAI has nine remaining one-year consecutive options to extend the term for receipt of services under the SVU TSAs, exercisable one year in advance. We have exercised our right to renew the term of the SVU TSAs through September 21, 2017.
Transition and Wind Down of SuperValu TSA Services
We are in the process of converting our Albertsons and NAI stores, distribution centers and systems to Safeway’s IT systems and, in April 2015, we reached an agreement with SuperValu for its support of our implementation of this IT conversion. Specifically, we have agreed to pay SuperValu $50 million in the aggregate, subject to certain conditions, by November 1, 2018 to support the transition and wind down of the SVU TSAs, including the transition of services supporting Albertsons and NAI stores, distribution centers, divisions, back office, general office, surplus properties and other functions and facilities. We also agreed with SuperValu to negotiate in good faith if either the costs associated with the transition and wind down services are materially higher (i.e., 5% or more) than anticipated, or SuperValu is not performing in all material respects the transition and wind down services as needed to support our transition and wind down activities.
125
Table of Contents
SuperValu—Albertsons and NAI Trademark Cross Licenses
In March 2013, NAI and Albertsons each entered into a trademark cross licensing agreement with SuperValu, pursuant to which each party granted the other a non-exclusive, royalty-free license to use certain proprietary rights (e.g., trademarks, trade names, trade dress, service marks, banners, etc.) consistent with the parties’ past practices and uses of the relevant proprietary rights. The cross license agreements will each remain in effect for so long as and to the extent that either party to the cross-license agreements owns any of the proprietary rights subject to the agreements.
Lancaster Operating and Supply Agreement
In March 2013, NAI entered into an operating and supply agreement with SuperValu for the operation of, and supply of products from, the distribution center located in the Lancaster, Pennsylvania area (the “Lancaster Agreement”). Under the Lancaster Agreement, NAI owns the Lancaster distribution center and SuperValu manages and operates the distribution center on behalf of NAI. In addition, SuperValu supplies NAI’s Acme and Shaw’s stores from the distribution center under a shared costs arrangement, allocating costs ratably based on each parties’ use of the distribution center. Unless earlier terminated, the initial term of the Lancaster Agreement continues until March 21, 2018. Subject to either party’s right to terminate the Lancaster Agreement for any reason and without cause upon 24 months’ notice (provided that NAI cannot give a termination notice prior to May 28, 2016), SuperValu may extend the term of the agreement for up to two consecutive periods of five years each. For fiscal 2014, NAI paid SuperValu approximately $1,154 million under the Lancaster Agreement.
Capital Expenditure Program
Our capital expenditure program funds new stores, remodels, distribution facilities and IT. We apply a disciplined approach to our capital investments, undertaking a rigorous cost-benefit analysis and targeting an attractive return on investment. In fiscal 2015, we expect to spend approximately $850 million for capital expenditures, or 1.5% of our fiscal 2014 sales on a pro forma basis, including 115 remodel and upgrade projects and excluding approximately $300 million of initial Safeway-related integration-related capital expenditures in fiscal 2015, in advance of anticipated sales of surplus assets. This amount excludes approximately $126 million of initial opening and transition costs and capital expenditures that we expect to spend by the end of fiscal 2016 to remodel and remerchandise the stores and to invest in price and labor related to the A&P Transaction, and approximately $47 million of initial opening and transition costs and capital expenditures that we expect to spend by the end of fiscal 2016 to replace equipment and stock the 29 stores being acquired from Haggen.
Trade Names and Trademarks
We have invested significantly in the development and protection of “Albertsons” and “Safeway” as both trade names and as trademarks, and consider each to be an important business asset. We also own or license more than 650 other trademarks registered and/or pending in the United States Patent and Trademark Office and other jurisdictions, including trademarks for products and services such as Essential Everyday, Wild Harvest, Baby Basics, Steakhouse Choice, Culinary Circle, Safeway, Safeway SELECT, Rancher’s Reserve, O Organics, Lucerne, Primo Taglio, Deli Counter, Eating Right, mom to mom, waterfront BISTRO, Bright Green, Pantry Essentials, Open Nature, Refreshe, Snack Artist, Signature Café, Signature Care, Signature Farms, Signature Kitchens, Signature Home, Signature SELECT, Priority, just for U, My Simple Nutrition, Ingredients for Life and other trademarks such as United Express, United Supermarkets, Amigos, Market Street, Lucky, Pak’N Save Foods, Vons, Pavilions, Randalls, Tom Thumb, Carrs Quality Centers, ACME, Sav-On, Shaw’s, Star Market, Super Saver and Jewel-Osco.
Seasonality
Our business is generally not seasonal in nature.
126
Table of Contents
Competition
The food and drug retail industry is highly competitive. The principal competitive factors that affect our business are location, quality, price, service, selection and condition of assets such as our stores.
We face intense competition from other food and/or drug retailers, supercenters, club stores, online providers, specialty and niche supermarkets, drug stores, general merchandisers, wholesale stores, discount stores, convenience stores and restaurants. We and our competitors engage in price and non-price competition which, from time to time, has adversely affected our operating margins.
For more information on the competitive pressures that we face, see “Risk Factors—Risks Related to Our Business and Industry—Competition in our industry is intense, and our failure to compete successfully may adversely affect our profitability and results of operations.”
Raw Materials
Various agricultural commodities constitute the principal raw materials used by the company in the manufacture of its food products. We believe that raw materials for our products are not in short supply, and all are readily available from a wide variety of independent suppliers.
Environmental Laws
Our operations are subject to regulation under environmental laws, including those relating to waste management, air emissions and underground storage tanks. In addition, as an owner and operator of commercial real estate, we may be subject to liability under applicable environmental laws for clean-up of contamination at our facilities. Compliance with, and clean-up liability under, these laws has not had and is not expected to have a material adverse effect upon our business, financial condition, liquidity or operating results. See “—Legal Proceedings” and “Risk Factors—Risks Related to Our Business and Industry—Unfavorable changes in, failure to comply with or increased costs to comply with environmental laws and regulations could adversely affect us. The storage and sale of petroleum products could cause disruptions and expose us to potentially significant liabilities.”
Employees
As of February 28, 2015 and excluding the effect of divestitures, we employed approximately 265,000 full- and part-time employees, of which approximately 174,000 were covered by collective bargaining agreements. During fiscal 2014, collective bargaining agreements covering approximately 50,000 employees were renegotiated. During fiscal 2015, 233 collective bargaining agreements covering approximately 73,000 employees are scheduled to expire. We believe that our relations with our employees are good.
Legal Proceedings
We are subject from time to time to various claims and lawsuits arising in the ordinary course of business, including lawsuits involving trade practices, lawsuits alleging violations of state and/or federal wage and hour laws (including alleged violations of meal and rest period laws and alleged misclassification issues), real estate disputes and other matters. Some of these suits purport or may be determined to be class actions and/or seek substantial damages.
It is our management’s opinion that although the amount of liability with respect to certain of the matters described herein cannot be ascertained at this time, any resulting liability of these and other matters, including any punitive damages, will not have a material adverse effect on our business or financial condition.
127
Table of Contents
In the second quarter of 2014, Safeway received two subpoenas from the DEA concerning its record keeping, reporting and related practices associated with the loss or theft of controlled substances. We are not a party to any pending DEA administrative or judicial proceeding arising from or related to these subpoenas. We are cooperating with the DEA in all investigative matters.
In June 2014, Albertson’s LLC agreed to settle a California civil enforcement action involving allegations of illegal disposal, storage, reverse logistic transportation and mismanagement of hazardous waste in violation of the California Hazardous Waste Control laws. Albertson’s LLC did not admit fault or liability in the settlement agreement and agreed to pay $3.4 million, which includes civil penalties, the cost of the investigation and funding for supplemental environmental projects in California. As part of the settlement, Albertson’s LLC also agreed to implement an improved retail hazardous product waste program, to create new, enhanced compliance programs and to provide an annual status report to the specified agencies for five years. The settlement pertains to all Albertson’s LLC retail and warehouse facilities in California.
In January 2015, Safeway Inc. agreed to settle a California enforcement action involving allegations of illegal disposal, storage, reverse logistic transportation and mismanagement of hazardous waste in violation of the California Hazardous Waste Control laws. Safeway did not admit fault or liability in the settlement agreement and agreed to pay $9.9 million, which includes civil penalties, the cost of investigation and funding for supplemental environmental projects in California. As part of the settlement, Safeway also agreed to continue certain compliance activities with respect to both potential hazardous waste and private health information and to provide an annual status report to the specified agencies for five years. The settlement pertains to all Safeway retail and warehouse facilities in California.
On August 14, 2014, we announced that we had experienced a criminal intrusion by installation of malware on a portion of our computer network that processes payment card transactions for retail store locations for our Shaw’s, Star Market, Acme, Jewel-Osco and Albertsons retail banners. On September 29, 2014, we announced that we had experienced a second and separate criminal intrusion. We believe these were attempts to collect payment card data. Relying on our IT service provider, SuperValu, we took immediate steps to secure the affected part of the network. We believe that we have eradicated the malware used in each intrusion. We notified federal law enforcement authorities, the major payment card networks, and our insurance carriers and are cooperating in their efforts to investigate these intrusions. As required by the payment card brands, we retained a firm to conduct a forensic investigation into the intrusions. The forensic firm has issued separate reports for each intrusion (copies of which have been provided to the card networks). Although our network had previously been found to be compliant with PCI DSS, in both reports the forensic firm found that not all of these standards had been met, and some of this non-compliance may have contributed to or caused at least some portion of the compromise that occurred during the intrusions. We believe it is probable that the payment card networks will make claims against us. These claims will likely include amounts for incremental counterfeit fraud losses and non-ordinary course operating expenses (such as card reissuance costs) that the payment card networks assert they or their issuing banks have incurred. If the payment card networks assert claims against us, we currently intend to dispute those claims and assert available defenses. At the present time, we believe that it is probable that we will incur a loss in connection with the potential claims from the payment card networks. We have recorded an estimated liability for probable losses that we expect to incur in connection with the potential claims to be made by the payment card networks. The estimated liability is based on information currently available to us and may change as new information becomes available or when the payment card networks assert their claims against us. We will continue to evaluate information as it becomes known and will record an estimate of loss when it is both probable that a loss has been incurred and the amount of the loss is reasonably estimable. Currently, the potential range of any loss above our currently recorded amount cannot be reasonably estimated given no claims have yet been asserted and because significant factual and legal issues remain unresolved. On
128
Table of Contents
October 20, 2015, we agreed with one of our third-party payment card administrators to post a $15 million letter of credit to cover potential fines and penalties from certain card brands and to maintain a minimum level of card processing until the potential claims from the card brands are resolved. As a result of the criminal intrusions, two class action complaints were filed against us by consumers and are currently pending, Mertz v. SuperValu Inc. et al. filed in federal court in the state of Minnesota and Rocke v. SuperValu Inc. et al. filed in federal court in the state of Idaho, alleging deceptive trade practices, negligence and invasion of privacy. Plaintiffs seek unspecified damages. The Judicial Panel on Multidistrict Litigation has consolidated the class actions and transferred the cases to the District of Minnesota. On August 10, 2015, we joined SuperValu to file a motion to dismiss the class actions, which remains pending. Based on the proceedings to date, we are unable to determine the probability of the outcome of this matter or the range of reasonably possible loss, if any. On October 6, 2015, we received a letter from the Office of Attorney General of the Commonwealth of Pennsylvania stating that the Illinois and Pennsylvania Attorneys General Offices are leading a multistate group that includes the Attorneys General for 14 other states requesting specified information concerning the two data breach incidents. We are in the process of providing the requested information.
On August 18, 2001, a group of truck drivers from Safeway’s Tracy, California distribution center filed an action in California Superior Court, San Joaquin County entitled Cicairos, et al. v. Summit Logistics, alleging that Summit Logistics, the entity with whom Safeway contracted to operate the distribution center until August 2003, failed to provide meal periods, rest periods and itemized wage statements to the drivers in violation of California state law. Under its contract with Summit Logistics, Safeway is obligated to defend and indemnify Summit Logistics in this lawsuit. On February 6, 2007, another group of truck drivers from the Tracy distribution center filed a similar action in the same court, entitled Bluford, et al. v. Safeway Inc., alleging essentially the same claims against Safeway. Both cases were subsequently certified as class actions. After lengthy litigation in the trial and appellate courts, on February 20, 2015, the parties signed a preliminary agreement of settlement that calls for us to pay approximately $31 million in total. This amount consists of a settlement fund of $30.2 million, out of which will be paid relief to the class, and attorneys’ fees and costs as awarded by the court. In addition to this settlement fund, we will pay interest of $10,000 if the distribution to the class is made in August 2015, with additional monthly amounts of interest if made after August 2015. We will also pay third-party settlement administrator costs, and our employer share of FICA/Medicare taxes. The motion for preliminary court approval of the settlement has been granted. Class members were notified of their right to file objections to the settlement or opt out of the settlement. No class members filed an objection or opted out by the June 15, 2015 deadline. The court approved the settlement and entered final judgment on August 4, 2015, and the settlement has become final. Accordingly, the required settlement fund payment of $30.2 million was made on October 16, 2015. During the third quarter, we will pay settlement administration fees of $23,000 and the employer share FICA/Medicare taxes of approximately $1 million.
On June 17, 2011, a customer of Safeway’s home delivery business (safeway.com) filed a class action complaint in the United States District Court for the Northern District of California entitled Rodman v. Safeway Inc., alleging that Safeway had inaccurately represented on its home delivery website that the prices paid there were the same as the prices in the brick-and-mortar retail store. Rodman asserted claims for breach of contract and unfair business practices under California law. The court certified a class for the breach of contract claim, but denied class treatment for the California business practices claims. On December 10, 2014, the court ruled that the terms and conditions on Safeway’s website should be construed as creating a contractual promise that prices on the website would be the same as in the stores and that Safeway had breached the contract by charging more on the website. On August 31, 2015, the court denied Safeway’s affirmative defenses and arguments for limiting liability, and determined that website registrants since 2006 were entitled to approximately $31 million in damages (which amount is expected to be reduced to $23.1 million to correct an error in the court’s calculation), plus prejudgment interest. The court has set a trial date of December 7, 2015 to determine whether pre-
129
Table of Contents
2006 registrants are entitled to any recovery. The company has established an estimated liability for these claims, but continues to contest both liability and damages for the remaining claims in the trial court, and expects to contest the other issues on appeal.
On June 29, 2015, counsel for Haggen delivered a notice of claims to Albertson’s LLC and Albertson’s Holdings LLC asserting that those companies had committed fraud and breached the Asset Purchase Agreement under which Haggen purchased 146 divested stores by improperly transferring inventory out of purchased stores, overstocking and understocking inventory, failing to advertise in the ordinary course of business, misusing confidential information and failing to use commercially reasonably efforts to preserve existing relationships. Haggen made no specific monetary demands, but withheld payment of approximately $41.1 million due for purchased inventory at 38 stores on the basis of these allegations. On July 17, 2015, Albertson’s LLC and Albertson’s Holdings LLC commenced a lawsuit against Haggen in the Superior Court of Los Angeles County, alleging claims for breach of contract and fraud arising out of Haggen’s failure to pay the approximately $41.1 million due for the purchased inventory. On July 20, 2015, an essentially identical complaint was filed in the Superior Court of the State of Delaware in and for New Castle County. On August 26, 2015, we voluntarily dismissed the action we had commenced in Superior Court in Los Angeles County. On September 1, 2015, Haggen commenced a lawsuit against Albertson’s LLC and Albertson’s Holdings LLC in the United States District Court for the District of Delaware, alleging claims for violation of Section 7 of the Clayton Act, attempted monopolization under the Sherman Act, breach of contract, indemnification, breach of implied covenant of good faith and fair dealing, fraud, unfair competition, misappropriation of trade secrets under the Uniform Trade Secrets Acts, conversion and violation of the Washington Consumer Protection Act. In the complaint, Haggen alleged that we, among other actions set out in the complaint, misused Haggen’s confidential information to draw customers away from Haggen stores, provided inaccurate, incomplete and misleading inventory data and pricing information on products transferred to Haggen, deliberately understocked and overstocked inventory in stores acquired by Haggen and wrongfully cut off advertising prior to the transfer of the stores to Haggen. Furthermore, Haggen alleged that, if it is destroyed as a competitor, its damages may exceed $1 billion, and asserted it is entitled to treble and punitive damages and to seek rescission of the asset purchase agreement. Haggen has further moved to transfer the lawsuit we commenced in Superior Court of the State of Delaware to the United States District Court for the District of Delaware. Our Delaware state court case is now stayed due to Haggen’s Chapter 11 bankruptcy case. In addition, On September 17, 2015, we received a letter from the legal counsel of another purchaser of a small number of our FTC-mandated divested stores, alleging claims similar to those presented in Haggen’s lawsuit. We believe that the claims asserted by Haggen and the additional purchaser are without merit and intend to vigorously defend against the claims. Based on the proceedings to date, we are unable to determine the probability of the outcome of this matter or the range of reasonably possible loss, if any. An unfavorable resolution of the litigation could subject us to significant liabilities.
In connection with the Safeway acquisition, certain holders of Safeway common stock, who held approximately 17.7 million shares of common stock, gave notice of their right under Section 262 of the DGCL to exercise appraisal rights. Five petitions for appraisal were filed in the Court of Chancery of the State of Delaware on behalf of all former holders of Safeway common stock who had demanded appraisal. The petitions for appraisal were consolidated in April 2015. In May 2015, we reached a settlement with respect to five of the seven petitioners, representing approximately 14.0 million shares of Safeway common stock, pursuant to which the former stockholders dismissed their claims and received a total of $44.00 in cash and one Casa Ley CVR for each share of Safeway common stock they owned.
The appraisal action is ongoing with respect to the two remaining petitioners, with trial on the merits set to commence in April 2016. These remaining petitioners, representing approximately 3.7 million shares of Safeway common stock, have previously accepted a tender offer of the cash
130
Table of Contents
portion of the merger consideration of $34.92 per share, which stops statutory interest from accruing on any recovery of that amount. A reserve for outstanding appraisal claims has been established by the company. If the remaining petitioners are successful, they could be entitled to more for their stock than the per share merger consideration paid in the Safeway acquisition, which amount may be in excess of the accounting reserve that we have established.
131
Table of Contents
Executive Officers and Directors
The following table sets forth information regarding our board of directors and executive officers upon completion of this offering.
| Name |
Age† | Position | ||
| Robert G. Miller |
71 | Chairman and Chief Executive Officer | ||
| Wayne A. Denningham |
54 | Chief Operating Officer | ||
| Justin Dye |
43 | Chief Administrative Officer | ||
| Shane Sampson |
51 | Chief Marketing and Merchandising Officer | ||
| Robert B. Dimond |
54 | Executive Vice President and Chief Financial Officer | ||
| Justin Ewing |
47 | Executive Vice President, Corporate Development and Real Estate | ||
| Robert A. Gordon |
63 | Executive Vice President, General Counsel and Secretary | ||
| Kelly P. Griffith |
51 | Executive Vice President of Operations, West Region | ||
| Jim Perkins |
52 | Executive Vice President of Operations, East Region | ||
| Andrew J. Scoggin |
53 | Executive Vice President, Human Resources, Labor Relations, Public Relations and Government Affairs | ||
| Dean S. Adler(a) |
58 | Director | ||
| Sharon L. Allen*(a)(b) |
63 | Director | ||
| Steven A. Davis*(c)(d) |
57 | Director | ||
| Kim Fennebresque*(b)(d) |
65 | Director | ||
| Lisa A. Gray(a)(c) |
60 | Director | ||
| Hersch Klaff(c) |
61 | Director | ||
| Ronald Kravit(c) |
58 | Director | ||
| Alan Schumacher*(d) |
69 | Director | ||
| Jay L. Schottenstein |
61 | Director | ||
| Lenard B. Tessler(a)(b) |
63 | Lead Director | ||
| Scott Wille |
34 | Director |
| † | As of September 12, 2015 |
| * | Independent Director |
| (a) | Member, Nominating and Corporate Governance Committee |
| (b) | Member, Compensation Committee |
| (c) | Member, Compliance Committee |
| (d) | Member, Audit and Risk Committee |
Executive Officer and Director Biographies
Robert G. Miller, Chairman and Chief Executive Officer. Mr. Miller has served as our Chairman and Chief Executive Officer since April 2015 and has served as a member of our board of directors since 2006. Mr. Miller previously served as our Executive Chairman from January 2015 to April 2015, and as Chief Executive Officer from June 2006 to January 2015. Mr. Miller has over 50 years of retail food and grocery experience. Mr. Miller previously served as Chairman and Chief Executive Officer of Fred Meyer Inc. and Rite Aid Corp. He is the former Vice Chairman of Kroger and former Chairman of Wild Oats Markets, Inc., a nationwide chain of natural and organic food markets. Earlier in his career, Mr. Miller served as Executive Vice President of Operations of Albertson’s, Inc. Mr. Miller is a current or former board member of Nordstrom Inc., JoAnn Fabrics, Harrah’s Entertainment Inc. and the Jim Pattison Group, Inc. Mr. Miller has detailed knowledge and valuable perspective and insights regarding our business and has responsibility for the development and implementation of our business strategy.
132
Table of Contents
Wayne A. Denningham, Chief Operating Officer. Mr. Denningham has been our Chief Operating Officer since April 2015. Mr. Denningham is also a member of the Office of the CEO, a group that reports directly to, and meets frequently with, our Chief Executive Officer to discuss the development and implementation of our business strategy as well as operations, administration and marketing and merchandising priorities. Previously, he served as our Executive Vice President and Chief Operating Officer, South Region, from January 2015 to April 2015 and President of our Southern California division from March 2013 to January 2015. From 2006 to March 2013, he led Albertson’s LLC’s Rocky Mountain, Florida and Southern divisions. Mr. Denningham began his career with Albertson’s, Inc. in 1977 as a courtesy clerk and served in a variety of positions with the company, including Executive Vice President of Marketing and Merchandising and Executive Vice President of Operations and Regional President.
Justin Dye, Chief Administrative Officer. Mr. Dye has been our Chief Administrative Officer since February 2015. Mr. Dye is a member of the Office of the CEO. Mr. Dye joined Albertson’s LLC as Chief Strategy Officer in 2006 and served as Chief Operating Officer of NAI from March 2013 until February 2015. Prior to joining Albertson’s LLC in 2006, Mr. Dye served as an executive at Cerberus, in various roles at General Electric, and as a consultant at Arthur Andersen.
Shane Sampson, Chief Marketing and Merchandising Officer. Mr. Sampson has been our Chief Marketing and Merchandising Officer since April 2015. Mr. Sampson is a member of the Office of the CEO. Previously, Mr. Sampson served as our Executive Vice President, Marketing and Merchandising from January 2015 to April 2015. He previously served as President of NAI’s Jewel-Osco division from March 2014 to January 2015. Previously, in 2013, Mr. Sampson led NAI’s Shaw’s and Star Market’s management team. Prior to joining NAI, Mr. Sampson served as Senior Vice President of Operations at Giant Food, a regional American supermarket chain and division of Ahold USA, from 2009 to January 2013. He has over 35 years of experience in the grocery industry at several chains, including roles as Vice President of Merchandising and Marketing and President of numerous Albertson’s, Inc. divisions.
Robert B. Dimond, Executive Vice President and Chief Financial Officer. Mr. Dimond has been our Chief Financial Officer since February 2014. Prior to joining our company, Mr. Dimond previously served as Executive Vice President, Chief Financial Officer and Treasurer at Nash Finch Co., a food distributor, from 2007 to 2013. Mr. Dimond has over 26 years of financial and senior executive management experience in the retail food and distribution industry. Mr. Dimond has served as Chief Financial Officer and Senior Vice President of Wild Oats, Group Vice President and Chief Financial Officer for the western region of Kroger, Group Vice President and Chief Financial Officer of Fred Meyer, Inc. and as Vice President, Administration and Controller for Smith’s Food and Drug Centers Inc., a regional supermarket chain. Mr. Dimond is a Certified Public Accountant.
Justin Ewing, Executive Vice President, Corporate Development and Real Estate. Mr. Ewing has been our Executive Vice President of Corporate Development and Real Estate since January 2015. Previously, Mr. Ewing had served as Albertson’s LLC’s Senior Vice President of Corporate Development and Real Estate since 2013, as its Vice President of Real Estate and Development since 2011 and its Vice President of Corporate Development since 2006, when Mr. Ewing originally joined Albertson’s LLC from the operations group at Cerberus. Prior to his work with Cerberus, Mr. Ewing was with Trowbridge Group, a strategic sourcing firm. Mr. Ewing also spent over 13 years with PricewaterhouseCoopers LLP. Mr. Ewing is a Chartered Accountant with the Institute of Chartered Accountants of England and Wales.
Robert A. Gordon, Executive Vice President, General Counsel and Secretary. Mr. Gordon has been our Executive Vice President, General Counsel and Secretary since January 2015. Previously, he served as Safeway’s General Counsel from June 2000 to January 2015 and as Chief Governance
133
Table of Contents
Officer since 2004, Safeway’s Secretary since 2005 and as Safeway’s Deputy General Counsel from 1999 to 2000. Prior to joining Safeway, Mr. Gordon was a partner at the law firm Pillsbury Winthrop from 1984 to 1999.
Kelly P. Griffith, Executive Vice President of Operations, West Region. Mr. Griffith has been our Executive Vice President of Operations, West Region, since March 2015. Previously, Mr. Griffith served as our Executive Vice President and Chief Operating Officer, North Region from January 2015 to March 2015 and as Safeway’s Executive Vice President, Retail Operations from March 2013 to January 2015. From May 2010 to March 2013, Mr. Griffith was President of Merchandising for Safeway. From April 2008 until May 2010, Mr. Griffith served as President and General Manager, Perishables for Safeway. Mr. Griffith previously served as President of the Portland division of Safeway and as its Corporate Senior Vice President of Produce and Floral Divisions.
Jim Perkins, Executive Vice President of Operations, East Region. Mr. Perkins has been our Executive Vice President of Operations, East Region since April 2015. He served as President of NAI’s Acme Markets division from March 2013 to April 2015. Previously, he served as regional Vice President of Giant Food, a regional American supermarket chain, from 2009 to 2013. He began his career with Albertson’s, Inc. as a clerk in 1982. Mr. Perkins served in roles of increasing responsibility, ultimately being named Vice President of Operations for Albertson’s, Inc. In 2006, Mr. Perkins joined Albertson’s LLC’s southern division as Director of Operations.
Andrew J. Scoggin, Executive Vice President, Human Resources, Labor Relations, Public Relations and Government Affairs. Mr. Scoggin has served as our current Executive Vice President, Human Resources, Labor Relations, Public Relations and Government Affairs since January 2015. Mr. Scoggin has also served as Executive Vice President, Human Resources, Labor Relations and Public Relations for Albertson’s LLC since March 2013, and served as the Senior Vice President, Human Resources, Labor Relations and Public Relations for Albertson’s LLC from June 2006 to March 2013. Mr. Scoggin joined Albertson’s, Inc. in the Labor Relations and Human Resources department in 1993. Prior to that time, Mr. Scoggin practiced law with a San Francisco Bay Area law firm.
Dean S. Adler, Director. Mr. Adler has been a member of our board of directors since 2006. Mr. Adler is CEO of Lubert-Adler, which he co-founded in 1997. Mr. Adler has served on the board of directors of Bed Bath & Beyond Inc., a nationwide retailer of domestic goods, since 2001, and previously served on the board of directors for Developers Diversified Realty Corp., a shopping center real estate investment trust, and Electronics Boutique, Inc., a mall retailer. Mr. Adler’s extensive experience in the retail and real estate industries, as well as his extensive knowledge of our company, provides valuable insight to our board of directors in industries critical to our operations.
Sharon L. Allen, Director. Ms. Allen has been a member of our board since June 2015. Ms. Allen served as U.S. Chairman of Deloitte LLP from 2003 to 2011, retiring from that position in May 2011. Ms. Allen was also a member of the Global Board of Directors, Chair of the Global Risk Committee and U.S. Representative of the Global Governance Committee of Deloitte Touche Tohmatsu Limited from 2003 to May 2011. Ms. Allen worked at Deloitte for nearly 40 years in various leadership roles, including partner and regional managing partner, and was previously responsible for audit and consulting services for a number of Fortune 500 and large private companies. Ms. Allen is currently an independent director of Bank of America Corporation. Ms. Allen has also served as a director of First Solar, Inc. since 2013. Ms. Allen is a Certified Public Accountant (Retired). Ms. Allen’s extensive leadership, accounting and audit experience broadens the scope of our board of directors’ oversight of our financial performance and reporting and provides our board of directors with valuable insight relevant to our business.
134
Table of Contents
Steven A. Davis, Director. Mr. Davis has been a member of our board since June 2015. Mr. Davis is the former Chairman and Chief Executive Officer of Bob Evans Farms, Inc., a foodservice and consumer products company, where he served from May 2006 to December 2014. Mr. Davis has also served as a director of Marathon Petroleum Corporation, a petroleum refiner, marketer, retailer and transporter, since 2013, Walgreens Boots Alliance, Inc. (formerly Walgreens Co.), a pharmacy-led wellbeing enterprise, from 2009 to 2015, and CenturyLink, Inc. (formerly Embarq Corporation), a provider of communication services, from 2006 to 2009. Prior to joining Bob Evans Farms, Inc. in 2006, Mr. Davis served in a variety of restaurant and consumer packaged goods leadership positions, including president of Long John Silver’s LLC and A&W All-American Food Restaurants. In addition, he held executive and operational positions at Yum! Brands, Inc.’s Pizza Hut division and at Kraft General Foods Inc. Mr. Davis brings to our board of directors extensive leadership experience. In particular, Mr. Davis’ leadership of retail and food service companies and pharmacies provides our board of directors with valuable insight relevant to our business.
Kim Fennebresque, Director. Mr. Fennebresque has been a member of our board of directors since March 2015. Mr. Fennebresque has served as a senior advisor to Cowen Group Inc., a diversified financial services firm, since 2008, where he also served as its chairman, president and chief executive officer from 1999 to 2008. He has served on the boards of directors of Ally Financial Inc., a financial services company, since May 2009, BlueLinx Holdings Inc., a distributor of building products, since May 2013 and Delta Tucker Holdings, Inc. (the parent of DynCorp International, a provider of defense and technical services and government outsourced solutions) since May 2015. From 2010 to 2012, Mr. Fennebresque served as chairman of Dahlman Rose & Co., LLC, an investment bank. He has also served as head of the corporate finance and mergers & acquisitions departments at UBS and was a general partner and co-head of investment banking at Lazard Frères & Co. He has also held various positions at First Boston Corporation, an investment bank acquired by Credit Suisse. Mr. Fennebresque’s extensive experience as a director of several public companies and history of leadership in the financial services industry brings corporate governance expertise and a diverse viewpoint to the deliberations of our board of directors.
Lisa A. Gray, Director. Ms. Gray has been member of our board of directors since July 2014. Ms. Gray has served as Vice Chairman of Cerberus Operations and Advisory Company, LLC (“COAC”), an affiliate of Cerberus, since May 2015, and has served as General Counsel of COAC since 2004. Prior to joining Cerberus in 2004, she served as Chief Operating Executive and General Counsel for WAM!NET Inc., a provider of content hosting and distribution solutions, from 1996 to 2004. Prior to that, she was a partner at the law firm of Larkin, Hoffman, Daly & Lindgren, Ltd from 1986 to 1996. Ms. Gray serves as Vice Chairman and General Counsel of COAC, an affiliate of our largest beneficial owner, and has extensive experience and familiarity with us. In addition, Ms. Gray has extensive legal and corporate governance skills which broadens the scope of our board of directors’ experience.
Hersch Klaff, Director. Mr. Klaff has served as a member of our board of directors since 2010. Mr. Klaff is the Chief Executive Officer of Klaff Realty, which he formed in 1984. Mr. Klaff began his career with the public accounting firm of Altschuler, Melvoin and Glasser in Chicago and is a Certified Public Accountant. Mr. Klaff’s real estate expertise and accounting and investment experience, as well as his extensive knowledge of our company, broadens the scope of our board of directors’ oversight of our financial performance.
Ronald Kravit, Director. Mr. Kravit has served as a member of our board of directors since 2006. Mr. Kravit is currently a Senior Managing Director and head of real estate investing at Cerberus, which he joined in 1996. Mr. Kravit has currently or previously served on the boards of Chrysler Financial Services Americas LLC, a financial services company, LNR Property LLC, a diversified real
135
Table of Contents
estate investment company, and Residential Capital LLC, a real estate finance company. Mr. Kravit joined Cerberus in 1996. Prior to joining Cerberus, Mr. Kravit was a Managing Director at Apollo Real Estate Advisors, L.P., a real estate investment firm, from 1994 to 1996. Prior to his tenure at Apollo, Mr. Kravit was a Managing Director at G. Soros Realty Advisors/Reichmann International, an affiliate of Soros Fund Management, from 1993 to 1994. Mr. Kravit is a Certified Public Accountant. Mr. Kravit’s experience in the real estate and financial services industries, and his extensive knowledge of our company, provides valuable insight to our board of directors.
Alan Schumacher, Director. Alan H. Schumacher has served as a member of our board of directors since March 2015. He has currently or previously served as a director of BlueLinx Holdings Inc., a distributor of building products, Evertec Inc., a full-service transaction processing business in Latin America, School Bus Holdings Inc., an indirect parent of school-bus manufacturer Blue Bird Corporation, Quality Distribution Inc., a chemical bulk tank truck operator, and Noranda Aluminum Holding Corporation, a producer of aluminum. Mr. Schumacher was a member of the Federal Accounting Standards Advisory Board from 2002 through June 2012. The board of directors has determined that the simultaneous service on more than three audit committees of public companies by Mr. Schumacher does not impair his ability to serve on our audit and risk committee nor does it represent or in any way create a conflict of interest for our company. Mr. Schumacher’s experience as a board director of several public companies, and his deep understanding of accounting principles, provides our board of directors with experience to oversee our accounting and financial reporting.
Jay Schottenstein, Director. Mr. Schottenstein has served as a member of our board of directors since 2006. Mr. Schottenstein has served as interim Chief Executive Officer of American Eagle Outfitters, Inc. (“American Eagle”), an apparel and accessories retailer, since January 2014 and as Chairman of their board of directors since March 1992. Mr. Schottenstein previously served as Chief Executive Officer of American Eagle from March 1992 until December 2002. He has also served as Chairman of the Board and Chief Executive Officer of Schottenstein Stores since March 1992 and as president since 2001. Mr. Schottenstein also served as chief executive officer of DSW, Inc., a footwear and accessories retailer, from March 2005 to April 2009, and as chairman of the board of directors of DSW since March 2005. Mr. Schottenstein’s experience as a chief executive officer and a director of other major publically-owned retailers, and his prior experience as a member of our board of directors, gives him and our board of directors valuable knowledge and insight to oversee our operations.
Lenard B. Tessler, Lead Director. Mr. Tessler has served as a member of our board of directors since 2006. Mr. Tessler is currently Co-Head of Global Private Equity and Senior Managing Director at Cerberus, which he joined in 2001. Prior to joining Cerberus, Mr. Tessler served as Managing Partner of TGV Partners, a private equity firm that he founded, from 1990 to 2001. From 1987 to 1990, he was a founding partner of Levine, Tessler, Leichtman & Co. From 1982 to 1987, he was a founder, Director and Executive Vice President of Walker Energy Partners. Mr. Tessler is a member of the Cerberus Capital Management Investment Committee. Mr. Tessler’s leadership roles at our largest beneficial owner, his board service and his extensive experience in financing and private equity investments and his in-depth knowledge of our company and its acquisition strategy, provides critical skills for our board of directors to oversee our strategic planning and operations.
Scott Wille, Director. Mr. Wille has served as a member of our board of directors since January 2015. Mr. Wille has served as a Managing Director at Cerberus since March 2014, where he previously served as a Vice President since 2009. Mr. Wille joined Cerberus in 2006 as an Associate. Prior to joining Cerberus, Mr. Wille worked in the leveraged finance group at Deutsche Bank Securities Inc. from 2004 to 2006. Mr. Wille has served as a director of Remington Outdoor Company, Inc., a designer, manufacturer and marketer of firearms, ammunition and related products, since February 2014 and Keane Group Holdings, LLC, a provider of hydraulic fracturing, wireline technologies and drilling services, since 2011. Mr. Wille previously served as a director of Tower International, Inc., a manufacturer of engineered
136
Table of Contents
structural metal components and assemblies, from September 2010 to October 2012. Mr. Wille serves as Managing Director of our largest beneficial owner, and his experience in the financial and private equity industries, and his in-depth knowledge of our company and its acquisition strategy, are valuable to our board of directors’ understanding of our business and financial performance.
Board of Directors
Family Relationships
None of our officers or directors has any family relationship with any director or other officer. “Family relationship” for this purpose means any relationship by blood, marriage or adoption, not more remote than first cousin.
Board Composition
Our business and affairs are currently managed under the limited liability company board of managers of AB Acquisition. Upon the consummation of the IPO-Related Transactions, prior to the effectiveness of the registration statement of which this prospectus forms a part, the members of the AB Acquisition board of managers will become our board of directors, and we refer to them as such. Upon completion of this offering, our board of directors will have 12 members, comprised of one executive officer, seven directors affiliated with the Sponsors and four independent directors. Members of the board of directors will be elected at our annual meeting of stockholders to serve for a term of one year or until their successors have been elected and qualified, subject to prior death, resignation, retirement or removal from office.
Director Independence
Our board of directors has affirmatively determined that Sharon L. Allen, Steven A. Davis, Kim Fennebresque and Alan Schumacher are independent directors under the applicable rules of the NYSE and as such term is defined in Rule 10A-3(b)(1) under the Exchange Act.
Controlled Company
Upon completion of this offering, Albertsons Investor, Kimco and Management Holdco, as a group, will control a majority of our outstanding common stock. As a result, we are a “controlled company” within the meaning of the NYSE corporate governance standards. Under NYSE rules, a company of which more than 50% of the voting power is held by an individual, group or another company is a “controlled company” and may elect not to comply with certain NYSE corporate governance requirements, including:
| • | the requirement that a majority of the board of directors consist of independent directors; |
| • | the requirement that we have a nominating and corporate governance committee that is composed entirely of independent directors with a written charter addressing the committee’s purpose and responsibilities; |
| • | the requirement that we have a compensation committee that is composed entirely of independent directors with a written charter addressing the committee’s purpose and responsibilities; and |
| • | the requirement for an annual performance evaluation of the nominating and corporate governance committee and the compensation committee. |
137
Table of Contents
Following this offering, we intend to utilize these exemptions. As a result, we will not have a majority of independent directors nor will our nominating and corporate governance and compensation committees consist entirely of independent directors. Accordingly, you will not have the same protections afforded to stockholders of companies that are subject to all of the NYSE corporate governance requirements.
In the event that we cease to be a controlled company within the meaning of these rules, we will be required to comply with these provisions after specified transition periods.
More specifically, if we cease to be a controlled company within the meaning of these rules, we will be required to (i) satisfy the majority independent board requirement within one year of our status change, and (ii) have (a) at least one independent member on each of our nominating and corporate governance committee and compensation committee by the date of our status change, (b) at least a majority of independent members on each committee within 90 days of the date of our status change and (c) fully independent committees within one year of the date of our status change.
Board Leadership Structure
Our board of directors does not have a formal policy on whether the roles of Chief Executive Officer and Chairman of the board of directors should be separate. However, Robert G. Miller currently serves as both Chief Executive Officer and Chairman. Our board of directors has considered its leadership structure and believes at this time that our company and its stockholders are best served by having one person serve in both positions. Combining the roles fosters accountability, effective decision-making and alignment between interests of our board of directors and management. Mr. Miller also is able to use the in-depth focus and perspective gained in his executive function to assist our board of directors in addressing both internal and external issues affecting the company.
Our corporate governance guidelines provide for the election of one of our non-management directors to serve as Lead Director when the Chairman of the board of directors is also the Chief Executive Officer. Lenard B. Tessler currently serves as our Lead Director, and is responsible for serving as a liaison between the Chairman and the non-management directors, approving meeting agendas and schedules for our board and presiding at executive sessions of the non-management directors and any other board meetings at which the Chairman is not present, among other responsibilities.
Our board of directors expects to periodically review its leadership structure to ensure that it continues to meet the company’s needs.
Role of Board in Risk Oversight
While the full board of directors has the ultimate oversight responsibility for the risk management process, its committees oversee risk in certain specified areas. In particular, our audit and risk committee oversees management of enterprise risks as well as financial risks. Our compensation committee is responsible for overseeing the management of risks relating to our executive compensation plans and arrangements and the incentives created by the compensation awards it administers. Our compliance committee is responsible for overseeing the management of compliance and regulatory risks facing our company and risks associated with business conduct and ethics. Our nominating and corporate governance committee oversees risks associated with corporate governance. Pursuant to our board of directors’ instruction, management regularly reports on applicable risks to the relevant committee or the full board of directors, as appropriate, with additional review or reporting on risks conducted as needed or as requested by our board of directors and its committees.
138
Table of Contents
Board Committees
Our board of directors has assigned certain of its responsibilities to permanent committees consisting of board members appointed by it. Following this offering, our board of directors will have an audit and risk committee, compensation committee, compliance committee and nominating and corporate governance committee, each of which will have the responsibilities and composition described below:
Audit and Risk Committee
Upon completion of this offering, our audit and risk committee will consist of Kim Fennebresque, Alan Schumacher and Steven Davis, with Mr. Schumacher serving as chair of the committee. The committee assists the board in its oversight responsibilities relating to the integrity of our financial statements, our compliance with legal and regulatory requirements (to the extent not otherwise handled by our compliance committee), our independent auditor’s qualifications and independence, and the establishment and performance of our internal audit function and the performance of the independent auditor. Upon the completion of this offering, we will have three independent directors serving on our audit and risk committee. Our board of directors will determine which member of our audit and risk committee qualifies as an “audit committee financial expert” under SEC rules and regulations.
Our board of directors has adopted a written charter under which the audit and risk committee operates. A copy of the audit and risk committee charter, which will satisfy the applicable standards of the SEC and the NYSE, will be available on our website.
Compensation Committee
Upon completion of this offering, our compensation committee will consist of Kim Fennebresque, Lenard B. Tessler and Sharon Allen, with Mr. Fennebresque serving as chair of the committee. The compensation committee of the board of directors is authorized to review our compensation and benefits plans to ensure they meet our corporate objectives, approve the compensation structure of our executive officers and evaluate our executive officers’ performance and advise on salary, bonus and other incentive and equity compensation. A copy of the compensation committee charter will be available on our website.
Compliance Committee
Upon completion of this offering, our compliance committee will consist of Lisa A. Gray, Hersch Klaff, Ronald Kravit and Steven Davis, with Ms. Gray serving as chair of the committee. The purpose of the compliance committee is to assist the board in implementing and overseeing our compliance programs, policies and procedures that are designed to respond to the various compliance and regulatory risks facing our company, and monitor our performance with respect to such programs, policies and procedures. A copy of the charter for the compliance committee will be available on our website.
Nominating and Corporate Governance Committee
Upon completion of this offering, our nominating and corporate governance committee will consist of Dean Adler, Sharon Allen, Lisa Gray and Lenard Tessler, with Ms. Allen serving as chair of the committee. The nominating and corporate governance committee is primarily concerned with identifying individuals qualified to become members of our board of directors, selecting the director nominees for the next annual meeting of the stockholders, selection of the director candidates to fill any vacancies on our board of directors and the development of our corporate governance guidelines and principles. A copy of the nominating and corporate governance committee charter will be available on our website.
139
Table of Contents
Compensation Committee Interlocks and Insider Participation
None of the members of our compensation committee is or has at any time during the past year been an officer or employee of ours. None of our executive officers serves as a member of the compensation committee or board of directors of any other entity that has an executive officer serving as a member of our board of directors or compensation committee.
Code of Business Conduct and Ethics
We have adopted a code of business conduct and ethics that applies to all of our employees, officers and directors, including those officers responsible for financial reporting. The code of business conduct and ethics will be available on our website. We expect that any amendments to the code, or any waivers of its requirements, will be disclosed on our website.
Corporate Governance Guidelines
We have adopted corporate governance guidelines in accordance with the corporate governance rules of the NYSE, as applicable, that serve as a flexible framework within which our board of directors and its committees operate. These guidelines cover a number of areas, including the size and composition of the board, board membership criteria and director qualifications, director responsibilities, board agenda, roles of the Chairman of our board of directors and Chief Executive Officer, executive sessions, standing board committees, board member access to management and independent advisors, director communications with third parties, director compensation, director orientation and continuing education, evaluation of senior management and management succession planning. A copy of our corporate governance guidelines will be posted on our website.
Director Compensation
None of our directors received compensation for their service on our board of directors or any board committees in fiscal 2014. We reimburse the directors for reasonable documented out-of-pocket expenses incurred by them in connection with attendance at board of directors and committee meetings.
In connection with Robert L. Edwards becoming our Vice Chairman, on April 9, 2015, Mr. Edwards, the company and AB Management Services Corp. entered into a Director and Consultancy Agreement (the “Director and Consultancy Agreement”), under which Mr. Edwards received compensation for his service as a director through his resignation as a director on June 13, 2015. See “Certain Relationships and Related Party Transactions.”
In March 2015, the board of directors approved independent director annual fees of $150,000 per year for Kim Fennebresque and Alan Schumacher, and additional annual fees of $25,000 per year for Messrs. Fennebresque and Schumacher for their service as the chairs of the compensation committee and the audit and risk committee, respectively. Upon the commencement of their service on the board of directors in June 2015, Sharon L. Allen and Steven A. Davis became eligible to receive independent director annual fees of $150,000 per year.
The independent directors have also been granted the number of Phantom Units under the AB Acquisition LLC Phantom Unit Plan (the “Phantom Unit Plan”) set forth below (the “Director Phantom Units”):
| Participant |
Units | |||
| Sharon L. Allen |
100,000 | |||
| Steven A. Davis |
25,000 | |||
| Kim Fennebresque |
25,000 | |||
| Alan Schumacher |
25,000 | |||
140
Table of Contents
50% of the Director Phantom Units granted to Messrs. Fennebresque, Schumacher and Davis will vest in four annual installments of 25% on the last day of the company’s fiscal year, commencing with the last day of fiscal 2015, subject to the director’s continued service through each vesting date. The remaining 50% of the Director Phantom Units granted to Messrs. Fennebresque, Schumacher and Davis will vest in four annual installments of 25% on the last day of the company’s fiscal year, commencing with the last day of fiscal 2015, subject to the director’s continued service through each vesting date, and will also be subject to the achievement of annual performance targets established for each such fiscal year (“Performance Units”). If the performance target for a fiscal year is not met, but is met in a subsequent fiscal year on a cumulative basis along with the applicable performance target for such subsequent fiscal year, any Performance Units that did not vest with respect to the missed year will vest in such subsequent fiscal year. Upon the consummation of the IPO-Related Transactions and this offering, however, any Performance Units (other than those with respect to a missed year) will become vested based solely on the director’s continued service. In addition, if, following the consummation of the IPO-Related Transactions and this offering, a director’s service is terminated by the company without cause (as defined in the Phantom Unit Plan), or due to the director’s death or disability, all of such director’s Director Phantom Units will become 100% vested.
100% of the Director Phantom Units granted to Ms. Allen will vest on the last day of fiscal 2015, subject to her continued service through such date. In addition, if Ms. Allen’s service is terminated by the company without cause, or due to her death or disability, all of Ms. Allen’s Director Phantom Units will become 100% vested. Upon vesting, 60% of Ms. Allen’s Director Phantom Units will be settled in Incentive Units and 40% will be settled in a cash amount equal to the fair market value of such number of Incentive Units on the vesting date.
Upon the consummation of the IPO-Related Transactions and this offering, the Director Phantom Units will be converted into restricted stock units that will be settled in shares of our common stock. See “Executive Compensation—Incentive Plans—Phantom Unit Plan” for additional information regarding the Phantom Unit Plan.
In August 2015, the board of directors approved a director compensation plan, effective upon the consummation of the IPO-Related Transactions and this offering. Each director will receive an annual cash fee in the amount of $125,000, which the director may elect to receive in the form of a grant of fully vested stock units that will be settled in shares of our common stock upon the termination of the director’s service. In addition, each director will receive an annual grant of restricted stock units with a grant date value of $100,000 that, if vested, will be settled in shares of our common stock upon the termination of the director’s service. The restricted stock unit grants will be made on the first day of the trading window following the first annual meeting of our stockholders in each calendar year and will vest 100% upon the earlier of the one-year anniversary of the grant date and the first stockholder meeting in the calendar year following the year in which the grant date occurs, subject to the director’s continuous service through the vesting date. A director appointed to serve on our board of directors between annual stockholders meetings will receive a pro-rated restricted stock unit grant for the year of appointment, subject to the same terms (including timing of vesting) as the grants made to the other directors for such year, but based on the grant date value of our common stock on the date of grant. In addition, our Lead Director will receive an annual fee in the amount of $20,000 and committee members will receive an annual fee of $20,000, with the committee chairs receiving an additional annual fee in the amount of $20,000.
141
Table of Contents
Compensation Discussion and Analysis
This Compensation Discussion and Analysis is designed to provide an understanding of our compensation philosophy and objectives, compensation-setting process, and the fiscal 2014 compensation of our named executive officers, or “NEOs.” Our NEOs for fiscal 2014 are:
| • | Robert G. Miller, our current Chairman and Chief Executive Officer, who served as our Chief Executive Officer from the commencement of fiscal 2014 (February 21, 2014) through January 29, 2015, and as our Executive Chairman from January 30, 2015 through his appointment as our Chairman and Chief Executive Officer on April 9, 2015; |
| • | Robert L. Edwards, who joined the company from Safeway on January 30, 2015, the closing date of the Safeway acquisition, and who served as our President and Chief Executive Officer from that date through his transition to Vice Chairman (a non-employee position) on April 9, 2015; |
| • | Robert B. Dimond, Executive Vice President and Chief Financial Officer; |
| • | Wayne A. Denningham, our current Chief Operating Officer, who was serving as our Executive Vice President and Chief Operating Officer, South Region, as of the end of fiscal 2014; |
| • | Justin Dye, Chief Administrative Officer; and |
| • | Shane Sampson, our current Chief Marketing and Merchandising Officer, who was serving as our Executive Vice President, Marketing and Merchandising as of the end of fiscal 2014. |
Compensation Philosophy and Objectives
Our general compensation philosophy is to provide programs that attract, retain and motivate our executive officers who are critical to our long-term success. We strive to provide a competitive compensation package to our executive officers to reward achievement of our business objectives and align their interests with the interests of our equityholders. We have sought to accomplish these goals through a combination of short- and long-term compensation components that are linked to our annual and long-term business objectives and strategies. To focus our executive officers on the fulfillment of our business objectives, a significant portion of their compensation is performance-based.
The Role of the Compensation Committee
The compensation committee is comprised of members of our board of directors and is responsible for determining the compensation of our executive officers. The compensation committee’s responsibilities include determining and approving the compensation of the Chief Executive Officer and reviewing and approving the compensation of all other executive officers.
Compensation Setting Process
Prior to the offering, our compensation program reflected our operations as a private company. In determining the compensation for our executive officers, we relied largely upon the experience of our management and our board of directors with input from our Chief Executive Officer.
Following this offering, the compensation committee will be responsible for administering our executive compensation programs. It is anticipated that as part of the process, the Chief Executive Officer will provide the compensation committee with his assessment of the NEOs’ performance and other factors used in developing his recommendation for their compensation, including salary adjustments, cash incentives and equity grants.
142
Table of Contents
We have not engaged compensation consultants or established a formal benchmarking process to review our executive compensation practices against those of our peer companies. We are considering the establishment of a peer group to ensure that our executive compensation program is competitive and offers the appropriate retention and performance incentives.
Components of the NEO Fiscal 2014 Compensation Program
The company uses various compensation elements to provide an overall competitive total compensation and benefits package to the NEOs that is tied to creating value and commensurate with our results and aligns with our business strategy. Set forth below are the key elements of the fiscal 2014 compensation program for our NEOs:
| • | base salary that reflects compensation for the NEO’s role and responsibilities, experience, expertise and individual performance; |
| • | quarterly bonus based on division performance; |
| • | incentive compensation based on the value of the company’s equity; |
| • | severance protection; and |
| • | other benefits that are provided to all employees, including healthcare benefits, life insurance, retirement savings plans and disability plans. |
Base Salary
We provide the NEOs with a base salary to compensate them for services rendered during the fiscal year. Base salaries for the NEOs are determined on the basis of each executive’s role and responsibilities, experience, expertise and individual performance.
The annual base salary of the NEOs employed by us at the beginning of fiscal 2014 had been previously determined based on the NEO’s role within the company. The initial annual base salaries for fiscal 2014 were as follows: Mr. Miller—$1,500,000; Mr. Dimond—$700,000; Messrs. Denningham and Sampson—$350,000; and Mr. Dye—$750,000. Mr. Edwards’ annual base salary was $1,500,000 during the period that he served as our President and Chief Executive Officer. This amount was an increase of $275,000 per annum over the base salary Mr. Edwards received as Chief Executive Officer of Safeway, which reflected his assumption of the chief executive position of our larger and more complex company.
Mr. Miller’s annual base salary was increased to $2,000,000, effective January 30, 2015, in connection with the change of his position to our Executive Chairman and remained at that amount upon his becoming our Chairman and Chief Executive Officer on April 9, 2015. Mr. Dye’s annual base salary was increased to $800,000, effective February 1, 2015, in connection with his promotion to Chief Administrative Officer. In connection with their promotions and to reflect their increased responsibilities for our larger and more complex company following the Safeway acquisition, effective February 1, 2015, the base salaries for Messrs. Denningham and Sampson were increased to $750,000 and $700,000, respectively. To align the base salaries of the members of the Office of the CEO reporting to Mr. Miller, effective April 12, 2015, the base salaries for Messrs. Denningham and Sampson were both further increased to $800,000.
Bonuses
Performance-Based Bonus Plans
We recognize that our corporate management employees shoulder responsibility for supporting our operating divisions in achieving positive financial results. We therefore believe that a substantial percentage of each executive officer’s annual compensation should be tied directly to the achievement of performance goals.
143
Table of Contents
Consistent with our historical practice, all of our executive officers other than Mr. Miller participated in the bonus plans that we implemented for each fiscal quarter in fiscal 2014 (collectively, the “2014 Bonus Plan”). Due to his active involvement in the administration of the 2014 Bonus Plan and the bonus plans in place for each fiscal quarter in fiscal 2012 and fiscal 2013, including the setting of performance metrics and the determination of the payments under such plans, Mr. Miller elected not to participate in any of those bonus plans. Mr. Miller is a participant in our fiscal 2015 Corporate Management Bonus Plan (the “2015 Bonus Plan”) that will be administered by our board of directors.
Due to his commencement of employment with the company at the end of fiscal 2014, Mr. Edwards was not eligible to participate in the 2014 Bonus Plan.
2014 Bonus Plan. The 2014 Bonus Plan consisted of bonus plans based on the performance achieved by our divisions for each fiscal quarter in fiscal 2014 (each a “Quarterly Division Bonus”), other than our United Supermarket division, which did not maintain a quarterly bonus structure. We established the fiscal year target bonus percentage for each NEO under the 2014 Bonus Plan as a percentage of his annual base salary based on the NEO’s position and responsibilities, as well as the individual’s ability to impact our financial performance. This approach placed a proportionately larger percentage of total annual pay at risk based on performance for our NEOs relative to position level and responsibility. The fiscal 2014 target bonuses, as a percentage of base salary for the NEOs participating in the 2014 Bonus Plan, were as follows:
| Name |
Fiscal 2014 Target Bonus | |
| Robert B. Dimond |
60% | |
| Wayne A. Denningham |
50% through January 29, 2015 55% effective January 30, 2015(1) | |
| Justin Dye |
60% | |
| Shane Sampson |
50% through January 29, 2015 60% effective January 30, 2015(2) |
| (1) | Mr. Denningham’s target bonus was increased in connection with the increase of his responsibilities as Executive Vice President and Chief Operating Officer, South Region. |
| (2) | Mr. Sampson’s target bonus was increased in connection with his promotion to the position of Executive Vice President, Marketing and Merchandising. |
The target amount for each fiscal quarter (the “Quarterly Bonus Opportunity”) was calculated by dividing the NEO’s 2014 fiscal year target bonus by 53 weeks and multiplying the result by the number of weeks in the applicable fiscal quarter. Higher and lower percentages of base salary could be earned if minimum performance levels or performance levels above target were achieved. The maximum bonus opportunity under the 2014 Bonus Plan was 200% of the NEO’s 2014 fiscal year target bonus. No amount would be payable for the applicable fiscal quarter if results fell below established threshold levels. We believe that having a maximum cap serves to promote good judgment by the NEOs, reduces the likelihood of windfalls and makes the maximum cost of the plan predictable.
144
Table of Contents
At the beginning of each fiscal quarter, the management of each division, with approval from our corporate management, established the division’s retail EBITDA goal for the applicable fiscal quarter with threshold, plan, target and maximum goals. After the end of the fiscal quarter, our corporate finance team calculated the financial results for each retail division and reported the division bonus percentage earned, if any. A division earned between 0% to 100% of its bonus target amount for achievement of EBITDA for the fiscal quarter between the threshold and target levels. If the division achieved its target EBITDA for a fiscal quarter, then a higher percentage of the bonus target could be earned by such division for such fiscal quarter if the division also achieved a division sales goal for such fiscal quarter as follows:
| Quarterly Sales Goal Percentage Achieved |
Percentage of Quarterly Bonus Target Earned | |
| Below 99% |
100% | |
| 99%-99.99% |
150% | |
| 100% or greater |
200% |
No bonus amount was earned for a fiscal quarter by a division for achievement below threshold levels. The EBITDA goals set for each division for each quarter were designed to be challenging and difficult to achieve, but still within a realizable range so that achievement was both uncertain and objective. We believe that this methodology created a strong link between our NEOs and our financial performance.
The amount of a Quarterly Bonus Opportunity earned by the participating NEOs under the 2014 Bonus Plan for each applicable fiscal quarter was determined at the end of each fiscal quarter based on the bonus target amounts earned by the division or divisions over which they had authority during the applicable quarter. For Messrs. Dye and Dimond for the full fiscal 2014 and Mr. Sampson for a portion of the third fiscal quarter and the entire fourth fiscal quarter of fiscal 2014, their roles applied across all of our divisions. Therefore, their bonuses for the applicable fiscal quarters were determined by adding together the percentage of the quarterly bonus target amounts earned for all of the divisions and dividing the sum by eight (the number of our divisions in fiscal 2014).
Based on the achievement of our divisions during fiscal 2014, the participating NEOs earned the following amounts under the 2014 Bonus Plan:
| Name |
Aggregate Fiscal 2014 Bonus Earned | |
| Robert B. Dimond |
$664,482 | |
| Wayne A. Denningham |
$371,551 | |
| Justin Dye |
$715,379 | |
| Shane Sampson |
$358,416 |
2015 Bonus Plan. Our board of directors determined that to more closely align the compensation paid to our executive officers with both division performance and the overall financial performance of the company, the 2015 Bonus Plan will consist of both a Quarterly Division Bonus for each quarter in fiscal 2015 and an annual bonus based on the company’s performance for the full fiscal 2015 (“Annual Corporate Bonus”).
The Quarterly Division Bonus component, which comprises 50% of each executive officer’s target bonus opportunity, is structured substantially in the same manner as the Quarterly Division Bonus under the 2014 Bonus Plan, including being based on an EBITDA goal. The Quarterly Bonus Opportunity under the 2015 Bonus Plan will be calculated by dividing the NEO’s target annual bonus by 52 weeks, multiplying the result by the number of weeks in the applicable fiscal quarter, then dividing by half to account for the Annual Corporate Bonus. The Quarterly Bonus Opportunity earned by all NEOs participating under the 2015 Bonus Plan will be based solely on the average quarterly bonus target amounts earned for all of our divisions for the applicable fiscal quarter, other than our United Supermarket division, which does not maintain a quarterly bonus structure.
145
Table of Contents
The Annual Corporate Bonus component, the remaining 50% of each executive officer’s target bonus opportunity, is based on the company’s level of achievement of an annual Adjusted EBITDA target approved by our board of directors. Amounts under the Annual Corporate Bonus may be earned above or below target level. The threshold level above which a percentage of the Annual Corporate Bonus may be earned is achievement above 90% of the Adjusted EBITDA target and 100% of the Annual Corporate Bonus may be earned at achievement of 100% of the Adjusted EBITDA target, with interim percentages earned for achievement between levels. If achievement exceeds 100% of the Adjusted EBITDA target, 10% of the excess Adjusted EBITDA will be added to the bonus pool, but payout will be capped at 200% on the Annual Corporate Bonus component of the NEO’s annual target bonus.
The annual target bonus for Mr. Miller was set at 60% of his base salary. The annual target bonus for Mr. Denningham was increased to 60% of his base salary in connection with his promotion to Chief Operating Officer. The annual target bonus, as a percentage of base salary, for the other NEOs participating in the 2015 Bonus Plan remained at the level set under the 2014 Bonus Plan.
Special Bonuses
In addition to the annual cash incentive program, we may from time to time pay our NEOs discretionary bonuses as determined by the board of directors or the compensation committee to provide for additional retention or upon special circumstances. In connection with the NAI acquisition, in January 2013, our board of directors approved a special bonus for Mr. Miller in the amount of $15,000,000 (“Special Bonus”) which would be earned upon the achievement of the following distribution hurdles:
| • | $7,500,000 of the Special Bonus would be paid once distributions equal to a return of capital ($550 million), plus an 8% preferred return from the closing date of the NAI acquisition, and an additional $250 million (without any preferred return), were made in the aggregate to the holders of AB Acquisition’s membership interests; and |
| • | the remaining $7,500,000 of the Special Bonus would be paid once distributions equal to $200 million (without any preferred return) in excess of the first hurdle were made to the holders of AB Acquisition’s membership interests. |
The company determined that both distribution hurdles were achieved upon the consummation of the Safeway acquisition. Accordingly, the Special Bonus was paid to Mr. Miller upon the closing date of the Safeway acquisition.
In recognition of their efforts in connection with the Safeway acquisition, the company awarded the NEOs set forth below with the following one-time special bonuses:
| Name |
Special Bonus | |
| Robert B. Dimond |
$250,000 | |
| Wayne A. Denningham |
$100,000 | |
| Justin Dye |
$500,000 | |
| Shane Sampson |
$250,000 |
In connection with the commencement of their employment, Messrs. Dimond and Sampson received retention bonuses in the amounts of $1,500,000 and $1,000,000, respectively. Upon his subsequent transfer to the position of Division President of Jewel-Osco and in recognition of his performance, in March 2014, Mr. Sampson’s retention award was increased to $1,240,000. The first and second installments of Mr. Dimond’s and Mr. Sampson’s retention bonuses, each in the amount of $375,000 and $310,000, respectively, were paid to them on April 1, 2014 and 2015, and the remaining installments will be payable on April 1, 2016 and 2017, generally subject to their remaining actively working, without having been demoted, through each applicable payment date.
146
Table of Contents
In recognition of his performance and as an additional incentive, in March 2013, Mr. Denningham received a retention bonus in the amount of $700,000. The first and second installments of Mr. Denningham’s retention bonus, each in the amount of $175,000, were paid to Mr. Denningham in April 2014 and April 2015, and the remaining installments will be payable in April 2016 and April 2017, generally subject to Mr. Denningham remaining employed through each applicable payment date.
Incentive Plans
Long-Term Incentive Plans
In fiscal 2006, the company adopted the AB Acquisition LLC Long Term Incentive Plan (“LTIP I”), and in fiscal 2011, the company adopted the AB Acquisition LLC Senior Executive Retention Plan (“LTIP II,” and, together with LTIP I, the “LTIPs”). The LTIPs provided for cash incentive awards that entitled a participant to cash payments equal to a specified percentage of the distributions received by the members of the company. Messrs. Miller, Denningham and Dye received awards under the LTIPs that were subject to vesting based on continued employment (four years under LTIP I and three years under LTIP II), but provided for accelerated vesting upon a change in control. In July 2014, Messrs. Miller, Dye and Denningham became vested in, and were paid, amounts under LTIP II equal to $375,000, $375,000 and $337,500, respectively.
In fiscal 2014, the LTIPs were terminated in connection with our entering into the merger agreement with Safeway, and the participating NEOs became entitled to the payments set forth in the table below. In addition, the additional amounts set forth in the table below that were previously unvested and credited to the NEO’s account under LTIP II became vested and were paid in connection with the termination of LTIP II.
| LTIP I | LTIP II | |||||||||||||||||||
| Name |
Participation Percentage |
Amount Paid upon Termination of LTIP I |
Participation Percentage |
Amount Paid upon Termination of LTIP II |
Additional Amount Paid upon Termination of LTIP II |
|||||||||||||||
| Robert G. Miller |
20.0 | % | $ | 4,344,067 | 1.0 | % | $ | 7,240,112 | $ | 375,000 | ||||||||||
| Wayne A. Denningham |
5.0 | % | $ | 1,086,017 | 0.9 | % | $ | 6,516,101 | $ | 337,500 | ||||||||||
| Justin Dye |
10.0 | % | $ | 2,172,034 | 1.0 | % | $ | 7,240,112 | $ | 375,000 | ||||||||||
Each of the participating NEOs subsequently invested 50% of the amount received under the LTIPs in the company’s Class A Units.
Class C Incentive Unit Plan
In March 2013, we adopted the Class C Plan in connection with the NAI acquisition. Messrs. Miller and Dye were each granted 17.198 Class C Units under the Class C Plan. The Class C Units were granted as profits interests based on a value of $550 million and subject to an 8% preferred return. The Class C Units were initially subject to a three-year vesting schedule. On March 6, 2014, in recognition of the strong performance of management in connection with the NAI acquisition and the strong sales performance of the stores acquired in the NAI acquisition, our board of directors determined that the Class C Plan should be terminated in connection with the Safeway acquisition, and in connection with such termination, the Class C Units held by Messrs. Miller and Dye became fully vested. On the closing date of the Safeway acquisition, the Class C Units held by each of Messrs. Miller and Dye were converted into 440,242 fully vested Class A Units respectively, which Class A Units had an equivalent total value to the Class C Units after taking into account the $550 million and 8% hurdle applicable to Class C Units.
147
Table of Contents
Miller Incentive Units
Under an amendment to Mr. Miller’s employment agreement entered into in March 2014, the company agreed that, upon the closing of the Safeway acquisition, Mr. Miller would be granted a fully-vested equity award equal to a 1.0% interest in AB Acquisition. Accordingly, as required under his employment agreement, upon the closing date of the Safeway acquisition, Mr. Miller was granted 3,350,084 fully-vested and non-forfeitable Investor Incentive Units of AB Acquisition (the “Miller Incentive Units”). The Miller Incentive Units entitle Mr. Miller to participate in cash distributions of Albertsons, NAI and Safeway based on his ownership percentage of the aggregate ABS, NAI and Safeway units, Series 1 Incentive Units and Investor Incentive Units outstanding. All distributions are on a subordinate basis to the $2,308.6 million aggregate distributions to Albertsons, NAI and Safeway unitholders after which Mr. Miller will participate on a pro rata basis. The Miller Incentive Units are convertible to an equal number of ABS units, NAI units and Safeway units reflecting the fair market value of such units as of the conversion date, which is the earlier of (i) January 30, 2020 and (ii) the effective date of consummation of the IPO-Related Transactions and this offering or a sale of all or substantially all of the equity of the company or of the consolidated assets of the company and its subsidiaries. The Miller Incentive Units are fully vested and contain no voting rights.
Incentive Unit Plan
Effective upon the closing of the Safeway acquisition, we adopted the AB Acquisition LLC Incentive Unit Plan (the “Incentive Unit Plan”). See “—Incentive Plans—Incentive Unit Plan” for additional information regarding the Incentive Unit Plan.
Under terms agreed to by Mr. Edwards and the company in August 2014 and further set forth in the employment agreement with Mr. Edwards entered into in December 2014, the company agreed that, upon the closing of the Safeway acquisition, Mr. Edwards would be granted 3,350,083 Incentive Units under the Incentive Unit Plan (the “Series 1 Incentive Units”). Accordingly, as required under his employment agreement, upon the closing date of the Safeway acquisition, Mr. Edwards was granted Series 1 Incentive Units, which represented 1% of our fully diluted equity above a valuation threshold determined at grant of $2.3 million. 50% of the Series 1 Incentive Units were scheduled to vest in four annual installments of 25% on each of the anniversaries of the date of the closing of the Safeway acquisition, subject to Mr. Edwards’ continued employment through such date and would become 100% vested upon the completion of an initial public offering by the company or a change in control (the “Time-Based Units”). The remaining 50% would become vested in four annual installments of 25% on the last day of Safeway’s fiscal year starting with 2015 if the annual performance targets set by our management board for the respective fiscal year would be achieved and Mr. Edwards remained employed (“Performance-Based Units”). Performance-Based Units subject to performance targets not attained in any fiscal year could have become vested in a subsequent year if the performance in a subsequent year satisfied the performance target for such year and, on a cumulative basis, the performance target for the earlier fiscal year in which the performance target was not met. In the event of a termination of his employment without Cause or for Good Reason (each as defined in his employment agreement), or due to his death or disability, a pro-rated portion of Mr. Edwards’ Series 1 Incentive Units would have become vested as if he had remained employed through the next vesting date and the performance targets for the applicable fiscal year had been achieved.
In connection with his transition to the position of Vice Chairman, Mr. Edwards and the company agreed that Mr. Edwards would forfeit 1,675,041.5 of his Series 1 Incentive Units. The remaining 1,675,041.5 Series 1 Incentive Units would vest in full on the first anniversary of the closing date of the Safeway acquisition, subject to his continued service as a consultant through that date and accelerated vesting in the event of a termination of his service due to a breach by the company of his Director and Consultancy Agreement, his death or due to disability.
148
Table of Contents
Within 180 days following a termination of his service due to death or disability, Mr. Edwards or his estate, as applicable, would have the right to cause the company to repurchase his vested Incentive Units at fair market value determined on the date of termination to the extent that our financing agreements then or thereafter permit such repurchase.
Upon the consummation of the IPO-Related Transactions and this offering, Mr. Edwards’ Series 1 Incentive Units will be exchanged for restricted units of Albertsons Investor with the same vesting terms as his Series 1 Incentive Units.
Phantom Unit Plan
In fiscal 2015, we adopted the Phantom Unit Plan. See “—Incentive Plans—Phantom Unit Plan” for additional information regarding the Phantom Unit Plan.
On March 5, 2015, we granted to the NEOs listed below the number of Phantom Units set forth below (the “2015 Phantom Units”):
| Participant |
Units | |||
| Shane Sampson |
1,200,000 | |||
| Justin Dye |
1,000,000 | |||
| Robert B. Dimond |
700,000 | |||
| Wayne A. Denningham |
600,000 | |||
50% of the 2015 Phantom Units are Time-Based Units that will vest in four annual installments of 25% on the last day of the company’s fiscal year, commencing with the last day of fiscal 2015, subject to the NEO’s continued service through each vesting date. The remaining 50% of the 2015 Phantom Units are Performance-Based Units that will vest in four annual installments of 25% on the last day of the company’s fiscal year, commencing with the last day of fiscal 2015, subject to the NEO’s continued service through each vesting date, and will also be subject to the achievement of annual performance targets established for each such fiscal year. If the performance target for a fiscal year is not met, but is met in a subsequent fiscal year on a cumulative basis along with the applicable performance target for such subsequent fiscal year, the Performance-Based Units that did not vest with respect to the missed year will vest in such subsequent fiscal year. Upon the consummation of the IPO-Related Transactions and this offering, however, any Performance-Based Units (other than those with respect to a missed year) will become vested based solely on the NEO’s continued employment (like Time-Based Units). In addition, if, following the consummation of the IPO-Related Transactions and this offering, an NEO’s employment with the company is terminated by the company without “Cause,” or due to the participant’s death or disability, all Time-Based Units and Performance-Based Units will become 100% vested.
The 2015 Phantom Units were granted with the right to receive a “Tax Bonus” that entitles the participant to receive a bonus equal to 4% of the fair market value of the Incentive Units paid to the participant in respect of vested Phantom Units. Upon the consummation of the IPO-Related Transactions and this offering, the 2015 Phantom Units will be converted into restricted stock units that will be settled in shares of our common stock.
Employment Agreements and Offer Letters
Robert G. Miller
During fiscal 2014 Mr. Miller was a party to an employment agreement with AB Acquisition, dated March 13, 2006, as amended (the “Miller Employment Agreement”). On September 21, 2015, Mr. Miller and the company entered into an agreement pursuant to which, upon the consummation of the IPO-Related Transactions, the Miller Employment Agreement will be amended and restated to reflect the
149
Table of Contents
assignment of Mr. Miller’s employment and the Miller Employment Agreement to the company. The term of Mr. Miller’s employment under the Miller Employment Agreement will expire on January 30, 2018.
The Miller Employment Agreement provides that Mr. Miller will serve as Chairman and Chief Executive Officer (which will be the senior most executive officer) and a voting member of the board of directors and of any executive or operating committee of the board of directors other than, following the consummation of the IPO-Related Transactions and this offering, the compensation committee, audit committee or any other committee required by the rules of the SEC or the applicable securities exchange to be made up of solely independent directors.
The Miller Employment Agreement provides that Mr. Miller will receive an annual base salary in the amount of $2,000,000 per year.
In the event of a termination of Mr. Miller’s employment by us without Cause or by Mr. Miller with Good Reason, subject to his execution of a release, Mr. Miller will be entitled to a lump sum payment equal to his base salary for the remainder of the term and his target bonus. In addition, following the term of Mr. Miller’s employment, Mr. Miller will be entitled to a payment of $50,000 per month (or partial month) during his lifetime and, after his death, his spouse will become entitled to a payment of $25,000 per month for each month (or partial month) during her lifetime. In any event, such payments will cease on the tenth anniversary of the end of the term.
Pursuant to the Miller Employment Agreement, Mr. Miller is entitled to the use of corporate aircraft for up to 100 hours of personal use per year for himself, his family members and guests at no cost to him, other than to pay income tax on such usage at the lowest permissible rate. In addition, pursuant to the Miller Employment Agreement, we assigned $5.0 million of the key man life insurance policy we had obtained on Mr. Miller’s life to Mr. Miller in favor of one or more beneficiaries designated by him from time to time. We agreed to maintain such policy (or substitute equivalent policies) in effect for a period of at least 10 years following the closing of the Safeway acquisition (whether or not Mr. Miller remains employed with the company).
For purposes of the Miller Employment Agreement, “Cause” generally means:
| • | an act of fraud, embezzlement, or misappropriation by Mr. Miller intended to result in substantial personal enrichment at the expense of the company; or |
| • | Mr. Miller’s willful or intentional failure to materially comply (to the best of his ability) with a specific, written direction of the board of directors of AB Acquisition that is consistent with normal business practice and not inconsistent with the Miller Employment Agreement and his responsibilities thereunder, and that within 10 business days after the delivery of written notice of the failure is not cured to the best of his ability or that Mr. Miller has not provided notice that the failure was based on his good faith belief that the implementation of such direction would be unlawful or unethical. |
For purposes of the Miller Employment Agreement, “Good Reason” generally means any of the following occurs:
| • | a change of control; |
| • | any material adverse alteration in Mr. Miller’s titles, positions, duties, authorities, reporting relationships or responsibilities that is not cured within 10 business days of notice from Mr. Miller; or |
| • | any material failure by us to comply with the Miller Employment Agreement that is not cured within 10 business days of notice from Mr. Miller. |
150
Table of Contents
Robert L. Edwards
Mr. Edwards was party to an employment agreement with AB Management Services Corp., a subsidiary of the company, dated December 15, 2014 (the “Edwards Employment Agreement”). The Edwards Employment Agreement became effective as of the closing date of the Safeway acquisition. Pursuant to the Edwards Employment Agreement, Mr. Edwards served as President and Chief Executive Officer of the company, and certain of its subsidiaries. Mr. Edwards’ annual base salary was $1,500,000 and he was eligible to receive a bonus under a plan established by the company with a target bonus of 100% of his base salary and a maximum bonus of 200% of base salary. The Edwards Employment Agreement also provided for the grant of Series 1 Incentive Units described above under “—Incentive Plans—Incentive Unit Plan.” If Mr. Edwards’ employment would have been terminated by us without Cause or by him for Good Reason, subject to his execution of a release, Mr. Edwards would have been entitled to a lump sum severance payment equal to two times the sum of his base salary and the target bonus, and reimbursement of the cost of continuation coverage of group health coverage for 18 months; but if the termination was within 24 months of the closing of the Safeway acquisition, the severance amount would not be less than he would have received under the Safeway Executive Severance Plan for termination following a “Change in Control.”
For the purposes of the Edwards Employment Agreement, “Cause” generally meant:
| • | conviction of a felony; |
| • | acts of intentional dishonesty resulting or intending to result in material personal gain or enrichment at the expense of the company, its subsidiaries or its affiliates; |
| • | Mr. Edwards’ material breach of his obligations under the Edwards Employment Agreement, including but not limited to breach of the restrictive covenants and fraudulent, unlawful or grossly negligent conduct by Mr. Edwards in connection with his duties under the Edwards Employment Agreement; |
| • | personal conduct by Mr. Edwards which materially discredited or materially economically damaged the company, its subsidiaries or its affiliates; or |
| • | contravention of specific lawful direction from our board of directors. |
For the purposes of the Edwards Employment Agreement “Good Reason” generally meant:
| • | a reduction in the base salary or target bonus; |
| • | a material diminution in Mr. Edwards’ title, duties or responsibilities (including reporting requirements); |
| • | relocation of Mr. Edwards’ principal location of work to any location that was in excess of 50 miles from the location thereof on January 30, 2015 (other than Boise, Idaho) or, if we required him to move to Boise, Idaho, any subsequent relocation that was in excess of 50 miles from the location of the company in Boise, Idaho; or |
| • | a material breach of the Edwards Employment Agreement or an equity award agreement by the company or any of its subsidiaries. |
On April 9, 2015, the company, AB Management Services Corp. and Mr. Edwards entered into the Director and Consultancy Agreement which superseded the Edwards Employment Agreement. See “Certain Relationships and Related Party Transactions.”
Robert B. Dimond and Justin Dye
During fiscal 2014, Messrs. Dimond and Dye were parties to employment agreements with AB Management Services Corp. and NAI, respectively, that are dated September 9, 2014 and March 21,
151
Table of Contents
2013, respectively, each as amended (the “Executive Employment Agreements”). On September 21, 2015, each of Messrs. Dimond and Dye and the company entered into amended and restated Executive Employment Agreements which, effective upon the consummation of the IPO-Related Transactions, will reflect the assignment of their employment and Executive Employment Agreements to the Company. The Executive Employment Agreements both currently provide for a term through the third anniversary of the closing of the Safeway acquisition. The Executive Employment Agreements provide for an annual base salary of $700,000 for Mr. Dimond and $750,000 (increased to $800,000 under the amended and restated agreement) for Mr. Dye, and both executives are eligible to receive an annual bonus targeted at 60% of his annual base salary.
If the executive’s employment terminates due to his death or he is terminated due to disability, the executive or his legal representative, as appropriate, will be entitled to receive a lump sum payment in an amount equal to 25% of his base salary. If the executive’s employment is terminated by the company without Cause or by the executive for Good Reason, subject to his execution of a release, the executive is entitled to a lump sum payment of his base salary and target bonus for the period from the date of such termination through January 30, 2018, if the termination occurs prior to January 30, 2016, or for a period of 24 months if the termination occurs following January 30, 2016, and reimbursement of the cost of continuation coverage of group health coverage for 36 months.
For the purposes of each of the Executive Employment Agreements, “Cause” generally means:
| • | conviction of a felony; |
| • | acts of intentional dishonesty resulting or intending to result in personal gain or enrichment at the expense of the company, its subsidiaries or its affiliates; |
| • | a material breach of the executive’s obligations under the Executive Employment Agreement, including but not limited to breach of the restrictive covenants or fraudulent, unlawful or grossly negligent conduct by the executive in connection with his duties under the Executive Employment Agreement; |
| • | Personal conduct by the executive which seriously discredits or damages the company, its subsidiaries or its affiliates; or |
| • | contravention of specific lawful direction from the board of directors. |
For the purposes of the Executive Employment Agreements “Good Reason” generally means:
| • | a reduction in the base salary or target bonus; or |
| • | without prior written consent, relocation of the executive’s principal location of work to any location that is in excess of 50 miles from such location on the date of the applicable Executive Employment Agreement. |
Prior to entering into his Executive Employment Agreement, in connection with the commencement of his employment, Mr. Dimond entered into an offer letter with AB Management Services Corp., dated February 5, 2014. The offer letter provided Mr. Dimond with the same base salary and bonus opportunity provided under his Executive Employment Agreement and the retention bonus described above under “—Bonuses—Special Bonuses.” The remaining payments under Mr. Dimond’s retention bonus are provided for under his amended and restated Executive Employment Agreement.
Shane Sampson
In connection with the commencement of his employment, Mr. Sampson entered into an offer letter with Albertson’s LLC, dated January 16, 2013, pursuant to which he initially served as President, Shaw’s and Star Market. The offer letter provided Mr. Sampson with an initial base salary of $350,000 (increased to $800,000 effective as of April 12, 2015) and a bonus opportunity of 50% of base salary
152
Table of Contents
(increased to 60% effective January 30, 2015). In addition, Mr. Sampson’s offer letter provided for a signing bonus in the amount of $200,000 and the retention bonus described above under “—Bonuses—Special Bonuses.” On September 18, 2015, Mr. Sampson and the company entered into a letter agreement which, effective upon the consummation of the IPO-Related Transactions, will reflect the assignment of his employment to the company and provide that the company will make any further payments remaining under his retention bonus.
Wayne A. Denningham
On September 18, 2015, Mr. Denningham and the company entered into a letter agreement which, effective upon the consummation of the IPO-Related Transactions, will reflect the assignment of his employment to the company, his base salary of $800,000 and bonus opportunity of 60% of his base salary and provide that the company will make any further payments remaining under his retention bonus.
Severance Plan
We maintain the Albertson’s LLC Severance Plan for Officers (the “Severance Plan”) in order to provide severance benefits to certain employees who do not have severance rights under an employment agreement. Messrs. Denningham and Sampson are currently eligible for severance benefits under the Severance Plan. The Severance Plan provides that, subject to the execution of a release of claims and to certain exceptions set forth in the Severance Plan, an eligible employee who incurs an involuntary termination of employment due to certain job restructurings, reductions in force, sale of facilities, or job eliminations (and not due to any other reason including termination for misconduct or unsatisfactory job performance as determined by the company, or voluntary termination) will be eligible to receive:
| • | a lump sum severance payment in an amount equal to two weeks of pay per year of service, with a minimum of eight weeks of severance pay; and |
| • | continued health insurance coverage at the active employee rate for a period of up to six months. |
Deferred Compensation Plan
Our subsidiaries Albertson’s LLC and NAI maintain the Albertson’s LLC Makeup Plan and NAI Makeup Plan, respectively (collectively, the “Makeup Plans”). The Makeup Plans are unfunded non-qualified deferred compensation arrangements intended to comply with Section 409A of the Code. Designated employees, including our NEOs, may elect to defer the receipt of a portion of their base pay, bonus and incentive payments under the Makeup Plan. For fiscal 2014, Messrs. Dye and Sampson were eligible to participate in the NAI Makeup Plan, and the other NEOs were eligible to participate in the Albertson’s LLC Makeup Plan. The amounts deferred are held in a book entry account and are deemed to have been invested by the participant in investment options designated by the participant from among the investment options made available by the committee under the Makeup Plans. Participants are vested in their accounts under the Makeup Plans to the same extent they are vested in their accounts under the 401(k) plan discussed below, except that accounts under the Makeup Plans will become fully vested upon a change in control. No deferral contributions for a year will be credited, however, until the participant has been credited with the maximum amount of elective deferrals permitted by the terms of the 401(k) plans and/or the limitations imposed by the Code. In addition, participants will be credited with an amount equal to the excess of the amount we would contribute to the 401(k) plans as a company contribution on the participant’s behalf for the plan year without regard to any limitations imposed by the Code based on the participant’s compensation over the amount of our actual company contributions for the plan year. Generally, payment of the participant’s account under the Makeup Plans will be made in a lump sum following the participant’s
153
Table of Contents
separation from service. Participants may receive a distribution of up to 100% of their account during employment in the event of an emergency. Participants in the Makeup Plans are unsecured general creditors. See the table entitled “Nonqualified Deferred Compensation” below for information with regard to the participation of the NEOs in the Makeup Plans.
401(k) Plan
The company and NAI maintain 401(k) plans with terms that are substantially identical. For fiscal 2014, Messrs. Dye and Sampson were eligible to participate in the 401(k) plan sponsored by NAI, and the other NEOs were eligible to participate in the company’s 401(k) plan. The plans permit eligible employees to make voluntary, pre-tax contributions to the plan up to a specified percentage of compensation, subject to applicable tax limitations. We may make a discretionary matching contribution to the plans equal to a pre-determined percentage of an employee’s voluntary, pre-tax contributions and may make an additional discretionary profit sharing contribution to the plans, subject to applicable tax limitations. Eligible employees who elect to participate in the plans are generally vested in any matching contribution after one year of service with us and fully vested at all times in their employee contributions to the plans. The plans are intended to be tax-qualified under Section 401(a) of the Code, so that contributions to the plans and income earned on plan contributions are not taxable to employees until withdrawn from the plan, and so that our contributions, if any, will be deductible by us when made. Our board of directors determines the matching contribution rate under the 401(k) plans for each year. For fiscal 2014, our board of directors set a matching contribution rate equal to 50% up to 7% of base salary.
Safeway Retirement Plans
In connection with the Safeway acquisition, we assumed the Safeway Inc. Employee Retirement Plan, a qualified defined benefit pension plan, and the Safeway Inc. Retirement Restoration Plan and Retirement Restoration Plan II, non-qualified and unfunded defined benefit pension plans. See “—Pension Benefits” below for information regarding Mr. Edwards’ participation in these plans.
Other Benefits
Executives participate in the health and dental coverage, company-paid term life insurance, disability insurance, paid time off and paid holidays programs applicable to other employees in their locality. We also maintain a relocation policy applicable to employees who are required to relocate their residence. Messrs. Dimond and Sampson received relocation benefits under the policy in fiscal 2014. These benefits are designed to be competitive with overall market practices and are in place to attract and retain the necessary talent in the business.
Perquisites
Except as noted below or elsewhere in this Compensation Discussion and Analysis, our NEOs are generally not entitled to any perquisites that are not otherwise available to all of our employees.
Under his employment agreement, Mr. Miller is entitled to the use of corporate aircraft for up to 100 hours per year for himself, his family members and guests at no cost to him, other than to pay income tax on such usage at the lowest permissible rate. Other executives, generally those with the title of executive vice president or above, may request the personal use of a company owned aircraft subject to availability.
The company agreed to continue to maintain life insurance coverage on Mr. Edwards’ life to the extent Safeway maintained such policy, for a period during his term of employment and beyond his termination, for a period not to exceed five years and an amount not to exceed $5,000,000.
154
Table of Contents
For fiscal 2014, Messrs. Edwards, Denningham and Dye were eligible for financial and tax planning services. The maximum amount of this benefit for Messrs. Denningham and Dye was increased to, and Mr. Dimond became eligible to receive this benefit for, up to $8,000 per year, effective upon the closing of the Safeway acquisition.
Risk Mitigation
Our compensation committee has assessed the risk associated with our compensation practices and policies for employees, including a consideration of the balance between risk-taking incentives and risk-mitigating factors in our practices and policies. The assessment determined that any risks arising from our compensation practices and policies are not reasonably likely to have a material adverse effect on our business or financial condition.
Impact of Accounting and Tax Matters
As a general matter, the compensation committee will be responsible for reviewing and considering the various tax and accounting implications of compensation vehicles that we utilize. With respect to accounting matters, the compensation committee will examine the accounting cost associated with equity compensation in light of ASC 718.
With respect to tax matters, the compensation committee may consider the impact of Section 162(m) of the Code (“Section 162(m)”), which generally prohibits any publicly-held corporation from taking a Federal income tax deduction for compensation paid in excess of $1 million in any taxable year to the chief executive officer and any other executive officer (other than the chief financial officer) employed on the last day of the taxable year whose compensation is required to be disclosed to stockholders under SEC rules. Exceptions include qualified performance-based compensation, among other things. Because of a transition period permitted under Section 162(m) in connection with a company’s initial public offering, in general, the deduction limit under Section 162(m) does not currently apply to compensation payable by the company under the plans approved by our equityholders prior to the offering. This transition period will continue until the earliest of a material amendment of the plan, all of the stock or other compensation that has been allocated under the plan has been issued and our first annual stockholder meeting at which directors are to be elected that occurs after the close of the third calendar year following the calendar year that the offering occurs. It is the compensation committee’s policy to maximize the effectiveness of our executive compensation plans in this regard. Nonetheless, the compensation committee retains the discretion to grant awards (such as restricted stock with time-based vesting) that will not comply with the performance-based exception of Section 162(m) if it is deemed in the best interest of the company to do so.
155
Table of Contents
Summary Compensation Table
| Name and |
Year | Salary ($)(1) |
Bonus ($)(2) |
Unit Awards ($)(3) |
Option Awards ($) |
Non- Equity Incentive Plan Compensation ($)(4) |
Change in Pension Value and Nonqualified Deferred Compensation Earnings ($)(5) |
All Other Compensation ($)(6) |
Total ($) |
|||||||||||||||||||||||||||
| (a) |
(b) | (c) | (d) | (e) | (f) | (g) | (h) | (i) | (j) | |||||||||||||||||||||||||||
| Robert G. Miller Chairman and Chief Executive Officer(7) |
2014 | 1,567,307 | 15,000,000 | 74,070,357 | — | 12,334,179 | — | 327,912 | 103,299,755 | |||||||||||||||||||||||||||
| 2013 | 1,482,692 | 700,000 | 3,383,335 | — | 381,750 | — | 118,823 | 6,066,600 | ||||||||||||||||||||||||||||
| 2012 | 1,200,000 | — | — | — | 715,037 | — | 118,554 | 2,033,591 | ||||||||||||||||||||||||||||
| Robert L. Edwards Former President and Chief Executive Officer(8) |
2014 | 127,404 | — | 74,070,335 | — | — | — | 17,201 | 74,214,940 | |||||||||||||||||||||||||||
| Robert B. Dimond Executive Vice President and Chief Financial Officer(9) |
2014 | 713,462 | 625,000 | — | — | 664,482 | — | 11,676 | 2,014,620 | |||||||||||||||||||||||||||
| Wayne A. Denningham Chief Operating Officer(10) |
2014 | 387,500 | 275,000 | — | — | 8,648,669 | — | 34,051 | 9,345,220 | |||||||||||||||||||||||||||
| 2013 | 341,250 | 24,550 | — | — | 610,888 | — | 47,173 | 1,023,861 | ||||||||||||||||||||||||||||
| 2012 | 308,942 | — | — | — | 613,099 | — | 34,040 | 956,081 | ||||||||||||||||||||||||||||
| Justin Dye Chief Administrative Officer(11) |
2014 | 767,308 | 500,000 | — | — | 10,877,525 | — | 81,695 | 12,226,528 | |||||||||||||||||||||||||||
| 2013 | 727,500 | 700,000 | 3,383,335 | — | 885,175 | — | 50,482 | 5,746,492 | ||||||||||||||||||||||||||||
| 2012 | 420,000 | — | — | — | 815,413 | — | 60,122 | 1,295,535 | ||||||||||||||||||||||||||||
| Shane Sampson Chief Marketing and Merchandising Officer(12) |
2014 | 383,654 | 560,000 | — | — | 358,416 | — | 10,347 | 1,312,417 | |||||||||||||||||||||||||||
| |
2013 |
|
324,423 | 200,000 | — | — | 171,538 | — | 41,099 | 737,060 | ||||||||||||||||||||||||||
| 1. | Reflects a 53 week year for fiscal 2014 and 52 week years for fiscal 2013 and fiscal 2012. |
156
Table of Contents
| 2. | Reflects retention bonuses and special deal bonuses paid to the NEOs, as set forth in the table below. The retention bonuses and special deal bonuses for fiscal 2014 are further described in “—Compensation Discussion and Analysis.” The special deal bonuses paid to Messrs. Miller, Denningham and Dye for fiscal 2013 were paid in recognition of their efforts in connection with the successful completion of the NAI acquisition. In addition, for Mr. Sampson, the amount for fiscal 2013 reflects a sign-on bonus in the amount of $200,000. |
| Name |
Fiscal Year | Retention Bonus ($) | Special Deal Bonus ($) | |||||||||
| Robert G. Miller |
2014 | — | 15,000,000 | |||||||||
| 2013 | — | 700,000 | ||||||||||
| 2012 | — | — | ||||||||||
| Robert B. Dimond |
2014 | 375,000 | 250,000 | |||||||||
| Wayne A. Denningham |
2014 | 175,000 | 100,000 | |||||||||
| 2013 | — | 24,550 | ||||||||||
| 2012 | — | — | ||||||||||
| Justin Dye |
2014 | — | 500,000 | |||||||||
| 2013 | — | 700,000 | ||||||||||
| 2012 | — | — | ||||||||||
| Shane Sampson |
2014 | 310,000 | 250,000 | |||||||||
| 2013 | — | — | ||||||||||
| 3. | Reflects the grant date fair value calculated in accordance with ASC 718. For Mr. Miller, the amount reflects the Investor Incentive Units granted to him in fiscal 2014 and the Class C Units granted to him in fiscal 2013. For Mr. Edwards, the amount reflects the Series 1 Incentive Units granted to him in fiscal 2014. For Mr. Dye, the amount reflects the Class C Units granted to him in fiscal 2013. See Note 10—Equity-Based Compensation in our consolidated financial statements, included elsewhere in this prospectus, for a discussion of the assumptions used in the valuation of equity-based awards. |
| 4. | Reflects amounts paid to the NEOs under our bonus plan (based on quarterly performance) for the applicable fiscal year and amounts paid to the NEOs with respect to long-term incentive plan awards that vested in the applicable fiscal year or otherwise became payable in fiscal 2014 upon termination of the long-term incentive plan, as set forth in the table below. The amounts paid for fiscal 2014 are further described in “—Compensation Discussion & Analysis.” |
| Name |
Fiscal Year | Fiscal Year Bonus ($) |
LTIP I Bonus ($) |
LTIP II Bonus ($) |
||||||||||||
| Robert G. Miller |
2014 | — | 4,344,067 | 7,990,112 | ||||||||||||
| 2013 | — | 6,750 | 375,000 | |||||||||||||
| 2012 | — | 340,037 | 375,000 | |||||||||||||
| Robert B. Dimond |
2014 | 664,482 | — | — | ||||||||||||
| Wayne A. Denningham |
2014 | 371,551 | 1,086,017 | 7,191,101 | ||||||||||||
| 2013 | 271,700 | 1,688 | 337,500 | |||||||||||||
| 2012 | 190,590 | 85,009 | 337,500 | |||||||||||||
| Justin Dye |
2014 | 715,379 | 2,172,034 | 7,990,112 | ||||||||||||
| 2013 | 506,800 | 3,375 | 375,000 | |||||||||||||
| 2012 | 270,395 | 170,018 | 375,000 | |||||||||||||
| Shane Sampson |
2014 | 358,416 | — | — | ||||||||||||
| 2013 | 171,538 | — | — | |||||||||||||
| 5. | For Mr. Edwards, the amount of aggregate change in pension value was ($22,315) from the commencement of his employment with the company through the end of fiscal 2014 under the Safeway Inc. Employee Retirement Plan, Retirement Restoration Plan and Retirement Restoration Plan II. The company assumed these plans in connection with the Safeway acquisition. The aggregate value of Mr. Edwards’ account under these plans at the end of fiscal 2014 was $682,283. |
157
Table of Contents
| 6. | A detailed breakdown of “All Other Compensation” for fiscal 2014 is provided in the table below: |
| Name |
Year | Aircraft ($)(a) |
Relocation ($) |
Life Insurance ($) |
Financial and Tax Planning ($) |
Makeup Plan Company Contribution ($)(c) |
401(k) Plan Company Contribution ($) |
Total ($) |
||||||||||||||||||||||||
| Robert G. Miller |
2014 | 114,554 | — | 125,000 | (b) | — | 79,608 | 8,750 | 327,912 | |||||||||||||||||||||||
| 2013 | 48,489 | — | — | — | 61,834 | 8,500 | 118,823 | |||||||||||||||||||||||||
| 2012 | — | — | — | — | 110,304 | 8,250 | 118,554 | |||||||||||||||||||||||||
| Robert L. Edwards |
2014 | 16,239 | — | — | 962 | — | — | 17,201 | ||||||||||||||||||||||||
| Robert B. Dimond |
2014 | — | 11,676 | — | — | — | — | 11,676 | ||||||||||||||||||||||||
| Wayne A. Denningham |
2014 | — | — | — | 4,500 | 20,801 | 8,750 | 34,051 | ||||||||||||||||||||||||
| 2013 | — | 7,681 | — | 4,500 | 26,492 | 8,500 | 47,173 | |||||||||||||||||||||||||
| 2012 | — | — | — | — | 25,790 | 8,250 | 34,040 | |||||||||||||||||||||||||
| Justin Dye |
2014 | 6,295 | — | — | 4,500 | 62,150 | 8,750 | 81,695 | ||||||||||||||||||||||||
| 2013 | — | — | — | 4,500 | 37,482 | 8,500 | 50,482 | |||||||||||||||||||||||||
| 2012 | — | — | — | — | 51,872 | 8,250 | 60,122 | |||||||||||||||||||||||||
| Shane Sampson |
2014 | — | 10,347 | — | — | — | — | 10,347 | ||||||||||||||||||||||||
| 2013 | 659 | 40,440 | — | — | — | — | 41,099 | |||||||||||||||||||||||||
| (a) | Represents the aggregate incremental cost to the company for personal use of the company’s aircraft. |
| (b) | Reflects our payment of premiums for a life insurance policy we maintain for Mr. Miller. |
| (c) | Reflects our contributions to the NEO’s Makeup Plan account in an amount equal to the excess of the amount we would contribute to the 401(k) plans as a company contribution on the NEO’s behalf for the plan year without regard to any limitations imposed by the Code based on the NEO’s compensation over the amount of our actual contributions to the 401(k) plans for the plan year. |
| 7. | Mr. Miller served as our Chief Executive Officer during fiscal years 2012 and 2013 and from the commencement of fiscal 2014 (February 21, 2014) through January 29, 2015. Mr. Miller subsequently served as our Executive Chairman from January 30, 2015 through April 9, 2015, and was appointed as our Chairman and Chief Executive Officer on April 9, 2015. |
| 8. | Mr. Edwards served as our President and Chief Executive Officer from January 30, 2015 through his transition to Vice Chairman (a non-employee position) on April 9, 2015. |
| 9. | Mr. Dimond joined the company and was appointed as our Chief Financial Officer in February 2014. |
| 10. | Mr. Denningham was appointed as our Chief Operating Officer in April 2015. Prior thereto, he served in a variety of executive positions with the company and Albertson’s LLC. |
| 11. | Mr. Dye was appointed as our Chief Administrative Officer in February 2015. Prior thereto, he served in a variety of executive positions with the company, Albertson’s LLC and NAI. |
| 12. | Mr. Sampson was appointed as our Chief Marketing and Merchandising Officer in April 2015. Prior thereto, he served in a variety of executive positions with Albertson’s LLC and NAI. |
Grants of Plan Based Awards in Fiscal 2014
| Name |
Grant Date |
Estimated Future Payouts Under Non-Equity Incentive Plan Awards(1) |
Estimated Future Payouts Under Equity Incentive Plan Awards |
All Other Unit Awards: Number of Units (#) |
All Other Option Awards: Number of Securities Underlying Options (#) |
Exercise or Base Price of Option Awards ($/Unit) |
Grant Date Fair Value of Unit and Option Awards ($)(4) |
|||||||||||||||||||||||||||||||||||||
| Threshold ($) |
Target ($) |
Maximum ($) |
Threshold ($) |
Target ($) |
Maximum ($) |
|||||||||||||||||||||||||||||||||||||||
| (a) |
(b) | (c) | (d) | (e) | (f) | (g) | (h) | (i) | (j) | (k) | (l) | |||||||||||||||||||||||||||||||||
| Robert |
1/30/2015 | — | — | — | — | — | — | 3,350,084 | (2) | — | — | 74,070,357 | ||||||||||||||||||||||||||||||||
| Robert |
1/30/2015 | — | — | — | — | — | — | 3,350,083 | (3) | — | — | 74,070,335 | ||||||||||||||||||||||||||||||||
| Robert |
— | — | 428,077 | 856,154 | — | — | — | — | — | — | — | |||||||||||||||||||||||||||||||||
| Wayne |
— | — | 232,500 | 465,000 | — | — | — | — | — | — | — | |||||||||||||||||||||||||||||||||
| Justin |
— | — | 460,385 | 920,770 | — | — | — | — | — | — | — | |||||||||||||||||||||||||||||||||
| Shane |
— | — | 230,192 | 460,384 | — | — | — | — | — | — | — | |||||||||||||||||||||||||||||||||
| 1. | Amounts represent the range of annual cash incentive awards the NEO was potentially entitled to receive based on the achievement of quarterly division performance goals during fiscal 2014 under the company’s 2014 Bonus Plan as more fully described in “—Compensation Discussion and Analysis.” The amounts actually paid are reported in the Non-Equity Incentive Plan column of the Summary Compensation |
158
Table of Contents
| table. Pursuant to the 2014 Bonus Plan, performance below a specific threshold will result in no payment with respect to that performance goal. Performance at or above the threshold will result in a payment from $0 up to the maximum bonus amounts reflected in the table. |
| 2. | Represents a fully vested and non-forfeitable Investor Incentive Unit granted to Mr. Miller, as described in “—Compensation Discussion and Analysis.” |
| 3. | Represents an Incentive Unit award made to Mr. Edwards pursuant to the company’s Incentive Unit Plan, as described in “—Compensation Discussion and Analysis.” |
| 4. | Reflects the grant date fair value calculated in accordance with ASC 718. Assumptions used in the valuation of equity based awards are discussed in Note 10—Equity-Based Compensation in our consolidated financial statements included elsewhere in this prospectus. |
Outstanding Equity Awards at Fiscal Year End 2014
| Option Awards | Unit Awards | |||||||||||||||||||||||||||||||||||
| Name |
Number of Securities Underlying Unexercised Options (#) Exercisable |
Number of Securities Underlying Unexercised Options (#) Unexercisable |
Equity Incentive Plan Awards: Number of Securities Underlying Unexercised Unearned Options (#) |
Option Exercise Price ($) |
Option Expiration Date |
Number of Units That Have Not Vested (#) |
Market Value of Units That Have Not Vested ($) |
Equity Incentive Plan Awards: Number of Unearned Units or Other Rights That Have Not Vested (#) |
Equity Incentive Plan Awards: Market or Payout Value of Unearned Units or Other Rights That Have Not Vested ($) |
|||||||||||||||||||||||||||
| (a) |
(b) | (c) | (d) | (e) | (f) | (g) | (h) | (i) | (j) | |||||||||||||||||||||||||||
| Robert G. Miller |
— | — | — | — | — | — | — | — | — | |||||||||||||||||||||||||||
| Robert L. Edwards |
— | — | — | — | — | 3,350,083 | (1) | — | (2) | — | — | |||||||||||||||||||||||||
| Robert B. Dimond |
— | — | — | — | — | — | — | — | — | |||||||||||||||||||||||||||
| Wayne A. Denningham |
— | — | — | — | — | — | — | — | — | |||||||||||||||||||||||||||
| Justin Dye |
— | — | — | — | — | — | — | — | — | |||||||||||||||||||||||||||
| Shane Sampson |
— | — | — | — | — | — | — | — | — | |||||||||||||||||||||||||||
| 1. | Reflects the full number of Incentive Units granted to Mr. Edwards. These Incentive Units were granted subject to vesting as described in “—Compensation Discussion and Analysis.” In connection with his transition to the position of Vice Chairman, Mr. Edwards and the company agreed that he would forfeit 1,675,041.5 of his Series 1 Incentive Units. The remaining 1,675,041.5 Series 1 Incentive Units will vest in full on January 30, 2016, the first anniversary of the closing date of the Safeway acquisition, subject to his continued service through that date with accelerated vesting in the event of certain terminations of his service as described in “—Compensation Discussion and Analysis.” |
| 2. | Because there was no public market for our equity as of February 28, 2015, the market value of the Series 1 Incentive Units as of that date is not determinable. Accordingly, we cannot calculate the market value of the unvested Series 1 Incentive Units as of that date. |
159
Table of Contents
Option Exercises and Units Vested in Fiscal 2014
| Name |
Option Awards | Unit Awards | ||||||||||||||
| Number of Shares Acquired on Exercise (#) |
Value Realized on Exercise ($) |
Number of Units Acquired on Vesting (#)(1) |
Value Realized on Vesting ($)(2) |
|||||||||||||
| (a) |
(b) | (c) | (d) | (e) | ||||||||||||
| Robert G. Miller |
— | — | 440,242 | 3,383,335 | ||||||||||||
| Robert L. Edwards |
— | — | — | — | ||||||||||||
| Robert B. Dimond |
— | — | — | — | ||||||||||||
| Wayne A. Denningham |
— | — | — | — | ||||||||||||
| Justin Dye |
— | — | 440,242 | 3,383,335 | ||||||||||||
| Shane Sampson |
— | — | — | — | ||||||||||||
| 1. | Represents the vesting of Class C Units as described in “—Compensation Discussion and Analysis.” |
| 2. | The value realized upon vesting of the Class C Units is based on a vesting date per unit value of $7.69. |
Pension Benefits
The following table quantifies the benefits expected to be paid to Mr. Edwards under the Safeway ERP, a qualified defined benefit pension plan; and the Safeway Inc. Retirement Restoration Plan and Retirement Restoration Plan II (collectively, the “RRP”), non-qualified and unfunded defined benefit pension plans, as of February 28, 2015. The company assumed the Safeway ERP and the RRP from Safeway in connection with the Safeway acquisition. The terms of the plans are described below the table.
The following actuarial assumptions were employed to derive the calculations shown on the table below: (1) pension economic assumptions consistent with pension financial reporting by Safeway for its 2014 fiscal year were used for calculations at the end of 2014; (2) demographic assumptions are also consistent with pension financial reporting, with the exception of modified retirement and pre-retirement decrements as required by SEC guidance; (3) discount rates of 3.9% for the Safeway ERP and 3.8% for the RRP; and (4) a cash balance interest crediting and annuity conversion interest rate of 3.0%.
Additional actuarial assumptions used include the following: (1) mortality table for lump sum conversion—2014 IRS Applicable Mortality Table; (2) retirement table for post-retirement mortality—RP2014 fully generational using MP 2014 scale; (3) no pre-retirement mortality, turnover or disability; (4) form of payment assumption of 65% lump sum and 35% single life annuity for the Safeway ERP and 100% single life annuity for the RRP; and (5) retirement age of 65.
| Name |
Plan Name(1) | Number of Years Credited Service (#)(2) |
Present Value of Accumulated Benefit ($) |
Payments During Last Fiscal Year ($) |
||||||||||||
| (a) |
(b) | (c) | (d) | (e) | ||||||||||||
| Robert L. Edwards |
ERP | 9.9 | 137,422 | — | ||||||||||||
| RRP | 9.9 | 502,678 | — | |||||||||||||
| 1. | In connection with the termination of his employment, Mr. Edwards elected to receive his vested benefit under the Safeway ERP in a lump sum. In connection with the termination of his employment, Mr. Edwards’ vested benefit under the RRP will be paid to him via an annuity paid monthly. |
| 2. | The number of years of credited service and the present value of accumulated benefits are calculated as of February 28, 2015. |
160
Table of Contents
Nonqualified Deferred Compensation
The following table shows the executive and company contributions, earnings and account balances for the NEOs under the Makeup Plans during fiscal 2014. The Makeup Plans are non-qualified deferred compensation arrangements intended to comply with Section 409A of the Code. See “—Compensation Discussion and Analysis” for a description of the terms and conditions of the Makeup Plans. The aggregate balance of each participant’s account consists of amounts that have been deferred by the participant, company contributions, plus earnings (or minus losses). We do not deposit any amounts into any trust or other account for the benefit of plan participants. In accordance with tax requirements, the assets of the Makeup Plan are subject to claims of our creditors.
| Name |
Executive Contributions in Last FY ($)(1) |
Registrant Contributions in Last FY ($)(2) |
Aggregate Earnings in Last FY ($)(3) |
Aggregate Withdrawals/ Distributions ($) |
Aggregate Balance at Last FYE ($) |
|||||||||||||||
| (a) |
(b) | (c) | (d) | (e) | (f) | |||||||||||||||
| Robert G. Miller |
2,005,777 | 475,446 | 94,978 | — | 4,248,619 | |||||||||||||||
| Robert L. Edwards |
— | — | — | — | — | |||||||||||||||
| Robert B. Dimond |
90,124 | — | 6,740 | — | 93,561 | |||||||||||||||
| Wayne A. Denningham |
623,847 | 311,313 | 76,847 | — | 1,546,602 | |||||||||||||||
| Justin Dye |
828,946 | 396,770 | 114,871 | — | 2,623,377 | |||||||||||||||
| Shane Sampson |
— | — | — | — | — | |||||||||||||||
| 1. | All executive contributions represent amounts deferred by each NEO under a Makeup Plan and are included as compensation in the Summary Compensation Table under “Salary,” “Bonus” and “Non-Equity Incentive Plan Compensation.” |
| 2. | All registrant contributions are reported under “All Other Compensation” in the Summary Compensation Table. |
| 3. | These amounts are not reported in the Summary Compensation Table as none of the earnings are based on interest above the market rate. |
Incentive Plans
Incentive Unit Plan
Effective upon the closing of the Safeway acquisition, we adopted the Incentive Unit Plan which provided for grants of “Incentive Units” to the employees, directors and consultants of the company or its subsidiaries selected by the board of directors. A maximum of 20,100,503 Incentive Units were available for issuance under the Incentive Unit Plan, subject to adjustment in the event of a change in the company’s capital structure. The Incentive Units represent a membership interest in the company. Any Incentive Units will be granted as profits interests that would only share in the value of the company above its valuation at grant.
The Incentive Unit Plan provides that, unless otherwise provided in an award agreement, in the event of the termination of a participant’s service for any reason, any unvested Incentive Units will be forfeited without the payment of consideration. In the event of the termination of a participant’s service for Cause, unless otherwise provided in an award agreement, any vested Incentive Units will be forfeited without the payment of consideration.
For purposes of the Incentive Unit Plan, “Cause” is as defined in a participant’s employment agreement, or if not so defined, generally means:
| • | the commission of a felony or a misdemeanor (excluding petty offenses) involving fraud, dishonesty or moral turpitude; |
| • | a participant’s failure (other than as a result of incapacity due to mental or physical impairment) to perform his material duties; |
161
Table of Contents
| • | acts of dishonesty resulting or intending to result in personal gain or enrichment at the expense of the company, or its subsidiaries or affiliates; |
| • | a breach of any material written policy of the company or its subsidiaries; |
| • | the failure to follow the lawful written directions of our Chief Executive Officer, our Executive Chairman, the board of directors or the person to whom the participant reports; |
| • | conduct in connection with a participant’s duties that is fraudulent, grossly negligent or otherwise materially injurious to the company or its subsidiaries or affiliates; or |
| • | a breach of restrictive covenants under which the participant is subject. |
The Incentive Unit Plan will terminate upon the consummation of the IPO-Related Transactions and this offering.
Phantom Unit Plan
In fiscal 2015, we adopted the Phantom Unit Plan which provides for grants of “Phantom Units” to the employees, directors and consultants of the company or its subsidiaries selected by the board of directors. Each Phantom Unit provides the participant with a contractual right to receive upon vesting one Incentive Unit under the terms and conditions of the Incentive Unit Plan. A maximum of 20,100,503 Phantom Units, less the number of Incentive Units granted under the Incentive Unit Plan, are available for issuance under the Phantom Unit Plan, subject to adjustment in the event of a change in the company’s capital structure.
The Phantom Unit Plan provides that the company may provide for a participant’s Phantom Unit award to include a separate right to receive a “Tax Bonus.” A Tax Bonus entitles a participant to receive a bonus equal to 4% of the fair market value of the Incentive Units paid to the participant in respect of vested Phantom Units. Tax Bonuses may be paid in cash, Incentive Units or a combination thereof.
The Phantom Unit Plan provides that, unless otherwise provided in an award agreement, in the event of the termination of a participant’s service for any reason, any unvested Phantom Units and any rights to a future Tax Bonus will be forfeited without the payment of consideration. In the event of the termination of a participant’s service for Cause (which for purposes of the Phantom Unit Plan has the same meaning as defined in the Incentive Unit Plan as set forth above), unless otherwise provided in an award agreement, any Incentive Units issued with respect to a vested Phantom Unit and any rights to a future Tax Bonus will be forfeited without the payment of consideration.
Upon the consummation of the IPO-Related Transactions and this offering, all outstanding Phantom Units will automatically be converted to restricted stock units that will be settled upon vesting in shares of our common stock. The restricted stock units will be subject to a Restricted Stock Unit Plan that will have substantially the same terms as, and will supersede, the Phantom Unit Plan except that no new awards may be granted thereunder. As of the date of this prospectus, there are 10,865,000 Phantom Units outstanding that, based on an initial public offering price of $24.50 per share, the midpoint of the estimated price range set forth on the cover page of this prospectus, would automatically convert into 10,711,903 restricted stock units.
2015 Equity and Incentive Award Plan
We have adopted the 2015 Incentive Plan, although no awards will be made under it until the effective date of the registration statement of which this prospectus is a part. The principal features of the 2015 Incentive Plan are summarized below, but the summary is qualified in its entirety by reference to the 2015 Incentive Plan itself, which is filed as an exhibit to the registration statement of which this prospectus is a part.
162
Table of Contents
Securities Subject to the 2015 Incentive Plan. A maximum of five percent (5%) of the shares of our common stock that are outstanding as of the consummation of this offering may be issued or transferred pursuant to awards under the 2015 Incentive Plan. The number of shares of our common stock available under the 2015 Incentive Plan will be reduced by one share for each share issued under an award. The shares of our common stock covered by the 2015 Incentive Plan may be treasury shares, authorized but unissued shares or shares purchased in the open market.
In the event of any termination, expiration, lapse or forfeiture of an award, any shares subject to the award will again be made available for future grants under the 2015 Incentive Plan. Any shares of restricted stock repurchased by the company at the same price paid for such shares will be made available for issuance again under the 2015 Incentive Plan.
Eligibility. All of our employees, consultants, and directors, and employees and consultants of our affiliates, will be eligible to receive awards under the 2015 Incentive Plan.
Awards under the 2015 Incentive Plan. The 2015 Incentive Plan provides that the administrator may grant or issue stock options, which may be non-qualified stock options (“NQSOs”) or, solely to eligible employees, incentive stock options designed to comply with the applicable provisions of Section 422 of the Code, stock appreciation rights (“SARs”), restricted stock, restricted stock units, deferred stock, performance awards and stock payments, or any combination thereof. The terms and conditions of each award will be set forth in a separate agreement with the person receiving the award and will indicate the type, terms and conditions of the award.
Award Limits. The 2015 Incentive Plan provides for a maximum aggregate amount of shares of common stock that may be granted to a participant in any calendar year subject to adjustment under certain circumstances in order to prevent the dilution or enlargement of the potential benefits intended to be made available under the 2015 Incentive Plan, as described below. In addition, the 2015 Incentive Plan provides for an annual award limit for performance awards that are payable solely in cash.
Vesting and Exercise of Awards. The applicable award agreement will contain the period during which the right to exercise the award in whole or in part vests, including the events or conditions upon which the vesting of an award may accelerate. No portion of an award which is not vested at the participant’s termination of employment, termination of directorship or termination of consulting relationship, as applicable, will subsequently become vested, except as may be otherwise provided by the administrator either in the agreement relating to the award or by action following the grant of the award.
Transferability of Awards. Awards generally may not be sold, pledged, assigned or transferred in any manner other than by will or by the laws of descent and distribution or, subject to the consent of the administrator, pursuant to a domestic relations order, unless and until such award has been exercised, or the shares underlying such award have been issued, and all restrictions applicable to such shares have lapsed. Notwithstanding the foregoing, NQSOs may be transferred without consideration to certain family members and trusts with the administrator’s consent. Awards may be exercised, during the lifetime of the participant, only by the participant or such permitted transferee.
Forfeiture and Claw-Back Provisions. In the event a participant (i) terminates service with the company prior to a specified date or within a specified time following receipt or exercise of the award, (ii) the company terminates the participant’s service for “cause,” or (iii) the participant engages in certain competitive activities with the company, the administrator has the right to require the participant to repay any proceeds, gains or other economic benefit actually or constructively received by the
163
Table of Contents
participant or to terminate the award. In addition, all awards (including any proceeds, gains or other economic benefit actually or constructively received by the participant) may be subject to the provisions of any claw-back policy implemented by the company, including, without limitation, any claw-back policy adopted to comply with the requirements of the Dodd-Frank Wall Street Reform and Consumer Protection Act.
2015 Incentive Plan Benefits. The future benefits that will be received under the 2015 Incentive Plan by our current directors, executive officers and all eligible employees are not currently determinable.
Adjustments for Stock Splits, Recapitalizations, Mergers and Equity Restructurings. In the event of any recapitalization, reclassification, stock split, reverse stock split, reorganization, merger, consolidation, split-up, spin-off or other transaction that affects our common stock, the 2015 Incentive Plan will be equitably adjusted, including the number of available shares, in order to prevent the dilution or enlargement of the benefits or potential benefits intended to be made available under the 2015 Incentive Plan or with respect to any award.
Administration of the 2015 Incentive Plan. The compensation committee is the administrator of the 2015 Incentive Plan. Subject to certain limitations, the committee may delegate its authority to grant awards to one or more committees consisting of one or more members of the board of directors or one or more of our officers.
Amendment and Termination of the 2015 Incentive Plan. Our board of directors and the compensation committee may amend the 2015 Incentive Plan at any time, subject to stockholder approval to the extent required by applicable law or regulation or the listing standards of the (or any other market or stock exchange on which our common stock is at the time primarily traded).
Additionally, stockholder approval will be specifically required to increase the maximum number of shares of our common stock which may be issued under the 2015 Incentive Plan, change the eligibility requirements or decrease the exercise price of any outstanding option or stock appreciation right granted under the 2015 Incentive Plan. The board of directors and the compensation committee may amend the terms of any award theretofore granted, prospectively or retroactively, however, except as otherwise provided in the 2015 Incentive Plan, no such amendment will, without the consent of the participant, alter or impair any rights of the participant under such award without the consent of the participant unless the award itself otherwise expressly so provides.
Our board of directors and the compensation committee may suspend or terminate the 2015 Incentive Plan at any time. However, in no event may an award be granted pursuant to the 2015 Incentive Plan on or after the tenth anniversary of the effective date of the 2015 Incentive Plan.
Prohibition on Repricing. Except in connection with a corporate transaction involving the company (including, without limitation, any stock distribution, stock split, extraordinary cash distribution, recapitalization, reorganization, merger, consolidation, split-up, spin-off, combination or exchange of shares), the administrator will not, without the approval of the stockholders, authorize the amendment of any outstanding award to reduce its price per share, including any amendment to reduce the exercise price per share of outstanding options or SARs.
Executive Incentive Bonus Plan
We have adopted the Executive Incentive Bonus Plan. The principal features of the Executive Incentive Bonus Plan are summarized below, but the summary is qualified in its entirety by reference to the Executive Incentive Bonus Plan itself, which is filed as an exhibit to the registration statement of which this prospectus is a part.
164
Table of Contents
Plan Administration. The Executive Incentive Bonus Plan is administered by our board of directors or a committee selected by our board of directors to administer the Executive Incentive Bonus Plan and composed of not less than two directors, each of whom is an “outside director” (within the meaning of Section 162(m) of the Code) (as applicable, the “Plan Committee”). The Plan Committee selects the officers or key executives who will be eligible to receive awards, establishes the maximum award that may be earned by each participant and establishes the goals for each participant. The Plan Committee calculates and determines each participant’s level of attainment of such goals, and calculates the bonus award for each participant based upon such level of attainment.
Eligibility. For each performance period, the Plan Committee will select the officers and key executives of the company and its subsidiaries and divisions who are eligible to participate in the Executive Incentive Bonus Plan.
General Description of the Executive Incentive Bonus Plan. Participants in the Executive Incentive Bonus Plan will be eligible to receive cash performance awards based on attainment by the company and/or a subsidiary, division or other operational unit of the company of specified performance goals to be established for each performance period by the Compensation Committee. The Executive Incentive Bonus Plan provides for a maximum amount of any bonus award intended to qualify for the performance-based compensation exception to Section 162(m) of the Code payable to a single participant for any performance period consisting of a 12-month period (including a fiscal or calendar year), which amount is reduced on a pro rata basis for any performance period of less than 12 months. Unless otherwise provided by the Plan Committee or set forth in a written agreement between the company and a participant, bonus awards are intended to constitute “short term deferrals” for purposes of Section 409A of the Code and will be paid within the applicable short-term deferral period under Section 409A of the Code. Payment of bonus awards will be made in the form of cash, our common stock or equity awards in respect of our common stock, which common stock or equity awards may be subject to additional vesting provisions as determined by the Plan Committee. Any shares of common stock or equity awards granted in satisfaction of a bonus award will be granted under the 2015 Incentive Plan. To be eligible to receive a payment of a bonus award with respect to a performance period, a participant must satisfy such employment requirements as may be imposed by the Plan Committee. In the event of a participant’s death prior to the payment of a bonus award which has been earned, such payment will be made to the participant’s designated beneficiary or, if there is none living, to the estate of the participant.
Performance Criteria. The performance criteria will be measured in terms of one or more of the following objectives, which objectives may relate to company-wide objectives or of the subsidiary, division, department or function of the company or subsidiary: (i) net earnings (either before or after interest, taxes, depreciation and amortization), (ii) gross or net sales or revenue, (iii) net income (either before or after taxes), (iv) operating profit, (v) cash flow (including, but not limited to, operating cash flow and free cash flow), (vi) return on assets, (vii) return on capital, (viii) return on stockholders’ equity, (ix) return on sales, (x) gross or net profit or operating margin, (xi) costs, (xii) funds from operations, (xiii) expense, (xiv) working capital, (xv) earnings per share, (xvi) price per share of our common stock, (xvii) United States Food and Drug Administration or other regulatory body approval for commercialization of a product, (xviii) market share, (xix) identical store sales, and (xx) identical store sales excluding fuel, any of which may be measured either in absolute terms or as compared to any incremental increase or decrease or as compared to results of a peer group.
Term and Amendment. The Plan Committee may amend, suspend or terminate the Executive Incentive Bonus Plan at any time, except that no amendment may be made without the approval of our stockholders if the effect of such amendment would be to cause outstanding or pending awards intended to qualify for the performance-based compensation exception to Section 162(m) of the Code to cease to qualify for the performance-based compensation exception to Section 162(m) of the Code.
165
Table of Contents
Potential Payments Upon Termination or Change in Control
The tables below describe and estimate the amounts and benefits that our NEOs would have been entitled to receive upon a termination of their employment in certain circumstances or, if applicable, upon a change in control, assuming such events occurred as of February 28, 2015, the last day of fiscal 2014 (based on the plans and arrangements in effect on such date). The estimated payments are not necessarily indicative of the actual amounts any of our NEOs would have received in such circumstances. The tables exclude compensation amounts accrued through February 28, 2015, that would be paid in the normal course of continued employment, such as accrued but unpaid salary, payment for accrued but unused vacation and vested account balances under our retirement plans that are generally available to all of our salaried employees. The tables below do not include any amounts with respect to the Phantom Units which were granted in fiscal 2015.
| Robert G. Miller |
||||||||||||
| Payments and Benefits |
Death ($) | For Any Reason other than Death, Without Cause or for Good Reason ($) |
Without Cause or for Good Reason ($) |
|||||||||
| Cash Payments |
3,000,000 | (1) | 6,000,000 | (2) | 11,833,333 | (3) | ||||||
| Total |
3,000,000 | 6,000,000 | 11,833,333 | |||||||||
| (1) | Reflects cash payments of $25,000 per month to Mr. Miller’s spouse payable for a period of 10 years following his termination due to death. Such payments would cease upon the death of Mr. Miller’s spouse. |
| (2) | Reflects cash payments of $50,000 per month to Mr. Miller payable for a period of 10 years following his termination for any reason. In the event of his death following termination, such payments will cease and thereafter his surviving spouse will become entitled to cash payments of $25,000 per month through the earlier of her death and the 10-year anniversary of Mr. Miller’s termination. |
| (3) | Reflects a lump sum cash payment equal to the sum of (a) $50,000 per month to Mr. Miller payable for a period of 10 years following his termination for any reason and (2) an amount equal to Mr. Miller’s base salary for the remainder of the term of his employment under his employment agreement (35 months following February 28, 2015). |
| Robert L. Edwards(1) |
||||||||||||||||
| Payments and Benefits |
Death or Disability ($) |
For Cause or Without Good Reason ($) |
Without Cause or for Good Reason (no Change in Control) ($) |
Change in Control (no termination) ($) |
||||||||||||
| Cash Payments |
3,500,000 | (2) | — | 6,000,000 | (3) | — | ||||||||||
| Health Benefits |
— | — | 23,494 | (4) | — | |||||||||||
| Total |
3,500,000 | — | 6,023,494 | — | ||||||||||||
| (1) | The table for Mr. Edwards is included in compliance with SEC guidelines. As discussed elsewhere in the registration statement, subsequent to February 28, 2015, Mr. Edwards ceased to be an employee of the company. |
| (2) | Reflects a lump sum payout of Mr. Edwards’ death benefit under the Safeway Inc. Retirement Restoration Plan II. |
| (3) | Reflects a lump sum cash payment equal to two times Mr. Edwards’ base salary plus target annual bonus. |
| (4) | Reflects the cost of reimbursement for up to 18 months continuation of health coverage. |
In addition to the amount set forth in the table above, Mr. Edwards’ Series 1 Incentive Units would have accelerated and become vested as to (i) upon his death or termination due to disability, without Cause or for Good Reason, a prorated portion of the Series 1 Incentive Units that would have otherwise vested on the next scheduled vesting date, (ii) upon a termination without Cause occurring
166
Table of Contents
within 180 days prior to a change in control, 100% of the Time-Based Units and a prorated portion of the Performance-Based Units that would have otherwise vested on the next scheduled vesting date, and (iii) upon a change in control, 100% of the Time-Based Units. Because there was no public market for our equity as of February 28, 2015, the market value of the Series 1 Incentive Units as of that date is not determinable. Accordingly, we cannot calculate the value of accelerated vesting of Series 1 Incentive Units as of that date.
| Robert B. Dimond |
||||||||||||
| Payments and Benefits |
Death or Disability ($) | For Cause or Without Good Reason |
Without Cause or for Good Reason ($) |
|||||||||
| Cash Payments |
175,000 | (1) | — | 3,266,667 | (2) | |||||||
| Health Benefits |
— | — | 56,292 | (3) | ||||||||
| Total |
175,000 | — | 3,322,959 | |||||||||
| (1) | Reflects a lump sum cash payment in an amount equal to 25% of Mr. Dimond’s base salary. |
| (2) | Reflects a lump sum cash payment equal to the sum of Mr. Dimond’s base salary plus target annual bonus, in each case for the remainder of the term of his employment under his employment agreement (35 months following February 28, 2015). |
| (3) | Reflects the cost of reimbursement for up to 36 months continuation of health coverage. |
| Justin Dye |
||||||||||||
| Payments and Benefits |
Death or Disability ($) | For Cause or Without Good Reason |
Without Cause or for Good Reason ($) |
|||||||||
| Cash Payments |
187,500 | (1) | — | 3,500,000 | (2) | |||||||
| Health Benefits |
— | — | 37,137 | (3) | ||||||||
| Total |
187,500 | — | 3,537,137 | |||||||||
| (1) | Reflects a lump sum cash payment in an amount equal to 25% of Mr. Dye’s base salary. |
| (2) | Reflects a lump sum cash payment equal to the sum of Mr. Dye’s base salary plus target annual bonus, in each case for the remainder of the term of his employment under his employment agreement (35 months following February 28, 2015). |
| (3) | Reflects the cost of reimbursement for up to 36 months continuation of health coverage. |
| Wayne A. Denningham |
||||||||||||
| Payments and Benefits |
Death or Disability ($) | For Cause or Without Good Reason |
Without Cause or for Good Reason ($) |
|||||||||
| Cash Payments |
— | — | 572,110 | (1) | ||||||||
| Health Benefits |
— | — | 2,063 | (2) | ||||||||
| Total |
— | — | 574,173 | |||||||||
| (1) | Reflects a lump sum cash payment in an amount equal to 70 weeks of Mr. Denningham’s base salary. |
| (2) | Reflects our cost for continued health insurance coverage above the active employee rate for a period of up to six months. |
| Shane Sampson |
||||||||||||
| Payments and Benefits |
Death or Disability ($) | For Cause or Without Good Reason |
Without Cause or for Good Reason ($) |
|||||||||
| Cash Payments |
— | — | 417,260 | (1) | ||||||||
| Health Benefits |
— | — | 3,187 | (2) | ||||||||
| Total |
— | — | 420,447 | |||||||||
| (1) | Reflects a lump sum cash payment in an amount equal to 62 weeks of Mr. Sampson’s base salary. |
| (2) | Reflects our cost for continued health insurance coverage above the active employee rate for a period of up to six months. |
167
Table of Contents
CERTAIN RELATIONSHIPS AND RELATED PARTY TRANSACTIONS
The following discussion is a brief summary of certain material arrangements, agreements and transactions we have with related parties. It does not include all of the provisions of our material arrangements, agreements and transactions with related parties, does not purport to be complete and is qualified in its entirety by reference to the arrangements, agreements and transactions described. We enter into transactions with our stockholders and other entities owned by, or affiliated with, our direct and indirect stockholders in the ordinary course of business. These transactions include, amongst others, professional advisory, consulting and other corporate services.
On April 9, 2015, we entered into the Director and Consultancy Agreement with Robert Edwards, our former CEO and a former member of the board of managers of AB Acquisition. Pursuant to the Director and Consultancy Agreement, Mr. Edwards serves as a consultant to the board of directors and, prior to his resignation from the board of managers of AB Acquisition on June 13, 2015, served as Vice Chairman. The Director and Consultancy Agreement provides for us to pay Robert Edwards a consulting fee of $3 million for his service as a consultant through January 31, 2016. Mr. Edwards was also eligible to receive a director’s fee of $200,000 for his service on the board through January 31, 2016, of which $60,000 was paid to him for his service prior to his resignation from the AB Acquisition board of managers on June 13, 2015. If the Director and Consultancy Agreement is extended by mutual agreement through January 31, 2017, Mr. Edwards shall be eligible to receive an additional consulting fee of $3 million. If the Director and Consultancy Agreement is not extended through January 31, 2017, or Mr. Edwards’ service terminates due to his death or disability prior to January 31, 2016, Mr. Edwards will receive an additional payment of $3 million. In addition, under the Director and Consultancy Agreement, we have agreed to maintain any life insurance policy or death benefit, in an amount up to $5 million, provided to Mr. Edwards by Safeway for a period not beyond April 9, 2020, and to reimburse or pay his cost for health coverage under the Consolidated Omnibus Budget Reconciliation Act of 1985, as amended. Prior to his resignation from the AB Acquisition board of managers, we also agreed to provide him with up to 50 hours of personal use of the company-owned aircraft through December 31, 2015. As of September 12, 2015, we have paid Mr. Edwards approximately $1.5 million for services rendered as a consultant under the Director and Consultancy Agreement.
We paid COAC, an affiliate of Cerberus, fees totaling approximately $489,088 and $1,667,692 for fiscal 2013 and fiscal 2014, respectively, for consulting services provided in connection with improving the company’s operations. We may retain COAC to provide similar services in the future.
Several of our board members are employees of our Sponsors (excluding Kimco), and funds managed by one or more affiliates of our Sponsors indirectly own a substantial portion of our equity through their respective ownership of Albertsons Investor and Kimco.
IPO-Related Transactions
In connection with our corporate reorganization, we will engage in transactions with affiliates and our Existing Owners. See “IPO-Related Transactions and Organizational Structure” for a description of these transactions.
AB Acquisition LLC Agreement Management Fees
In March 2013, as then provided for by the third amended and restated limited liability company agreement of AB Acquisition LLC (the “3rd A&R AB LLC Agreement”), we paid Cerberus a transaction fee of $15 million in connection with the NAI acquisition. The 3rd A&R AB LLC Agreement also provided for the Cerberus-led Consortium to receive annual management fees from our company over a 42-month period beginning on March 21, 2013. We paid annual management fees under the 3rd A&R
168
Table of Contents
AB LLC Agreement totaling $6 million for fiscal 2013 and $6 million for fiscal 2014. In connection with the Safeway acquisition, the 3rd A&R AB LLC Agreement was amended and restated. Pursuant to the fourth amended and restated limited liability company agreement of AB Acquisition LLC (the “4th A&R AB LLC Agreement”), we paid the Cerberus-led Consortium the remaining $9 million in annual management fees provided for by the 3rd A&R AB LLC Agreement.
The 4th A&R AB LLC Agreement provides for the Cerberus-led Consortium to receive annual management fees of $13.75 million from our company over a 48-month period beginning on January 30, 2015, the date of the consummation of the Safeway acquisition. We have paid management fees to the Cerberus-led Consortium totaling $13.75 million for fiscal 2015. In exchange for the management fees, the Cerberus-led Consortium has provided strategic advice to management, including with respect to acquisitions and financings. As of September 12, 2015, management fees over the remainder of the 48-month period total $41.25 million. Consistent with the terms of the 4th A&R AB LLC Agreement, the remaining management fees will be paid in full upon the closing of this offering. We do not expect to pay any further management fees to the Cerberus-led Consortium following the completion of this offering.
Management Loans
In connection with the Safeway acquisition, on January 30, 2015, we provided loans (the “Management Loans”) to nine members of our management to enable them to invest in equity of AB Acquisition. Other than the loan to Robert Butler, who retired in December 2014 as our Chief Operating Officer, the Management Loans were repaid in full on July 2, 2015 from the proceeds of loans provided to Management Holdco by Goldman Sachs Bank USA and secured by a pledge of the equity owned by Management Holdco. The table below provides details for each of the Management Loans:
| Name |
Position |
Original Loan Amount |
Interest Rate | Aggregate Amount of Principal Paid |
Aggregate Amount of Interest Paid |
|||||||||||||
| Mark Bates |
Chief Information Officer | $ | 217,203 | 1.75 | % | $ | 217,203 | $ | 1,572 | |||||||||
| Robert Butler |
Chief Operating Officer (former) | $ | 500,000 | 1.75 | % | N/A | N/A | |||||||||||
| Wayne A. Denningham |
Chief Operating Officer (current) | $ | 3,801,000 | 1.75 | % | $ | 3,801,000 | $ | 27,518 | |||||||||
| Shane Dorcheus |
Southwest Division President | $ | 2,000,000 | 1.75 | % | $ | 2,000,000 | $ | 14,479 | |||||||||
| Justin Dye |
Chief Administrative Officer | $ | 4,706,073 | 1.75 | % | $ | 4,706,073 | $ | 34,071 | |||||||||
| Justin Ewing |
Executive Vice President, Corporate Development and Real Estate | $ | 1,267,020 | 1.75 | % | $ | 1,267,020 | $ | 9,173 | |||||||||
| Robert G. Miller |
Chairman and Chief Executive Officer | $ | 5,792,090 | 1.75 | % | $ | 5,792,090 | $ | 41,933 | |||||||||
| Paul Rowan |
Assistant Secretary and Deputy General Counsel | $ | 1,000,000 | 1.75 | % | $ | 1,000,000 | $ | 7,240 | |||||||||
| Andrew J. Scoggin |
Executive Vice President, Human Resources, Labor Relations, Public Relations and Government Affairs | $ | 2,353,036 | 1.75 | % | $ | 2,353,036 | $ | 17,035 | |||||||||
Safeway Relationship with Blackhawk and Related Transactions
During Safeway’s fiscal year ended January 3, 2015, Safeway completed the following transactions with Blackhawk involving amounts in excess of $120,000, including the spin-off of Blackhawk which became effective April 14, 2014.
169
Table of Contents
Gift Card Transfer and Management Agreement
Under the Gift Card Transfer and Management Agreement Safeway entered into with Blackhawk in February 2006 (the “Card Management Agreement”), Blackhawk provides Safeway with certain services related to Safeway-branded gift cards. During 2014, Safeway paid Blackhawk $455,688 under the Card Management Agreement.
Gift Card Alliance Partners Program Agreement
Safeway entered into the Amended and Restated Gift Card Alliance Partners Program Agreement with Blackhawk effective December 30, 2012, as amended in February 2014 (the “Blackhawk Alliance Partner Agreement”). Under the Blackhawk Alliance Partner Agreement, Safeway offers products provided by Blackhawk for sale in our Safeway stores, and Blackhawk provides funds and services relating to the management, marketing and service of products and services offered through the Blackhawk Alliance Partner Agreement, as well as relating to those products.
During Safeway’s 2014 fiscal year, under the Blackhawk Alliance Partner Agreement, Blackhawk paid an aggregate of $11.3 million to Safeway, and Safeway paid an aggregate of $274.6 million to Blackhawk.
Card Production and Card Services Agreement
In October 2011, Safeway entered into a card production and card services agreement with Blackhawk, under which Blackhawk produces Safeway-branded gift cards and provides Safeway with related services.
During Safeway’s 2014 fiscal year, Safeway paid Blackhawk $519,330 under this agreement.
Amended and Restated Tax Sharing Agreement
Safeway filed federal income tax returns and certain state income tax returns on a consolidated basis with Blackhawk starting in 2003. On April 11, 2014, Safeway entered into an Amended and Restated Tax Sharing Agreement (the “New TSA”) with Blackhawk. Prior to Blackhawk’s initial public offering, Safeway and Blackhawk entered into a prior tax sharing agreement that was last amended effective December 30, 2012 (the “Prior TSA”). The Prior TSA provided that Safeway and Blackhawk would generally make payments to each other such that, with respect to U.S. federal income tax returns for any taxable period in which Blackhawk or any of its subsidiaries were included in Safeway’s consolidated group for U.S. federal income tax purposes, the amount of taxes to be paid by Blackhawk was determined, subject to certain adjustments, as if Blackhawk and each of its subsidiaries included in such consolidated group filed their own consolidated federal income tax return. For state and local income tax purposes, the Prior TSA provided that Safeway and Blackhawk would generally make payments to each other such that, with respect to state and local income tax returns for any taxable period in which Blackhawk or any of its subsidiaries were included in Safeway’s combined, consolidated or unitary group for state or local income tax purposes, the amount of taxes to be paid by Blackhawk was determined, subject to certain limitations, by calculating the excess of any taxes shown due on any such return over the amount that would otherwise be due if the return were recalculated by excluding Blackhawk and any of its included subsidiaries.
In preparation for the pro rata distribution of the shares of Blackhawk Class B common stock owned by Safeway to the Safeway stockholders that occurred on April 14, 2014 (the “Distribution”), Safeway and Blackhawk entered into the New TSA, which became effective as of the Distribution, to address certain tax matters related to the facts and circumstances of the Distribution, including, among other things, the manner, amount and timing of the tax payments related to the Distribution. The New TSA also provides certain procedures for the allocation of taxes and the filing of returns that are
170
Table of Contents
consistent with the Prior TSA. In addition, the New TSA contemplates that Blackhawk may be included in Safeway’s consolidated group for U.S. federal income tax purposes until the date of the Distribution.
During 2014, Blackhawk paid Safeway $0.7 million for prior years’ taxes due under the New TSA, and Safeway advanced approximately $27.7 million to Blackhawk to fund 2014 estimated state tax payments by Blackhawk. In early 2015, Safeway converted the remaining amount of this advance to Blackhawk to a capital contribution. See Notes A and B to Safeway’s historical financial statements, included elsewhere in this prospectus, for further information.
Lease Agreements
Safeway leases corporate offices to Blackhawk under a sublease that expires in April 2017. Safeway also leased approximately 6,000 square feet of office space in Phoenix, Arizona to Blackhawk under a lease agreement that expired in 2014. During 2014, Blackhawk paid Safeway an aggregate of $608,727 pursuant to these lease agreements.
Cash Management and Treasury Services Agreement
On April 4, 2013, Safeway entered into a cash management and treasury services agreement with Blackhawk (the “CMATSA”). Safeway was permitted to borrow cash from Blackhawk’s operating accounts in excess of its immediate working capital and other operating requirements, calculated in accordance with the CMATSA, on an overnight basis, to meet short-term funding requirements. These advances were evidenced by unsecured promissory notes.
The CMATSA, together with the promissory notes issued thereunder, were terminated effective March 28, 2014.
Stockholders’ Agreement
In connection with this offering, Albertsons Companies, Inc. will enter into the Stockholders’ Agreement with Albertsons Investor, Kimco and Management Holdco. The rights of Albertsons Investor, Kimco and Management Holdco under such agreement are described below:
Registration Rights
Under the Stockholders’ Agreement, Albertsons Investor holds registration rights that allow it at any time after 180 days following the completion of this offering to request that we register the resale under the Securities Act, of all or any portion of the shares of our common stock that Albertsons Investor, Kimco and Management Holdco or a permitted transferee or assignee of such party that succeeds to such party’s rights under the Stockholders’ Agreement (each transferee or assignee, a “Holder” and, collectively, the “Holders”) owns on a pro rata and pari passu basis. If Albertsons Investor is no longer a Holder, then any Holder who owns at least 5% of our then outstanding common stock (a “Demand Holder”) shall have the right to exercise the registration rights referenced in the preceding sentence. Albertsons Investor, or a Demand Holder, may require us to effect a long-form registration provided that the number of securities requested to be registered must have a value equal to at least $75 million based on the closing price of such security on the last trading day prior to the registration request. We may postpone for a reasonable period of time, which may not exceed 90 days, the filing of a registration statement that Albertsons Investor, or a Demand Holder, requested that we file pursuant to the Stockholders’ Agreement if our board of directors determines that the filing of the registration statement would require us to disclose material non-public information that, in our board of directors’ good faith judgment, after consultation with independent outside counsel to the company, would be required to be disclosed in such registration statement but which the company has a bona fide
171
Table of Contents
business purpose for not disclosing publicly, provided that, unless otherwise approved in writing by the Holders of a majority of our common stock that demanded the registration, we may not postpone such filing more than twice, or for more than an aggregate of 90 days, in each case, during any 12-month period. In addition, if we propose to register additional shares of common stock, Albertsons Investor and each other Holder will be entitled to notice of the registration and Albertsons Investor will be entitled to include its, Kimco’s and Management Holdco’s shares of common stock (on a pro rata and pari passu basis) in that registration with all registration expenses paid by us. Prior to the distribution by Albertsons Investor of all of our common stock it holds as of the completion of this offering to its equityholders, Holders other than Albertsons Investor will not be entitled to include shares of our common stock held by such Holder in a registration proposed by us unless Albertsons Investor also elects to participate in such registration.
Board Representation Rights
Pursuant to the Stockholders’ Agreement, we will be required to appoint individuals designated by Albertsons Investor (the “Albertsons Investor Designees”) to our board of directors upon the closing of the IPO-Related Transactions and this offering.
Our certificate of incorporation provides that, prior to the 50% Trigger Date, the authorized number of directors may be increased or decreased by the Designated Controlling Stockholder or a majority of our directors. The Designated Controlling Stockholder shall, immediately prior to the 50% Trigger Date, set the size of the board of directors at 13 directors. On or after the 50% Trigger Date, the authorized number of directors may be increased or decreased by the affirmative vote of not less than two-thirds (2/3) of the then-outstanding shares of capital stock or by resolution of our board of directors. Under the Stockholders’ Agreement, Albertsons Investor, or any Holder (other than Kimco Realty), will have the following board representation rights:
| • | from the date on which Albertsons Companies, Inc. is no longer a controlled company under the applicable rules of the NYSE but prior to the 35% Trigger Date, Albertsons Investor shall have the right to designate to our board of directors a number of individuals equal to one director fewer than 50% of our board of directors at any time, and will (i) cause its directors appointed to the board of directors to vote in favor of maintaining a 13-person board of directors (unless the management board of Albertsons Investor otherwise agrees by affirmative vote of 80% of the members of the management board of Albertsons Investor) and (ii) appoint three directors designated by Cerberus and three directors in total designated by the other equityholders of Albertsons Investor and Robert Miller (whose contractual right to a seat on the board of directors shall be unaffected); provided, however, that such Albertsons Investor Designees are qualified and suitable to serve as members of our board of directors under all applicable corporate governance policies and guidelines of Albertsons Companies, Inc. and our board of directors, and all applicable legal, regulatory and stock exchange requirements (other than any requirements under the NYSE regarding director independence) (the “Director Requirements”); |
| • | for so long as any Holder has beneficial ownership of less than 35% but at least 20% of our then-outstanding common stock, such Holder shall have the right to designate to our board of directors a number of individuals who satisfy the Director Requirements equal to the greater of (i) three or (ii) 25% of the size of our board of directors at any time (rounded up to the next whole number); |
| • | for so long as any Holder has beneficial ownership of less than 20% but at least 15% of our then-outstanding common stock, such Holder shall have the right to designate to our board of directors a number of individuals who satisfy the Director Requirements equal to the greater of (i) two or (ii) 15% of the size of our board of directors at any time (rounded up to the next whole number). |
172
Table of Contents
| • | for so long as any Holder has beneficial ownership of less than 15% but at least 10% of our then-outstanding common stock, such Holder shall have the right to designate one individual to our board of directors who satisfies the Director Requirements. |
For so long as any Sponsor (other than Kimco Realty) indirectly beneficially owns at least 10% of our then-outstanding common stock, but does not have a representative (whether an Albertsons Investor Designee or otherwise) on our board of directors, such Sponsor shall have the right to appoint one observer to our board of directors (an “Observer”). An Observer may attend any meeting of our board of directors provided that no Observer shall have the right to vote or otherwise participate in the board of directors meeting in any way other than to observe any applicable meeting of our board of directors. Our board of directors or any committee thereof shall have the right to exclude an Observer from any meeting or portion thereof in the sole discretion of a majority of the members in attendance at such meeting.
Under the Stockholders’ Agreement, in the event of a vacancy on our board of directors arising through the death, resignation or removal of a Holder’s board designee, the Holder shall have the right to designate a replacement who satisfies the Director Requirements to fill such vacancy.
Indemnification; Expenses
We have agreed to indemnify Albertsons Investor, Kimco, Management Holdco or any Holder, against any losses or damages resulting from any untrue statement or omission of material fact in any registration statement or prospectus pursuant to which it sells our shares, unless such liability arose from Albertsons Investor, Kimco, Management Holdco or any such Holder’s, misstatement or omission, and Albertsons Investor, Kimco, Management Holdco and the Holders, have agreed to indemnify us against all losses caused by its misstatements or omissions. We also agreed to pay all expenses incident to our performance of or compliance with the registration rights under the Stockholders’ Agreement, including but not limited to all underwriting discounts, commissions, fees and related expenses of underwriters.
Albertsons Investor Limited Liability Company Agreement
The Cerberus-led Consortium, other than Kimco, and certain other individuals who agreed to co-invest with them through Albertsons Investor, will enter the Albertsons Investor LLC Agreement. The Albertsons Investor LLC Agreement will be entered into upon consummation of the IPO-Related Transactions and this offering. A copy of the form Albertsons Investor LLC Agreement that will be entered into will be filed as an exhibit to the registration statement of which this prospectus is a part.
Policy and Procedures for the Review, Approval or Ratification of
Transactions with Related Persons
Prior to the completion of this offering, our board of directors will adopt a written policy (the “Related Party Policy”) and procedures for the review, approval or ratification of “Related Party Transactions” by the independent members of the audit and risk committee of our board of directors. For purposes of the Related Party Policy, a “Related Party Transaction” is any transaction, arrangement or relationship or series of similar transactions, arrangements or relationships (including the incurrence or issuance of any indebtedness or the guarantee of indebtedness) in which (1) the aggregate amount involved will or may be reasonably expected to exceed $120,000 in any fiscal year, (2) the company or any of its subsidiaries is a participant, and (3) any Related Party (as defined herein) has or will have a direct or indirect material interest.
The Related Party Policy defines “Related Party” as any person who is, or, at any time since the beginning of the company’s last fiscal year, was (1) an executive officer, director or nominee for
173
Table of Contents
election as a director of the company or any of its subsidiaries, (2) a person with greater than five percent (5%) beneficial interest in the company, (3) an immediate family member of any of the foregoing individuals or entities identified in (1) or (2) of this paragraph, and (4) any firm, corporation or other entity in which any of the foregoing individuals or entities is employed or is a general partner or principal or in a similar position or in which such person or entity has a five percent (5%) or greater beneficial interest. Immediate family members (each, a “Family Member”) includes a person’s spouse, parents, stepparents, children, stepchildren, siblings, mothers- and fathers- in-law, sons- and daughters-in-law, brothers- and sisters-in-law and anyone residing in such person’s home, other than a tenant or employee.
Prior to the company entering into any Related Party Transaction, such Related Party Transaction will be reported to our General Counsel who will report the same to the audit and risk committee. Our General Counsel will conduct an investigation and evaluation of the Related Party Transaction and will report his or her findings to the audit and risk committee, including a summary of material facts. The audit and risk committee will review the material facts of all Related Party Transactions which require the audit and risk committee’s approval and either approve or disapprove of the Related Party Transaction, subject to the exceptions described below. If advance notice of a Related Party Transaction has been given to the audit and risk committee and it is not possible to convene a meeting of the audit and risk committee, then the chairman of the audit and risk committee will consider whether the Related Party Transaction is appropriate and, if it is, will approve the Related Party Transaction, with the audit and risk committee being asked to ratify the Related Party Transaction at the next regularly-scheduled meeting of the audit and risk committee. In the event the audit and risk committee does not ratify any such Related Party Transaction, management shall make all reasonable efforts to cancel or annul such Related Party Transaction. In determining whether to approve or ratify a Related Party Transaction, the audit and risk committee, or its chairman, as applicable, will consider all factors it deems appropriate, including the factors listed below in “—Review Criteria.”
Entering into a Related Party Transaction without the approval or ratification required by the terms of the Related Party Policy is prohibited and a violation of such policy. In the event the company’s directors, executive officers or Chief Accounting Officer become aware of a Related Party Transaction that was not previously approved or ratified under the Related Party Policy, such person will promptly notify the audit and risk committee and its chairman (or, if it is not practicable for the company to wait for the audit and risk committee to consider the matter, the chairman of the audit and risk committee) will consider whether the Related Party Transaction should be ratified or rescinded or other action should be taken, with such review considering all of the relevant facts and circumstances regarding the Related Party Transaction, including the factors listed below in “—Review Criteria.” The chairman of the audit and risk committee will report to the committee at its next regularly-scheduled meeting any actions taken under the Related Party Policy pursuant to the authority delegated in this paragraph. The audit and risk committee will also review all of the facts and circumstances pertaining to the failure to report the Related Party Transaction to the audit and risk committee and will take, or recommend to our board of directors, any action the audit and risk committee deems appropriate.
No member of the audit and risk committee or director of our board will participate in any discussion or approval of a Related Party Transaction for which he or she is a Related Party, except that the audit and risk committee member or board director will provide all material information concerning the Related Party Transaction to the audit and risk committee.
If a Related Party Transaction will be ongoing, the audit and risk committee may establish guidelines for the company’s management to follow in its ongoing dealings with the Related Party. Thereafter, the audit and risk committee, on at least an annual basis, will review and assess ongoing relationships with the Related Party to ensure that they are in compliance with the audit and risk committee’s guidelines and that the Related Party Transaction remains appropriate.
174
Table of Contents
Review Criteria
All Related Party Transactions will be reviewed in accordance with the standards set forth in the Related Party Policy after full disclosure of the Related Party’s interests in the transaction. As appropriate for the circumstances, the audit and risk committee or its chairman, as applicable, will review and consider:
| • | the Related Party’s interest in the Related Party Transaction; |
| • | the terms of the Related Party Transaction, including the approximate dollar value of the amount involved in the Related Party Transaction and the approximate dollar value of the amount of the Related Party’s interest in the transaction without regard to the amount of any profit or loss; |
| • | whether the transaction was undertaken in the ordinary course of business of the company; |
| • | whether the transaction with the Related Party is proposed to be, or was, entered into on terms no less favorable to the company than terms that could have been reached with an unrelated third party; |
| • | the purpose of, and the potential benefits to the company of, the Related Party Transaction; |
| • | description of any provisions or limitations imposed as a result of entering into the Related Party Transaction; |
| • | whether the proposed transaction includes any potential reputational risk issues for the company which may arise as a result of or in connection with the Related Party Transaction; |
| • | whether the proposed transaction would violate any requirements of the company’s financing or other material agreements; and |
| • | any other relevant information regarding the Related Party Transaction or the Related Party. |
The audit and risk committee, or its chairman, as applicable, may approve or ratify the Related Party Transaction only if the audit and risk committee, or its chairman, as applicable, determines in good faith that, under all of the circumstances, the transaction is fair as to the company. The audit and risk committee, in its sole discretion, may impose such conditions as it deems appropriate on the company or the Related Party in connection with approval of the Related Party Transaction.
Pre-Approved Related Party Transactions
The audit and risk committee has determined that the following transactions will be deemed pre-approved or ratified and will not require review or approval of the audit and risk committee, even if the aggregate amount involved will exceed $120,000, unless otherwise specifically determined by the audit and risk committee.
| • | Any employment by the company of an executive officer of the company or any of its subsidiaries if the related compensation conforms with our company’s compensation policies and if the executive officer is not a Family Member of another executive officer or of a director of our board; and |
| • | Any compensation paid to a director of our board if the compensation is consistent with the company’s bylaws and any compensation policies. |
Notwithstanding anything to the contrary in the Related Party Policy, in the event the bylaws of the company require review by our board of directors and/or approval of a Related Party Transaction, the audit and risk committee, and its chairman, will not have the authority to review or approve a Related Party Transaction but will provide a recommendation to our board of directors for the board’s use in its consideration of a given Related Party Transaction.
175
Table of Contents
The following table sets forth information regarding the beneficial ownership of our common stock as of September 12, 2015, after giving effect to the IPO-Related Transactions by:
| • | each person who is known by us to beneficially own 5% or more of our outstanding shares of capital stock; |
| • | each member of our board of directors; |
| • | each of our executive officers named in the Summary Compensation Table under “Executive Compensation”; and |
| • | all of our directors and executive officers as a group. |
Beneficial ownership is determined in accordance with the rules of the SEC and generally includes voting or investment power with respect to securities. None of the persons listed in the following table owns any securities that are convertible into common stock at his or her option currently or within 60 days of our listing date on the NYSE. Unless otherwise indicated, the address for each 5% stockholder, director and executive officer listed below is c/o Albertsons Companies, Inc., 250 Parkcenter Blvd., Boise, Idaho 83706.
| Shares beneficially owned |
Percentage of shares beneficially owned(1) |
|||||||||||
| Name of Beneficial Owner |
Number | Before Offering(2) | After Offering | |||||||||
| 5% Stockholders: |
||||||||||||
| Albertsons Investor Holdings LLC(3)(4) |
349,832,761 | 85.4 | % | 72.1 | % | |||||||
| KRS AB Acquisition, LLC(5) |
49,124,245 | 12.0 | % | 10.1 | % | |||||||
| KRS ABS, LLC(5) |
7,305,252 | 1.8 | % | 1.5 | % | |||||||
| Directors: |
||||||||||||
| Robert G. Miller |
9,670,764 | 2.4 | % | 2.0 | % | |||||||
| Dean S. Adler(3) |
— | — | — | |||||||||
| Sharon L. Allen |
— | — | — | |||||||||
| Steven A. Davis |
— | — | — | |||||||||
| Kim Fennebresque |
— | — | — | |||||||||
| Lisa A. Gray(4) |
— | — | — | |||||||||
| Hersch Klaff(3) |
— | — | — | |||||||||
| Ronald Kravit(4) |
— | — | — | |||||||||
| Alan Schumacher |
— | — | — | |||||||||
| Jay L. Schottenstein(3) |
— | — | — | |||||||||
| Lenard B. Tessler(4) |
— | — | — | |||||||||
| Scott Wille(4) |
— | — | — | |||||||||
| Named Executive Officers: |
||||||||||||
| Robert B. Dimond |
— | — | — | |||||||||
| Wayne A. Denningham |
1,650,607 | * | * | |||||||||
| Justin Dye |
3,232,451 | * | * | |||||||||
| Robert L. Edwards |
— | — | — | |||||||||
| Shane Sampson |
— | — | — | |||||||||
| All directors and executive officers as a group(3) (22 persons) |
188,874,344 | 46.1 | % | 38.9 | % | |||||||
| * | Represents less than 1%. |
| (1) | Percentage of shares beneficially owned prior to the offering is based on 409,832,959 shares of our common stock outstanding as of our listing date on the NYSE after giving effect to the IPO- |
176
Table of Contents
| Related Transactions. Percentage of shares beneficially owned after the offering assumes exercise of underwriters’ option to purchase additional shares in full. |
| (2) | All the issued and outstanding common stock of Albertsons Companies, Inc. is held by Albertsons Investor, Management Holdco and Kimco. Accordingly, shareholdings of directors and named executive officers reflected in the table above reflect indirect ownership in Albertsons Companies, Inc. held through interests in Albertsons Investor and Management Holdco. Profits interests in AB Acquisition totaling 5.1% of the outstanding equity of AB Acquisition on a fully participating basis will convert into direct and indirect ownership of our shares based on our equity valuation after taking account the proceeds to be received by us in this offering. Assuming the assumed initial public offering price of $24.50 per share (the midpoint of the price range set forth on the cover page of this prospectus) and all shares offered by us in this offering are sold, (i) profits interests in AB Acquisition would convert into equity of Albertsons Investor with an indirect ownership of 19,382,213 shares and into 450,749 shares owned by Kimco, for a total direct and indirect ownership of 19,832,962 shares upon completion of this offering and (ii) Phantom units of AB Acquisition would convert into 10,711,903 restricted units of Albertsons Companies, Inc., or ownership of 10,711,903 shares, or 2.3% of our outstanding common stock upon the completion of this offering. An initial public offering price of $26.00, which is the high point of the estimated offering range set forth on the cover page of this prospectus, would increase the total number of shares outstanding and owned by Albertsons Investor and Kimco upon completion of this offering by 300,493 shares. An initial public offering price of $23.00, which is the low point of the estimated offering range set forth on the cover page of this prospectus, would decrease the total number of shares outstanding and owned by Albertsons Investor and Kimco upon completion of this offering by 339,687 shares. |
| (3) | Albertsons Investor is held by a private investor group, including affiliates of Cerberus Capital Management, L.P., Klaff Realty, LP, Schottenstein Stores Corp., Lubert-Adler Partners, L.P and certain members of management. Messrs. Kravit, Tessler, Wille and Ms. Gray are affiliated with Cerberus Capital Management, L.P. Stephen Feinberg exercises voting and investment authority over membership interests in Albertsons Investor owned by the affiliates of Cerberus and may be deemed to have indirect ownership of 155,848,651 shares, or 38.0% of our outstanding common stock prior to this offering and 32.1% upon the completion of this offering, through Cerberus’ interests in Albertsons Investor. Mr. Klaff is affiliated with Klaff Realty, LP, whose affiliated entities may be deemed to have indirect ownership of 56,429,497 shares, or 13.8% of our outstanding common stock prior to this offering and 11.6% upon the completion of this offering, through their interests in Albertsons Investor. Mr. Schottenstein is affiliated with Schottenstein Stores Corp., whose affiliated entities may be deemed to have indirect ownership of 56,429,497 shares, or 13.8% of our outstanding common stock prior to this offering and 11.6% upon the completion of this offering, through their interests in Albertsons Investor. Mr. Adler is affiliated with Lubert-Adler Partners, L.P., whose affiliated entities may be deemed to have indirect ownership of 56,429,497 shares, or 13.8% of our outstanding common stock prior to this offering and 11.6% upon the completion of this offering, through their interests in Albertsons Investor. Messrs. Miller, Denningham, Dye and six additional officers together hold 19,585,852 shares, or 4.8% of our outstanding common stock prior to this offering and 4.0% upon the completion of this offering, through their interests in Albertsons Investor and Management Holdco. Pursuant to the terms of the Stockholders’ Agreement, Kimco and Management Holdco will vote common stock held by them upon the completion of this offering as instructed by Albertsons Investor and will not transfer their common stock other than in accordance with the terms of the Stockholders’ Agreement. See “Certain Relationships and Related Party Transactions.” |
| (4) | The address for Albertsons Investor Holdings LLC and Messrs. Kravit, Tessler, Wille and Ms. Gray is c/o Cerberus Capital Management, L.P., 875 Third Avenue, New York, New York 10022. |
| (5) | KRS AB Acquisition, LLC and KRS ABS, LLC are affiliates of Kimco Realty Corporation. The address for KRS AB Acquisition, LLC and KRS ABS, LLC is c/o Kimco Realty Corporation, Attention: Ray Edwards and Bruce Rubenstein, 3333 New Hyde Park Road, New Hyde Park, New York 11042. |
177
Table of Contents
The following summarizes the most important terms of our capital stock and related provisions of the certificate of incorporation and our bylaws that will be in effect upon the closing of the IPO-Related Transactions and this offering. This description also summarizes the principal agreements relating to our common stock. Because it is only a summary, it does not contain all the information that may be important to you. For a complete description, you should refer to our certificate of incorporation and bylaws and the agreements referred to below, copies of which are filed as exhibits to the registration statement of which this prospectus forms a part.
General
After giving effect to the IPO-Related Transactions, our authorized capital stock will consist of 1,000,000,000 shares of common stock, par value $0.01 per share, and 30,000,000 shares of preferred stock, par value $0.01 per share.
Upon the closing of the IPO-Related Transactions and this offering, there will be 475,139,081 shares of our common stock outstanding (assuming no exercise of the underwriters’ option to purchase additional shares), and no shares of our preferred stock outstanding. If the underwriters’ option to purchase additional shares is exercised in full, the number of shares of our common stock outstanding will increase by 9,795,918 shares.
Common Stock
Dividend Rights
Subject to preferences that may be applicable to any then outstanding preferred stock, holders of our common stock are entitled to receive ratably those dividends, if any, as may be declared from time to time by our board of directors out of legally available funds.
Voting Rights
Each holder of our common stock is entitled to one vote for each share owned of record on all matters voted upon by stockholders. A majority vote is required for all action to be taken by stockholders, except as otherwise provided for in our certificate of incorporation and bylaws or as required by law, including the election of directors in an election that is determined by our board of directors to be a contested election, which requires a plurality. Our certificate of incorporation provides that our board of directors and, prior to the 50% Trigger Date, the Designated Controlling Stockholder, are expressly authorized to make, alter or repeal our bylaws and that our stockholders may only amend our bylaws after the 50% Trigger Date with the approval of at least two-thirds of the total voting power of the outstanding shares of our capital stock entitled to vote in any annual election of directors.
Liquidation Rights
In the event of our liquidation, dissolution or winding-up, the holders of our common stock are entitled to share equally and ratably in our assets, if any, remaining after the payment of all of our debts and liabilities and the liquidation preference of any outstanding preferred stock.
Other Rights
Our common stock has no preemptive rights, no cumulative voting rights and no redemption, sinking fund or conversion provisions.
178
Table of Contents
Preferred Stock
Our board of directors is authorized, by resolution or resolutions, to issue up to 30,000,000 shares of our preferred stock. Our board of directors is authorized, by resolution or resolutions, to provide, out of the unissued shares of our preferred stock, for one or more series of preferred stock and, with respect to each such series, to fix, without further stockholder approval, the designation, powers, preferences and relative, participating, option or other special rights, including voting powers and rights, and the qualifications, limitations or restrictions thereof, of each series of preferred stock pursuant to Section 151 of the DGCL. Our board of directors could authorize the issuance of preferred stock with terms and conditions that could discourage a takeover or other transaction that some holders of our common stock might believe to be in their best interests or in which holders of common stock might receive a premium for their shares over and above market price. We have no current plan to issue any shares of preferred stock.
Composition of our Board of Directors
Upon the closing of this offering, it is anticipated that we will have 12 directors. The Stockholders’ Agreement will provide that, except as otherwise required by applicable law, from the date (a) immediately prior to the 50% Trigger Date, the Designated Controlling Stockholder shall set the size of the board of directors at 13 directors; (b) on which we are no longer a controlled company under the applicable rules of the NYSE but prior to the 35% Trigger Date, Albertsons Investor shall have the right to designate a number of individuals who satisfy the Director Requirements equal to one director fewer than 50% of our board of directors at any time and shall cause its directors appointed to our board of directors to vote in favor of maintaining a 13-person board of directors unless the management board of Albertsons Investor otherwise agrees by the affirmative vote of 80% of the management board of Albertsons Investor; (c) on which a Holder has beneficial ownership of at least 20% but less than a 35% of our then-outstanding common stock, the Holder will have the right to designate a number of individuals who satisfy the Director Requirements equal to the greater of three or 25% of the size of our board of directors at any time (rounded up to the next whole number); (d) on which a Holder has beneficial ownership of at least 15% but less than 20% of our then-outstanding common stock, the Holder will have the right to designate the greater of two or 15% of the size of our board of directors at any time (rounded up to the next whole number) and (e) on which a Holder has beneficial ownership of at least 10% but less than 15% of our then-outstanding common stock, it will have the right to designate one individual who satisfies the Director Requirements.
Pursuant to the Albertsons Investor LLC Agreement and the Stockholders’ Agreement, prior to the 50% Trigger Date, a majority vote of the management board of Albertsons Investor is required to designate directors to our board of directors if the designated directors consist of four designees of Cerberus (if Cerberus so requests) and one designee from each other member of the Cerberus-led Consortium (other than Kimco) and Robert Miller (if such member and Mr. Miller so requests). From the date on which we are no longer a controlled company under the applicable rules of the NYSE but prior to the 35% Trigger Date, then a majority vote of the management board of Albertsons Investor is required to designate nominees to be included in the slate for election to our board of directors if the designated nominees consist of three nominees of Cerberus and three nominees in total from the other members of the Cerberus-led Consortium and Robert Miller. The nominees shall include persons that are “independent” for purposes of the Listed Company Rules of the NYSE if required to comply with such rules.
Our certificate of incorporation provides that our board of directors will consist of not less than seven directors and not more than 15 directors, and that the exact number of directors will be determined by our board of directors. Our certificate of incorporation also provides that, prior to the 50% Trigger Date, the Designated Controlling Stockholder may increase or decrease the authorized
179
Table of Contents
number of directors on our board of directors. Following the 50% Trigger Date, the authorized number of directors may be increased or decreased only by the affirmative vote of two-thirds of our then-outstanding capital stock.
Anti-Takeover Effects of Delaware Law and Our Certificate of Incorporation and Bylaws
Some provisions of Delaware law and of our certificate of incorporation and bylaws could have the effect of delaying, deferring or discouraging another party from acquiring control of us. These provisions, which are summarized below, are expected to discourage coercive takeover practices and inadequate takeover bids. These provisions are also designed to encourage persons seeking to acquire control of us to first negotiate with our board of directors.
Requirements for Advance Notification of Stockholder Nominations and Proposals
Our bylaws establish advance notice procedures with respect to stockholder proposals, other than proposals made by or at the direction of our board of directors or, prior to the 35% Trigger Date, by the Designated Controlling Stockholder. Our bylaws also establish advance notice procedures with respect to the nomination of candidates for election as directors, other than nominations made by or at the direction of our board of directors or by a committee appointed by our board of directors. These provisions may have the effect of precluding the conduct of certain business at a meeting if the proper procedures are not followed, and may also discourage or deter a potential acquirer from conducting a solicitation of proxies to elect the acquirer’s own slate of directors or otherwise attempting to obtain control of us.
Calling Special Stockholder Meetings
Our certificate of incorporation and bylaws provide that special meetings of our stockholders may be called only by our board of directors or by stockholders owning at least 25% in amount of our entire capital stock issued and outstanding, and entitled to vote.
Stockholder Action by Written Consent
The DGCL permits stockholder action by written consent unless otherwise provided by our certificate of incorporation. Our certificate of incorporation precludes stockholder action by written consent after the 50% Trigger Date.
Undesignated Preferred Stock
Our board of directors is authorized to issue, without stockholder approval, preferred stock with such terms as our board of directors may determine. The ability to authorize undesignated preferred stock makes it possible for our board of directors to issue one or more series of preferred stock with voting or other rights or preferences that could impede the success of any attempt to change control of the company.
Delaware Anti-Takeover Statute
We have elected not to be governed by Section 203 of the DGCL, an anti-takeover law (“Section 203”). This law prohibits a publicly-held Delaware corporation from engaging under certain circumstances in a business combination with any interested stockholder for a period of three years following the date that the stockholder became an interested stockholder, unless:
| • | prior to the date of the transaction, the board of directors of the corporation approved either the business combination or the transaction which resulted in the stockholder becoming an interested stockholder; |
180
Table of Contents
| • | upon consummation of the transaction which resulted in the stockholder becoming an interested stockholder, the interested stockholder owned at least 85% of the voting stock of the corporation outstanding at the time the transaction commenced, excluding for purposes of determining the number of shares outstanding those shares owned by persons who are directors and also officers and by employee stock plans in which employee participants do not have the right to determine confidentially whether shares held subject to the plan will be tendered in a tender or exchange offer; or |
| • | on or subsequent to the date of the transaction, the business combination is approved by our board of directors and authorized at an annual or special meeting of stockholders, and not by written consent, by the affirmative vote of at least two-thirds of the outstanding voting stock which is not owned by the interested stockholder. |
Section 203 defines “business combination” to include: any merger or consolidation involving us and the interested stockholder; any sale, transfer, pledge or other disposition of 10% or more of our assets involving the interested stockholder; in general, any transaction that results in the issuance or transfer by us of any of our stock to the interested stockholder; or the receipt by the interested stockholder of the benefit of any loans, advances, guarantees, pledges or other financial benefits provided by or through us. In general, Section 203 defines an interested stockholder as any entity or person beneficially owning 15% or more of the outstanding voting stock of the corporation and any entity or person affiliated with or controlling or controlled by any such entity or person. A Delaware corporation may opt out of this provision by express provision in its original certificate of incorporation or by amendment to its certificate of incorporation or bylaws approved by its stockholders. We have opted out of this provision. Accordingly, we will not be subject to any anti-takeover effects of Section 203.
Removal of Directors; Vacancies
Our certificate of incorporation provides that, following the 50% Trigger Date, directors may be removed with or without cause upon the affirmative vote of holders of at least two-thirds of the total voting power of the outstanding shares of the capital stock of the company entitled to vote in any annual election of directors or class of directors, voting together as a single class. In addition, our certificate of incorporation provides that vacancies, including those resulting from newly created directorships or removal of directors, may only be filled (i) by the Designated Controlling Stockholder or by a majority of the directors then in office, prior to the 50% Trigger Date, and (ii) after the 50% Trigger Date, by a majority of the directors then in office, in each case although less than a quorum, or by a sole remaining director. This may deter a stockholder from increasing the size of our board of directors and gaining control of the board of directors by filling the remaining vacancies with its own nominees.
Limitation on Director’s Liability
Our certificate of incorporation and bylaws will indemnify our directors to the fullest extent permitted by the DGCL. The DGCL permits a corporation to limit or eliminate a director’s personal liability to the corporation or the holders of its capital stock for breach of duty. This limitation is generally unavailable for acts or omissions by a director which (i) were in bad faith, (ii) were the result of active and deliberate dishonesty and were material to the cause of action so adjudicated or (iii) involved a financial profit or other advantage to which such director was not legally entitled. The DGCL also prohibits limitations on director liability for acts or omissions which resulted in a violation of a statute prohibiting certain dividend declarations, certain payments to stockholders after dissolution and particular types of loans. The effect of these provisions is to eliminate the rights of our company and our stockholders (through stockholders’ derivative suits on behalf of our company) to recover monetary damages against a director for breach of fiduciary duty as a director (including breaches resulting from grossly negligent behavior), except in the situations described above. These provisions will not limit the liability of directors under the federal securities laws of the United States.
181
Table of Contents
Credit Facility
Under our credit agreements, a change of control may lead the lenders to exercise remedies, such as acceleration of their loans, termination of their obligations to fund additional advances and collection against the collateral securing such loan.
Notes
Under the indentures governing the CoC Notes, a change of control may require us to offer to repurchase all of the outstanding CoC Notes for cash at a price equal to 101% of the principal amount of the CoC Notes, plus accrued and unpaid interest, if any, to the date of repurchase.
Choice of Forum
Our certificate of incorporation provides that, unless we consent in writing to the selection of an alternative forum, the Court of Chancery of the State of Delaware will be the exclusive forum for: (a) any derivative action or proceeding brought on our behalf; (b) any action asserting a breach of a fiduciary duty owed by any of our directors, officers, employees or agents to us or our stockholders; (c) any action asserting a claim pursuant to any provision of the DGCL, our certificate of incorporation or our bylaws; or (d) any action asserting a claim governed by the internal affairs doctrine. However, it is possible that a court could find our forum selection provision to be inapplicable or unenforceable.
Stockholders’ Agreement
Registration Rights
Upon the closing of this offering, Albertsons Investor or, if Albertsons Investor is no longer a holder of registrable securities, Holders owning more than 5% of our then-outstanding common stock, will have the right to require us to register their shares (and in the case of Albertsons Investor, such registration shall also include shares held by Kimco and Management Holdco on a pro rata and pari passu basis) under the Securities Act under specified circumstances.
Demand and Form S-3 Registration Rights
Beginning 180 days after the closing of this offering, Albertsons Investor or, if Albertsons Investor is no longer a holder of registrable securities, the Holders, subject to specified limitations, may require that we register all or part of their shares of our common stock (and in the case of Albertsons Investor, such registration shall also include shares held by Kimco and Management Holdco on a pro rata and pari passu basis) for sale under the Securities Act on an unlimited number of occasions. In addition, Albertsons Investor or, if Albertsons Investor is no longer a holder of registrable securities, the Holders, may from time to time make demand for registrations on Form S-1, a long-form registration statement, or Form S-3, a short form registration statement, when we are eligible to use those forms.
Piggyback Registration Rights
If we propose to register any of our common stock, either for our own account or for the account of other securityholders, Albertsons Investor and each other Holder will be entitled to notice of the registration and Albertsons Investor will be entitled to include its, Kimco’s and Management Holdco’s shares of common stock (on a pro rata and pari passu basis) in that registration with all registration expenses paid by us. Prior to the distribution by Albertsons Investor of all of our common stock it holds as of the completion of this offering to its equityholders, Holders other than Albertsons Investor will not be entitled to include shares of our common stock held by such Holder in a registration proposed by us unless Albertsons Investor also elects to participate in such registration.
182
Table of Contents
Limitations and Expenses
Other than in a demand registration, with specified exceptions, the rights of Albertsons Investor, Kimco and Management Holdco or, if Albertsons Investor is no longer a Holder, the Holders, to include shares in a registration are subject to the right of the underwriters to limit the number of shares included in the offering. All fees, costs and expenses of any registrations made pursuant to the Stockholders’ Agreement, including demand registrations, registrations on Form S-3 and piggyback registrations, will be paid by us, and all selling expenses, including underwriting discounts and commissions, will be paid by us.
Listing
We have been approved to list our common stock on the NYSE under the symbol “ABS.”
Transfer Agent and Registrar
The transfer agent and registrar for our common stock will be American Stock Transfer & Trust Company LLC.
183
Table of Contents
SHARES ELIGIBLE FOR FUTURE SALE
Prior to this offering, there has been no public market for our capital stock. Future sales of our common stock in the public market, or the availability of such shares for sale in the public market, could adversely affect market prices prevailing from time to time. As described below, only a limited number of shares will be available for sale shortly after this offering due to contractual and legal restrictions on resale. Nevertheless, sales of our common stock in the public market after such restrictions lapse, or the perception that those sales may occur, could adversely affect the prevailing market price at such time and our ability to raise equity capital in the future.
After giving effect to the IPO-Related Transactions, upon the closing of this offering, 475,139,081 shares of common stock will be outstanding, assuming the number of shares sold in this offering is the number of shares set forth on the cover of this prospectus and assuming no exercise of the underwriters’ option to purchase additional shares. All of the shares sold in this offering will be freely tradable. Shares held by our affiliates, as that term is defined in Rule 144, including shares held by Albertsons Investor, Kimco and Management Holdco, may only be sold in compliance with the limitations described below.
The remaining shares of our common stock outstanding after this offering are restricted securities, as such term is defined in Rule 144, or are subject to lock-up agreements with the underwriters of this offering, as described below. Following the expiration of the lock-up period pursuant to any such lock-up agreements, restricted securities may be sold in the public market only if registered or if they qualify for an exemption from registration under Rule 144 or Rule 701 promulgated under the Securities Act, described in greater detail below.
Rule 144
In general, a person who has beneficially owned restricted shares of our common stock for at least six months would be entitled to sell their securities provided that (i) such person is not deemed to have been one of our affiliates at the time of, or at any time during the 90 days preceding, a sale and (ii) we are subject to the Exchange Act periodic reporting requirements for at least 90 days before the sale. Persons who have beneficially owned restricted shares of our common stock for at least six months but who are our affiliates at the time of, or any time during the 90 days preceding, a sale, would be subject to additional restrictions, by which such person would be entitled to sell within any three-month period only a number of securities that does not exceed the greater of either of the following:
| • | 1% of the number of shares of our common stock outstanding at the time of such sale, which will equal 4,751,391 shares as of the closing of this offering (assuming no exercise of the underwriters’ option to purchase additional shares); or |
| • | the average weekly trading volume of our common stock on the NYSE during the four calendar weeks preceding the filing of a notice on Form 144 with respect to the sale; |
provided, in each case, that we are subject to the Exchange Act periodic reporting requirements for at least 90 days before the sale. Such sales both by affiliates and by non-affiliates must also comply with the manner of sale, current public information, and notice provisions of Rule 144.
Notwithstanding the availability of Rule 144, the holders of all of our restricted shares will have entered into lock-up agreements as described under “Underwriting (Conflicts of Interest),” and their restricted shares will become eligible for sale only following expiration of the restrictions set forth in those agreements.
184
Table of Contents
Rule 701
Rule 701 under the Securities Act (“Rule 701”), as in effect on the date of this prospectus, permits resales of shares in reliance upon Rule 144 but without compliance with certain restrictions of Rule 144, including the holding period requirement. Most of our team members, executive officers, directors, or consultants who purchased shares under a written compensatory plan or contract may be entitled to rely on the resale provisions of Rule 701, but all holders of Rule 701 shares are required to wait until 90 days after the date of this prospectus before selling their shares. However, substantially all Rule 701 shares are subject to lock-up agreements as described below and under “Underwriting (Conflicts of Interest),” and will become eligible for sale only following expiration of those agreements.
Lock-Up Agreements
We and our officers, directors, and holders of substantially all of our common stock on the date of this prospectus will have entered into lock-up agreements with the underwriters providing, subject to certain exceptions, that we and they will not, subject to certain exceptions, dispose of or hedge any shares of our common stock or securities convertible into or exchangeable for shares of common stock during the period from the date of this prospectus continuing through the date that is 180 days after the date of this prospectus unless extended pursuant to its terms. Pursuant to this agreement, among other exceptions, we may enter into an agreement providing for the issuance of our common stock in connection with the acquisition, merger or joint venture with another publicly traded entity during the 180-day restricted period after the date of this prospectus. For a more complete description of the lock-up restrictions and specified exceptions, see “Underwriting (Conflicts of Interest).”
Transfer Restrictions under the Albertsons Investor LLC Agreement
The Albertsons Investor LLC Agreement will restrict the distribution of our common stock held by Albertsons Investor to the members of Albertsons Investor for a period that is the earlier of (x) four years beginning on the date of our listing on the NYSE and (y) the 35% Trigger Date (subject to extension by vote of holders of the equity interests in Albertsons Investor and Kimco, voting together as a single class, that directly or indirectly own our common stock issued to Albertsons Investor and Kimco on the date of our listing on the NYSE representing at least 70% of such common stock, provided, that any extension of greater than one year shall require the consent of 100% of the equity interests of Albertsons Investor, Kimco and Management Holdco (so long as Kimco and Management Holdco own our common stock)). If any equityholder of Albertsons Investor does not wish to participate in a private block sale or resale by Albertsons Investor (a “Sell-Down”), Albertsons Investor shall, subject to compliance with securities laws, distribute to such equityholder such equityholder’s pro rata share of our common stock that would have otherwise been sold in such Sell-Down (the “Distributed Stock”); provided that the Distributed Stock shall be subject to the same restrictions on transfer, market stand-off and lock-up provisions to which Albertsons Investor is subject with respect to such Sell-Down and the Stockholders’ Agreement (the “Transaction Transfer Restrictions”). Subject to compliance with applicable securities laws, the Distributed Stock may be sold or otherwise disposed of by the holder thereof so long as no Transaction Transfer Restriction period is in effect. Albertsons Investor shall provide notice to such holder or its representatives of its intention to effect a Sell-Down not more than 30 calendar days prior to the intended date for the completion of such Sell-Down, in which event the holder of the Distributed Stock shall have the right to participate in such Sell-Down with Albertsons Investor pro rata based on such holder’s beneficial ownership of our common stock, or, if not participating in such Sell-Down, shall not sell or otherwise dispose of the Distributed Stock (or other of our common stock beneficially owned by such holder) during such 30 calendar day period or such longer transfer, market stand-off or lock up provision that Albertsons Investor shall become subject to in connection with such Sell-Down.
185
Table of Contents
Registration Rights
Upon the closing of this offering, Albertsons Investor, which will hold an aggregate of 349,832,761 shares of our common stock, will have the right to require us to register the shares of our common stock held by Albertsons Investor, Kimco and Management Holdco (on a pro rata and pari passu basis) under the Securities Act under specified circumstances. After registration and sale pursuant to these rights, these shares will become freely tradable without restriction under the Securities Act. We will bear the expenses incurred in connection with the filing of any such registration statements. Please see “Certain Relationships and Related Party Transactions—Stockholders’ Agreement” for additional information regarding these registration rights.
Incentive Plans
As soon as practicable after the closing of this offering, we intend to file a Form S-8 registration statement under the Securities Act to register shares of our common stock issued or reserved for issuance under our 2015 Incentive Plan. The Form S-8 registration statement will become effective immediately upon filing, and shares covered by that registration statement will thereupon be eligible for sale in the public markets, subject to vesting restrictions, the lock-up agreements described above, and Rule 144 limitations applicable to affiliates. For a more complete discussion of our equity compensation plans, see “Executive Compensation—Incentive Plans.”
186
Table of Contents
The following is a summary of the material provisions of the instruments and agreements evidencing the material indebtedness of Albertsons, Safeway, NAI Holdings and certain of their subsidiaries. It does not include all of the provisions of our material indebtedness, does not purport to be complete and is qualified in its entirety by reference to the instruments and agreements described. Pursuant to the IPO-Related Transactions, Albertsons Companies, Inc., as the surviving corporation of the merger of Albertson’s Holdings LLC into it, will become a guarantor under the ABS/Safeway Term Loan Agreement and the ABS/Safeway ABL Agreement and a co-obligor under the ABS/Safeway Indenture, each as defined below.
ABS/Safeway Term Loan Agreement
Albertsons and Safeway entered into a second amended and restated term loan agreement, dated as of August 25, 2014 and effective of January 30, 2015 (the “ABS/Safeway Term Loan Agreement”) among Albertson’s LLC, Safeway and the other co-borrowers, as borrowers, Albertson’s Holdings and the other guarantors from time to time party thereto, as guarantors, the lenders from time to time party thereto, and Credit Suisse AG, Cayman Islands Branch, as administrative and collateral agent.
Structure. The ABS/Safeway Term Loan Agreement provides for a $6,300 million term loan facility, consisting of a $1,426 million term loan tranche B-2 as of September 12, 2015 (the “ABS/Safeway Term Loan B-2”), a $934 million term loan tranche B-3 as of September 12, 2015 (the “ABS/Safeway Term Loan B-3”) and a $3,880 million term loan tranche B-4 as of September 12, 2015 (the “ABS/Safeway Term Loan B-4” and, together with the ABS/Safeway Term Loan B-2 and the ABS/Safeway Term Loan B-3, the “ABS/Safeway Term Loan Facilities”). In addition, the borrowers are entitled to increase the term loan commitments under the ABS/Safeway Term Loan Agreement in an aggregate principal amount up to $450 million, plus an unlimited additional principal amount subject to satisfaction of a consolidated first lien net leverage ratio test.
Maturity. The ABS/Safeway Term Loan B-2 has a maturity date of March 21, 2019, the ABS/Safeway Term Loan B-3 has a maturity date of August 25, 2019 and the ABS/Safeway Term Loan B-4 has a maturity date of August 25, 2021.
Amortization. (a) The ABS/Safeway Term Loan B-2 amortizes on a quarterly basis at a rate of 1% of the original principal amount of the ABS/Safeway Term Loan B-2 per year (which payments shall be reduced as a result of the application of prepayments in accordance with the terms therewith); (b) the ABS/Safeway Term Loan B-3 amortizes on a quarterly basis at a rate of 5% of the original principal amount of the ABS/Safeway Term Loan B-3 during the first year, 7.5% of the original principal amount of the ABS/Safeway Term Loan B-3 during the second year, 12.5% of the original principal amount of the ABS/Safeway Term Loan B-3 during the third year and 15% of the original principal amount of the ABS/Safeway Term Loan B-3 during each year thereafter (which payments, in each case, shall be reduced as a result of the application of prepayments in accordance with the terms therewith) and (c) the ABS/Safeway Term Loan B-4 amortizes on a quarterly basis at a rate of 1% of the original principal amount of the ABS/Safeway Term Loan B-4 per year (which payments shall be reduced as a result of the application of prepayments in accordance with the terms therewith).
Prepayment. The ABS/Safeway Term Loan Facilities are required to be prepaid with: (i) 100% of the net cash proceeds of certain asset sales, casualty events and other dispositions, subject to the terms of an intercreditor agreement between the agent for the ABS/Safeway Term Loan Facilities and
187
Table of Contents
the agent for the ABS/Safeway ABL Agreement (as defined and described below) and certain exceptions and reinvestment rights; (ii) 100% of the net cash proceeds of debt incurrences (other than debt incurrences permitted under the ABS/Safeway Term Loan Agreement) and (iii) 75% (subject to step-downs to zero, in accordance with a consolidated first lien net leverage ratio test) of excess cash flow minus certain payments made under the ABS/Safeway ABL Agreement and voluntary prepayments of, and purchases of loans under, the ABS/Safeway Term Loan Facilities.
Interest. (a) The ABS/Safeway Term Loan B-2 bears interest, at our option, at a rate per annum equal to either (i) the base rate plus 3.375%; or (ii) LIBOR (subject to a 1.00% floor) plus 4.375%; (b) the ABS/Safeway Term Loan B-3 bears interest, at our option, at a rate per annum equal to either (i) the base rate plus 3% or (ii) the LIBOR rate (subject to a 1.00% floor) plus 4% and (c) the ABS/Safeway Term Loan B-4 bears interest, at our option, at a rate per annum equal to either (i) the base rate plus 3.5% or the LIBOR rate (subject to a 1.00% floor) plus 4.5%. At the election of the agent or a majority of the lenders, the interest rate may increase by 2% with respect to any portion of the ABS/Safeway Term Loan Facilities or other obligations not paid on the due date thereof, until such amount due is paid in full.
Guarantees. Subject to certain exceptions, the amounts outstanding under the ABS/Safeway Term Loan Agreement are guaranteed by Albertson’s Holdings and each of its existing and future direct and indirect wholly-owned domestic subsidiaries that are not borrowers.
Security. Subject to certain exceptions, the obligations under the ABS/Safeway Term Loan Agreement are secured by (i) a first-priority security interest in and lien on substantially all of the assets of the borrowers and guarantors (other than the ABS/Safeway ABL Priority Collateral (as defined below)), including real property and the equity interests of Albertson’s Holdings and its “Restricted Subsidiaries” (as defined in the ABS/Safeway Term Loan Agreement), and (ii) a second-priority security interest in and lien on substantially all of the accounts receivable, inventory, documents of title related to inventory, instruments, general intangibles (excluding any equity interests of Albertson’s Holdings or any of its subsidiaries), chattel paper, and supporting obligations, in each case, relating solely to or constituting proceeds of other ABS/Safeway ABL Priority Collateral, and certain related assets of the borrowers and guarantors and all proceeds thereof (the “ABS/Safeway ABL Priority Collateral”).
Fees. Certain customary fees are payable to the lenders and the agents under the ABS/Safeway Term Loan Agreement, including a call premium of 1% if the ABS/Safeway Term Loan Facilities are repriced or are refinanced with debt having a lower effective yield than the ABS/Safeway Term Loan Facilities within one year and 31 days following August 11, 2014.
Covenants. The ABS/Safeway Term Loan Agreement contains various affirmative and negative covenants (in each case, subject to customary exceptions), including, but not limited to, restrictions on the ability of (a) the subsidiaries of Albertson’s Holdings to: (i) dispose of assets; (ii) incur additional indebtedness, issue preferred stock and guarantee obligations; (iii) prepay certain indebtedness; (iv) pay certain restricted payments and dividends; (v) create liens on assets or agree to restrictions on the creation of liens on assets; (vi) make investments, loans or advances; (vii) restrict distributions from subsidiaries; (viii) engage in mergers or consolidations; (ix) engage in certain transactions with affiliates; (x) amend the terms of any of our organizational documents or material indebtedness; (xi) change lines of business or (xii) make certain accounting changes, and (b) Albertson’s Holdings to engage in material operating or business activities. The ABS/Safeway Term Loan Agreement contains no financial covenants.
Events of Default. The ABS/Safeway Term Loan Agreement contains customary events of default (subject to customary exceptions, thresholds and grace periods), including, but not limited to: (i) nonpayment of principal, interest or other amounts; (ii) failure to perform or observe covenants;
188
Table of Contents
(iii) inaccuracy or breaches of representations and warranties; (iv) cross-defaults and cross-acceleration with certain other indebtedness; (v) certain bankruptcy related events; (vi) impairment of security interests in collateral; (vii) actual or asserted invalidity of guarantees or other security documents or other term facilities documentation; (viii) material judgments; (ix) certain ERISA matters; (x) certain change of control events (including after completion of this offering (other than (a) Cerberus; (b) Lubert-Adler Real Estate Fund V, L.P.; (c) Klaff Realty; (d) Schottenstein Stores and (e) Kimco Realty, and their affiliates, related funds and managed accounts (the “Equity Investors”) owning more than 50% of the equity interests of Albertson’s Holdings or (c) Albertson’s Holdings failing to own 100% of the equity interests of Albertson’s LLC or Safeway) and (xi) loss of lien priority.
ABS/Safeway ABL Agreement
On January 30, 2015, Albertson’s LLC and Safeway entered into an amended and restated asset-based revolving credit agreement among Albertson’s LLC, Safeway and the other co-borrowers, as borrowers (collectively, the “ABS/Safeway ABL Borrowers”), Albertson’s Holdings and the other guarantors from time to time party thereto, as guarantors, the lenders from time to time party thereto and Bank of America N.A., as administrative and collateral agent (the “ABS/Safeway ABL Agreement”).
Structure. The ABS/Safeway ABL Agreement provides for a $3,000 million revolving credit facility (with subfacilities for letters of credit and swingline loans) (the “ABS/Safeway ABL Facility”). The ABS/Safeway ABL Facility may be used to fund working capital and general corporate purposes, including permitted acquisitions and other investments. Subject to customary conditions, amounts available under the ABS/Safeway ABL Facility may be borrowed, repaid and reborrowed until the maturity date thereof. The maximum amount that may be borrowed and outstanding at any time under the ABS/Safeway ABL Facility (including undrawn letters of credit) may not exceed a borrowing base, as described below. In addition, the ABS/Safeway ABL Borrowers are entitled to increase the commitments under the ABS/Safeway ABL Agreement in an aggregate principal amount of up to an additional $750 million.
Borrowing Base. The amount of loans and letters of credit available under the ABS/Safeway ABL Facility is limited to the lesser of the aggregate commitments under the ABS/Safeway ABL Facility or an amount determined pursuant to a borrowing base. The borrowing base at any time is equal to 90% of eligible credit card receivables, plus 90% of the net amount of eligible health care receivables, plus 90% of the “net recovery percentage” of eligible inventory (other than perishable inventory) multiplied by the book value thereof, plus 90% of the “net recovery percentage” of eligible perishable inventory multiplied by the book value thereof (subject to a cap of 25% of the borrowing base), plus 85% of the product of the average per script net orderly liquidation value of the eligible prescription files of the borrowers and the guarantors thereunder (“ABS/Safeway Eligible Pharmacy Scripts”) multiplied by the number of such ABS/Safeway Eligible Pharmacy Scripts (subject to a cap of 30% of the borrowing base), minus eligibility reserves. The eligibility of accounts receivable, inventory and prescription files for inclusion in the borrowing base is determined in accordance with certain customary criteria specified in the ABS/Safeway ABL Agreement, including periodic appraisals. The terms of the ABS/Safeway ABL Agreement provide that appraisals of assets included in the borrowing base are to be conducted annually, twice per year if excess availability falls below 25% of the aggregate commitments and quarterly during the continuance of an event of default.
Maturity. The ABS/Safeway ABL Facility matures on the earlier to occur of (a) January 30, 2020, and (b) the date that is 91 days prior to the final maturity of certain material indebtedness (if such other indebtedness has not been repaid or extended prior to such 91st day).
Prepayment. The ABS/Safeway ABL Facility is required to be repaid (or, in the case of letters of credit, cash collateralized) (a) to the extent that extensions of credit outstanding under the ABS/
189
Table of Contents
Safeway ABL Facility exceed (i) the aggregate commitments or (ii) the then-current borrowing base, and (b) in an amount equal to 100% of the net cash proceeds of certain asset sales, casualty events and other dispositions of ABS/Safeway ABL Priority Collateral (to the extent of the type included in the borrowing base) (or under certain circumstances, the amount advanced or available to be advanced against the ABS/Safeway ABL Priority Collateral subject to the sale, casualty or other disposition).
Interest. Amounts outstanding under the ABS/Safeway ABL Agreement bear interest at a rate per annum equal to, at our option (a) the base rate, plus an applicable margin equal to (i) 0.50% (if daily average excess availability during the most recently ended fiscal quarter is greater than 66% of the aggregate commitments), (ii) 0.75% (if daily average excess availability during the most recently ended fiscal quarter is less than or equal to 66% of the aggregate commitments, but greater than or equal to 20% of the aggregate commitments), or (iii) 1.00% (if daily average excess availability during the most recently ended fiscal quarter is less than 20% of the aggregate commitments), or (b) the LIBOR rate, plus an applicable margin equal to (i) 1.50% (if daily average excess availability during the most recently ended fiscal quarter is greater than 66% of the aggregate commitments), (ii) 1.75% (if daily average excess availability during the most recently ended fiscal quarter is less than or equal to 66% of the aggregate commitments, but greater than or equal to 20% of the aggregate commitments), or (iii) 2.00% (if daily average excess availability during the most recently ended fiscal quarter is less than 20% of the aggregate commitments). If not paid when due, the ABS/Safeway ABL Facility bears interest at the rate otherwise applicable to such loans at such time plus an additional 2% per annum during the continuance of such payment event of default and the letter of credit fees increase by 2%. Other overdue amounts bear interest at a rate equal to the rate otherwise applicable to such revolving loans bearing interest at the base rate at such time, plus 2% until such amounts are paid in full.
Guarantees. Subject to certain exceptions, the amounts outstanding under the ABS/Safeway ABL Agreement are guaranteed by Albertson’s Holdings and each of its existing and future direct and indirect wholly-owned domestic subsidiaries that are not borrowers.
Security. Subject to certain exceptions, the obligations under the ABS/Safeway ABL Agreement are secured by (a) a first-priority security interest in and lien on ABS/Safeway ABL Priority Collateral and (b) a third-priority security interest in and lien on substantially all other assets (other than real property).
Fees. Certain customary fees are payable to the lenders and the agents under the ABS/Safeway ABL Agreement, including a commitment fee on the average daily unused amount of the ABS/Safeway ABL Facility, in an amount equal to (a) 0.25% per annum if such average daily excess availability amount during the most recently ended fiscal quarter is less than 50% of the aggregate commitments and (b) 0.375% per annum if such average daily excess availability amount during the most recently ended fiscal quarter is greater than or equal to 50% of the aggregate commitments.
Affirmative and Negative Covenants. The ABS/Safeway ABL Agreement contains various affirmative and negative covenants (in each case, subject to customary exceptions), including, but not limited to, restrictions on the ability of (a) the subsidiaries of Albertson’s Holdings to (i) dispose of assets, (ii) incur additional indebtedness, issue preferred stock and guarantee obligations, (iii) prepay other indebtedness, (iv) pay certain restricted payments and dividends, (v) create liens on assets or agree to restrictions on the creation of liens on assets, (vi) make investments, loans or advances, (vii) restrict distributions from our subsidiaries, (viii) engage in mergers or consolidations, (ix) engage in certain transactions with affiliates, (x) amend the terms of any of our organizational documents or material indebtedness, (xi) change lines of business or (xii) make certain accounting changes, and (b) Albertson’s Holdings to (i) incur additional indebtedness, issue preferred stock and guarantee obligations, (ii) prepay other indebtedness, or (iii) engage in material operating or business activities.
190
Table of Contents
Financial Covenants. The ABS/Safeway ABL Agreement provides that if (a) excess availability is less than (i) 10% of the aggregate commitments at any time or (ii) $200 million at any time or (b) an event of default is continuing, Albertson’s Holdings and its subsidiaries must maintain a fixed charge coverage ratio of 1.0:1.0 from the date such triggering event occurs until such event of default is cured or waived and/or the 30th day that all such triggers under clause (a) no longer exist.
Events of Default. The ABS/Safeway ABL Agreement contains customary events of default (subject to customary exceptions, thresholds and grace periods), including, without limitation: (i) nonpayment of principal or interest; (ii) failure to perform or observe covenants; (iii) inaccuracy or breaches of representations and warranties; (iv) cross-defaults and cross-accelerations with certain other indebtedness; (v) certain bankruptcy related events; (vi) impairment of security interests in collateral; (vii) invalidity of guarantees; (viii) material judgments; (ix) certain ERISA matters and (x) certain change of control events (including after completion of this offering, any person or group (other than the Equity Investors) owning directly or indirectly more than 50% of the equity interests of Albertson’s Holdings, or Albertson’s Holdings failing to own 100% of the equity interests of Albertson’s LLC or Safeway).
ABS/Safeway Indenture
Albertson’s Holdings and Safeway (collectively, the “ABS/Safeway Issuers”), are co-obligors under an indenture, dated as of October 23, 2014 and as amended and supplemented from time to time (the “ABS/Safeway Indenture”), by and among the ABS/Safeway Issuers, certain subsidiaries of the ABS/Safeway Issuers, as guarantors, and Wilmington Trust, National Association, as trustee and collateral agent, under which the ABS/Safeway Issuers have $609.6 million of 7.750% senior secured notes due October 15, 2022 (outstanding as of September 12, 2015) (such notes, the “ABS/Safeway Notes”).
Interest. Interest is payable on April 15 and October 15 of each year.
Guarantees. Subject to certain exceptions, the obligations under the ABS/Safeway Indenture are guaranteed by each of the existing and future direct and indirect wholly-owned domestic subsidiaries of Albertson’s Holdings (other than Safeway).
Security. Subject to certain exceptions, the obligations under the ABS/Safeway Indenture are secured by (i) a second-priority security interest in and lien on substantially all of the assets of the ABS/Safeway Issuers and the guarantors (other than the ABS/Safeway ABL Priority Collateral), and (ii) a third-priority security interest in and lien on the ABS/Safeway ABL Priority Collateral.
Optional Redemption. Prior to October 15, 2017, the ABS/Safeway Notes may be redeemed in whole or in part at a redemption price equal to 100% of the principal amount thereof plus accrued and unpaid interest thereon, plus an applicable make-whole premium equal to the greater of (a) 1.0% and (b) the excess of (i) the sum of the present value of 105.813% of the principal amount being redeemed, plus all required interest payments due on the note through October 15, 2017 (exclusive of interest accrued to the date of redemption) discounted to the date of redemption at the then-current interest rate on U.S. Treasury Securities of comparable maturities, plus 50 basis points. In addition, prior to October 15, 2017, the ABS/Safeway Issuers may redeem up to 40% of the outstanding notes with the net proceeds of certain equity offerings at 107.750% of the principal amount of the notes plus accrued and unpaid interest.
After October 15, 2017, the ABS/Safeway Notes may be redeemed in whole or in part at the following redemption prices: (a) 105.813% if such notes are redeemed between October 15, 2017 and October 14, 2018, (b) 103.875% if such notes are redeemed between October 15, 2018 and October 14, 2019, (c) 101.938% if such notes are redeemed between October 15, 2019 and October 14, 2020, and (d) at par thereafter.
191
Table of Contents
Mandatory Redemption. The ABS/Safeway Notes do not require the making of any mandatory redemption or sinking fund payments.
Repurchase of Notes at the Option of Holders. If a “change of control” occurs, the ABS/Safeway Issuers will be required to offer to purchase all of the ABS/Safeway Notes from the holders of such notes at a price equal to 101% of the principal amount outstanding, plus all accrued interest thereon. A “change of control” includes (i) subject to certain exceptions, the sale, lease or transfer, in one or a series of related transactions, of all or substantially all the assets of Albertson’s Holdings and its subsidiaries, taken as a whole, to a person other than the Equity Investors, (ii) Albertson’s Holdings becomes aware of the acquisition by any person or group, other than any of the Equity Investors, of more than 50% of the voting power of Albertson’s Holdings or any of its direct or indirect parent companies or (iii) Albertson’s Holdings ceases to own 100% of the capital stock of Safeway.
Covenants. The ABS/Safeway Indenture contains various affirmative and negative covenants (subject to customary exceptions), including, but not limited to, restrictions on the ability of Albertson’s Holdings and its subsidiaries to: (i) dispose of assets; (ii) incur additional indebtedness, issue preferred stock and guarantee obligations; (iii) make certain restricted payments, investments and payments in respect of subordinated indebtedness; (iv) create liens on assets or agree to restrictions on the creation of liens on assets, (v) restrict distributions from Albertson’s Holdings’ subsidiaries; (vi) engage in mergers or consolidations and (vii) engage in certain transactions with affiliates.
Events of Default. The ABS/Safeway Indenture contains events of default (subject to customary exceptions, thresholds and grace periods), including, without limitation: (i) nonpayment of principal, interest or premium; (ii) failure to perform or observe covenants; (iii) cross-acceleration with certain other indebtedness; (iv) certain judgments; (v) certain bankruptcy related events; (vi) impairment of security interests in collateral and (vii) invalidity of guarantees.
Safeway Indenture
Safeway is party to an indenture, dated September 10, 1997 (the “Safeway Indenture”), with The Bank of New York, as trustee, under which Safeway has the following seven outstanding issues of notes (amounts as of September 12, 2015):
a) $80,000,000 of 3.40% Senior Notes due December 2016 (the “2016 Safeway Notes”);
b) $100,000,000 of 6.35% Senior Notes due August 2017 (the “2017 Safeway Notes”);
c) $268,557,000 of 5.00% Senior Notes due August 2019 (the “2019 Safeway Notes”);
d) $136,826,000 of 3.95% Senior Notes due August 2020 (the “2020 Safeway Notes”);
e) $130,020,000 of 4.75% Senior Notes due December 2021 (the “2021 Safeway Notes”);
f) $150,000,000 of 7.45% Senior Debentures due September 2027 (the “2027 Safeway Notes”); and
g) $600,000,000 of 7.25% Senior Debentures due February 2031 (the “2031 Safeway Notes”).
The 2016 Safeway Notes, 2017 Safeway Notes, 2019 Safeway Notes, 2020 Safeway Notes, 2021 Safeway Notes, 2027 Safeway Notes and 2031 Safeway Notes are collectively referred to as the “Safeway Notes.”
192
Table of Contents
Interest. Interest is payable on (a) February 15 and August 15 of each year for the 2017 Safeway Notes, 2019 Safeway Notes and 2020 Safeway Notes, (b) June 1 and December 1 of each year for the 2016 Safeway Notes and 2021 Safeway Notes, (c) March 15 and September 15 of each year for the 2027 Safeway Notes and (d) February 1 and August 1 of each year for the 2031 Safeway Notes.
Guarantees. The 2016 Safeway Notes, 2017 Safeway Notes and 2019 Safeway Notes are guaranteed by Albertson’s Holdings and its subsidiaries. The 2020 Safeway Notes, the 2021 Safeway Notes, the 2027 Safeway Notes and the 2031 Safeway Notes are not guaranteed.
Security. The 2016 Safeway Notes, 2017 Safeway Notes and 2019 Safeway Notes are secured on a pari passu basis with the ABS/Safeway Notes by all of the collateral that secures the ABS/Safeway Notes. The 2020 Safeway Notes, 2021 Safeway Notes, 2027 Safeway Notes and 2031 Safeway Notes are equally and ratably secured on a pari passu basis with the ABS/Safeway Notes to the extent of certain of the collateral owned by Safeway and its subsidiaries.
Optional Redemption. The Safeway Notes are redeemable at our option at a redemption price equal to the greater of (i) 100% of the principal amount of the Safeway Notes to be redeemed and (ii) an amount equal to the sum of the present values of the remaining scheduled payments of principal and interest on the Safeway Notes to be redeemed (exclusive of interest accrued to the date of redemption) discounted to the date of redemption on a semiannual basis at the then-current interest rate on U.S. Treasury Securities of comparable maturities, plus the following:
2016 Safeway Notes: 40 basis points;
2017 Safeway Notes: 25 basis points;
2019 Safeway Notes: 30 basis points;
2020 Safeway Notes: 20 basis points;
2021 Safeway Notes: 45 basis points;
2027 Safeway Notes: 10 basis points; and
2031 Safeway Notes: 25 basis points.
Mandatory Redemption. The Safeway Notes do not require the making of any mandatory redemption or sinking fund payments.
Repurchase of Notes at the Option of Holders. If a “change of control” transaction (which includes (a) the disposition of all or substantially all of Safeway’s and its subsidiaries properties or assets, (b) the consummation of any transaction pursuant to which any person owns more than 50% of the voting stock of Safeway or (c) a majority of the members of Safeway’s board of directors not constituting continuing directors), and as a result thereof, a “rating event” occurs (i.e., the rating on a series of Safeway Notes is lowered by each of the rating agencies then rating the Safeway Notes below an investment grade rating within 60 days after the change of control or announcement of an intention to effect a change of control), Safeway is required to offer to purchase all of the 2016 Safeway Notes, 2017 Safeway Notes, 2019 Safeway Notes, 2020 Safeway Notes and 2021 Safeway Notes from the holders at a price equal to 101% of the principal amount outstanding plus all accrued interest thereon.
Covenants. The Safeway Indenture contains various affirmative and negative covenants (subject to customary exceptions), including, but not limited to, restrictions on the ability of Safeway
193
Table of Contents
and its subsidiaries to (i) create liens on assets, (ii) engage in mergers or consolidations or (iii) enter into sale and leaseback transactions.
Events of Default. The Safeway Indenture contains events of default (subject to customary exceptions, thresholds and grace periods), including, without limitation: (i) nonpayment of principal or interest; (ii) failure to perform or observe covenants; (iii) cross-acceleration with certain other indebtedness and (iv) certain bankruptcy related events.
NAI Term Loan Agreement
On June 27, 2014, NAI Holdings and NAI entered into a term loan agreement (the “NAI Term Loan Agreement”) by and among NAI, NAI Holdings and the other guarantors from time to time party thereto, the lenders from time to time party thereto, and Citibank, N.A., as administrative and collateral agent.
Structure. As of September 12, 2015, the NAI Term Loan Agreement provided for the $850 million NAI Term Loan Facility, which was increased through an amendment to the NAI Term Loan Agreement by $300 million on November 10, 2015. In addition, NAI is entitled to increase the term loan commitments under the NAI Term Loan Agreement in an unlimited amount subject to satisfaction of a consolidated first lien net leverage ratio test.
Maturity. The NAI Term Loan Facility has a maturity date of June 27, 2021.
Amortization. The NAI Term Loan Facility amortizes on a quarterly basis at a rate of 0.25% of the aggregate principal amount of the NAI Term Loan Facility outstanding (which payments shall be reduced as a result of the application of prepayments in accordance with the terms thereof).
Prepayment. The NAI Term Loan Facility is required to be prepaid with: (i) 100% of the net cash proceeds of certain asset sales, casualty events and other dispositions, subject to the terms of an intercreditor agreement with the lenders under the NAI ABL Agreement (as defined herein) and certain exceptions and reinvestment rights; (ii) 100% of the net cash proceeds of debt incurrences (other than debt incurrences permitted under the NAI Term Loan Agreement) and (iii) 50% (subject to step-downs to zero, in accordance with a consolidated first lien net leverage ratio test) of excess cash flow minus certain payments made under the NAI ABL Agreement and voluntary prepayments of, and purchases of loans under, the NAI Term Loan Facility.
Interest. The NAI Term Loan Facility bears interest, at our option, at a rate per annum equal to either: (i) the base rate, plus 2.75% or (ii) the LIBOR rate (subject to a 1.00% floor) plus 3.75%. If not paid when due, the NAI Term Loan Facility bears interest at the rate otherwise applicable to the NAI Term Loan Facility at such time, plus an additional 2% per annum during the continuance of such payment event of default. Other overdue amounts bear interest at a rate equal to the rate otherwise applicable to the NAI Term Loan Facility bearing interest at the base rate at such time, plus 2% until such amounts are paid in full.
Guarantees. Subject to certain exceptions, the amounts outstanding under the NAI Term Loan Agreement are guaranteed by NAI Holdings and each of its existing and future direct and indirect wholly-owned domestic subsidiaries that are not borrowers (collectively, with NAI, the “NAI Term Loan Parties”).
Security. Subject to certain exceptions, the obligations under the NAI Term Loan Agreement are secured by (i) a first-priority security interest in and lien on (a) all real property, equipment, fixtures and intellectual property, all documents, instruments, commercial tort claims, general intangibles of the NAI
194
Table of Contents
Term Loan Parties and supporting obligations relating solely to or constituting proceeds of such assets, and all other proceeds of the foregoing to the extent and only for so long as such proceeds constitute or consist of cash, instruments or deposit accounts that contain solely such proceeds and (b) equity interests in NAI and subsidiaries of NAI and intercompany notes and all voting and other rights, and certain dividends and distributions with respect thereto, and proceeds thereof (collectively, the “NAI Pari Debt Term Loan Priority Collateral”) and (ii) a second-priority security interest in and lien on all accounts, goods, documents, letter of credit and letter of credit rights, investment property (excluding equity interests in NAI and its subsidiaries), commercial tort claims, general intangibles (excluding intellectual property), deposit accounts, books and records, “supporting obligations,” scripts and prescription files of the NAI Term Loan Parties and all proceeds related to the foregoing (collectively, the “NAI ABL Priority Collateral”).
Fees. Certain customary fees are payable to the lenders and the agents under the NAI Term Loan Agreement.
Covenants. The NAI Term Loan Agreement contains various affirmative and negative covenants (in each case, subject to customary exceptions), including, but not limited to, restrictions on the ability of NAI Holdings and its subsidiaries to: (i) dispose of assets; (ii) incur additional indebtedness, issue preferred stock and guarantee obligations; (iii) repay other indebtedness; (iv) pay certain restricted payments and dividends; (v) create liens on assets or agree to restrictions on the creation of liens on assets; (vi) make investments, loans or advances; (vii) restrict distributions from subsidiaries; (viii) engage in mergers or consolidations; (ix) engage in certain transactions with affiliates; (x) amend the terms of any of our organizational documents or material indebtedness; (xi) change lines of business or (xii) make certain accounting changes. The NAI Term Loan Agreement contains no financial covenants.
Events of Default. The NAI Term Loan Agreement contains customary events of default (subject to customary exceptions, thresholds and grace periods), including, but not limited to: (i) nonpayment of principal, interest or other amounts; (ii) failure to perform or observe covenants; (iii) inaccuracy or breaches of representations and warranties; (iv) cross-defaults and cross-acceleration with certain other indebtedness; (v) certain bankruptcy related events; (vi) impairment of security interests in collateral; (vii) actual or asserted invalidity of guarantees or other security documents or other term facilities documentation; (viii) material judgments; (ix) certain ERISA matters; (x) certain change of control events (including the Equity Investors failing to own more than 50% of the voting power of NAI Holdings, any “change in control” or other similar event as defined in any document governing other material indebtedness of any of the NAI Term Loan Parties, or NAI Holdings failing to own 100% of the equity interests of NAI free and clear of all liens) and (xi) loss of lien priority.
NAI ABL Agreement
On January 24, 2014, NAI Holdings and NAI entered into an asset-based revolving credit agreement among NAI, NAI Holdings, the other borrowers from time to time (the “NAI ABL Borrowers”), the guarantors from time to time party thereto, the lenders from time to time party thereto (such borrowers and guarantors, collectively, the “NAI ABL Loan Parties”) and Bank of America N.A., as administrative and collateral agent (the “NAI ABL Agreement”).
Structure. The NAI ABL Agreement provides for a $1,100 million asset-based revolving loan facility (with subfacilities for letters of credit and swingline loans) (the “NAI ABL Facility”). The NAI ABL Facility may be utilized for working capital and general corporate purposes, including permitted acquisitions and other investments. Subject to customary conditions, amounts available under the NAI ABL Facility may be borrowed, repaid and reborrowed until the maturity date thereof. The maximum
195
Table of Contents
amount that may be borrowed and outstanding at any time under the NAI ABL Facility (including undrawn letters of credit) may not exceed a borrowing base, as described below.
Borrowing Base. The amount of loans and letters of credit available under the NAI ABL Facility is limited to the lesser of the aggregate commitments under the NAI ABL Facility or an amount determined pursuant to a borrowing base. The borrowing base at any time is equal to 90% of eligible credit card receivables of the NAI ABL Loan Parties, plus 90% of the net amount of eligible health care receivables of the NAI ABL Loan Parties, plus 90% of the “net recovery percentage” of eligible inventory of the NAI ABL Loan Parties (other than perishable inventory) multiplied by the book value thereof, plus 90% of the “net recovery percentage” of eligible perishable inventory of the NAI ABL Loan Parties multiplied by the book value thereof (subject to a cap of 25% of the borrowing base), plus 85% of the product of the average per script net orderly liquidation value of the eligible prescription files of the NAI ABL Loan Parties thereunder (“NAI Eligible Pharmacy Scripts”) multiplied by the number of such NAI Eligible Pharmacy Scripts (subject to a cap of 30% of the borrowing base), plus the lesser of (i) the applicable real estate advance rate set forth in the NAI ABL Agreement multiplied by the appraised value of eligible real estate, if any, of the NAI ABL Loan Parties (net of any reserves) or (ii) the cap set on real estate (as set forth in the NAI ABL Agreement) (subject to certain conditions), minus eligibility reserves. Currently, the real estate of NAI and its subsidiaries secures only the obligations under the NAI Term Loan Facility and therefore is not included in the borrowing base under the NAI ABL Facility. The eligibility of accounts receivable, inventory and prescription files for inclusion in the borrowing base is determined in accordance with certain customary criteria specified in the NAI ABL Agreement, including periodic appraisals. The terms of the NAI ABL Agreement provide that appraisals of assets included in the borrowing base are to be conducted annually, twice per year if excess availability falls below 25% of the aggregate commitments, and quarterly during the continuance of an event of default.
Maturity. The NAI ABL Facility matures on the earlier to occur of (a) January 24, 2019 or (b) the date that is 91 days prior to the final maturity of certain material indebtedness (if such other indebtedness has not been repaid or extended prior to such 91st day).
Prepayment. The NAI ABL Facility is required to be repaid (or, in the case of letters of credit, cash collateralized) (a) to the extent that extensions of credit outstanding under the NAI ABL Facility exceed (i) the aggregate commitments or (ii) the then-current borrowing base and (b) in an amount equal to 100% of the net cash proceeds of certain asset sales, casualty events and other dispositions of NAI ABL Priority Collateral (to the extent of the type included in the borrowing base) (or under certain circumstances, if less, the amount advanced or available to be advanced against the NAI ABL Priority Collateral subject to the sale, casualty or other disposition).
Interest. Amounts outstanding under the NAI ABL Agreement bear interest at a rate equal to, at our option, the base rate or the LIBOR rate, plus an applicable margin equal to (i) 2.50% for LIBOR loans and 1.50% for base rate loans if the average excess availability under the NAI ABL Facility during the most recently ended fiscal quarter is greater than 66% of the aggregate commitments, (ii) 2.75% for LIBOR loans and 1.75% for base rate loans if the average excess availability under the NAI ABL Facility during the most recently ended fiscal quarter is less than or equal to 66% but greater than or equal to 20% of the aggregate commitments or (iii) 3.00% for LIBOR loans and 2.00% for base rate loans if the average excess availability under the NAI ABL Facility during the most recently ended fiscal quarter is less than 20% of the aggregate commitments. If not paid when due, the NAI ABL Facility bears interest at the rate otherwise applicable to such loans at such time plus an additional 2% per annum during the continuance of such payment event of default, and the letter of credit fees increase by 2%. Other overdue amounts bear interest at a rate equal to the rate otherwise applicable to such revolving loans bearing interest at the base rate at such time, plus 2% until such amounts are paid in full.
196
Table of Contents
Guarantees. Subject to certain exceptions, the amounts outstanding under the NAI ABL Agreement are guaranteed by NAI Holdings and each of its existing and future direct and indirect wholly-owned domestic subsidiaries that are not borrowers, excluding any real estate subsidiary unless it owns or ground-leases real estate that is eligible real estate included in the borrowing base or has been designated as collateral for incremental term loans under the NAI ABL Facility.
Security. Subject to certain exceptions, the obligations under the NAI ABL Agreement are secured by (a) a first-priority security interest in and lien on any NAI ABL Priority Collateral and (b) a second-priority security interest in and lien on any NAI Pari Debt Term Loan Priority Collateral (excluding any real estate that NAI has not elected to include in the borrowing base).
Fees. Certain customary fees are payable to the lenders and the agents under the NAI ABL Agreement, including a commitment fee on the average daily unused amount of the NAI ABL Facility, in an amount equal to (a) 0.375% per annum if such average daily excess availability amount during the most recently ended fiscal quarter is less than 50% of the aggregate commitments and (b) 0.50% per annum if such average daily excess availability amount during the most recently ended fiscal quarter is greater than or equal to 50% of the aggregate commitments.
Affirmative and Negative Covenants. The NAI ABL Agreement contains various affirmative and negative covenants (in each case, subject to customary exceptions), including, but not limited to, restrictions on the ability of NAI Holdings and its subsidiaries to (i) dispose of assets, (ii) incur additional indebtedness, issue preferred stock and guarantee obligations, (iii) repay other indebtedness, (iv) pay certain restricted payments and dividends, (v) create liens on assets or agree to restrictions on the creation of liens on assets, (vi) make investments, loans or advances, (vii) restrict distributions from our subsidiaries, (viii) engage in mergers or consolidations, (ix) engage in certain transactions with affiliates, (x) amend the terms of any of our organizational documents or material indebtedness, (xi) change lines of business or (xii) make certain accounting changes.
Financial Covenant. The NAI ABL Agreement provides that if (a) excess availability is less than 10% of the aggregate commitments at any time or (b) an event of default is continuing, NAI Holdings and its subsidiaries must maintain a fixed charge coverage ratio of 1.0:1.0 from the date such triggering event occurs until such event of default is cured or waived and/or the 30th consecutive day that the trigger under clause (a) no longer exists.
Events of Default. The NAI ABL Agreement contains customary events of default (subject to customary exceptions, thresholds and grace periods), including, without limitation: (i) nonpayment of principal or interest; (ii) failure to perform or observe covenants; (iii) inaccuracy or breaches of representations and warranties; (iv) cross-defaults and cross-accelerations with certain other indebtedness; (v) certain bankruptcy related events; (vi) impairment of security interests in collateral; (vii) invalidity of guarantees; (viii) material judgments; (ix) certain ERISA matters and (x) certain change of control events (including the Equity Investors failing to own more than 50% of the voting power of our company, any “change in control” or other similar event as defined in any document governing other material indebtedness of any of the NAI ABL Loan Parties, our company failing to own 100% of the equity interests of NAI Holdings, or NAI Holdings failing to own 100% of the equity interests of NAI free and clear of all liens).
197
Table of Contents
Letter of Credit Facility Agreement
On March 23, 2013, NAI and Bank of America, N.A., entered into a Letter of Credit Facility Agreement, as amended and restated as of January 24, 2014 (the “Letter of Credit Facility Agreement”), which provides for the issuance of standby letters of credit in an aggregate undrawn face amount at any time outstanding not to exceed $125 million (the “LC Facility”). The LC Facility expires on January 24, 2019. As of September 12, 2015, no letters of credit were outstanding under the LC Facility.
NAI Indenture
NAI (as successor to Albertson’s, Inc.) is party to an indenture, dated as of May 1, 1992 with U.S. Bank Trust National Association (as successor to Morgan Guaranty Trust Company of New York) (as supplemented by Supplemental Indenture No. 1, dated as of May 7, 2004; Supplemental Indenture No. 2, dated as of June 1, 2006; and Supplemental Indenture No. 3, dated as of December 29, 2008; collectively, the “NAI Indenture”), under which NAI has the following outstanding issues of notes:
a) $301,000,000 6.47% to 7.15% Medium-Term Notes, due July 2017—June 2028 (the “NAI Medium-Term Notes”)
b) $200,000,000 of 7.75% Debentures due June 2026 (the “2026 NAI Notes”);
c) $650,000,000 of 7.45% Senior Debentures due August 2029 (the “2029 NAI Notes”);
d) $225,000,000 of 8.70% Senior Debentures due May 2030 (the “2030 NAI Notes”); and
e) $400,000,000 of 8.00% Senior Debentures due May 2031 (the “2031 NAI Notes”).
The NAI Medium-Term Notes, 2026 NAI Notes, 2029 NAI Notes, 2030 NAI Notes and 2031 NAI Notes are collectively referred to as the “NAI Notes.”
Interest. Interest on the NAI Notes is payable semiannually.
Guarantees. The NAI Notes are not guaranteed.
Security. The NAI Notes are unsecured.
Optional Redemption. The NAI Medium-Term Notes and the 2026 NAI Notes are not redeemable or repayable prior to maturity. The 2029 NAI Notes, 2030 NAI Notes, and 2031 NAI Notes are redeemable in whole or in part at any time, at a price equal to the greater of (i) 100% of the principal amount to be redeemed and (ii) an amount equal to the sum of the present values of the remaining scheduled payments of principal and interest on the applicable notes to be redeemed (excluding any portion of payments of interest accrued as of the redemption date) discounted to the redemption date on a semiannual basis at the Adjusted Treasury Rate plus, in the case of:
(i) the 2031 NAI Notes, 30 basis points and
(ii) the 2029 NAI Notes and 2030 NAI Notes, 20 basis points.
Mandatory Redemption. The NAI Notes do not require the making of any mandatory redemption or sinking fund payments.
198
Table of Contents
Covenants. The NAI Indenture contains certain covenants restricting the ability of NAI and its subsidiaries (subject to customary exceptions) to (i) create liens on certain assets, (ii) engage in mergers or consolidations or (iii) enter into sale and leaseback transactions.
Events of Default. The NAI Indenture contains events of default (subject to customary exceptions, thresholds and grace periods), including, without limitation: (i) nonpayment of principal or interest; (ii) failure to perform or observe covenants; (iii) cross-acceleration with certain other indebtedness and (iv) certain bankruptcy related events.
American Stores Company Indenture
American Stores Company, LLC (“ASC”) is party to an indenture, dated as of May 1, 1995 with Wells Fargo Bank, National Association (as successor to The First National Bank of Chicago), as trustee (as further supplemented; together the “ASC Indenture”), under which ASC has the following four outstanding issues of notes:
a) $1,741,000 of 7.90% Debentures due May 2017 (the “2017 ASC Notes”);
b) $2,902,000 of 8% Debentures due June 2026 (the “2026 ASC Notes”);
c) $746,000 of 7.10% Medium Term Notes due March 2028 (the “2028 ASC MT Notes”); and
d) $143,000 of 7.5% Debentures due May 2037 (the “2037 ASC Notes”).
The 2017 ASC Notes, 2026 ASC Notes, the 2028 ASC MT Notes, and the 2037 ASC Notes are collectively referred to as the “ASC Notes.” Interest on the ASC Notes is payable semiannually. The ASC Notes are guaranteed by SuperValu. The 2017 ASC Notes, 2026 ASC Notes and 2037 ASC Notes are not redeemable prior to maturity. The 2028 ASC MT Notes are redeemable in whole or in part, at the option of ASC, subject to certain conditions. The ASC Notes do not require the making of any mandatory redemption or sinking fund payments.
Concurrently with the acquisition of NAI in March 2013, ASC, SuperValu, and JPMorgan Chase Bank, N.A., as escrow agent, entered into an escrow agreement pursuant to which ASC has deposited into escrow an amount equal to the outstanding principal balance of the ASC Notes plus funds sufficient to pay interest thereon for three years. ASC granted to SuperValu a security interest in its rights under the escrow agreement to secure reimbursement to SuperValu of any amounts paid by SuperValu under its guarantee of the ASC Notes. The ASC Indenture contains, solely for the benefit of the 2037 ASC Notes (but not any other series of the ASC Notes) certain covenants restricting the ability of ASC and its subsidiaries (subject to customary exceptions) to (i) create liens on certain assets, (ii) engage in mergers or consolidations or (iii) enter into sale and leaseback transactions.
Anticipated Refinancing Facilities
We have had preliminary discussions with potential lenders, financial intermediaries and advisors and following the consummation of this offering, subject to market conditions, we intend to enter into new financing facilities, consisting of the $4,000 million New ABL Loan Agreement, the New Term Loan Agreement (which we expect to be in the form of an amended and restated version of the ABS/Safeway Term Loan Agreement described above), and an indenture governing the New Notes. The New Financing Facilities are expected to extend the weighted average maturity of our indebtedness, reduce the amount of our secured indebtedness and provide use with more flexibility to pursue various transactions than we have under the restrictive covenants in our existing indebtedness.
199
Table of Contents
The relative principal amounts, applicable interest rates and other terms of the New Financing Facilities are not expected to be definitively determined until after the closing date of this offering and shortly before the closing date of the New Financing Facilities and may be adversely affected by economic, market, geopolitical and other conditions, most of which are beyond our control. If we enter into the New Financing Facilities, we intend to use the proceeds thereof to repay all amounts outstanding under, and to terminate, the Specified Existing Facilities and all amounts outstanding under the ABS/Safeway Term Loan Agreement. This offering is not contingent upon our entering into the New Financing Facilities. There can be no assurance that we will be able to complete the Anticipated Refinancing on terms favorable to us, or at all, and we may decide not to pursue the Anticipated Refinancing before its completion. If we are unable to complete, or elect not to pursue, the Anticipated Refinancing, there can be no assurance that we will be able to refinance our existing indebtedness prior to maturity on terms and conditions favorable to us, or at all.
200
Table of Contents
CERTAIN U.S. FEDERAL INCOME AND ESTATE TAX CONSIDERATIONS
TO NON-U.S. HOLDERS
The following is a summary of certain United States federal income and estate tax consequences to a non-U.S. holder (as defined herein) of the purchase, ownership and disposition of our common stock as of the date hereof. This summary deals only with common stock that is held as a capital asset.
Except as modified for estate tax purposes (as discussed below), a “non-U.S. holder” means a beneficial owner of our common stock that, for United States federal income tax purposes, is an individual, corporation, estate or trust that is not any of the following:
| • | an individual who is a citizen or resident of the United States; |
| • | a corporation organized under the laws of the United States, any state thereof or the District of Columbia; |
| • | an estate the income of which is subject to United States federal income taxation regardless of its source; or |
| • | a trust if it (1) is subject to the primary supervision of a court within the United States and one or more United States persons have the authority to control all substantial decisions of the trust or (2) has a valid election in effect under applicable United States Treasury regulations to be treated as a United States person. |
This summary is based upon provisions of the Internal Revenue Code of 1986, as amended (the “Code”) and regulations, rulings and judicial decisions, all as of the date hereof. Those authorities may be changed, perhaps retroactively, so as to result in United States federal income and estate tax consequences different from those summarized below. This summary does not address all aspects of United States federal income and estate taxes and does not address the effects of any other United States federal tax laws (including gift tax or the Medicare tax on certain investment income) and does not deal with foreign, state, local or other tax considerations that may be relevant to non-U.S. holders in light of their particular circumstances. In addition, it does not represent a detailed description of the United States federal income or estate tax consequences applicable to you if you are subject to special treatment under the United States federal income tax laws (including if you are a United States expatriate, “controlled foreign corporation,” “passive foreign investment company” or a partnership or other pass-through entity for United States federal income tax purposes). We cannot assure you that a change in law will not alter significantly the tax considerations that we describe in this summary.
If an entity treated as a partnership for United States federal income tax purposes holds our common stock, the tax treatment of a partner will generally depend upon the status of the partner and the activities of the partnership. If you are a partner of a partnership considering an investment in our common stock, you should consult your tax advisors.
If you are considering the purchase of our common stock, you should consult your own tax advisors concerning the particular United States federal tax consequences to you of the ownership of the common stock, as well as the consequences to you arising under the laws of any other taxing jurisdiction.
Dividends
Subject to the discussion of backup withholding and FATCA (as defined herein) below, dividends paid to a non-U.S. holder of our common stock generally will be subject to United States federal withholding tax at a 30% rate or such lower rate as may be specified by an applicable income tax treaty.
201
Table of Contents
However, dividends that are effectively connected with the conduct of a trade or business by the non-U.S. holder within the United States are generally not subject to the United States federal withholding tax, provided certain certification and disclosure requirements are satisfied. Instead, such dividends are subject to United States federal income tax on a net income basis in generally the same manner as if the non-U.S. holder were a United States person as defined under the Code, unless an applicable income tax treaty provides otherwise. Any such effectively connected dividends received by a foreign corporation may be subject to an additional “branch profits tax” at a 30% rate or such lower rate as may be specified by an applicable income tax treaty, on its effectively connected earnings and profits, subject to adjustments.
A non-U.S. holder of our common stock who wishes to claim the benefit of an applicable treaty rate and avoid backup withholding, as discussed below, for dividends will be required (a) to complete the applicable Internal Revenue Service Form W-8 and certify under penalty of perjury that such holder is not a United States person as defined under the Code and is eligible for treaty benefits or (b) if our common stock is held through certain foreign intermediaries, to satisfy the relevant certification requirements of applicable United States Treasury regulations. Special certification and other requirements apply to certain non-U.S. holders that are pass-through entities rather than corporations or individuals.
A non-U.S. holder of our common stock eligible for a reduced rate of United States withholding tax pursuant to an income tax treaty may obtain a refund of any excess amounts withheld by timely filing an appropriate claim for refund with the Internal Revenue Service.
Gain on Disposition of Common Stock
Subject to the discussion of backup withholding and FATCA below, any gain realized on the sale, exchange or other taxable disposition of our common stock generally will not be subject to United States federal income or withholding tax unless:
| • | the gain is effectively connected with a trade or business of the non-U.S. holder in the United States; |
| • | the non-U.S. holder is an individual who is present in the United States for 183 days or more in the taxable year of that disposition, and certain other conditions are met; or |
| • | we are or have been a “United States real property holding corporation” for United States federal income tax purposes. |
A non-U.S. holder described in the first bullet point immediately above will be subject to United States federal income tax on the net gain derived from the disposition on a net income basis in generally the same manner as if the non-U.S. holder were a United States person as defined under the Code, unless an applicable income tax treaty provides otherwise. If a non-U.S. holder that is a foreign corporation falls under the first bullet point immediately above, it may also be subject to the branch profits tax equal to 30% (or such lower rate as may be specified by an applicable income tax treaty) of its effectively connected earnings and profits, subject to adjustments.
Unless an applicable income tax treaty provides otherwise, an individual non-U.S. holder described in the second bullet point immediately above will be subject to a flat 30% United States federal income tax on the gain derived from the disposition, which may be offset by United States source capital losses, even though the individual is not considered a resident of the United States.
We believe we are not and do not anticipate becoming a “United States real property holding corporation” for United States federal income tax purposes. However, even if we become a “United States real property holding corporation,” if our common stock is considered to be regularly traded on
202
Table of Contents
an established securities market for United States federal income tax purposes, only a non-U.S. holder who, actually or constructively, holds or held (at any time during the shorter of the five year period preceding the date of disposition or the holder’s holding period) more than 5% of our common stock will be subject to United States federal income tax on any gain derived from the disposition of our common stock.
Federal Estate Tax
Common stock held (or deemed held) at the time of death by an individual non-U.S. holder who is neither a citizen or resident of the United States (as specifically defined for United States estate tax purposes) will be included in such holder’s gross estate for United States federal estate tax purposes, unless an applicable estate tax treaty provides otherwise.
Information Reporting and Backup Withholding
We must report annually to the Internal Revenue Service and to each non-U.S. holder the amount of dividends paid to such holder and the tax withheld with respect to such dividends, regardless of whether withholding was required. Copies of the information returns reporting such dividends and withholding may also be made available to the tax authorities in the country in which the non-U.S. holder resides under the provisions of an applicable income tax treaty.
A non-U.S. holder will be subject to backup withholding for dividends paid to such holder unless such holder certifies under penalty of perjury that it is a non-U.S. holder, or such holder otherwise establishes an exemption.
Information reporting and, depending on the circumstances, backup withholding will apply to the proceeds of a disposition of our common stock within the United States or conducted through certain United States-related financial intermediaries, unless the beneficial owner certifies under penalty of perjury that it is a non-U.S. holder, or such owner otherwise establishes an exemption.
Backup withholding is not an additional tax. Any amounts withheld under the backup withholding rules may be allowed as a refund or a credit against a non-U.S. holder’s United States federal income tax liability provided the required information is timely furnished to the Internal Revenue Service.
Additional Withholding Requirements
Under Sections 1471 through 1474 of the Code (such Sections commonly referred to as “FATCA”), a 30% United States federal withholding tax may apply to any dividends paid on our common stock and, for a disposition of our common stock occurring after December 31, 2016, the gross proceeds from such disposition, in each case paid to (i) a “foreign financial institution” (as specifically defined in the Code), whether such foreign financial institution is the beneficial owner or an intermediary, which does not provide sufficient documentation, typically on IRS Form W-8BEN-E, evidencing either (x) an exemption from FATCA, or (y) its compliance (or deemed compliance) with FATCA (which may alternatively be in the form of compliance with an intergovernmental agreement with the United States) in a manner which avoids withholding, or (ii) a “non-financial foreign entity” (as specifically defined in the Code), whether such non-financial foreign entity is the beneficial owner or an intermediary, which does not provide sufficient documentation, typically on IRS Form W-8BEN-E, evidencing either (x) an exemption from FATCA, or (y) adequate information regarding certain substantial United States beneficial owners of such entity (if any). If a dividend payment is both subject to withholding under FATCA and subject to the withholding tax discussed above under “—Dividends,” the withholding under FATCA may be credited against, and therefore reduce, such other withholding tax. You should consult your own tax advisor regarding these requirements and whether they may be relevant to your purchase, ownership and disposition of our common stock.
203
Table of Contents
UNDERWRITING (CONFLICTS OF INTEREST)
The company and the underwriters named below have entered into an underwriting agreement with respect to the shares being offered. Subject to certain conditions, each underwriter has severally agreed to purchase the number of shares indicated in the following table. Goldman, Sachs & Co., Merrill Lynch, Pierce, Fenner & Smith Incorporated, Citigroup Global Markets Inc. and Morgan Stanley & Co. LLC are the representatives of the underwriters.
| Underwriters |
Number of Shares | |||
| Goldman, Sachs & Co. |
||||
| Merrill Lynch, Pierce, Fenner & Smith Incorporated |
||||
| Citigroup Global Markets Inc. |
||||
| Morgan Stanley & Co. LLC |
||||
| Deutsche Bank Securities Inc. |
||||
| Credit Suisse Securities (USA) LLC |
||||
| Barclays Capital Inc. |
||||
| Lazard Frères & Co. LLC |
||||
| Guggenheim Securities, LLC |
||||
| Jefferies LLC |
||||
| RBC Capital Markets, LLC |
||||
| Wells Fargo Securities, LLC |
||||
| BMO Capital Markets Corp. |
||||
| SunTrust Robinson Humphrey, Inc. |
||||
| Telsey Advisory Group LLC |
||||
| Academy Securities, Inc. |
||||
| Samuel A. Ramirez & Company, Inc. |
||||
| Blaylock Beal Van, LLC |
||||
|
|
|
|||
| Total |
65,306,122 | |||
|
|
|
|||
The underwriters are committed to take and pay for all of the shares being offered, if any are taken, other than the shares covered by the option described below unless and until this option is exercised.
The underwriters have an option to buy up to an additional 9,795,918 shares from the company. They may exercise that option for 30 days from the date hereof. If any shares are purchased pursuant to this option, the underwriters will severally purchase shares in approximately the same proportion as set forth in the table above.
The following table shows the per share and total underwriting discounts and commissions to be paid to the underwriters by the company. Such amounts are shown assuming both no exercise and full exercise of the underwriters’ option to purchase 9,795,918 additional shares.
| Paid by the Company |
No Exercise | Full Exercise | ||||||
| Per Share |
$ | $ | ||||||
| Total |
$ | $ | ||||||
Shares sold by the underwriters to the public will initially be offered at the initial public offering price set forth on the cover of this prospectus. Any shares sold by the underwriters to securities dealers may be sold at a discount of up to $ per share from the initial public offering price. After the initial offering of the shares, the representatives may change the offering price and the other selling terms. The offering of the shares by the underwriters is subject to receipt and acceptance and subject to the underwriters’ right to reject any order in whole or in part.
204
Table of Contents
The company and its officers, directors and holders of substantially all of the company’s common stock have agreed with the underwriters, subject to certain exceptions, not to dispose of or hedge any of their common stock or securities convertible into or exchangeable for shares of common stock during the period from the date of this prospectus continuing through the date that is 180 days after the date of this prospectus, except with the prior written consent of the representatives. Pursuant to this agreement, among other exceptions, we may enter into an agreement providing for the issuance of our common stock in connection with the acquisition, merger or joint venture with another publicly traded entity during the 180-day restricted period after the date of this prospectus. This agreement does not apply to any existing employee benefit plans. See “Shares Eligible for Future Sale” for a discussion of certain transfer restrictions.
At our request, the underwriters have reserved up to 5% of the shares offered by this prospectus for sale within the United States to some of our directors, officers, employees, business associates and related persons. If these persons purchase reserved shares it will reduce the number of shares available for sale to the general public. Any reserved shares that are not so purchased will be offered by the underwriters to the general public on the same terms as the other shares offered by this prospectus.
Prior to the offering, there has been no public market for the shares. The initial public offering price has been negotiated among the company and the representatives. Among the factors to be considered in determining the initial public offering price of the shares, in addition to prevailing market conditions, will be the company’s historical performance, estimates of the business potential and earnings prospects of the company, an assessment of the company’s management and the consideration of the above factors in relation to market valuation of companies in related businesses.
We have been approved to list our common stock on the NYSE under the symbol “ABS.” In order to meet one of the requirements for listing the common stock on the NYSE, the underwriters have undertaken to sell lots of 100 or more shares to a minimum of 400 beneficial holders.
In connection with the offering, the underwriters may purchase and sell shares of common stock in the open market. These transactions may include short sales, stabilizing transactions and purchases to cover positions created by short sales. Short sales involve the sale by the underwriters of a greater number of shares than they are required to purchase in the offering, and a short position represents the amount of such sales that have not been covered by subsequent purchases. A “covered short position” is a short position that is not greater than the amount of additional shares for which the underwriters’ option described above may be exercised. The underwriters may cover any covered short position by either exercising their option to purchase additional shares or purchasing shares in the open market. In determining the source of shares to cover the covered short position, the underwriters will consider, among other things, the price of shares available for purchase in the open market as compared to the price at which they may purchase additional shares pursuant to the option described above. “Naked” short sales are any short sales that create a short position greater than the amount of additional shares for which the option described above may be exercised. The underwriters must cover any such naked short position by purchasing shares in the open market. A naked short position is more likely to be created if the underwriters are concerned that there may be downward pressure on the price of the common stock in the open market after pricing that could adversely affect investors who purchase in the offering. Stabilizing transactions consist of various bids for or purchases of common stock made by the underwriters in the open market prior to the completion of the offering.
The underwriters may also impose a penalty bid. This occurs when a particular underwriter repays to the underwriters a portion of the underwriting discount received by it because the representatives have repurchased shares sold by or for the account of such underwriter in stabilizing or short covering transactions.
205
Table of Contents
Purchases to cover a short position and stabilizing transactions, as well as other purchases by the underwriters for their own accounts, may have the effect of preventing or retarding a decline in the market price of the company’s stock, and together with the imposition of the penalty bid, may stabilize, maintain or otherwise affect the market price of the common stock. As a result, the price of the common stock may be higher than the price that otherwise might exist in the open market. The underwriters are not required to engage in these activities and may end any of these activities at any time. These transactions may be effected on the NYSE, in the over-the-counter market or otherwise.
The underwriters do not expect sales to discretionary accounts to exceed five percent of the total number of shares offered.
The company estimates that its share of the total expenses of the offering, excluding underwriting discounts and commissions, will be approximately $13,000,000. The company has agreed to reimburse the underwriters for certain expenses, including the reasonable fees and disbursements of counsel for the underwriters in connection with any required review of the terms of the offering by the Financial Industry Regulatory Authority in an amount not to exceed $35,000.
The company has agreed to indemnify the several underwriters against certain liabilities, including liabilities under the Securities Act.
The underwriters and their respective affiliates are full service financial institutions engaged in various activities, which may include sales and trading, commercial and investment banking, advisory, investment management, investment research, principal investment, hedging, market making, brokerage and other financial and non-financial activities and services. Certain of the underwriters and their respective affiliates have provided, and may in the future provide, a variety of these services to the company and to persons and entities with relationships with the company, for which they received or will receive customary fees and expenses. Lazard Frères & Co. is acting as our financial advisor in connection with the offering. We expect to pay Lazard Frères & Co., upon the successful completion of this offering, a fee of $2,250,000 for its services, which fee shall be reduced by the amount of any underwriting discount paid to Lazard Frères & Co. in connection with this offering. We have also agreed to reimburse Lazard Frères & Co. for certain expenses incurred in connection with its engagement of up to $50,000, and, in our sole discretion, may pay Lazard Frères & Co. an additional incentive fee of up to $1,750,000.
In the ordinary course of their various business activities, the underwriters and their respective affiliates, officers, directors and employees may purchase, sell or hold a broad array of investments and actively trade securities, derivatives, loans, commodities, currencies, credit default swaps and other financial instruments for their own account and for the accounts of their customers, and such investment and trading activities may involve or relate to assets, securities and/or instruments of the company (directly, as collateral securing other obligations or otherwise) and/or persons and entities with relationships with the company. The underwriters and their respective affiliates may also communicate independent investment recommendations, market color or trading ideas and/or publish or express independent research views in respect of such assets, securities or instruments and may at any time hold, or recommend to clients that they should acquire, long and/or short positions in such assets, securities and instruments. Affiliates of certain of the underwriters act as lenders and/or agents under the Senior Secured Credit Facilities. In addition, affiliates of certain of the underwriters hold a position in our debt securities. Affiliates of the underwriters who hold ABS/Safeway Notes and/or are lenders under the NAI Term Loan Facility and/or ABS/Safeway Term Loan Facilities may receive a portion of the net proceeds from this offering. See “Use of Proceeds.” It is anticipated that affiliates of certain of the underwriters will act as lenders and/or agents under the New Credit Facilities. It is also anticipated that certain of the underwriters will act as initial purchasers in connection with the offering of the New Notes.
206
Table of Contents
Sharon Allen, a member of the our board of directors, also serves on the board of directors of Bank of America Corporation, the parent company of Merrill Lynch, Pierce, Fenner & Smith Incorporated.
Conflicts of Interest
A portion of the net proceeds from this offering will be used to repay borrowings outstanding under the ABS/Safeway Term Loan Facilities. Because one or more funds or accounts managed or advised by an investment management affiliate of Guggenheim Securities, LLC are lenders under the ABS/Safeway Term Loan Facilities and may receive 5% or more of the net proceeds from this offering, Guggenheim Securities, LLC is deemed to have a “conflict of interest” within the meaning of Rule 5121. As such, this offering is being conducted in accordance with the applicable requirements of Rule 5121. Rule 5121 requires that a “qualified independent underwriter” meeting certain standards participate in the preparation of the registration statement and prospectus and exercise the usual standards of due diligence with respect thereto. Goldman, Sachs & Co. will act as a “qualified independent underwriter” within the meaning of Rule 5121 in connection with this offering. Goldman, Sachs & Co. will not receive any additional fees for serving as a qualified independent underwriter in this offering. We have agreed, subject to certain terms and conditions, to indemnify Goldman, Sachs & Co. against certain liability incurred in connection with it acting as a qualified independent underwriter in this offering, including liabilities under the Securities Act. Guggenheim Securities, LLC will not confirm sales to accounts in which it exercises discretionary authority without the prior written consent of the customer.
The shares may be sold in Canada only to purchasers purchasing, or deemed to be purchasing, as principal that are accredited investors, as defined in National Instrument 45-106 Prospectus Exemptions or subsection 73.3(1) of the Securities Act (Ontario), and are permitted clients, as defined in National Instrument 31-103 Registration Requirements, Exemptions and Ongoing Registrant Obligations. Any resale of the shares must be made in accordance with an exemption from, or in a transaction not subject to, the prospectus requirements of applicable securities laws.
Securities legislation in certain provinces or territories of Canada may provide a purchaser with remedies for rescission or damages if this prospectus (including any amendment thereto) contains a misrepresentation, provided that the remedies for rescission or damages are exercised by the purchaser within the time limit prescribed by the securities legislation of the purchaser’s province or territory. The purchaser should refer to any applicable provisions of the securities legislation of the purchaser’s province or territory for particulars of these rights or consult with a legal advisor.
Pursuant to section 3A.3 of National Instrument 33-105 Underwriting Conflicts (NI 33-105), the underwriters are not required to comply with the disclosure requirements of NI 33-105 regarding underwriter conflicts of interest in connection with this offering.
In relation to each Member State of the European Economic Area which has implemented the Prospectus Directive (each, a “Relevant Member State”), each underwriter has represented and agreed that with effect from and including the date on which the Prospectus Directive is implemented in that Relevant Member State (the “Relevant Implementation Date”) it has not made and will not make an offer of shares to the public in that Relevant Member State prior to the publication of a prospectus in relation to the shares which has been approved by the competent authority in that Relevant Member State or, where appropriate, approved in another Relevant Member State and notified to the competent authority in that Relevant Member State, all in accordance with the Prospectus Directive, except that it may, with effect from and including the Relevant Implementation Date, make an offer of shares to the public in that Relevant Member State at any time:
(a) to legal entities which are authorised or regulated to operate in the financial markets or, if not so authorised or regulated, whose corporate purpose is solely to invest in securities;
207
Table of Contents
(b) to any legal entity which has two or more of (1) an average of at least 250 employees during the last financial year; (2) a total balance sheet of more than €43,000,000 and (3) an annual net turnover of more than €50,000,000, as shown in its last annual or consolidated accounts;
(c) to fewer than 150 natural or legal persons (other than qualified investors as defined in the Prospectus Directive) subject to obtaining the prior consent of the representatives for any such offer; or
(d) in any other circumstances which do not require the publication by the company of a prospectus pursuant to Article 3 of the Prospectus Directive.
For the purposes of this provision, the expression an “offer of shares to the public” in relation to any shares in any Relevant Member State means the communication in any form and by any means of sufficient information on the terms of the offer and the shares to be offered so as to enable an investor to decide to purchase or subscribe the shares, as the same may be varied in that Relevant Member State by any measure implementing the Prospectus Directive in that Relevant Member State and the expression Prospectus Directive means Directive 2003/71/EC and includes any relevant implementing measure in each Relevant Member State.
Each underwriter has represented and agreed that:
(a) it has only communicated or caused to be communicated and will only communicate or cause to be communicated an invitation or inducement to engage in investment activity (within the meaning of Section 21 of the Financial Services and Markets Act 2000 (Financial Promotion) Order 2005, as amended (the “FSMA”) received by it in connection with the issue or sale of the shares in circumstances in which Section 21(1) of the FSMA would not apply to the company; and
(b) it has complied and will comply with all applicable provisions of the FSMA with respect to anything done by it in relation to the shares in, from or otherwise involving the United Kingdom.
The shares may not be offered or sold by means of any document other than (i) in circumstances which do not constitute an offer to the public within the meaning of the Companies Ordinance (Cap.32, Laws of Hong Kong), or (ii) to “professional investors” within the meaning of the Securities and Futures Ordinance (Cap.571, Laws of Hong Kong) and any rules made thereunder or (iii) in other circumstances which do not result in the document being a “prospectus” within the meaning of the Companies Ordinance (Cap.32, Laws of Hong Kong), and no advertisement, invitation or document relating to the shares may be issued or may be in the possession of any person for the purpose of issue (in each case whether in Hong Kong or elsewhere), which is directed at, or the contents of which are likely to be accessed or read by, the public in Hong Kong (except if permitted to do so under the laws of Hong Kong) other than with respect to shares which are or are intended to be disposed of only to persons outside Hong Kong or only to “professional investors” within the meaning of the Securities and Futures Ordinance (Cap. 571, Laws of Hong Kong) and any rules made thereunder.
This prospectus has not been registered as a prospectus with the Monetary Authority of Singapore. Accordingly, this prospectus and any other document or material in connection with the offer or sale, or invitation for subscription or purchase, of the shares may not be circulated or distributed, nor may the shares be offered or sold, or be made the subject of an invitation for subscription or purchase, whether directly or indirectly, to persons in Singapore other than (i) to an institutional investor under Section 274 of the Securities and Futures Act, Chapter 289 of Singapore (the “SFA”), (ii) to a relevant person, or any person pursuant to Section 275(1A), and in accordance with the conditions, specified in Section 275 of the SFA or (iii) otherwise pursuant to, and in accordance with the conditions of, any other applicable provision of the SFA.
Where the shares are subscribed or purchased under Section 275 of the SFA by a relevant person which is: (a) a corporation (which is not an accredited investor) the sole business of which is to
208
Table of Contents
hold investments and the entire share capital of which is owned by one or more individuals, each of whom is an accredited investor; or (b) a trust (where the trustee is not an accredited investor) whose sole purpose is to hold investments and each beneficiary is an accredited investor, shares, debentures and units of shares and debentures of that corporation or the beneficiaries’ rights and interest in that trust shall not be transferable for 6 months after that corporation or that trust has acquired the shares under Section 275 of the SFA except: (1) to an institutional investor under Section 274 of the SFA or to a relevant person, or any person pursuant to Section 275(1A), and in accordance with the conditions, specified in Section 275 of the SFA; (2) where no consideration is given for the transfer; or (3) by operation of law.
The securities have not been and will not be registered under the Financial Instruments and Exchange Law of Japan (the “Financial Instruments and Exchange Law”) and each underwriter has agreed that it will not offer or sell any securities, directly or indirectly, in Japan or to, or for the benefit of, any resident of Japan (which term as used herein means any person resident in Japan, including any corporation or other entity organized under the laws of Japan), or to others for re-offering or resale, directly or indirectly, in Japan or to a resident of Japan, except pursuant to an exemption from the registration requirements of, and otherwise in compliance with, the Financial Instruments and Exchange Law and any other applicable laws, regulations and ministerial guidelines of Japan.
The shares may not be publicly offered in Switzerland and will not be listed on the SIX Swiss Exchange (“SIX”) or on any other stock exchange or regulated trading facility in Switzerland. This document has been prepared without regard to the disclosure standards for issuance prospectuses under art. 652a or art. 1156 of the Swiss Code of Obligations or the disclosure standards for listing prospectuses under art. 27 ff. of the SIX Listing Rules or the listing rules of any other stock exchange or regulated trading facility in Switzerland. Neither this document nor any other offering or marketing material relating to the shares or the offering may be publicly distributed or otherwise made publicly available in Switzerland.
Neither this document nor any other offering or marketing material relating to the offering, the company, the shares have been or will be filed with or approved by any Swiss regulatory authority. In particular, this document will not be filed with, and the offer of shares will not be supervised by, the Swiss Financial Market Supervisory Authority FINMA (FINMA), and the offer of shares has not been and will not be authorized under the Swiss Federal Act on Collective Investment Schemes (“CISA”). The investor protection afforded to acquirers of interests in collective investment schemes under the CISA does not extend to acquirers of shares.
This prospectus relates to an Exempt Offer in accordance with the Offered Securities Rules of the Dubai Financial Services Authority (“DFSA”). This prospectus is intended for distribution only to persons of a type specified in the Offered Securities Rules of the DFSA. It must not be delivered to, or relied on by, any other person. The DFSA has no responsibility for reviewing or verifying any documents in connection with Exempt Offers. The DFSA has not approved this prospectus nor taken steps to verify the information set forth herein and has no responsibility for the prospectus. The shares to which this prospectus relates may be illiquid and/or subject to restrictions on their resale. Prospective purchasers of the shares offered should conduct their own due diligence on the shares. If you do not understand the contents of this prospectus you should consult an authorized financial advisor.
No placement document, prospectus, product disclosure statement or other disclosure document has been lodged with the Australian Securities and Investments Commission, in relation to the offering. This prospectus does not constitute a prospectus, product disclosure statement or other disclosure document under the Corporations Act 2001 (the “Corporations Act”), and does not purport to include the information required for a prospectus, product disclosure statement or other disclosure document under the Corporations Act.
209
Table of Contents
Any offer in Australia of the shares may only be made to persons (the “Exempt Investors”) who are “sophisticated investors” (within the meaning of section 708(8) of the Corporations Act), “professional investors” (within the meaning of section 708(11) of the Corporations Act) or otherwise pursuant to one or more exemptions contained in section 708 of the Corporations Act so that it is lawful to offer the shares without disclosure to investors under Chapter 6D of the Corporations Act.
The shares applied for by Exempt Investors in Australia must not be offered for sale in Australia in the period of 12 months after the date of allotment under the offering, except in circumstances where disclosure to investors under Chapter 6D of the Corporations Act would not be required pursuant to an exemption under section 708 of the Corporations Act or otherwise or where the offer is pursuant to a disclosure document which complies with Chapter 6D of the Corporations Act. Any person acquiring shares must observe such Australian on-sale restrictions.
This prospectus contains general information only and does not take account of the investment objectives, financial situation or particular needs of any particular person. It does not contain any securities recommendations or financial product advice. Before making an investment decision, investors need to consider whether the information in this prospectus is appropriate to their needs, objectives and circumstances, and, if necessary, seek expert advice on those matters.
210
Table of Contents
Schulte Roth & Zabel LLP, New York, New York, will pass upon the validity of the common stock offered hereby. Cahill Gordon & Reindel LLP, New York, New York, is counsel for the underwriters in connection with this offering.
The consolidated financial statements of AB Acquisition as of February 28, 2015 and February 20, 2014, and for each of the three years in the period ended February 28, 2015 and the balance sheet of the Albertsons Companies, Inc. as of June 23, 2015 included in this prospectus have been audited by Deloitte & Touche LLP, an independent registered public accounting firm, as stated in their reports appearing herein. Such consolidated financial statements and balance sheet have been so included in reliance upon the reports of such firm given upon their authority as experts in accounting and auditing.
The consolidated financial statements of Safeway as of January 3, 2015 and December 28, 2013 and for the 53 weeks ended January 3, 2015, and the 52 weeks ended December 28, 2013 and December 29, 2012, included in this prospectus have been audited by Deloitte & Touche LLP, an independent registered public accounting firm, as stated in their report appearing herein. Such consolidated financial statements have been so included in reliance upon the report of such firm given upon their authority as experts in accounting and auditing.
The combined financial statements of the New Albertson’s business of SUPERVALU INC. and subsidiaries as of February 21, 2013 and February 23, 2012 and for each of the fiscal years in the three-year period ended February 21, 2013 have been included herein and in the registration statement in reliance upon the report of KPMG LLP, independent registered public accounting firm, appearing elsewhere herein, and upon the authority of said firm as experts in accounting and auditing.
The consolidated financial statements of United for the 48 weeks ended December 28, 2013 and the year ended January 26, 2013 included in this prospectus and elsewhere in the registration statement have been so included in reliance upon the report of RSM US LLP (formerly McGladrey LLP), independent certified public accountants, upon the authority of said firm as experts in accounting and auditing in giving said reports.
WHERE YOU CAN FIND MORE INFORMATION
We have filed with the SEC a registration statement on Form S-1 under the Securities Act to register our common stock being offered in this prospectus. This prospectus, which forms part of the registration statement, does not contain all the information included in the registration statement and the amendments, exhibits and schedules thereto. For further information about us and the common stock being offered in this prospectus, we refer you to the registration statement and the exhibits and schedules thereto. We are not currently subject to the informational requirements of the Exchange Act. As a result of the offering of the shares of our common stock, we will become subject to the informational requirements of the Exchange Act, and, in accordance therewith, will file quarterly and annual reports and other information with the SEC. The registration statement, including the exhibits and schedules thereto, such reports and other information may be read and copied at the SEC’s Public Reference Room at 100 F Street, NE, Washington, DC 20549. The public may obtain information on the operation of the Public Reference Room by calling the SEC at 1-800-SEC-0330. The SEC also maintains an internet site (http://www.sec.gov) that contains our SEC filings. Statements made in this prospectus about legal documents may not necessarily be complete, and you should read the documents which are filed as exhibits to the registration statement otherwise filed with the SEC.
211
Table of Contents
| Albertsons Companies, Inc. |
||||
| Unaudited Interim Consolidated Financial Statements |
||||
| F-2 | ||||
| F-3 | ||||
| Audited Consolidated Financial Statements |
||||
| F-5 | ||||
| F-6 | ||||
| F-7 | ||||
| AB Acquisition |
||||
| Unaudited Interim Condensed Consolidated Financial Statements |
||||
| F-8 | ||||
| Condensed Consolidated Statements of Operations and Comprehensive Loss |
F-9 | |||
| F-10 | ||||
| F-11 | ||||
| Audited Consolidated Financial Statements |
||||
| F-31 | ||||
| F-32 | ||||
| Consolidated Statements of Operations and Comprehensive (Loss) Income |
F-33 | |||
| F-34 | ||||
| F-36 | ||||
| F-37 | ||||
| Safeway |
||||
| Audited Consolidated Financial Statements |
||||
| F-94 | ||||
| F-95 | ||||
| F-96 | ||||
| F-97 | ||||
| F-98 | ||||
| F-100 | ||||
| F-102 | ||||
| NAI |
||||
| Audited Combined Financial Statements |
||||
| F-152 | ||||
| F-153 | ||||
| Combined Statements of Operations and Comprehensive Income (Loss) |
F-154 | |||
| F-155 | ||||
| F-156 | ||||
| F-157 | ||||
| United |
||||
| Audited Consolidated Financial Statements |
||||
| F-191 | ||||
| F-192 | ||||
| F-193 | ||||
| F-194 | ||||
| F-195 | ||||
| F-196 | ||||
F-1
Table of Contents
Balance Sheets
(unaudited)
| September 12, 2015 |
June 23, 2015 |
|||||||
| ASSETS |
||||||||
| Cash |
$ | — | $ | — | ||||
|
|
|
|
|
|||||
| Total assets |
$ | — | $ | — | ||||
|
|
|
|
|
|||||
| LIABILITIES |
||||||||
| Total liabilities |
$ | — | $ | — | ||||
|
|
|
|
|
|||||
| Commitments and contingencies |
||||||||
| STOCKHOLDER’S EQUITY |
||||||||
| Common Stock, par value $0.01 per share, 600,000,000 shares authorized, none issued and outstanding |
— | — | ||||||
|
|
|
|
|
|||||
| Total stockholder’s equity |
— | — | ||||||
|
|
|
|
|
|||||
| Total liabilities and stockholder’s equity |
$ | — | $ | — | ||||
|
|
|
|
|
|||||
The accompanying notes are an integral part of these Balance Sheets.
F-2
Table of Contents
Notes to the Balance Sheets
(unaudited)
NOTE 1—ORGANIZATION
Albertsons Companies, Inc. (the “Company”) was formed as a Delaware corporation on June 23, 2015. Pursuant to a planned reorganization and initial public offering (“IPO”), the Company will become a holding company for AB Acquisition LLC and its subsidiaries, Albertson’s Holdings LLC and NAI Holdings LLC.
NOTE 2—SUMMARY OF SIGNIFICANT ACCOUNTING POLICIES
Basis of Accounting—The balance sheet has been prepared in accordance with accounting principles generally accepted in the United States of America. Separate statements of operations, changes in stockholder’s equity and cash flows have not been presented in the financial statements because there have been no activities of this entity.
Underwriting Commissions and Offering Costs—Underwriting commissions and offering costs incurred in connection with the Company’s common share offerings will be reflected as a reduction of additional paid-in capital. Underwriting commissions and offering costs are not recorded in the Company’s consolidated balance sheet at September 12, 2015 because such costs are not the Company’s liability until the Company completes a successful IPO.
Organizational Costs—Organizational costs are not recorded in the Company’s consolidated balance sheet at September 12, 2015 because such costs are not the Company’s liability until the Company completes a successful IPO. Thereafter, costs incurred to organize the Company will be expensed as incurred.
NOTE 3—STOCKHOLDER’S EQUITY
At September 12, 2015, the Company was authorized to issue 600,000,000 shares of common stock, par value $0.01 per share and 30,000,000 shares of preferred stock, par value $0.01 per share. On September 21, 2015, the Company amended its certificate of incorporation increasing the authorized common stock to 1,000,000,000 shares. Under the Company’s certificate of incorporation, as amended, all shares of common stock are identical.
NOTE 4—EQUITY-BASED COMPENSATION
2015 Equity and Incentive Award Plan—On September 21, 2015, the Company adopted the Albertsons Companies, Inc. 2015 Equity and Incentive Award Plan (the “2015 Equity and Incentive Award Plan”). The 2015 Equity and Incentive Award Plan will become effective upon completion of a successful IPO and provides for the issuance of equity-based awards of common stock to eligible employees, consultants and non-employee directors in the form of options, restricted stock awards, restricted stock unit awards, performance awards, deferred stock awards, stock payment awards or stock appreciation rights.
| F-3 | (Continued) |
Table of Contents
ALBERTSONS COMPANIES, INC.
Notes to the Balance Sheets
(unaudited)
NOTE 5—SUBSEQUENT EVENTS
The Company has evaluated all subsequent events as of November 20, 2015, which represents the date of the issuance of this balance sheet.
| F-4 | (Continued) |
Table of Contents
REPORT OF INDEPENDENT REGISTERED PUBLIC ACCOUNTING FIRM
To the Management Board of
Albertsons Companies, Inc.:
We have audited the accompanying balance sheet of Albertsons Companies, Inc. (the “Company”) as of June 23, 2015. The financial statement is the responsibility of the Company’s management. Our responsibility is to express an opinion on this financial statement based on our audit.
We conducted our audit in accordance with the standards of the Public Company Accounting Oversight Board (United States). Those standards require that we plan and perform the audit to obtain reasonable assurance about whether the balance sheet is free of material misstatement. The Company is not required to have, nor were we engaged to perform, an audit of its internal control over financial reporting. Our audit included consideration of internal control over financial reporting as a basis for designing audit procedures that are appropriate in the circumstances, but not for the purpose of expressing an opinion on the effectiveness of the Company’s internal control over financial reporting. Accordingly, we express no such opinion. An audit also includes examining, on a test basis, evidence supporting the amounts and disclosures in the balance sheet, assessing the accounting principles used and significant estimates made by management, as well as evaluating the overall balance sheet presentation. We believe that our audit of the balance sheet provides a reasonable basis for our opinion.
In our opinion, such balance sheet presents fairly, in all material respects, the financial position of Albertsons Companies, Inc. as of June 23, 2015, in conformity with accounting principles generally accepted in the United States of America.
/s/ Deloitte & Touche LLP
Boise, Idaho
July 7, 2015
F-5
Table of Contents
Balance Sheet as of June 23, 2015
| June 23, 2015 |
||||
| ASSETS |
||||
| Cash |
$ | — | ||
|
|
|
|||
| Total assets |
$ | — | ||
|
|
|
|||
| LIABILITIES |
||||
| Total liabilities |
$ | — | ||
|
|
|
|||
| Commitments and contingencies |
— | |||
| STOCKHOLDER’S EQUITY |
||||
| Common Stock, par value $.01 per share, 600,000,000 shares authorized, none issued and outstanding |
— | |||
|
|
|
|||
| Total stockholder’s equity |
$ | — | ||
|
|
|
|||
| Total liabilities and stockholder’s equity |
$ | — | ||
|
|
|
|||
The accompanying notes are an integral part of this Balance Sheet.
F-6
Table of Contents
Notes to the Balance Sheet
Note 1—Organization
Albertsons Companies, Inc. (the “Company”) was formed as a Delaware corporation on June 23, 2015. Pursuant to a planned reorganization and initial public offering, the Company will become a holding corporation for AB Acquisition LLC, and its subsidiaries, Albertson’s Holdings LLC and NAI Holdings LLC.
Note 2—Summary of Significant Accounting Policies
Basis of Accounting—The balance sheet has been prepared in accordance with accounting principles generally accepted in the United States of America. Separate statements of operations, changes in stockholders’ equity and cash flows have not been presented in the financial statements because there have been no activities of this entity.
Underwriting Commissions and Offering Costs—Underwriting commissions and offering costs to be incurred in connection with the Company’s common share offerings will be reflected as a reduction of additional paid-in capital. Underwriting commissions and offering costs are not recorded in the Company’s consolidated balance sheet because such costs are not the Company’s liability until the Company completes a successful initial public offering.
Organizational Costs—Organizational costs are not recorded in the Company’s consolidated balance sheet because such costs are not the Company’s liability until the Company completes a successful initial public offering. Thereafter, costs incurred to organize the Company will be expensed as incurred.
Note 3—Stockholder’s Equity
The Company is authorized to issue 600,000,000 shares of common stock, par value $0.01 per share (“Common Stock”) and 30,000,000 shares of preferred stock, par value $0.01 per share (“Preferred Stock”). Under the Company’s certificate of incorporation as in effect as of June 23, 2015, all shares of common stock are identical.
Note 4—Subsequent Events
The Company has evaluated all subsequent events as of July 7, 2015 which represents the date of issuance of this balance sheet. The Company did not note any subsequent events requiring disclosure or adjustments to the balance sheet.
F-7
Table of Contents
AB ACQUISITION LLC AND SUBSIDIARIES
Condensed Consolidated Balance Sheets
($ in millions, except unit amounts)
(unaudited)
| September 12, 2015 |
February 28, 2015 |
|||||||
| ASSETS | ||||||||
| Current assets |
| |||||||
| Cash and cash equivalents |
$ | 777.7 | $ | 1,125.8 | ||||
| Receivables, net |
645.0 | 631.9 | ||||||
| Inventories, net |
4,252.1 | 4,156.6 | ||||||
| Other current assets |
449.5 | 1,190.5 | ||||||
|
|
|
|
|
|||||
| Total current assets |
6,124.3 | 7,104.8 | ||||||
| Property and equipment, net |
11,752.0 | 12,048.5 | ||||||
| Intangible assets, net |
4,001.0 | 4,235.0 | ||||||
| Goodwill |
1,013.8 | 1,013.8 | ||||||
| Other assets |
1,116.4 | 1,369.3 | ||||||
|
|
|
|
|
|||||
| TOTAL ASSETS |
$ | 24,007.5 | $ | 25,771.4 | ||||
|
|
|
|
|
|||||
| LIABILITIES AND MEMBERS’ EQUITY | ||||||||
| Current liabilities |
||||||||
| Accounts payable |
$ | 2,718.3 | $ | 2,763.5 | ||||
| Accrued salaries and wages |
1,016.6 | 1,136.4 | ||||||
| Current maturities of long-term debt and capitalized lease obligations |
181.0 | 624.0 | ||||||
| Current portion of self-insurance liability |
311.9 | 311.6 | ||||||
| Deferred tax liabilities |
136.9 | 145.4 | ||||||
| Taxes other than income taxes |
331.6 | 287.5 | ||||||
| Other current liabilities |
415.2 | 933.1 | ||||||
|
|
|
|
|
|||||
| Total current liabilities |
5,111.5 | 6,201.5 | ||||||
| Long-term debt and capitalized lease obligations |
11,795.9 | 11,945.0 | ||||||
| Deferred income taxes |
1,674.1 | 1,800.3 | ||||||
| Long-term self-insurance liability |
1,088.9 | 1,133.7 | ||||||
| Other long-term liabilities |
2,419.7 | 2,522.4 | ||||||
| Commitments and contingencies |
||||||||
| Members’ equity |
||||||||
| Tracking units, 300,000,000 units issued and outstanding each of Albertson’s, NAI and Safeway units as of September 12, 2015 and 300,000,000 units issued and 297,188,332 outstanding as of February 28, 2015 |
— | — | ||||||
| Residual units, 14,907,871 units issued and outstanding of convertible Investor incentive units as of both September 12, 2015 and February 28, 2015 |
— | — | ||||||
| Members’ investment |
1,938.0 | 1,848.7 | ||||||
| Accumulated other comprehensive income |
42.2 | 59.6 | ||||||
| (Accumulated deficit) retained earnings |
(62.8 | ) | 260.2 | |||||
|
|
|
|
|
|||||
| Total members’ equity |
1,917.4 | 2,168.5 | ||||||
|
|
|
|
|
|||||
| TOTAL LIABILITIES AND MEMBERS’ EQUITY |
$ | 24,007.5 | $ | 25,771.4 | ||||
|
|
|
|
|
|||||
The accompanying notes are an integral part of these Condensed Consolidated Financial Statements.
F-8
Table of Contents
AB ACQUISITION LLC AND SUBSIDIARIES
Condensed Consolidated Statements of Operations and Comprehensive Loss
($ in millions, except per unit amounts)
(unaudited)
| 28 weeks ended | ||||||||
| September 12, 2015 |
September 4, 2014 |
|||||||
| Net sales and other revenue |
$ | 31,488.9 | $ | 12,821.6 | ||||
| Cost of sales |
22,994.5 | 9,302.6 | ||||||
|
|
|
|
|
|||||
| Gross profit |
8,494.4 | 3,519.0 | ||||||
| Selling and administrative expenses |
8,406.4 | 3,449.8 | ||||||
|
|
|
|
|
|||||
| Operating income |
88.0 | 69.2 | ||||||
| Interest expense |
507.7 | 242.5 | ||||||
| Other (income) expense, net |
(9.3 | ) | 43.2 | |||||
|
|
|
|
|
|||||
| Loss before income taxes |
(410.4 | ) | (216.5 | ) | ||||
| Income tax benefit |
(87.4 | ) | (29.8 | ) | ||||
|
|
|
|
|
|||||
| Net loss |
$ | (323.0 | ) | $ | (186.7 | ) | ||
|
|
|
|
|
|||||
| Other comprehensive (loss) income: |
||||||||
| Loss on interest rate swaps, net of tax |
(18.3 | ) | (10.6 | ) | ||||
| Other, net of tax |
0.9 | 0.6 | ||||||
|
|
|
|
|
|||||
| Comprehensive loss |
$ | (340.4 | ) | $ | (196.7 | ) | ||
|
|
|
|
|
|||||
| Basic net loss per unit attributable to: |
||||||||
| Tracking Group continuing operations |
$ | (1.08 | ) | $ | (1.46 | ) | ||
| Tracking Group basic earnings per unit |
(1.08 | ) | (1.46 | ) | ||||
| Diluted net loss per unit attributable to: |
||||||||
| Tracking Group continuing operations |
$ | (1.08 | ) | $ | (1.46 | ) | ||
| Tracking Group diluted earnings per unit |
(1.08 | ) | (1.46 | ) | ||||
The accompanying notes are an integral part of these Condensed Consolidated Financial Statements.
F-9
Table of Contents
AB ACQUISITION LLC AND SUBSIDIARIES
Condensed Consolidated Statements of Cash Flows
(in millions and unaudited)
| 28 weeks ended | ||||||||
| September 12, 2015 |
September 4, 2014 |
|||||||
| Cash flows from operating activities: |
||||||||
| Net loss |
$ | (323.0 | ) | $ | (186.7 | ) | ||
| Adjustments to reconcile net loss to net cash provided by operating activities: |
||||||||
| Net loss (gain) on property dispositions, asset impairment and lease exit costs |
48.2 | (4.6 | ) | |||||
| Depreciation and amortization |
847.2 | 361.9 | ||||||
| LIFO expense |
10.8 | 18.7 | ||||||
| Deferred income tax |
(168.0 | ) | (36.0 | ) | ||||
| Pension and post-retirement benefits expense |
10.3 | 4.0 | ||||||
| Contributions to pension and post-retirement benefit plans |
(4.0 | ) | (11.6 | ) | ||||
| Loss on interest rate swaps and commodity hedges, net |
1.4 | 43.2 | ||||||
| Amortization and write-off of deferred financing costs |
26.9 | 37.7 | ||||||
| Non-cash equity-based compensation expense |
67.8 | 3.6 | ||||||
| Other |
(2.7 | ) | 16.6 | |||||
| Changes in operating assets and liabilities: |
||||||||
| Receivables, net |
(9.1 | ) | 26.9 | |||||
| Inventories, net |
(101.8 | ) | (77.0 | ) | ||||
| Accounts payable, accrued salaries and wages and other accrued liabilities |
(175.5 | ) | 148.4 | |||||
| Self-insurance liabilities |
(57.5 | ) | (113.2 | ) | ||||
| Other operating assets and liabilities |
275.6 | (22.8 | ) | |||||
|
|
|
|
|
|||||
| Net cash provided by operating activities |
446.6 | 209.1 | ||||||
|
|
|
|
|
|||||
| Cash flows from investing activities: |
||||||||
| Business acquisition(1) |
(387.2 | ) | — | |||||
| Payments for property, equipment and intangibles, including payments for lease buyouts |
(480.8 | ) | (150.8 | ) | ||||
| Proceeds from divestitures |
454.7 | — | ||||||
| Proceeds from sale of assets |
23.1 | 25.1 | ||||||
| Changes in restricted cash |
191.8 | (681.6 | ) | |||||
| Other |
26.3 | — | ||||||
|
|
|
|
|
|||||
| Net cash used in investing activities |
(172.1 | ) | (807.3 | ) | ||||
|
|
|
|
|
|||||
| Cash flows from financing activities: |
||||||||
| Proceeds from issuance of long-term debt |
40.0 | 1,726.9 | ||||||
| Payments on long-term borrowings |
(600.0 | ) | (436.8 | ) | ||||
| Payments of obligations under capital leases |
(58.3 | ) | (12.5 | ) | ||||
| Payments for debt financing costs |
(23.6 | ) | (27.9 | ) | ||||
| Proceeds from members’ investment |
21.6 | — | ||||||
| Other |
(2.3 | ) | — | |||||
|
|
|
|
|
|||||
| Net cash (used in) provided by financing activities |
(622.6 | ) | 1,249.7 | |||||
|
|
|
|
|
|||||
| Net (decrease) increase in cash and cash equivalents |
(348.1 | ) | 651.5 | |||||
| Cash and cash equivalents at beginning of period |
1,125.8 | 307.0 | ||||||
|
|
|
|
|
|||||
| Cash and cash equivalents at end of period |
$ | 777.7 | $ | 958.5 | ||||
|
|
|
|
|
|||||
| (1) | See Appraisal of Safeway Inc. in Note 9—Commitments and contingencies and off balance sheet arrangements. |
The accompanying notes are an integral part of these Condensed Consolidated Financial Statements.
F-10
Table of Contents
AB ACQUISITION LLC AND SUBSIDIARIES
Notes to Condensed Consolidated Financial Statements (unaudited)
NOTE 1—DESCRIPTION OF BUSINESS, BASIS OF PRESENTATION AND SUMMARY OF SIGNIFICANT ACCOUNTING POLICIES
Basis of Presentation
The accompanying interim Condensed Consolidated Financial Statements include the accounts of AB Acquisition LLC and subsidiaries (“AB Acquisition” or the “Company”). All significant intercompany balances and transactions were eliminated. The Condensed Consolidated Balance Sheet as of February 28, 2015 is derived from the Company’s annual audited Consolidated Financial Statements for the fiscal year ended February 28, 2015, which should be read in conjunction with these Condensed Consolidated Financial Statements. Certain information in footnote disclosures normally included in annual financial statements was condensed or omitted for the interim periods presented in accordance with accounting principles generally accepted in the United States of America (“GAAP”). In the opinion of management, the interim data includes all adjustments, consisting of normal recurring adjustments, necessary for a fair statement of the results for the interim periods. The interim results of operations and cash flows are not necessarily indicative of those results and cash flows expected for the year. The Company’s results of operations are for the 28 weeks ended September 12, 2015 and September 4, 2014.
A&P Transaction
On July 19, 2015, the Company entered into an asset purchase agreement, pursuant to which our wholly owned subsidiary, Acme Markets, Inc. (“Acme Markets”) agreed to acquire 76 stores operated by A&P pursuant to Section 363 of Chapter 11 of the United States Bankruptcy Code (“A&P Transaction”). The Company has exercised its right to exclude certain stores from our purchase, and, as a result, will purchase 71 stores. The purchase price for the 71 stores is approximately $319 million, including the cost of acquired inventory. The acquired stores, which are principally located in the northern New York City suburbs, northern New Jersey and the greater Philadelphia area, are complementary to Acme Markets’ existing store and distribution base and will be re-bannered as Acme stores. The Company funded an initial deposit of approximately $63.9 million into an escrow account on July 20, 2015 and will fund the balance of the purchase price with proceeds from the issuance of long-term debt. The A&P Transaction received approval from the United States Bankruptcy Court for the Southern District of New York on September 21, 2015, and the waiting period under the Hart-Scott-Rodino Antitrust Improvements Act terminated on September 15, 2015. The Company commenced the acquisition of the stores on a staggered basis on September 29, 2015 and expects to complete the acquisition of the remaining A&P stores during the third quarter of fiscal 2015. On November 10, 2015, the Company entered into an amendment to the NAI Term Loan Agreement and borrowed an additional $300 million to fund the A&P Transaction.
Significant Accounting Policies
Restricted cash: Restricted cash primarily relates to collateralized surety bonds, cash held in escrow and letters of credit. During the 28 weeks ended September 12, 2015, the majority of the collateral requirements were eliminated which resulted in a $255.7 million reduction in restricted cash, which was offset by an increase of $63.9 million of cash held in escrow for the A&P Transaction. The Company had $78.4 million and $270.2 million of restricted cash as of September 12, 2015 and February 28, 2015, respectively, which is included in Other assets, within the Condensed Consolidated Balance Sheets.
Inventories, net: Substantially all of the Company’s inventories consist of finished goods valued at the lower of cost or market and net of vendor allowances.
| F-11 | (Continued) |
Table of Contents
AB ACQUISITION LLC AND SUBSIDIARIES
Notes to Condensed Consolidated Financial Statements (unaudited)
The Company uses either item-cost or the retail inventory method to value discrete inventory items at lower of cost or market before application of any last-in, first-out (“LIFO”) reserve. Interim LIFO inventory costs are based on management’s estimates of expected year-end inventory levels and inflation rates. LIFO expense was $10.8 million and $18.7 million for the 28 weeks ended September 12, 2015 and September 4, 2014, respectively.
Company-owned life insurance policies (“COLI”): The Company has COLI policies that have a cash surrender value. The Company has loans against these policies and has no intention of repaying the loans prior to maturity or cancellation of the policies. Therefore, the Company offsets the cash surrender value by the related loans. As of September 12, 2015 and February 28, 2015, the cash surrender values of the policies were $195.9 million and $194.7 million, respectively, and the balance of the policy loans were $121.5 million and $120.0 million, respectively. The net balance of the COLI policies is included in Other assets.
Segments: The Company and its subsidiaries operate food and drug retail stores that offer grocery products, general merchandise, health and beauty care products, pharmacy, fuel and other items and services. The Company’s retail operating divisions are geographically based, have similar economic characteristics and similar expected long-term financial performance and are reported in one reportable segment. The Company’s operating segments and reporting units are its 14 divisions, which have been aggregated into one reportable segment. Each reporting unit constitutes a business for which discrete financial information is available and for which management regularly reviews the operating results. Across all divisions, the Company operates primarily one store format. Each store offers the same general mix of products with similar pricing to similar categories of customers, has similar distribution methods, operates in similar regulatory environments and purchases merchandise from similar or the same vendors. Except for an equity method investment in Casa Ley, S.A. de C.V. (“Casa Ley”), all of the Company’s retail operations are domestic.
The following table represents sales revenue by type of similar product (dollars in millions):
| 28 weeks ended | ||||||||||||||||
| September 12, 2015 | September 4, 2014 | |||||||||||||||
| Amount | % of Total | Amount | % of Total | |||||||||||||
| Non-perishables(1) |
$ | 13,950.0 | 44.3 | % | $ | 6,131.9 | 47.8 | % | ||||||||
| Perishables(2) |
12,653.7 | 40.2 | % | 5,223.1 | 40.7 | % | ||||||||||
| Pharmacy |
2,679.3 | 8.5 | % | 1,234.8 | 9.6 | % | ||||||||||
| Fuel |
1,798.9 | 5.7 | % | 115.0 | 0.9 | % | ||||||||||
| Other(3) |
407.0 | 1.3 | % | 116.8 | 1.0 | % | ||||||||||
|
|
|
|
|
|
|
|
|
|||||||||
| Net sales and other revenue |
$ | 31,488.9 | 100.0 | % | $ | 12,821.6 | 100.0 | % | ||||||||
|
|
|
|
|
|
|
|
|
|||||||||
| (1) | Consists primarily of general merchandise, grocery and frozen foods. |
| (2) | Consists primarily of produce, dairy, meat, deli, floral and seafood. |
| (3) | Consists primarily of lottery and various other commissions and other miscellaneous income. |
Recently adopted accounting standard: In April 2015, the Financial Accounting Standards Board (“FASB”) issued Accounting Standards Update (“ASU”) 2015-03, “Interest—Imputation of Interest (Subtopic 835-30): Simplifying the Presentation of Debt Issuance Costs.” The objective of this ASU is to simplify the presentation of debt issuance costs by requiring that debt issuance costs related to a recognized debt liability be presented in the balance sheet as a direct deduction from the carrying amount of that debt liability, consistent with debt discounts. This ASU is effective for financial
| F-12 | (Continued) |
Table of Contents
AB ACQUISITION LLC AND SUBSIDIARIES
Notes to Condensed Consolidated Financial Statements (unaudited)
statements issued for fiscal years beginning after December 15, 2015 for publicly traded companies and interim periods within those fiscal years. Early adoption is permitted for financial statements that have not been previously issued. The Company adopted ASU 2015-03 on March 1, 2015. As a result of the adoption, the Company reclassified unamortized debt issuance costs, except such costs related to the Company’s asset-based loans, from Other assets to a reduction in Long-term debt, for all periods presented. The adoption did not have an impact on the Company’s Condensed Consolidated Statement of Operations or the Condensed Consolidated Statement of Cash Flows.
Recently issued accounting standards: In May 2014, the FASB issued authoritative guidance through ASU 2014-09, “Revenue from Contracts with Customers” (Topic 606). The core principle of the guidance is that an entity should recognize revenue to depict the transfer of promised goods or services to customers in an amount that reflects the consideration to which the entity expects to be entitled in exchange for those goods or services. To achieve that core principle, an entity should apply the following steps: 1) Identify the contract(s) with a customer, 2) Identify the performance obligations in the contract, 3) Determine the transaction price, 4) Allocate the transaction price to the performance obligations in the contract, and 5) Recognize revenue when (or as) the entity satisfies a performance obligation. For public entities, this pronouncement is effective for annual reporting periods beginning after December 15, 2017. Per ASU 2015-14, “Revenue from Contracts with Customers (Topic 606)—Deferral of the Effective Date”, early application is permitted only as of annual reporting periods beginning after December 15, 2016, including interim periods within that reporting period. The Company is currently evaluating the impact of this pronouncement.
In July 2015, the FASB issued ASU 2015-11, “Inventory (Topic 330): Simplifying the Measurement of Inventory.” Topic 330, Inventory, currently requires an entity to measure inventory at the lower of cost or market. Market could be replacement cost, net realizable value or net realizable value less an approximately normal profit margin. This amendment updates Topic 330 to require an entity to measure inventory at the lower of cost and net realizable value. Net realizable value is the estimated selling price in the ordinary course of business, less reasonably predictable costs of completion, disposal and transportation. Subsequent measurement is unchanged for inventory measured using LIFO or the retail inventory method. This update is effective for fiscal years beginning after December 15, 2016, including interim periods within those fiscal years. The Company is currently evaluating the impact of this pronouncement.
In July 2015, the FASB also issued ASU 2015-12, “Plan Accounting: Defined Benefit Pension Plans (Topic 960); Defined Contribution Benefit Plans (Topic 962); and Health and Welfare Benefit Plans (Topic 965)”, a three-part update with the objective of simplifying benefit plan reporting to make the information presented more useful to the reader. All three parts are effective for fiscal years beginning after December 15, 2015. The Company is currently evaluating the impact of this pronouncement.
NOTE 2—PROPERTIES HELD FOR SALE
On December 19, 2014, in connection with the acquisition of Safeway Inc. (“Safeway”, “the Safeway acquisition”), the Company announced that it had entered into agreements to sell 111 Albertson’s Holdings LLC (“Albertson’s”) and 57 Safeway stores across eight states to four separate buyers. Divestiture of these stores was required by the Federal Trade Commission (“FTC”) as a condition of closing the Safeway acquisition and was contingent upon the completion of the Safeway acquisition. The divestiture of these stores commenced upon completion of the Safeway acquisition and was completed in the first quarter of fiscal 2015 in accordance with the asset purchase
| F-13 | (Continued) |
Table of Contents
AB ACQUISITION LLC AND SUBSIDIARIES
Notes to Condensed Consolidated Financial Statements (unaudited)
agreements. The aggregate sales price from these stores was $525.8 million, including the book value of inventory. The proceeds from the sale were used to reduce outstanding borrowings under the Albertson’s Asset-Based Loan Facility (“ABL”) and the Albertson’s term loans.
On June 29, 2015, counsel for Haggen Holdings, LLC (“Haggen”) delivered a notice of claims to the Company asserting that it had committed fraud and breached the Asset Purchase Agreement under which Haggen purchased 146 of the divested stores. Haggen withheld payment of approximately $41.1 million due for purchased inventory on the basis of these allegations. On September 8, 2015, Haggen filed a petition for protection under Chapter 11 of the U.S. Bankruptcy Code. Consequently, the Company recorded an additional loss of $41.1 million on the disposition of the properties sold to Haggen during the 12 weeks ended September 12, 2015.
The sale of all the divested stores occurred in the first quarter of fiscal 2015. Revenue and income before taxes associated with the divested Albertson’s stores for the 16 weeks ended June 20, 2015 were $298.8 million and $14.9 million, respectively. Revenue and income before taxes associated with the divested Safeway stores for the 16 weeks ended June 20, 2015 were $145.7 million and $8.2 million, respectively.
Assets held for sale and liabilities held for sale are recorded in Other current assets and Other current liabilities, respectively, and consisted of the following (in millions):
| September 12, 2015 | February 28, 2015 | |||||||
| Assets held for sale: |
||||||||
| Beginning balance |
$ | 521.2 | $ | 9.3 | ||||
| Transfers in |
1.3 | 558.1 | ||||||
| Disposals |
(515.1 | ) | (46.2 | ) | ||||
|
|
|
|
|
|||||
| Total assets held for sale |
$ | 7.4 | $ | 521.2 | ||||
|
|
|
|
|
|||||
| Liabilities held for sale: |
||||||||
| Beginning balance |
$ | 90.4 | $ | 2.1 | ||||
| Transfers in |
— | 103.2 | ||||||
| Disposals |
(67.2 | ) | (14.9 | ) | ||||
|
|
|
|
|
|||||
| Total liabilities held for sale |
$ | 23.2 | $ | 90.4 | ||||
|
|
|
|
|
|||||
NOTE 3—FAIR VALUE MEASUREMENTS
The accounting guidance for fair value established a framework for measuring fair value and established a three-level valuation hierarchy for disclosure of fair value measurement. The valuation hierarchy is based upon the transparency of inputs to the valuation of an asset or liability at the measurement date. The three levels are defined as follows:
| Level 1— | Quoted prices in active markets for identical assets or liabilities; | |
| Level 2— | Inputs other than quoted prices included within Level 1 that are either directly or indirectly observable; | |
| Level 3— | Unobservable inputs in which little or no market activity exists, requiring an entity to develop its own assumptions that market participants would use to value the asset or liability. | |
Fair value is defined as the price that would be received to sell an asset or paid to transfer a liability in an orderly transaction between market participants at the measurement date.
| F-14 | (Continued) |
Table of Contents
AB ACQUISITION LLC AND SUBSIDIARIES
Notes to Condensed Consolidated Financial Statements (unaudited)
The following table presents assets and liabilities which were measured at fair value on a recurring basis as of September 12, 2015 (in millions):
| Fair Value Measurements | ||||||||||||||||
| Total | Quoted prices in active markets for identical assets (Level 1) |
Significant observable inputs (Level 2) |
Significant unobservable inputs (Level 3) |
|||||||||||||
| Assets: |
||||||||||||||||
| Cash equivalents: |
||||||||||||||||
| Money market |
$ | 152.0 | $ | 152.0 | $ | — | $ | — | ||||||||
| Short-term investments(1) |
20.1 | 16.6 | 3.5 | — | ||||||||||||
| Non-current investments(2) |
60.1 | 9.6 | 50.5 | — | ||||||||||||
|
|
|
|
|
|
|
|
|
|||||||||
| Total |
$ | 232.2 | $ | 178.2 | $ | 54.0 | $ | — | ||||||||
|
|
|
|
|
|
|
|
|
|||||||||
| Liabilities: |
||||||||||||||||
| Derivative contracts(3) |
$ | 147.7 | $ | — | $ | 147.7 | $ | — | ||||||||
| Contingent consideration(4) |
266.1 | — | — | 266.1 | ||||||||||||
|
|
|
|
|
|
|
|
|
|||||||||
| Total |
$ | 413.8 | $ | — | $ | 147.7 | $ | 266.1 | ||||||||
|
|
|
|
|
|
|
|
|
|||||||||
| (1) | Primarily relates to Money Market and other Mutual Funds. Included in Other current assets on the Condensed Consolidated Balance Sheets. |
| (2) | Primarily relates to U.S. Treasury Notes and Corporate Bonds held by the Company’s wholly owned captive insurance companies. Included in Other assets on the Condensed Consolidated Balance Sheets. |
| (3) | Primarily relates to interest rate swaps and is included in Other current liabilities on the Condensed Consolidated Balance Sheets. |
| (4) | Primarily relates to Casa Ley CVR and is included in Other long-term liabilities on the Condensed Consolidated Balance Sheets. |
The following table presents assets and liabilities which were measured at fair value on a recurring basis as of February 28, 2015 (in millions):
| Fair Value Measurements | ||||||||||||||||
| Total | Quoted prices in active markets for identical assets (Level 1) |
Significant observable inputs (Level 2) |
Significant unobservable inputs (Level 3) |
|||||||||||||
| Assets: |
||||||||||||||||
| Cash equivalents: |
||||||||||||||||
| Money market |
$ | 565.0 | $ | 565.0 | $ | — | $ | — | ||||||||
| Short-term investments(1) |
24.1 | 17.1 | 7.0 | — | ||||||||||||
| Non-current investments(2) |
55.3 | 8.4 | 46.9 | — | ||||||||||||
|
|
|
|
|
|
|
|
|
|||||||||
| Total |
$ | 644.4 | $ | 590.5 | $ | 53.9 | $ | — | ||||||||
|
|
|
|
|
|
|
|
|
|||||||||
| Liabilities: |
||||||||||||||||
| Derivative contracts(3) |
$ | 121.7 | $ | — | $ | 121.7 | $ | — | ||||||||
| Contingent consideration(4) |
270.9 | — | — | 270.9 | ||||||||||||
|
|
|
|
|
|
|
|
|
|||||||||
| Total |
$ | 392.6 | $ | — | $ | 121.7 | $ | 270.9 | ||||||||
|
|
|
|
|
|
|
|
|
|||||||||
| F-15 | (Continued) |
Table of Contents
AB ACQUISITION LLC AND SUBSIDIARIES
Notes to Condensed Consolidated Financial Statements (unaudited)
| (1) | Primarily relates to Money Market and other Mutual Funds. Included in Other current assets on the Condensed Consolidated Balance Sheets. |
| (2) | Primarily relates to U.S. Treasury Notes and Corporate Bonds held by the Company’s wholly owned captive insurance companies. Included in Other assets on the Condensed Consolidated Balance Sheets. |
| (3) | Primarily relates to interest rate swaps and is included in Other current liabilities on the Condensed Consolidated Balance Sheets. |
| (4) | Primarily relates to Casa Ley CVR and is included in Other long-term liabilities on the Condensed Consolidated Balance Sheets. |
A reconciliation of the beginning and ending balances for Level 3 liabilities for the 28 weeks ended September 12, 2015 follows (in millions):
| Contingent consideration |
||||
| Beginning balance |
$ | 270.9 | ||
| Changes in fair value |
(2.7 | ) | ||
| Payments |
(2.1 | ) | ||
|
|
|
|||
| Ending balance |
$ | 266.1 | ||
|
|
|
|||
The estimated fair value of the Company’s debt, including current maturities, were based on Level 2 inputs, being market quotes or values for similar instruments, and interest rates currently available to the Company for the issuance of debt with similar terms and remaining maturities as a discount rate for the remaining principal payments. As of September 12, 2015 and February 28, 2015, the fair value of total debt was $11,532.8 million and $12,095.2 million compared to the carrying value of $11,012.8 million and $11,594.3 million, respectively.
Assets Measured at Fair Value on a Nonrecurring Basis
As of September 12, 2015 and February 28, 2015, except for assets classified as held for sale, no other material amounts of assets had been adjusted to fair value on a non-recurring basis. The Company’s held for sale assets are classified as Level 3 of the fair value hierarchy and are valued primarily based on estimated selling prices less costs of disposal.
| F-16 | (Continued) |
Table of Contents
AB ACQUISITION LLC AND SUBSIDIARIES
Notes to Condensed Consolidated Financial Statements (unaudited)
NOTE 4—LONG-TERM DEBT AND CAPITALIZED LEASE OBLIGATIONS
The Company’s long-term debt as of September 12, 2015 and February 28, 2015, net of unamortized debt discounts of $354.2 million and $376.4 million, respectively, and deferred financing costs of $192.1 million and $187.8 million, respectively, consisted of the following (in millions):
| September 12, 2015 |
February 28, 2015 |
|||||||
| Albertson’s Term Loans, Due 2019 to 2021, interest range of 4.75% to 5.5% |
$ | 6,023.0 | $ | 6,077.0 | ||||
| Albertson’s Asset-Based Loan Facility, average interest rate of 1.94% |
481.0 | 980.0 | ||||||
| NAI 4.75% Senior Secured Term Loan Due 2021 |
819.7 | 822.9 | ||||||
| NAI 7.45% Debentures Due 2029 |
537.2 | 530.3 | ||||||
| Albertson’s 7.75% Senior Secured Notes Due 2022 |
583.5 | 583.6 | ||||||
| Safeway 7.25% Debentures Due 2031 |
574.3 | 573.8 | ||||||
| NAI 8.00% Debentures Due 2031 |
349.6 | 346.5 | ||||||
| NAI 6.47% to 7.15% Medium Term Notes Due 2017—2028 |
248.1 | 244.1 | ||||||
| Safeway 5.0% Senior Notes Due 2019 |
270.9 | 271.2 | ||||||
| NAI 8.70% Debentures Due 2030 |
205.9 | 204.6 | ||||||
| NAI 7.75% Debentures Due 2026 |
168.4 | 166.1 | ||||||
| Safeway 7.45% Senior Debentures Due 2027 |
152.9 | 153.0 | ||||||
| Safeway 3.95% Senior Notes Due 2020 |
138.0 | 138.2 | ||||||
| Safeway 4.75% Senior Notes Due 2021 |
131.2 | 131.3 | ||||||
| Safeway 6.35% Notes Due 2017 |
105.3 | 106.8 | ||||||
| Safeway 3.4% Senior Notes Due 2016 |
80.0 | 79.9 | ||||||
| American Stores 8.00% Debentures Due 2026 |
3.5 | 3.6 | ||||||
| American Stores 7.90% Debentures Due 2017 |
1.8 | 1.9 | ||||||
| Other Notes Payable, Unsecured |
114.9 | 155.1 | ||||||
| Mortgage Notes Payable, Secured |
23.6 | 24.4 | ||||||
|
|
|
|
|
|||||
| Total debt |
11,012.8 | 11,594.3 | ||||||
| Less current maturities |
(86.9 | ) | (502.9 | ) | ||||
|
|
|
|
|
|||||
| Long-term portion |
$ | 10,925.9 | $ | 11,091.4 | ||||
|
|
|
|
|
|||||
The Albertson’s and New Albertson’s, Inc. (“NAI”) Term Loans, Albertson’s and NAI ABL facilities and certain of the outstanding notes and debentures have restrictive covenants, subject to the right to cure in certain circumstances, calling for the acceleration of payments due in the event of a breach of a covenant or a default in the payment of a specified amount of indebtedness due under certain debt arrangements. The Company was in compliance with all such covenants and provisions as of and for the 28 weeks ended September 12, 2015.
NAI Term Loan: On November 10, 2015, the Company increased the borrowings under the NAI Senior Secured Term Loan by approximately $300.0 million at a rate of 3.75% plus LIBOR subject to a floor of 1%. The proceeds from these borrowings will be used to fund the A&P Transaction during the third fiscal quarter.
Albertson’s ABL: Borrowings outstanding under the Albertson’s ABL as of September 12, 2015 consisted of loans of $481.0 million and letters of credit (“LOC”) issued under the LOC sub-facility of $143.1 million. Borrowings outstanding under the Albertson’s ABL as of February 28, 2015 consisted of loans of $980.0 million and letters of credit issued under the LOC sub-facility of $272.1 million.
| F-17 | (Continued) |
Table of Contents
AB ACQUISITION LLC AND SUBSIDIARIES
Notes to Condensed Consolidated Financial Statements (unaudited)
NAI ABL: The NAI ABL had no outstanding loan borrowings as of September 12, 2015 or February 28, 2015. The NAI ABL LOC sub-facility had outstanding issued letters of credit of $494.1 million and $418.7 million as of September 12, 2015 and February 28, 2015, respectively.
The NAI LOC facility had no outstanding issued letters of credit as of September 12, 2015 and $104.6 million outstanding issued letters of credit as of February 28, 2015.
The Albertson’s ABL contains no covenants unless and until (i) an event of default under the Albertson’s ABL has occurred and is continuing or (ii) the failure of Albertson’s to maintain excess availability of at least 10.0% of the aggregate commitments at any time or (iii) excess availability is less than $200 million. If any of such events occur, then Albertson’s is required to maintain a fixed charge coverage ratio of 1.0 to 1.0 until such event of default is cured or waived or the 30th day after the other trigger event ceases to exist.
The NAI ABL contains no covenants unless and until (i) an event of default under the NAI ABL has occurred and is continuing or (ii) the failure of NAI to maintain excess availability of at least 10.0% of the aggregate commitments at any time. If any of such events occur, NAI is required to maintain a fixed charge coverage ratio of 1.0 to 1.0 until such event of default is cured or waived or the 30th day after the other trigger event ceases to exist.
The financial covenants related to the ABLs were not applicable during the 28 weeks ended September 12, 2015.
Capitalized Lease Obligations
The Company’s total capitalized lease obligations were $964.1 million and $974.7 million as of September 12, 2015 and February 28, 2015, respectively. Current maturities of capitalized lease obligations were $94.1 million and $121.1 million and long-term maturities were $870.0 million and $853.6 million as of September 12, 2015 and February 28, 2015, respectively.
NOTE 5—EQUITY-BASED COMPENSATION
Phantom Units
During the 28 weeks ended September 12, 2015, the Company issued 11.6 million Phantom Units to its employees and directors, of which 7.3 million Phantom Units were granted. Fifty percent of the Phantom Units are time-based and will vest in four annual installments on the last day of the Company’s fiscal year, commencing with the last day of the fiscal year in which the Phantom Units are granted, subject to continued service through each vesting date. The remaining fifty percent of the Phantom Units are performance-based units that will vest in four annual installments on the last day of the Company’s fiscal year, commencing with the last day of the fiscal year in which the Phantom Units are granted, subject to continued service through each vesting date, and the achievement of annual performance targets. Notwithstanding the foregoing, one director received a grant of Phantom Units that will vest 100% on the last day of fiscal year 2015 subject to the director’s continued service through such vesting date, or earlier upon the director’s death or termination without cause.
Under the Phantom Unit Plan, each Phantom Unit provides the participant with a contractual right to receive, upon vesting, one incentive unit. Holders of the incentive units are entitled to participate in cash distributions of Albertson’s, NAI and Safeway based on their respective ownership percentages of the aggregate Albertson’s, NAI and Safeway units, vested Series-1 Incentive Units, Investor Incentive
| F-18 | (Continued) |
Table of Contents
AB ACQUISITION LLC AND SUBSIDIARIES
Notes to Condensed Consolidated Financial Statements (unaudited)
Units and vested Phantom Units outstanding. Distributions are on a subordinate basis to the $2,308.6 million aggregate distributions to Albertson’s, NAI and Safeway unitholders; after which they participate on a pro rata basis. The Phantom Units contain no voting rights.
For the Phantom Units subject solely to a service condition, the estimated total fair value is charged to compensation expense on a straight-line basis over the requisite service period. For the Phantom Units subject to a performance condition, compensation cost will be recognized based on the estimated quantity of awards for which it is probable that the performance conditions will be achieved. All performance-based Phantom Units that have not vested as of the fiscal year commencing in 2018 shall terminate. Upon the consummation of an IPO, the unvested Phantom Units subject to performance conditions are converted into Phantom Units subject solely to a continuation of service condition.
Member Loans to Employees
Upon termination of the Company’s long-term incentive plans in fiscal 2014, nine employees were entitled to the right to receive a loan from the Company to purchase additional ABS and NAI units. These employees took loans of $21.6 million to purchase an additional 2.8 million units. Eight of the nine loans were repaid in full on July 2, 2015 from the proceeds of loans provided to the employees by Goldman Sachs Bank USA and collateralized by a pledge of the equity owned by these employees. On August 27, 2015, the one remaining loan was repaid by the former employee who retired subsequent to the initial purchase of the units with the loan. The loans were treated as non-recourse for accounting purposes and treated as equity based compensation. Upon repayment of the loans, the related units were recorded as an issuance of Members’ equity and became outstanding units in the Tracking group, and were included in basic Earnings Per Unit for the Tracking group.
Series-1 Incentive Units
On April 9, 2015, the Company and a member of management entered into a consultancy agreement that outlined a transition of roles from an employee executive position to a non-employee consulting position. As part of this transition, the Company and the former employee agreed that 1.675 million of the previously granted Series-1 Incentive Units would be immediately forfeited; however, the former employee would still be entitled to receive and vest in the remaining 1.675 million of previously granted units, subject to the ongoing performance of a specific set of outlined consulting services through January 30, 2016. As of April 9, 2015, the Company had recognized a cumulative amount of $2.2 million in compensation expense associated with the original January 30, 2015 Series 1 Incentive Unit grant.
The Company has accounted for the April 2015 consulting arrangement transition as a modification to the originally granted award of 3.3 million Series-1 Incentive Units. 1.675 million Series-1 Incentive Units, or the newly agreed upon maximum number of shares to be received by the former employee, were valued as of April 9, 2015 at a per unit price of $23.76, or a total award value of $39.8 million. As a result of this modification, the Company recorded a total charge of $37.6 million during the 16 weeks ended June 20, 2015, representing the entire fair value of 1.675 million Series-1 Incentive Units on the modification date less cumulative amounts previously recognized as compensation expense prior to the modification. As of September 12, 2015, there is no amount of unrecognized compensation expense associated with previously granted Series-1 Incentive Units.
| F-19 | (Continued) |
Table of Contents
AB ACQUISITION LLC AND SUBSIDIARIES
Notes to Condensed Consolidated Financial Statements (unaudited)
Equity Based Compensation Expense
Equity-based compensation expense was $67.8 million and $3.6 million for the 28 weeks ended September 12, 2015 and September 4, 2014, respectively. The Company recorded a tax benefit of $6.3 million related to equity-based compensation for the 28 weeks ended September 12, 2015. No tax benefit was recorded for the 28 weeks ended September 4, 2014.
The weighted-average assumptions used to value the Company’s equity-based awards are as follows:
| 28 weeks ended September 12, 2015 |
||||
| Dividend yield |
—% | |||
| Expected volatility |
41.7% | |||
| Risk-free interest rate |
0.6% | |||
| Time to liquidity |
1.9 years | |||
| Discount for lack of marketability |
16.0% | |||
NOTE 6—NET LOSS PER UNIT
The following table sets forth the computation of basic and diluted net loss per Tracking group unit and per Residual group unit (in millions):
| 28 weeks ended | ||||||||
| September 12, 2015 |
September 4, 2014 |
|||||||
| Net loss |
$ | (323.0 | ) | $ | (186.7 | ) | ||
| Less: undistributed loss available to Tracking group up to Distribution Targets |
(323.0 | ) | (186.7 | ) | ||||
|
|
|
|
|
|||||
| Net loss from continuing operations available to Tracking group and Residual group unitholders |
$ | — | $ | — | ||||
|
|
|
|
|
|||||
| Net loss and distributions attributable to: |
||||||||
| Tracking group unitholders—basic |
$ | (323.0 | ) | $ | (186.7 | ) | ||
| Residual group unitholders—basic |
— | — | ||||||
| Tracking group unitholders—diluted |
(323.0 | ) | (186.7 | ) | ||||
| Residual group unitholders—diluted |
— | — | ||||||
| Weighted average Tracking group units outstanding used in computing net loss attributable to Tracking group unitholders—basic and diluted |
298.22 | 127.80 | ||||||
| Weighted average Residual group units outstanding used in computing net loss attributable to Residual group unitholders—basic |
14.91 | 0.75 | ||||||
| Net loss per unit attributable to: |
||||||||
| Tracking group—basic |
$ | (1.08 | ) | $ | (1.46 | ) | ||
| Residual group—basic |
— | — | ||||||
| Tracking group—diluted |
(1.08 | ) | (1.46 | ) | ||||
| Residual group—diluted |
— | — | ||||||
For the 28 weeks ended September 12, 2015, 1.8 million units for the Tracking group, and 9.0 million units for the Residual group have been excluded from diluted weighted-average units outstanding because their inclusion would be anti-dilutive. The units excluded for the Tracking group represent the units collateralizing the loans to members. For the 28 weeks ended September 4, 2014, 1.9 million units for the Residual group have been excluded from diluted weighted-average units outstanding because their inclusion would be anti-dilutive.
| F-20 | (Continued) |
Table of Contents
AB ACQUISITION LLC AND SUBSIDIARIES
Notes to Condensed Consolidated Financial Statements (unaudited)
NOTE 7—EMPLOYEE BENEFIT PLANS
Pension Plans
The Company sponsors a defined benefit pension plan (the “Shaw’s Plan”) covering union employees under the Shaw’s banner. The Company also sponsors a defined benefit pension plan (the “Safeway Plan”) for substantially all of its employees under the Safeway banners not participating in multiemployer pension plans. The Company also sponsors a frozen plan covering certain employees under the United banner and a Retirement Restoration Plan that provides death benefits and supplemental income payments for certain senior executives after retirement. The Retirement Restoration Plan is unfunded. The Safeway Plan and the Retirement Restoration Plan were acquired as part of the Safeway acquisition in fiscal 2014.
The Company also contributes to various multi-employer pension plans based on obligations arising from most of its collective bargaining agreements. These plans provide retirement benefits to participants based on their service to contributing employers. The Company recognizes expense in connection with these plans as contributions are funded.
Other Post-Retirement Benefits
In addition to the Company’s pension plans, the Company acquired plans as part of the Safeway acquisition that provide post-retirement medical and life insurance benefits to certain employees. Retirees share a portion of the cost of the post-retirement medical plans. The Company pays all the cost of the life insurance plans. The plans are unfunded.
The following tables provide the components of net pension and post-retirement expense (in millions):
| Pension | Other post- retirement benefits |
|||||||||||
| 28 weeks ended September 12, 2015 |
28 weeks ended September 4, 2014 |
28 weeks ended September 12, 2015 |
||||||||||
| Estimated return on plan assets |
$ | (75.3 | ) | $ | (9.0 | ) | $ | — | ||||
| Service cost |
30.7 | 5.0 | — | |||||||||
| Interest cost |
54.6 | 8.0 | 0.3 | |||||||||
|
|
|
|
|
|
|
|||||||
| Net expense |
$ | 10.0 | $ | 4.0 | $ | 0.3 | ||||||
|
|
|
|
|
|
|
|||||||
The Company contributed $4.0 million to its defined benefit pension plans and post-retirement benefit plans during the 28 weeks ended September 12, 2015. For the 28 weeks ended September 4, 2014, the Company contributed $11.6 million to its defined benefit pension plan. For the remainder of fiscal 2015, the Company currently anticipates contributing an additional $3.9 million to these plans.
Defined Contribution Plans and Supplemental Retirement Plans
For the 28 weeks ended September 12, 2015 and September 4, 2014, total contributions were $20.5 million and $20.6 million, respectively.
| F-21 | (Continued) |
Table of Contents
AB ACQUISITION LLC AND SUBSIDIARIES
Notes to Condensed Consolidated Financial Statements (unaudited)
NOTE 8—RELATED PARTIES
Symphony Investors LLC Tender Offer
On March 21, 2013, associated with the NAI acquisition, Symphony Investors LLC (“Symphony”), which is owned by a consortium of investors led by Cerberus Capital Management, L.P. (“Cerberus”), acquired 21.1% of SUPERVALU INC. (“SuperValu”) common shares. On April 23, 2015, Symphony distributed all of the SuperValu common shares held by it to the members of Symphony. As of April 23, 2015, Symphony did not own any SuperValu common shares.
Contractual Agreements with SuperValu
On April 16, 2015, the Company entered into a letter agreement regarding the Transition Service Agreement (“TSA”) with SuperValu (the “TSA Letter Agreement”) pursuant to which SuperValu will provide services to the Company as needed to transition and wind down the TSA and the services SuperValu provides under the TSA. In exchange for these transition and wind down services, the agreement calls for eight payments of $6.3 million every six months for aggregate fees of $50.0 million. These payments are separate from and incremental to the fixed and variable fees the Company pays to SuperValu under the TSA. The parties also agreed to negotiate in good faith if either the costs associated with the transition and wind down services are materially higher (i.e. 5.0% or more) than anticipated, or SuperValu is not performing in all material respects the transition and wind down services as needed to support the Company’s transition and wind down activities.
On May 28, 2015, the Company reached an agreement with SuperValu to resolve certain matters. As part of the agreement, SuperValu paid the Company $34.5 million. The Company recorded the payment as a deferred liability and is amortizing it as a reduction of expense over four years.
On September 8, 2015, the Company exercised its right to renew the term of the TSA with SuperValu for an additional year. The original TSA had an initial term expiring on September 21, 2015 and included 10 options for additional one-year renewals with notice given to SuperValu at least 12 months prior to the expiration of the then current term. The renewal extends the TSA through September 21, 2017.
Summary of SuperValu activity
Related party activities with SuperValu that are included in the Condensed Consolidated Statements of Operations and Comprehensive Loss consisted of the following (in millions):
| 28 weeks ended | ||||||||
| September 12, 2015 | September 4, 2014 | |||||||
| Supply agreements included in Cost of sales |
$ | 711.9 | $ | 758.1 | ||||
| Selling and administrative expenses |
112.0 | 112.7 | ||||||
|
|
|
|
|
|||||
| Total |
$ | 823.9 | $ | 870.8 | ||||
|
|
|
|
|
|||||
Cerberus
In connection with the Safeway acquisition, the original management agreement with Cerberus and the consortium of investors was terminated. A new management agreement with Cerberus and the consortium of investors commenced on January 30, 2015, requiring a management fee of $13.8 million, payable annually beginning January 30, 2015. The agreement is for four years.
| F-22 | (Continued) |
Table of Contents
AB ACQUISITION LLC AND SUBSIDIARIES
Notes to Condensed Consolidated Financial Statements (unaudited)
NOTE 9—COMMITMENTS, CONTINGENCIES AND OFF BALANCE SHEET ARRANGEMENTS
Guarantees
California Department of Industrial Relations: On October 24, 2012, the Office of Self-Insurance Plans, a program within the director’s office of the California Department of Industrial Relations (the “DIR”), notified SuperValu that additional security was required to be posted in connection with the Company’s, and certain other subsidiaries’, California self-insured workers’ compensation obligations pursuant to applicable regulations. The notice from the DIR stated that the additional security was required as a result of an increase in estimated future liabilities, as determined by the DIR pursuant to a review of the self-insured California workers’ compensation claims with respect to the applicable businesses, and a decline in SuperValu’s net worth. A security deposit of $271.0 million was demanded in addition to security of $427.0 million provided through SuperValu’s participation in California’s Self-Insurer’s Security Fund (the “Fund”). SuperValu appealed this demand. The Fund has attempted to create a secured interest in certain assets of the Company for the total amount of the additional security deposit. The dispute with the Fund and the DIR was resolved through a settlement agreement as part of the NAI acquisition on March 21, 2013, and the primary obligation to the Fund and the DIR was retained by the Company following the NAI acquisition. Subsequent to the NAI acquisition, the Company set up a fund of $75.0 million to be used for the payment of future claims. In addition, the Company provided to the DIR a $225.0 million LOC to collateralize any of the self-insurance workers’ compensation future obligations in excess of the $75.0 million fund. As of November 27, 2014, the entire fund has been used to pay claims. Prior to January 21, 2014, the California Self Insurers’ Security Fund also held mortgage liens against the Jewel real estate assets as collateral. On January 21, 2014, the Company entered into a Collateral Substitution Agreement with the California Self-Insurers’ Security Fund to provide an irrevocable LOC to replace the mortgage liens against the Jewel real estate assets and the previously issued $225.0 million LOC. The amount of the LOC is adjusted semi-annually based on annual filings of an actuarial study reflecting liabilities as of December 31 of each year reduced by claim closures and settlements. The related LOCs were $247.7 million and $338.0 million as of September 12, 2015 and February 28, 2015, respectively.
Lease Guarantees: The Company may have liability under certain operating leases that were assigned to third parties. If any of these third parties fail to perform under the leases, the Company could be responsible for the lease obligation. In connection with the FTC-mandated divestitures, the Company assigned leases with respect to 93 store properties to Haggen. On August 14, 2015, Haggen announced that it intended to close 26 stores (including 18 leased stores and one ground-leased store) that the Company sold to it and that it may close or sell additional stores in the future. On September 8, 2015, Haggen commenced a case under Chapter 11 of the U.S. Bankruptcy Code in the United States Bankruptcy Court for the District of Delaware, and on September 14, 2015, Haggen filed a motion in its bankruptcy case for an order authorizing and approving procedures for the rejection of unexpired leases (but stating that the motion did not seek to assume or reject any particular lease). On September 24, 2015, Haggen filed a motion to implement procedures to close 99 additional stores that the Company sold to it (including 56 leased stores and nine ground-leased stores) and on October 19, 2015, Haggen secured Bankruptcy Court approval of bidding procedures for the sale of 130 stores that the Company sold to it (including 72 leased stores and 11 ground leased stores), including 36 stores (including 26 leased stores) to two stalking-horse bidders. Pursuant to the bidding procedures order and following FTC and state attorneys general clearance, on November 2, 2015, we submitted binding bids to re-acquire 37 store leases, subject to higher or better bids at auction. On November 13, 2015, we submitted an asset purchase agreement to re-acquire 29 store leases for which we were determined to have submitted the highest or best bid for an aggregate purchase price of $14.3 million. At the auction, other third parties submitted bids to acquire an additional 22 store leases, and the two
| F-23 | (Continued) |
Table of Contents
AB ACQUISITION LLC AND SUBSIDIARIES
Notes to Condensed Consolidated Financial Statements (unaudited)
stalking horse bids for 36 stores were also determined to be the highest or best bids. Landlords have objected to certain of the store lease sales. Our asset purchase agreement and the other bids are subject to approval by the Bankruptcy Court. The aggregate undiscounted lease obligations under the 93 stores assigned to Haggen is approximately $286 million and $92 million for the store leases assigned to Haggen for which no bids have been submitted to date. Should Haggen reject its obligations under the assigned leases, or otherwise default on its lease obligations, the Company could be responsible for the obligations of Haggen under such leases. The Company does not know the extent to which Haggen will reject or default on its lease obligations to third parties or whether Haggen will be successful in selling these remaining store leases to third parties. The Company also does not know what defenses may be available to it, including any loss mitigation obligations of Haggen’s landlords under the terms of the leases or applicable law. As a result, the Company is currently unable to estimate losses with respect to any potential contingent liability with respect to the Haggen leases.
With respect to the remainder of the leases the Company assigned to third parties, because of the wide dispersion among third parties and the variety of remedies available, the Company believes that if an assignee became insolvent, it would not have a material effect on the Company’s financial condition, results of operations or cash flows. No liability has been recorded for assigned leases in the Company’s consolidated balance sheet related to these contingent obligations.
The Company also provides guarantees, indemnifications and assurances to others in the ordinary course of its business.
Legal Contingencies
Various claims and lawsuits arising in the normal course of business, including suits charging violations of certain wage and hour or civil rights laws, are pending against the Company. Some of these suits purport or have been determined to be class actions and/or seek substantial damages. Any damages that may be awarded in antitrust cases will be automatically trebled.
The Company continually evaluates its exposure to loss contingencies arising from pending or threatened litigation and believes it has made provisions where the loss contingency can be reasonably estimated and an adverse outcome is probable. Nonetheless, assessing and predicting the outcomes of these matters involves substantial uncertainties. Management currently believes that the aggregate range of reasonably possible loss for the Company’s exposure in excess of the amount accrued is expected to be immaterial to the Company. It remains possible that despite management’s current belief, material differences in actual outcomes or changes in management’s evaluation or predictions could arise that could have a material effect on the Company’s financial condition, results of operations or cash flows.
Haggen, et al: Subsequent to the end of the Company’s fiscal 2015 first quarter, on June 29, 2015, counsel for Haggen delivered a notice of claims to Albertson’s LLC and Albertson’s Holdings LLC asserting that those companies had committed fraud and breached the Asset Purchase Agreement under which Haggen purchased 146 divested stores by improperly transferring inventory out of purchased stores, overstocking and understocking inventory, failing to advertise in the ordinary course of business, misusing confidential information and failing to use commercially reasonable efforts to preserve existing relationships. Haggen made no specific monetary demands, but withheld payment of approximately $41.1 million due for purchased inventory at 38 stores on the basis of these allegations. On July 17, 2015, Albertson’s LLC and Albertson’s Holdings LLC commenced a lawsuit against Haggen in the Superior Court of Los Angeles County, alleging claims for breach of contract
| F-24 | (Continued) |
Table of Contents
AB ACQUISITION LLC AND SUBSIDIARIES
Notes to Condensed Consolidated Financial Statements (unaudited)
and fraud arising out of Haggen’s failure to pay the approximately $41.1 million due for the purchased inventory. On July 20, 2015, an essentially identical complaint was filed in the Superior Court of the State of Delaware in and for New Castle County. On August 26, 2015, the Company voluntarily dismissed the action it had commenced in Superior Court in Los Angeles County.
On September 1, 2015, Haggen commenced a lawsuit against Albertson’s LLC and Albertson’s Holdings LLC in the United States District Court for the District of Delaware, alleging claims for violation of Section 7 of the Clayton Act, attempted monopolization under the Sherman Act, breach of contract, indemnification, breach of implied covenant of good faith and fair dealing, fraud, unfair competition, misappropriation of trade secrets under the Uniform Trade Secrets Acts, conversion and violation of the Washington Consumer Protection Act. In the complaint, Haggen alleged that the Company, among other actions set out in the complaint, misused Haggen’s confidential information to draw customers away from Haggen stores, provided inaccurate, incomplete and misleading inventory data and pricing information on products transferred to Haggen, deliberately understocked and overstocked inventory in stores acquired by Haggen and wrongfully cut off advertising prior to the transfer of the stores to Haggen. Furthermore, Haggen alleged that, if it is destroyed as a competitor, its damages may exceed $1 billion, and asserted it is entitled to treble and punitive damages and to seek rescission of the asset purchase agreement. Haggen has further moved to transfer the lawsuit the Company commenced in Superior Court of the State of Delaware to the United States District Court for the District of Delaware. The Company’s Delaware state court case is now stayed due to Haggen’s Chapter 11 bankruptcy case. In addition, on September 17, 2015, the Company received a letter from the legal counsel of another purchaser of a small number of our FTC-mandated divested stores, alleging claims similar to those presented in Haggen’s lawsuit. The Company believes the claims asserted by Haggen and the additional purchaser are without merit and intend to vigorously defend against the claims. Based on the proceedings to date, the Company is unable to determine the probability of the outcome of this matter or the range of reasonably possible loss, if any. An unfavorable resolution of the litigation could subject the Company to significant liabilities.
On September 8, 2015, Haggen filed a petition for protection under Chapter 11 of the U.S. Bankruptcy Code. Consequently, the Company recorded an allowance of $41.1 million against the amount owed by Haggen for the purchased inventory during the second quarter ended September 12, 2015.
Appraisal of Safeway Inc.: Certain stockholders of Safeway common stock sought appraisal rights under Section 262 of the Delaware General Corporation Law, requesting a determination that the per share acquisition consideration payable in the acquisition does not represent fair value for their shares. Five separate actions have been filed in Delaware Chancery Court, now consolidated under the title In re Appraisal of Safeway Inc., by stockholders claiming to hold approximately 17.7 million shares. In May 2015, the Company settled with stockholders holding approximately 14 million shares for $621 million plus one Casa Ley contingent value right (“CVR”) for each Safeway share. The settlement consisted of $487 million ($34.92 per share) of purchase consideration and $134 million of expense, both recorded in fiscal 2014. Of the $621 million, approximately $100 million was paid in fiscal 2014, and the remainder was paid in the first quarter of 2015, including $387.2 million in acquisition consideration. Still remaining as petitioners are holders of approximately 3.74 million shares. These remaining petitioners have previously accepted a tender offer of the $34.92 per share acquisition consideration, which stops statutory interest from accruing on that amount of any recovery. A reserve for outstanding appraisal claims has been established by the Company. If the remaining petitioners are successful in the appraisal proceeding, they could be entitled to more for their stock than the per share acquisition consideration payable in the acquisition, plus statutory interest on that additional amount.
| F-25 | (Continued) |
Table of Contents
AB ACQUISITION LLC AND SUBSIDIARIES
Notes to Condensed Consolidated Financial Statements (unaudited)
Security Breach: On August 14, 2014, the Company announced that it had experienced a criminal intrusion by installation of malware on a portion of its computer network that processes payment card transactions for its retail store locations, including the Company’s Shaw’s, Star Market, Acme, Jewel-Osco and Albertsons retail banners. On September 29, 2014, the Company announced that it had experienced a second and separate criminal intrusion. The Company believes these were attempts to collect payment card data. Relying on its IT service provider, SuperValu, the Company took immediate steps to secure the affected part of the network. The Company believes that it has eradicated the malware used in each intrusion. The Company notified federal law enforcement authorities, the major payment card networks and its insurance carriers and is cooperating in their efforts to investigate these intrusions. As required by the payment card brands, the Company retained a firm to conduct a forensic investigation into the intrusions. The forensic firm has issued separate reports for each intrusion (copies of which have been provided to the card networks), with the second report issued in late September 2015. Although the Company’s network had previously been found to be compliant with PCI DSS, in both reports the forensic firm found that not all of these standards had been met, and some of this non-compliance may have contributed to or caused at least some portion of the compromise that occurred during the intrusions.
The Company believes it is probable that the payment card networks will make claims against us. These claims will likely include amounts for incremental counterfeit fraud losses and non-ordinary course operating expenses (such as card reissuance costs) that the payment card networks assert they or their issuing banks have incurred and could also include a case management assessment. If the payment card networks assert claims against us, the Company currently intends to dispute those claims and assert available defenses. At the present time, the Company believes that it is probable that the Company will incur a loss in connection with the potential claims from the payment card networks. The Company has recorded an estimated liability for probable losses that it expects to incur in connection with the potential claims to be made by the payment card networks. The estimated liability is based on information currently available to the Company and may change as new information becomes available or when the payment card networks assert their claims against us. The Company will continue to evaluate information as it becomes available and will record an estimate of additional losses, if any, when it is both probable that a loss has been incurred and the amount of the loss is reasonably estimable. Currently, the potential range of any loss above the Company’s currently recorded amount cannot be reasonably estimated given no claims have yet been asserted and because significant factual and legal issues remain unresolved. On October 20, 2015, the Company agreed with one of its third party payment administrators to provide a $15 million letter of credit to cover any claims from the payment card networks and to maintain a minimum level of card processing until the potential claims from the payment card networks are resolved.
As a result of the criminal intrusions, two class action complaints were filed against the Company by consumers and are currently pending, Mertz v. SuperValu Inc. et al. filed in federal court in the state of Minnesota and Rocke v. SuperValu Inc. et al. filed in federal court in the state of Idaho, alleging deceptive trade practices, negligence and invasion of privacy. Plaintiffs seek unspecified damages. The Judicial Panel on Multidistrict Litigation has consolidated the class actions and transferred the cases to the District of Minnesota. On August 10, 2015, the Company joined SuperValu to file a motion to dismiss the class actions, which remains pending. Based on the proceedings to date, the Company is unable to determine the probability of the outcome of this matter or the range of reasonably possible loss, if any.
On October 6, 2015, the Company received a letter from the Office of Attorney General of the Commonwealth of Pennsylvania stating that the Illinois and Pennsylvania Attorneys General Offices
| F-26 | (Continued) |
Table of Contents
AB ACQUISITION LLC AND SUBSIDIARIES
Notes to Condensed Consolidated Financial Statements (unaudited)
are leading a multi-state group that includes the Attorneys General for 14 other states requesting specified information concerning the two data breach incidents. We are in the process of providing the requested information.
Cicairos, et al. / Bluford, et al.: On August 18, 2001, a group of truck drivers from Safeway’s Tracy, California distribution center filed an action in California Superior Court, San Joaquin County entitled Cicairos, et al. v. Summit Logistics, alleging that Summit Logistics, the entity with whom Safeway contracted to operate the distribution center until August 2003, failed to provide meal periods, rest periods and itemized wage statements to the drivers in violation of California state law. Under its contract with Summit Logistics, Safeway is obligated to defend and indemnify Summit Logistics in this lawsuit. On February 6, 2007, another group of truck drivers from the Tracy distribution center filed a similar action in the same court, entitled Bluford, et al. v. Safeway Inc., alleging essentially the same claims against Safeway. Both cases were subsequently certified as class actions. After lengthy litigation in the trial and appellate courts, on February 20, 2015, the parties signed a preliminary agreement of settlement that calls for the Company to pay approximately $31 million in total. This amount consists of a settlement fund of $30.2 million, out of which will be paid relief to the class, and attorneys’ fees and costs as awarded by the court. The Company will also pay third-party settlement administrator costs, and its employer share of FICA/Medicare taxes. The motion for preliminary court approval of the settlement has been granted. Class members were notified of their right to file objections to the settlement or opt out of the settlement. No class members filed an objection or opted out by the June 15, 2015 deadline. The court approved the settlement and entered final judgment on August 4, 2015. The time period for taking an appeal of the final judgment lapsed with no appeal having been filed. Accordingly, the required settlement fund payment of $30.2 million was made on October 16, 2015. During the third quarter, the Company will pay settlement administration fees of $23,000 and its employer share FICA/Medicare taxes of approximately $1 million.
Drug Enforcement Administration: The Company has received two subpoenas from the Drug Enforcement Administration (“DEA”) concerning Safeway’s record keeping, reporting and related practices associated with the loss or theft of controlled substances. The two subpoenas have resulted in essentially a single investigation by the DEA. The Company continues to cooperate with the DEA on this matter.
Newman Development Group of Pottstown: On March 20, 2002, Safeway’s Genuardi’s subsidiary was sued by a real estate developer for breach of a lease in the Court of Common Pleas, Chester County (Pa.), in a case entitled Newman Development Group of Pottstown, LLC v. Genuardi’s Family Markets, Inc. and Safeway Inc. On December 19, 2006, the trial court entered a judgment in favor of Newman in the amount of $0.3 million. On April 25, 2008, the appellate court remanded the case to the trial court for recalculation of damages. On February 25, 2010, the trial court entered a judgment in favor of Newman in the amount of $18.5 million. Safeway appealed, and on March 18, 2011, the appellate court held that Safeway had waived its right to appeal. The Pennsylvania Supreme Court vacated this order on November 1, 2012. On July 29, 2013, an appellate court panel reversed three key elements of the trial court’s damages calculation in Safeway’s favor. On August 19, 2014, a rehearing by the appellate court en banc rejected the panel’s July 29, 2013 ruling, effectively reinstating the $18.5 million judgment. The Pennsylvania Supreme Court declined to hear Safeway’s appeal on June 24, 2015. In early July 2015, the Company paid the judgment, and the matter is concluded.
Rodman: On June 17, 2011, a customer of Safeway’s home delivery business (safeway.com) filed a class action complaint in the United States District Court for the Northern District of California entitled Rodman v. Safeway Inc., alleging that Safeway had inaccurately represented on its home
| F-27 | (Continued) |
Table of Contents
AB ACQUISITION LLC AND SUBSIDIARIES
Notes to Condensed Consolidated Financial Statements (unaudited)
delivery website that the prices paid there were the same as the prices in the brick-and-mortar retail store. Rodman asserted claims for breach of contract and unfair business practices under California law. The court certified a class for the breach of contract claim, but denied class treatment for the California business practices claims. On December 10, 2014, the court ruled that the terms and conditions on Safeway’s website should be construed as creating a contractual promise that prices on the website would be the same as in the stores and that Safeway had breached the contract by charging more on the website. On August 31, 2015, the court denied Safeway’s affirmative defenses and arguments for limiting liability, and determined that website registrants since 2006 were entitled to approximately $23.2 million in damages plus prejudgment interest. The court has set a trial date of December 7, 2015 to determine whether pre-2006 registrants are entitled to any recovery. The Company has established an estimated liability for the claims in this case, but continues to contest the remaining claims in the trial court, and expects to contest the other issues on appeal.
Other Commitments
In the ordinary course of business, the Company enters into various supply contracts to purchase products for resale and purchase and service contracts for fixed asset and information technology commitments. These contracts typically include volume commitments or fixed expiration dates, termination provisions and other standard contractual considerations.
NOTE 10—OTHER COMPREHENSIVE INCOME OR LOSS
Total comprehensive earnings are defined as all changes in members’ equity during a period, other than those from investments by or distributions to members. Generally, for the Company, total comprehensive income or loss equals net income plus or minus adjustments for pension and other post-retirement liabilities and interest rate swaps. Total comprehensive earnings represent the activity for a period net of tax.
| F-28 | (Continued) |
Table of Contents
AB ACQUISITION LLC AND SUBSIDIARIES
Notes to Condensed Consolidated Financial Statements (unaudited)
While total comprehensive earnings are the activity in a period and are largely driven by net earnings in that period, accumulated other comprehensive income or loss (“AOCI”) represents the cumulative balance of other comprehensive income, net of tax, as of the balance sheet date. AOCI is primarily the cumulative balance related to pension and other post-retirement benefit adjustments and interest rate swaps. Changes in the AOCI balance by component are shown below (in millions):
| 28 weeks ended September 12, 2015 | ||||||||||||||||
| Pension and Post- retirement benefit plans |
Interest rate swaps |
Other | Total | |||||||||||||
| Beginning AOCI balance |
$ | 77.1 | $ | (20.6 | ) | $ | 3.1 | $ | 59.6 | |||||||
| Other comprehensive (loss) income before reclassifications |
— | (36.3 | ) | 0.6 | (35.7 | ) | ||||||||||
| Amounts reclassified from accumulated other comprehensive income |
— | 11.0 | — | 11.0 | ||||||||||||
| Tax benefit |
— | 7.0 | 0.3 | 7.3 | ||||||||||||
|
|
|
|
|
|
|
|
|
|||||||||
| Current-period other comprehensive (loss) income, net |
— | (18.3 | ) | 0.9 | (17.4 | ) | ||||||||||
|
|
|
|
|
|
|
|
|
|||||||||
| Ending AOCI balance |
$ | 77.1 | $ | (38.9 | ) | $ | 4.0 | $ | 42.2 | |||||||
|
|
|
|
|
|
|
|
|
|||||||||
| 28 weeks ended September 4, 2014 | ||||||||||||||||
| Pension benefit plans |
Interest rate swaps |
Other | Total | |||||||||||||
| Beginning AOCI balance |
$ | 17.8 | $ | — | $ | 0.2 | $ | 18.0 | ||||||||
| Other comprehensive (loss) income |
— | (12.3 | ) | 1.2 | (11.1 | ) | ||||||||||
| Tax benefit (expense) |
— | 1.7 | (0.6 | ) | 1.1 | |||||||||||
|
|
|
|
|
|
|
|
|
|||||||||
| Current-period other comprehensive (loss) income, net |
— | (10.6 | ) | 0.6 | (10.0 | ) | ||||||||||
|
|
|
|
|
|
|
|
|
|||||||||
| Ending AOCI balance |
$ | 17.8 | $ | (10.6 | ) | $ | 0.8 | $ | 8.0 | |||||||
|
|
|
|
|
|
|
|
|
|||||||||
NOTE 11—SUBSEQUENT EVENTS
The Company has evaluated subsequent events through November 13, 2015, which is the date of these Condensed Consolidated Financial Statements.
| F-29 | (Continued) |
Table of Contents
AB ACQUISITION LLC AND SUBSIDIARIES
| Page | ||||
| Financial Information |
||||
| F-31 | ||||
| Consolidated Financial Statements: |
||||
| Consolidated Balance Sheets as of February 28, 2015 and February 20, 2014 |
F-32 | |||
| F-33 | ||||
| F-34 | ||||
| F-36 | ||||
| F-37 | ||||
F-30
Table of Contents
REPORT OF INDEPENDENT REGISTERED PUBLIC ACCOUNTING FIRM
To the Management Board of
AB Acquisition LLC:
We have audited the accompanying consolidated balance sheets of AB Acquisition LLC and its subsidiaries (the “Company”) as of February 28, 2015 and February 20, 2014, and the related consolidated statements of operations and comprehensive (loss) income, cash flows, and members’ (deficit) equity for the 53 weeks ended February 28, 2015 and the 52 weeks ended February 20, 2014 and February 21, 2013. The financial statements are the responsibility of the Company’s management. Our responsibility is to express an opinion on these financial statements based on our audits.
We conducted our audits in accordance with the standards of the Public Company Accounting Oversight Board (United States). Those standards require that we plan and perform the audit to obtain reasonable assurance about whether the financial statements are free of material misstatement. The Company is not required to have, nor were we engaged to perform, an audit of its internal control over financial reporting. Our audits included consideration of internal control over financial reporting as a basis for designing audit procedures that are appropriate in the circumstances, but not for the purpose of expressing an opinion on the effectiveness of the Company’s internal control over financial reporting. Accordingly, we express no such opinion. An audit also includes examining, on a test basis, evidence supporting the amounts and disclosures in the financial statements, assessing the accounting principles used and significant estimates made by management, as well as evaluating the overall financial statement presentation. We believe that our audits provide a reasonable basis for our opinion.
In our opinion, such consolidated financial statements present fairly, in all material respects, the financial position of AB Acquisition LLC and subsidiaries as of February 28, 2015 and February 20, 2014, and the results of their operations and their cash flows for the 53 weeks ended February 28, 2015 and the 52 weeks ended February 20, 2014 and February 21, 2013, in conformity with accounting principles generally accepted in the United States of America.
/s/ Deloitte & Touche LLP
Boise, Idaho
| July 7, 2015 | (August 25, 2015 as to the change in the Company’s method of accounting for the presentation of debt issuance costs described in Note 1 and as to the effects of the restatement described in Note 2) |
F-31
Table of Contents
AB ACQUISITION LLC AND SUBSIDIARIES
Consolidated Balance Sheets
($ in millions, except unit amounts)
| February 28, 2015 |
February 20, 2014 |
|||||||
| ASSETS | ||||||||
| Current assets |
||||||||
| Cash and cash equivalents |
$ | 1,125.8 | $ | 307.0 | ||||
| Receivables, net |
631.9 | 296.2 | ||||||
| Inventories, net |
4,156.6 | 1,839.9 | ||||||
| Prepaid assets |
392.9 | 81.5 | ||||||
| Other current assets |
797.5 | 46.0 | ||||||
|
|
|
|
|
|||||
| Total current assets |
7,104.7 | 2,570.6 | ||||||
| Property and equipment, net |
12,024.2 | 4,546.7 | ||||||
| Intangible assets, net |
4,235.0 | 1,432.8 | ||||||
| Goodwill |
1,028.6 | 71.4 | ||||||
| Other assets |
1,369.3 | 737.5 | ||||||
|
|
|
|
|
|||||
| TOTAL ASSETS |
$ | 25,761.8 | $ | 9,359.0 | ||||
|
|
|
|
|
|||||
| LIABILITIES AND MEMBERS’ EQUITY | ||||||||
| Current liabilities |
||||||||
| Accounts payable |
$ | 2,763.5 | $ | 1,063.9 | ||||
| Accrued salaries and wages |
1,136.4 | 383.3 | ||||||
| Current maturities of long-term debt and capitalized lease obligations |
624.0 | 56.2 | ||||||
| Current portion of self-insurance liability |
311.6 | 200.4 | ||||||
| Deferred tax liabilities |
145.4 | 85.4 | ||||||
| Taxes other than income taxes |
287.5 | 149.5 | ||||||
| Other current liabilities |
933.0 | 92.8 | ||||||
|
|
|
|
|
|||||
| Total current liabilities |
6,201.4 | 2,031.5 | ||||||
| Long-term debt and capitalized lease obligations |
11,945.0 | 3,638.0 | ||||||
| Deferred income taxes |
1,790.8 | 45.2 | ||||||
| Long-term self-insurance liability |
1,133.7 | 809.3 | ||||||
| Other long-term liabilities |
2,522.4 | 1,075.4 | ||||||
| Commitments and contingencies |
||||||||
| Members’ equity: |
||||||||
| Tracking units, 300,000,000 units issued and 297,188,332 outstanding each of ABS, NAI and Safeway units as of February 28, 2015 and 127,799,410 units issued and outstanding each of ABS and NAI units as of February 20, 2014 |
— | — | ||||||
| Residual units, 14,907,871 units issued and outstanding of convertible Investor incentive units as of February 28, 2015 and 2,641,428 units issued and no units outstanding of Class C units as of February 20, 2014 |
— | — | ||||||
| Members’ investment |
1,848.7 | 256.2 | ||||||
| Accumulated other comprehensive income |
59.6 | 18.0 | ||||||
| Retained earnings |
260.2 | 1,485.4 | ||||||
|
|
|
|
|
|||||
| Total members’ equity |
2,168.5 | 1,759.6 | ||||||
|
|
|
|
|
|||||
| TOTAL LIABILITIES AND MEMBERS’ EQUITY |
$ | 25,761.8 | $ | 9,359.0 | ||||
|
|
|
|
|
|||||
The accompanying notes are an integral part of these Consolidated Financial Statements.
F-32
Table of Contents
AB ACQUISITION LLC AND SUBSIDIARIES
Consolidated Statements of Operations and Comprehensive (Loss) Income
($ in millions, except per unit amounts)
| 53 weeks ended February 28, 2015 |
52 weeks ended February 20, 2014 |
52 weeks ended February 21, 2013 |
||||||||||
| Net sales and other revenue |
$ | 27,198.6 | $ | 20,054.7 | $ | 3,712.0 | ||||||
| Cost of sales |
19,695.8 | 14,655.7 | 2,774.3 | |||||||||
|
|
|
|
|
|
|
|||||||
| Gross profit |
7,502.8 | 5,399.0 | 937.7 | |||||||||
| Selling and administrative expenses |
8,152.2 | 5,874.1 | 899.0 | |||||||||
| Bargain purchase gain |
— | (2,005.7 | ) | — | ||||||||
|
|
|
|
|
|
|
|||||||
| Operating (loss) income |
(649.4 | ) | 1,530.6 | 38.7 | ||||||||
| Interest expense |
633.2 | 390.1 | 7.2 | |||||||||
| Other expense, net |
96.0 | — | — | |||||||||
|
|
|
|
|
|
|
|||||||
| (Loss) income from continuing operations before income taxes |
(1,378.6 | ) | 1,140.5 | 31.5 | ||||||||
| Income tax (benefit) expense |
(153.4 | ) | (572.6 | ) | 1.7 | |||||||
|
|
|
|
|
|
|
|||||||
| (Loss) income from continuing operations |
(1,225.2 | ) | 1,713.1 | 29.8 | ||||||||
| Income from discontinued operations, net of tax |
— | 19.5 | 49.2 | |||||||||
|
|
|
|
|
|
|
|||||||
| Net (loss) income |
$ | (1,225.2 | ) | $ | 1,732.6 | $ | 79.0 | |||||
|
|
|
|
|
|
|
|||||||
| Other comprehensive (loss) income: |
||||||||||||
| Loss on interest rate swaps, net of tax |
(20.6 | ) | — | — | ||||||||
| Recognition of pension income, net of tax |
59.3 | 17.8 | — | |||||||||
| Other |
2.9 | 0.2 | — | |||||||||
|
|
|
|
|
|
|
|||||||
| Comprehensive (loss) income |
$ | (1,183.6 | ) | $ | 1,750.6 | $ | 79.0 | |||||
|
|
|
|
|
|
|
|||||||
| Basic net (loss) earnings per unit attributable to: |
||||||||||||
| Tracking group continuing operations |
$ | (8.66 | ) | $ | 13.87 | $ | 0.43 | |||||
| Tracking group discontinued operations |
— | 0.16 | 0.71 | |||||||||
|
|
|
|
|
|
|
|||||||
| Tracking group basic earnings per unit |
$ | (8.66 | ) | $ | 14.03 | $ | 1.14 | |||||
|
|
|
|
|
|
|
|||||||
| Residual group continuing operations |
$ | — | $ | — | $ | — | ||||||
| Residual group discontinued operations |
— | — | — | |||||||||
|
|
|
|
|
|
|
|||||||
| Residual group basic earnings per unit |
$ | — | $ | — | $ | — | ||||||
|
|
|
|
|
|
|
|||||||
| Diluted net (loss) earnings per unit attributable to: |
||||||||||||
| Tracking group continuing operations |
$ | (8.66 | ) | $ | 13.69 | $ | 0.43 | |||||
| Tracking group discontinued operations |
— | 0.15 | 0.71 | |||||||||
|
|
|
|
|
|
|
|||||||
| Tracking group diluted earnings per unit |
$ | (8.66 | ) | $ | 13.84 | $ | 1.14 | |||||
|
|
|
|
|
|
|
|||||||
| Residual group continuing operations |
$ | — | $ | 9.27 | $ | — | ||||||
| Residual group discontinued operations |
— | 0.16 | — | |||||||||
|
|
|
|
|
|
|
|||||||
| Residual group diluted earnings per unit |
$ | — | $ | 9.43 | $ | — | ||||||
|
|
|
|
|
|
|
The accompanying notes are an integral part of these Consolidated Financial Statements.
F-33
Table of Contents
AB ACQUISITION LLC AND SUBSIDIARIES
Consolidated Statements of Cash Flows
(in millions)
| 53 weeks ended February 28, 2015 |
52 weeks ended February 20, 2014 |
52 weeks ended February 21, 2013 |
||||||||||
| Cash flows from operating activities: |
||||||||||||
| Net (loss) income |
$ | (1,225.2 | ) | $ | 1,732.6 | $ | 79.0 | |||||
| Adjustments to reconcile net (loss) income to net cash (used in) provided by operating activities: |
||||||||||||
| Net loss (gain) on property dispositions, asset impairment and lease exit costs |
227.7 | (2.4 | ) | (45.6 | ) | |||||||
| Depreciation and amortization |
718.1 | 676.4 | 16.9 | |||||||||
| LIFO expense |
43.1 | 11.6 | 2.1 | |||||||||
| Deferred income tax |
(170.1 | ) | (657.6 | ) | — | |||||||
| Pension and post-retirement benefits expense |
8.8 | 8.1 | — | |||||||||
| Contributions to pension and post-retirement benefit plans |
(272.3 | ) | (15.7 | ) | — | |||||||
| Loss on interest rate swaps and commodity hedges, net |
98.2 | — | — | |||||||||
| Amortization and write-off of debt issuance costs |
65.3 | 25.1 | 1.2 | |||||||||
| Bargain purchase gain |
— | (2,005.7 | ) | — | ||||||||
| Loss on debt extinguishment |
— | 49.1 | — | |||||||||
| Non-cash equity-based compensation expense |
344.1 | 6.2 | — | |||||||||
| Other |
36.5 | 19.7 | — | |||||||||
| Changes in operating assets and liabilities, net of effects of acquisition of businesses: |
||||||||||||
| Receivables, net |
(8.5 | ) | 11.0 | (11.4 | ) | |||||||
| Inventories, net |
(52.4 | ) | (39.6 | ) | 15.3 | |||||||
| Accounts payable, accrued salaries and wages and other accrued liabilities |
184.0 | 304.9 | (19.5 | ) | ||||||||
| Self-insurance liabilities |
(195.0 | ) | (127.9 | ) | (2.5 | ) | ||||||
| Other operating assets and liabilities |
32.6 | 53.7 | (3.0 | ) | ||||||||
|
|
|
|
|
|
|
|||||||
| Net cash (used in) provided by operating activities |
(165.1 | ) | 49.5 | 32.5 | ||||||||
|
|
|
|
|
|
|
|||||||
| Cash flows from investing activities: |
||||||||||||
| Business acquisitions, net of cash acquired |
(5,673.4 | ) | (463.9 | ) | — | |||||||
| Purchases of property and equipment |
(328.2 | ) | (128.2 | ) | (28.7 | ) | ||||||
| Proceeds from sale of assets |
23.4 | 58.9 | 45.2 | |||||||||
| Changes in restricted cash |
39.3 | (246.0 | ) | — | ||||||||
| Other |
(6.1 | ) | (2.3 | ) | 4.3 | |||||||
|
|
|
|
|
|
|
|||||||
| Net cash (used in) provided by investing activities |
(5,945.0 | ) | (781.5 | ) | 20.8 | |||||||
|
|
|
|
|
|
|
|||||||
| F-34 | (Continued) |
Table of Contents
AB ACQUISITION LLC AND SUBSIDIARIES
Consolidated Statements of Cash Flows
(in millions)
| 53 weeks ended February 28, 2015 |
52 weeks ended February 20, 2014 |
52 weeks ended February 21, 2013 |
||||||||||
| Cash flows from financing activities: |
||||||||||||
| Proceeds from issuance of long-term debt |
$ | 8,097.0 | $ | 2,485.0 | $ | 55.0 | ||||||
| Payments on short-term borrowings related to business acquisition |
— | (44.3 | ) | — | ||||||||
| Payments on long-term borrowings |
(2,123.6 | ) | (923.3 | ) | (75.0 | ) | ||||||
| Repurchase of debt under tender offer |
— | (619.9 | ) | — | ||||||||
| Payments of obligations under capital leases |
(64.1 | ) | (24.5 | ) | (0.7 | ) | ||||||
| Payments for debt financing costs |
(229.1 | ) | (121.0 | ) | (6.9 | ) | ||||||
| Proceeds from member contributions |
1,283.2 | 250.0 | — | |||||||||
| Members’ distribution |
(34.5 | ) | — | (50.0 | ) | |||||||
|
|
|
|
|
|
|
|||||||
| Net cash provided by (used in) financing activities |
6,928.9 | 1,002.0 | (77.6 | ) | ||||||||
|
|
|
|
|
|
|
|||||||
| Net increase (decrease) in cash and cash equivalents |
818.8 | 270.0 | (24.3 | ) | ||||||||
| Cash and cash equivalents at beginning of period |
307.0 | 37.0 | 61.3 | |||||||||
|
|
|
|
|
|
|
|||||||
| Cash and cash equivalents at end of period |
$ | 1,125.8 | $ | 307.0 | $ | 37.0 | ||||||
|
|
|
|
|
|
|
|||||||
| Supplemental cash flow information: |
||||||||||||
| Non-cash investing and financing activities were as follows: |
||||||||||||
| Capital lease obligations |
$ | 23.7 | $ | 6.0 | $ | — | ||||||
| Purchases of property and equipment included in accounts payable |
109.1 | 11.7 | 3.0 | |||||||||
| Interest and income taxes paid: |
||||||||||||
| Interest paid (net of amount capitalized) |
581.4 | 283.0 | 5.0 | |||||||||
| Income taxes (refunded) paid |
(21.5 | ) | 40.8 | 2.0 | ||||||||
The accompanying notes are an integral part of these Consolidated Financial Statements.
F-35
Table of Contents
AB ACQUISITION LLC AND SUBSIDIARIES
Consolidated Statements of Members’ (Deficit) Equity
(in millions, except units)
| Tracking group | Residual group | |||||||||||||||||||||||||||||||||||
| ABS units | NAI units | Safeway units |
Class C units |
Investor incentive units |
Members’ investment |
Accumulated other comprehensive income |
Accumulated (deficit)/ Retained earnings |
Total members’ (deficit) equity |
||||||||||||||||||||||||||||
| Balance at February 23, 2012 |
69,708,763 | — | — | — | — | $ | — | $ | — | $ | (276.2 | ) | $ | (276.2 | ) | |||||||||||||||||||||
| Net income |
— | — | 79.0 | 79.0 | ||||||||||||||||||||||||||||||||
| Members’ distributions |
— | — | (50.0 | ) | (50.0 | ) | ||||||||||||||||||||||||||||||
|
|
|
|
|
|
|
|
|
|
|
|
|
|
|
|
|
|
|
|||||||||||||||||||
| Balance at February 21, 2013 |
69,708,763 | — | — | — | — | — | — | (247.2 | ) | (247.2 | ) | |||||||||||||||||||||||||
| Issuance of tracking units to existing members |
69,708,763 | — | — | — | — | |||||||||||||||||||||||||||||||
| Proceeds from issuance of tracking units |
58,090,647 | 58,090,647 | 250.0 | — | — | 250.0 | ||||||||||||||||||||||||||||||
| Equity-based compensation |
6.2 | — | 6.2 | |||||||||||||||||||||||||||||||||
| Net income |
— | — | 1,732.6 | 1,732.6 | ||||||||||||||||||||||||||||||||
| Other comprehensive income, net of tax |
— | 18.0 | — | 18.0 | ||||||||||||||||||||||||||||||||
|
|
|
|
|
|
|
|
|
|
|
|
|
|
|
|
|
|
|
|||||||||||||||||||
| Balance at February 20, 2014 |
127,799,410 | 127,799,410 | — | — | — | 256.2 | 18.0 | 1,485.4 | 1,759.6 | |||||||||||||||||||||||||||
| Vesting of Class C units |
2,641,428 | — | — | — | — | |||||||||||||||||||||||||||||||
| Exchange of Class C units for tracking units |
2,641,428 | 2,641,428 | (2,641,428 | ) | — | — | — | — | ||||||||||||||||||||||||||||
| Equity-based compensation |
78.4 | — | — | 78.4 | ||||||||||||||||||||||||||||||||
| Issuance of investor incentive units for services |
14,907,871 | 265.7 | — | — | 265.7 | |||||||||||||||||||||||||||||||
| Proceeds from issuance of tracking units to management |
4,309,128 | 4,309,128 | 33.2 | — | — | 33.2 | ||||||||||||||||||||||||||||||
| Proceeds from issuance of tracking units |
162,438,366 | 162,438,366 | 1,250.0 | — | — | 1,250.0 | ||||||||||||||||||||||||||||||
| Issuance of Safeway tracking units to existing members |
297,188,332 | — | — | — | — | |||||||||||||||||||||||||||||||
| Net loss |
— | — | (1,225.2 | ) | (1,225.2 | ) | ||||||||||||||||||||||||||||||
| Members’ distribution |
(34.5 | ) | — | — | (34.5 | ) | ||||||||||||||||||||||||||||||
| Other member activity |
(0.3 | ) | — | — | (0.3 | ) | ||||||||||||||||||||||||||||||
| Other comprehensive income, net of tax |
— | 41.6 | — | 41.6 | ||||||||||||||||||||||||||||||||
|
|
|
|
|
|
|
|
|
|
|
|
|
|
|
|
|
|
|
|||||||||||||||||||
| Balance at February 28, 2015 |
297,188,332 | 297,188,332 | 297,188,332 | — | 14,907,871 | $ | 1,848.7 | $ | 59.6 | $ | 260.2 | $ | 2,168.5 | |||||||||||||||||||||||
|
|
|
|
|
|
|
|
|
|
|
|
|
|
|
|
|
|
|
|||||||||||||||||||
The accompanying notes are an integral part of these Consolidated Financial Statements.
F-36
Table of Contents
AB ACQUISITION LLC AND SUBSIDIARIES
Notes to Consolidated Financial Statements
Note 1—Description of Business, Basis of Presentation and Summary of Significant Accounting Policies
Description of Business
AB Acquisition LLC and its subsidiaries (“the Company”) is a food and drug retailer that, as of February 28, 2015, operated 2,382 retail food and drug stores together with 390 associated fuel centers, 30 dedicated distribution centers and 21 manufacturing facilities. The Company is composed of retail food businesses and in-store pharmacies with operations primarily located throughout the United States under the banners Albertsons, Safeway, Vons, Pavilions, Randalls, Tom Thumb, Carrs Quality Centers, United Supermarkets, Market Street, Amigos, United Express, Sav-On, Jewel-Osco, ACME, Shaw’s and Star Market. The Company also owns and operates GroceryWorks.com Operating Company, LLC, an online grocery channel, doing business under the names Safeway.com and Vons.com. The Company also has a 49% ownership in Casa Ley, S.A. de C.V. (“Casa Ley”), which operates 206 food and general merchandise stores in Western Mexico. AB Acquisition LLC has no separate assets or liabilities other than the investments in its subsidiaries and all its business operations are conducted through its operating subsidiaries. The Company is owned by a consortium of investors led by Cerberus Capital Management, L.P. (“Cerberus”).
On January 30, 2015, the Company, through a subsidiary, Albertson’s Holdings LLC (“Albertson’s”), acquired Safeway Inc. (“Safeway”) pursuant to an Agreement and Plan of Merger dated as of March 6, 2014, as amended April 7, 2014 and June 13, 2014 (the “Merger Agreement”), under which Albertson’s acquired all of the outstanding shares of Safeway (the “Safeway acquisition”). Safeway operated 1,325 supermarkets under the banners Safeway, Vons, Pavilions, Randalls, Tom Thumb and Carrs Quality Centers.
On December 29, 2013, the Company acquired United Supermarkets, LLC (“United”). United operated 51 supermarkets under the banners United Supermarkets, Market Street, Amigos and United Express. On March 21, 2013, the Company acquired from SUPERVALU INC. (“SuperValu”) all of the issued and outstanding shares of New Albertson’s, Inc. (“NAI”) through a newly formed subsidiary of the Company, NAI Holdings LLC (the “NAI acquisition”). NAI operated 871 supermarkets under the banners Jewel-Osco, ACME, Shaw’s, Star Market and Albertsons. Prior to the NAI acquisition, the Company owned 192 supermarkets under the Albertsons banner and two distribution centers operating within certain geographical markets.
Basis of Presentation
The Company’s Consolidated Financial Statements have been prepared in accordance with accounting principles generally accepted in the United States of America (“GAAP”). Intercompany transactions and accounts have been eliminated in consolidation for all periods presented. The Company’s investment in Casa Ley is reported using the equity method.
Significant Accounting Policies
Fiscal year: In connection with the Safeway acquisition, the Company elected to change its fiscal year from the Thursday before the last Saturday in February to the last Saturday in February. Unless the context otherwise indicates, reference to a fiscal year of the Company refers to the calendar year in which such fiscal year commences. The Company’s first quarter consists of 16 weeks, and the second, third and fourth quarters generally each consist of 12 weeks. For the fiscal year ended February 28, 2015, the fourth quarter consisted of 13 weeks, and the fiscal year consisted of 53 weeks. For each of the prior years presented, the fiscal year consisted of 52 weeks.
| F-37 | (Continued) |
Table of Contents
AB ACQUISITION LLC AND SUBSIDIARIES
Notes to Consolidated Financial Statements
Use of estimates: The preparation of the Company’s Consolidated Financial Statements in conformity with GAAP requires management to make estimates and assumptions that affect the reported amounts of assets and liabilities and the disclosure of contingent assets and liabilities at the date of the financial statements and the reported amounts of revenues and expenses for the reporting periods presented. Certain estimates require difficult, subjective or complex judgments about matters that are inherently uncertain. Actual results could differ from those estimates.
Cash and cash equivalents: Cash equivalents include all highly liquid investments with original maturities of three months or less at the time of purchase and outstanding deposits related to credit and debit card sales transactions that settle within a few days. Amounts classified as Cash and cash equivalents for credit and debit card transactions were $299.2 million and $53.4 million as of February 28, 2015 and February 20, 2014, respectively.
Restricted cash: Restricted cash primarily relates to collateralized surety bonds and letters of credit. The Company had $270.2 million and $246.0 million of restricted cash included in Other assets within the Consolidated Balance Sheets as of February 28, 2015 and February 20, 2014, respectively.
Receivables, net: Receivables consist primarily of trade accounts receivable, pharmacy accounts receivable and vendor receivables. Management makes estimates of the uncollectibility of its accounts receivable. In determining the adequacy of the allowances for doubtful accounts, management analyzes the value of collateral, historical collection experience, aging of receivables and other economic and industry factors. It is possible that the accuracy of the estimation process could be materially impacted by different judgments, estimations and assumptions based on the information considered and could result in a further adjustment of receivables. The allowance for doubtful accounts and bad debt expenses were not material for any of the periods presented.
Inventories, net: Substantially all of the Company’s inventories consist of finished goods valued at the lower of cost or market and net of vendor allowances.
As of February 28, 2015 and February 20, 2014, approximately 84.5% and 91.7%, respectively, of the Company’s inventories were valued under the last-in, first-out (“LIFO”) method. The Company primarily uses the item-cost or the retail inventory method to determine inventory cost before application of any LIFO adjustment. Under the item-cost method, the most recent purchase cost is used to determine the cost of inventory before the application of any LIFO adjustment. Under the retail inventory method, inventory cost is determined, before the application of any LIFO adjustment, by applying a cost-to-retail ratio to various categories of similar items to the retail value of those items. Replacement or current cost was higher than the carrying amount of inventories valued using LIFO by $92.3 million and $49.2 million at February 28, 2015 and February 20, 2014, respectively.
Cost for the remaining inventories, which represents perishable, pharmacy and fuel inventories, was determined using the most recent purchase cost, which approximates the first-in, first-out (“FIFO”) method. Perishables are counted every four weeks and are carried at the last purchased cost which approximates FIFO cost. Pharmacy and fuel inventories are carried at the last purchased cost, which approximates FIFO cost. The Company records inventory shortages based on actual physical counts at its facilities and also provides allowances for inventory shortages for the period between the last physical count and the balance sheet date.
| F-38 | (Continued) |
Table of Contents
AB ACQUISITION LLC AND SUBSIDIARIES
Notes to Consolidated Financial Statements
Property and equipment, net: Property and equipment is recorded at cost or fair value for assets acquired as part of a business combination, and depreciation is calculated on the straight-line method over the estimated useful lives of the assets. Estimated useful lives are generally as follows: buildings—seven to 40 years; leasehold improvements—the shorter of the remaining lease term or ten to 20 years; fixtures and equipment—three to 15 years; specialized supply chain equipment—six to 25 years.
Assets under capital leases are recorded at the lower of the present value of the future minimum lease payments or the fair value of the asset and are amortized on the straight-line method over the lesser of the lease term or the estimated useful life. Interest capitalized on property under construction was immaterial for all periods presented.
Impairment of long-lived assets: The Company regularly reviews its individual store’s operating performance, together with current market conditions, for indicators of impairment. When events or changes in circumstances indicate that the carrying value of the individual store’s assets may not be recoverable, its future undiscounted cash flows are compared to the carrying value. If the carrying value of store assets to be held and used is greater than the future undiscounted cash flows, an impairment loss is recognized to record the assets at fair value. For property and equipment held for sale, the Company recognizes impairment charges for the excess of the carrying value plus estimated costs of disposal over the fair value. Fair values are based on discounted cash flows or current market rates. These estimates of fair value can be significantly impacted by factors such as changes in the current economic environment and real estate market conditions. Losses on long-lived asset impairments are recorded as a component of Selling and administrative expenses.
Lease exit costs: The Company records a liability for costs associated with closures of retail stores, distribution centers and other properties that are no longer utilized in current operations. For properties that have closed and are under long-term lease agreements, the present value of any remaining liability under the lease, net of estimated sublease recovery and discounted using credit adjusted risk-free rates, is recognized as a liability and charged to Selling and administrative expenses. These lease liabilities are usually paid over the lease terms associated with the property. Adjustments to lease exit reserves primarily relate to changes in subtenant income or actual exit costs that differ from original estimates. Lease exit reserves for closed properties are included as a component of Other current liabilities and Other long-term liabilities.
Intangible assets, net: The Company reviews intangible assets with indefinite useful lives and tests for impairment annually on the first day of the fourth quarter and also if events or changes in circumstances indicate the occurrence of a triggering event. The review consists of comparing the estimated fair value of the cash flows generated by the asset to the carrying value of the asset. The Company reviews finite-lived intangible assets for impairment in accordance with its policy for long-lived assets. Intangible assets with indefinite useful lives consist of restricted covenants and liquor licenses. Intangible assets with finite lives consist primarily of trade names, naming rights, customer prescription files, internally developed software and beneficial lease rights. Intangible assets with finite lives are amortized on a straight-line basis over an estimated economic life ranging from three to 40 years. Customer prescription files are being amortized on a straight-line basis over a five-year useful life, which management believes is reflective of the economic life of the related assets. Beneficial lease rights and unfavorable lease obligations are recorded on acquired leases based on the differences between the contractual rents for the remaining lease terms under the respective lease agreement and prevailing market rents for the related geography as of the lease acquisition date. Beneficial lease rights and unfavorable lease obligations are amortized over the lease term using the straight-line method.
| F-39 | (Continued) |
Table of Contents
AB ACQUISITION LLC AND SUBSIDIARIES
Notes to Consolidated Financial Statements
Goodwill: Goodwill represents the excess of the cost of an acquisition over the fair value of the net identifiable assets acquired as of the acquisition date. The Company reviews goodwill for impairment annually on the first day of the fourth quarter and also if events or changes in circumstances indicate the occurrence of a triggering event. The impairment test is a two-step process. In the first step, the Company determines if the fair value of the reporting unit is less than the book value. If the Company concludes that the fair value of a reporting unit is less than its book value, the Company must perform step two in which it calculates the implied fair value of goodwill and compares it to carrying value. If the carrying value of goodwill exceeds the implied fair value of goodwill, such excess represents the amount of goodwill impairment. If the Company concludes that the fair value of a reporting unit is greater than its book value, step two is not performed, and the Company concludes that there is no goodwill impairment. Determining the fair value of a reporting unit involves the use of significant estimates and assumptions. Generally, fair value is determined by a multiple of earnings based on the guideline publicly traded business method or discounting projected future cash flows based on management’s expectations of the current and future operating environment. There were no goodwill impairment charges recorded for any periods presented.
Company-Owned life insurance policies (“COLI”): The Company has COLI policies that have a cash surrender value. The Company has loans against these policies. The Company has no intention of repaying the loans prior to maturity or cancellation of the policies. Therefore, the Company offsets the cash surrender value by the related loans. As of February 28, 2015 and February 20, 2014, the cash surrender values of the policies were $194.7 million and $134.7 million, and the balance of the policy loans were $120.0 million and $77.7 million, respectively. The net balance of the COLI is included in Other assets.
Interest rate risk management: The Company has entered into several interest rate swap contracts (“Swaps”) to hedge against the variability in cash flows relating to interest payments on its outstanding variable rate term debt. Swaps are recognized in the Consolidated Balance Sheets at fair value. Changes in the fair value of Swaps designated as “cash flow” hedges, to the extent the hedges are highly effective, are recorded in Other comprehensive income (loss), net of income taxes. Ineffective portions of cash flow hedges, if any, are recognized in current period earnings. Other comprehensive income (loss) is reclassified into current period earnings when the hedged transaction affects earnings. The Company assesses, both at the inception of the hedge and on an ongoing basis, whether derivatives used as hedging instruments are highly effective in offsetting the changes in the fair value or cash flow of the hedged items. If it is determined that a derivative is not highly effective as a hedge or ceases to be highly effective, the Company discontinues hedge accounting prospectively.
Energy contracts: The Company has entered into contracts to purchase electricity and natural gas at fixed prices for a portion of its energy needs. The Company expects to take delivery of the electricity and natural gas in the normal course of business. Contracts that qualify for the normal purchase exception under derivatives and hedging accounting guidance are not recorded at fair value. Energy purchased under these contracts is expensed as delivered. The Company also manages its exposure to changes in energy prices utilized in the shipping process through the use of short-term heating oil derivative contracts used to hedge diesel fuel. These contracts are economic hedges of price risk and are not designated or accounted for as hedging instruments for accounting purposes. Changes in the fair value of these instruments are recognized in earnings.
Self-Insurance liabilities: The Company is primarily self-insured for workers’ compensation, property, automobile and general liability. The self-insurance liability is undiscounted and determined actuarially, based on claims filed and an estimate of claims incurred but not yet reported. The
| F-40 | (Continued) |
Table of Contents
AB ACQUISITION LLC AND SUBSIDIARIES
Notes to Consolidated Financial Statements
Company has established stop-loss amounts that limit the Company’s further exposure after a claim reaches the designated stop-loss threshold. Stop-loss amounts for claims incurred for the years presented range from $0.5 million to $5.0 million per claim, depending upon the type of insurance coverage and the year the claim is incurred. In determining its self-insurance liabilities, the Company performs a continuing review of its overall position and reserving techniques. Since recorded amounts are based on estimates, the ultimate cost of all incurred claims and related expenses may be more or less than the recorded liabilities.
As a part of the Safeway acquisition and NAI acquisition, the Company assumed outstanding self-insurance liabilities. Under the acquisition method of accounting, these assumed liabilities were recorded on the acquisition dates of Safeway and NAI at fair values of $613.5 million and $1,082.9 million, respectively. Subsequent to the acquisitions, the Company measures and accounts for the assumed self-insurance liabilities using a systematic and rational approach, which considers actual claims experience in each period compared to total expected claims over the estimated remaining life of the claims.
The Company has deposits with its insurers to fund workers’ compensation and automobile and general liability claims payments. The Company had $12.9 million and $14.9 million of deposits for its workers’ compensation and automobile liability claims as of February 28, 2015, and February 20, 2014, respectively, included in Other assets. The Company has reinsurance receivables of $30.4 million and $24.3 million recorded within Receivables, net and $70.8 million and $76.5 million recorded within Other assets as of February 28, 2015 and February 20, 2014, respectively. The self-insurance liabilities and related reinsurance receivables are recorded gross.
Changes in self-insurance liabilities consisted of the following (in millions):
| Fiscal 2014 | Fiscal 2013 | Fiscal 2012 | ||||||||||
| Beginning balance |
$ | 1,009.7 | $ | 52.5 | $ | 55.0 | ||||||
| Assumed liabilities from acquisitions |
613.5 | 1,082.9 | — | |||||||||
| Expense |
157.7 | 128.6 | 14.2 | |||||||||
| Claim payments |
(205.3 | ) | (192.3 | ) | (16.7 | ) | ||||||
| Other reductions(1) |
(130.3 | ) | (62.0 | ) | — | |||||||
|
|
|
|
|
|
|
|||||||
| Ending balance |
1,445.3 | 1,009.7 | 52.5 | |||||||||
| Less current portion |
(311.6 | ) | (200.4 | ) | (16.8 | ) | ||||||
|
|
|
|
|
|
|
|||||||
| Long-term portion |
$ | 1,133.7 | $ | 809.3 | $ | 35.7 | ||||||
|
|
|
|
|
|
|
|||||||
| (1) | Primarily reflects the systematic adjustments to the fair value of the assumed self-insurance liabilities from acquisitions and actuarial adjustments for claims experience. |
Deferred rents: The Company recognizes rent holidays, from the period of time the Company has possession of the property, as well as tenant allowances and escalating rent provisions, on a straight-line basis over the expected term of the operating lease. The expected term may also include the exercise of renewal options if such exercise is determined to be reasonably assured and is used to determine whether the lease is capital or operating. Certain leases call for payment of executory costs, such as property taxes, utilities, insurance and maintenance costs. Deferred rents are included in Other current liabilities and Other long-term liabilities.
Deferred gains on leases: The Company may receive up-front funds upon sublease or assignment of existing leases. Deferred gains related to subleases and assignments as of February 28, 2015 and February 20, 2014 were $12.9 million and $12.5 million, respectively, recorded
| F-41 | (Continued) |
Table of Contents
AB ACQUISITION LLC AND SUBSIDIARIES
Notes to Consolidated Financial Statements
in Other current liabilities, and $72.7 million and $82.8 million, respectively, recorded in Other long-term liabilities. These proceeds are amortized on a straight-line basis over an estimated sublease term as rent income and were $12.6 million for fiscal 2014, and $12.5 million for both fiscal 2013 and 2012.
In addition, deferred gains have been recorded in connection with several sale-leaseback transactions and are recognized over the lives of the leases. The current portion of deferred gains related to sale-leaseback transactions at February 28, 2015 and February 20, 2014 were $12.5 million and $13.4 million, respectively, recorded in Other current liabilities, with the long-term portion of $183.3 million and $209.6 million at February 28, 2015 and February 20, 2014, respectively, recorded in Other long-term liabilities. Amortization of deferred gains related to sale-leaseback transactions were $13.4 million for fiscal 2014, 2013 and 2012, respectively, and is recorded as a reduction in rent expense.
Benefit plans: Substantially all of the Company’s employees are covered by various contributory and non-contributory pension, profit sharing or 401(k) plans, in addition to dedicated defined benefit plans for Safeway, Shaw’s and United employees. Certain employees participate in a long-term retention incentive bonus plan. Most union employees participate in multiemployer retirement plans under collective bargaining agreements, unless the collective bargaining agreement provides for participation in plans sponsored by the Company. The Company also provides certain health and welfare benefits, including short-term and long-term disability benefits to inactive disabled employees prior to retirement.
The Company recognizes a liability for the under-funded status of the defined benefit plans as a component of Other long-term liabilities. Actuarial gains or losses and prior service costs or credits are recorded within Other comprehensive income (loss). The determination of the Company’s obligation and related expense for its sponsored pensions and other post-retirement benefits is dependent, in part, on management’s selection of certain actuarial assumptions in calculating these amounts. These assumptions include, among other things, the discount rate and expected long-term rate of return on plan assets. Pension expense for the multiemployer plans is recognized as contributions are funded.
Revenue recognition: Revenues from the sale of products are recognized at the point of sale to the customer, net of returns and sales tax. Discounts provided to customers by the Company at the time of sale are recognized as a reduction in sales as the products are sold. Discounts provided to customers by vendors, usually in the form of coupons, are not recognized as a reduction in sales, provided the coupons are redeemable at any retailer that accepts coupons. The Company recognizes revenue and records a corresponding receivable from the vendor for the difference between the sales prices and the cash received from the customer. The Company records a deferred revenue liability when it sells its own proprietary gift cards. The Company records a sale when the customer redeems the gift card. The gift cards do not expire. The Company reduces the liability and records revenue for the unused portion of gift cards (“breakage”) after two to five years, the period at which redemption is considered remote. Breakage amounts were immaterial for fiscal 2014, 2013 and 2012, respectively.
Cost of sales and vendor allowances: Cost of sales includes, among other things, purchasing, inbound freight costs, product quality testing costs, warehousing costs, internal transfer costs, advertising costs, private label program costs and strategic sourcing program costs.
The Company receives vendor allowances or rebates (“Vendor Allowances”) for a variety of merchandising initiatives and buying activities. The terms of the Company’s Vendor Allowances arrangements vary in length but are primarily expected to be completed within a quarter. The Company records Vendor Allowances as a reduction of Cost of sales when the associated products are sold.
| F-42 | (Continued) |
Table of Contents
AB ACQUISITION LLC AND SUBSIDIARIES
Notes to Consolidated Financial Statements
Vendor Allowances that have been earned as a result of completing the required performance under terms of the underlying agreements but for which the product has not yet been sold are recognized as reductions of inventory. The reduction of inventory for these Vendor Allowances was $92.0 million and $45.3 million as of February 28, 2015 and February 20, 2014, respectively.
Advertising costs are included in Cost of sales and are expensed in the period the advertising occurs. Cooperative advertising funds are recorded as a reduction of Cost of sales when the advertising occurs. Advertising costs were $239.9 million, $192.4 million, and $45.5 million, net of cooperative advertising allowances of $16.9 million, $11.5 million, and $2.1 million for fiscal 2014, 2013, and 2012 respectively.
Selling and administrative expenses: Selling and administrative expenses consist primarily of store and corporate employee-related costs such as salaries and wages, health and welfare, workers’ compensation and pension benefits, as well as marketing and merchandising, rent, occupancy and operating costs, amortization of intangibles and other administrative costs.
Equity-Based employee compensation: The Company has granted membership interests to employees and non-employees and accounts for these awards in accordance with the applicable accounting guidance for equity awards issued to employees and non-employees.
Employee awards are recorded under the provisions of ASC 718, Compensation—Stock Compensation with equity-based compensation expense measured at the grant date, based on the fair value of the award. As required under this guidance, the Company estimates forfeitures for equity-based grants which are not expected to vest. The Company recognizes compensation expense over the requisite vesting period of the award. The Company recognizes compensation expense for equity-based awards subject to a performance vesting condition when achieving the performance condition becomes probable. Changes in inputs and assumptions used to calculate the fair value of equity-based payments can materially affect the measurement of the estimated fair value of the Company’s equity-based compensation expense.
The Company measures equity-based compensation to non-employees in accordance with ASC 505-50 Equity-Based Payments to Non-Employees (“ASC 505”) and recognizes the fair value of the award over the period the services are rendered or goods are provided.
Net (Loss) Income Per Unit (“EPU”): The Company has two classes of common units: tracking units and residual units. The tracking units include ABS, NAI and Safeway Units (collectively referred to as the “Tracking Group”) and residual units including Class C Units, Investor Incentive Units and Series-1 Incentive Units (collectively referred to as the “Residual Group”). EPU is calculated separately for the Tracking Group and for the Residual Group using the two-class method.
Basic (loss) income per unit (“Basic EPU”) is computed by dividing net (loss) income attributable to the Tracking Group unit-holders and Residual Group unitholders by the weighted average number of Tracking Group and Residual Group units outstanding, respectively, for the period. Diluted (loss) income per unit (“Diluted EPU”) gives effect to all dilutive potential tracking units and residual units outstanding during the period using the treasury stock method. Diluted EPU excludes all potentially dilutive units if the effect of their inclusion is anti-dilutive. Diluted EPU is computed by dividing net income (loss) attributable to the Tracking Group unitholders and Residual Group unitholders by the weighted average number of units outstanding, respectively, plus, where applicable, units that would have been outstanding related to dilutive units secured by member loans for the Tracking Group and Class C Units, Investor Incentive Units and Series-1 Incentive Units for the Residual Group.
| F-43 | (Continued) |
Table of Contents
AB ACQUISITION LLC AND SUBSIDIARIES
Notes to Consolidated Financial Statements
Income taxes: The Company is organized as a limited liability company, taxed as a partnership which generally is not subject to entity-level tax. The income taxes in respect to these operations are payable by the equity members in accordance with their respective ownership percentages. The Company conducts the operations of its Safeway, NAI and United operations through Subchapter C Corporations. The Company provides for federal and state income taxes on its Subchapter C Corporations, which are subject to entity-level tax, and state income taxes on its limited liability companies where applicable.
Deferred taxes are provided for the net tax effects of temporary differences between the financial reporting and income tax basis of assets and liabilities using enacted tax rates in effect for the year in which the differences are expected to reverse. The effect of a change in tax rates on deferred tax assets and liabilities is recognized in income in the period that includes the enactment date. Deferred income taxes are reported as a current or noncurrent asset or liability based on the classification of the related asset or liability according to the expected date of reversal. Valuation allowances are established where management determines that it is more likely than not that some portion or all of a deferred tax asset will not be realized. The Company reviews tax positions taken or expected to be taken on tax returns to determine whether and to what extent a tax benefit can be recognized. The Company evaluates its positions taken and establishes liabilities in accordance with the applicable accounting guidance for uncertain tax positions. The Company reviews these liabilities as facts and circumstances change and adjusts accordingly. The Company recognizes any interest and penalties associated with uncertain tax positions as a component of Income tax expense.
The Company is contractually indemnified by SuperValu for any tax liability of NAI arising from tax years prior to the NAI acquisition. The Company is also contractually obligated to pay SuperValu any tax benefit it receives in a tax year after the NAI acquisition as a result of an indemnification payment made by SuperValu. An indemnification asset and liability, where necessary, has been recorded to reflect this arrangement.
Segments: The Company and its subsidiaries operate food and drug retail stores that offer grocery products, general merchandise, health and beauty care products, pharmacy, fuel and other items and services. The Company’s retail operating divisions are geographically based, have similar economic characteristics and similar expected long-term financial performance and are reported in one reportable segment. The Company’s operating segments and reporting units are its 14 divisions, which have been aggregated into one reportable segment. Each reporting unit constitutes a business for which discrete financial information is available and for which management regularly reviews the operating results. Across all operating segments, the Company operates primarily one store format. Each store offers the same general mix of products with similar pricing to similar categories of customers, have similar distribution methods, operate in similar regulatory environments and purchase merchandise from similar or the same vendors. Except for an equity method investment in Casa Ley, all of the Company’s retail operations are domestic.
| F-44 | (Continued) |
Table of Contents
AB ACQUISITION LLC AND SUBSIDIARIES
Notes to Consolidated Financial Statements
The following table represents sales revenue by type of similar product (in millions):
| Fiscal 2014 | Fiscal 2013 | Fiscal 2012 | ||||||||||||||||||||||
| Amount | % of Total | Amount | % of Total | Amount | % of Total | |||||||||||||||||||
| Non-perishables(1) |
$ | 12,906.1 | 47.5 | % | $ | 9,956.4 | 49.7 | % | $ | 1,836.0 | 49.5 | % | ||||||||||||
| Perishables(2) |
11,043.8 | 40.6 | % | 7,842.3 | 39.1 | % | 1,441.3 | 38.8 | % | |||||||||||||||
| Pharmacy |
2,602.9 | 9.6 | % | 2,019.4 | 10.1 | % | 393.1 | 10.6 | % | |||||||||||||||
| Fuel |
387.4 | 1.4 | % | 46.9 | 0.2 | % | — | — | % | |||||||||||||||
| Other(3) |
258.4 | 0.9 | % | 189.7 | 0.9 | % | 41.6 | 1.1 | % | |||||||||||||||
|
|
|
|
|
|
|
|
|
|
|
|
|
|||||||||||||
| Total |
$ | 27,198.6 | 100.0 | % | $ | 20,054.7 | 100.0 | % | $ | 3,712.0 | 100.0 | % | ||||||||||||
|
|
|
|
|
|
|
|
|
|
|
|
|
|||||||||||||
| (1) | Consists primarily of general merchandise, grocery and frozen foods. |
| (2) | Consists primarily of produce, dairy, meat, deli, floral and seafood. |
| (3) | Consists primarily of lottery and various other commissions and other miscellaneous income. |
Recently Adopted Accounting Standards: In July 2013, the Financial Accounting Standards Board (“FASB”) issued Accounting Standards Update (“ASU”) 2013-11, Income Taxes (Topic 740): “Presentation of an Unrecognized Tax Benefit When a Net Operating Loss Carryforward, a Similar Tax Loss, or a Tax Credit Carryforward Exists,” which provides guidance on the financial statement presentation of an unrecognized tax benefit when a net operating loss (“NOL”) carryforward, a similar tax loss or a tax credit carryforward exists. ASU 2013-11 requires entities to present an unrecognized tax benefit as a reduction of a deferred tax asset for a NOL or tax credit carryforward whenever the NOL or tax credit carryforward would be available to reduce the additional taxable income or tax due if the tax position is disallowed. This accounting standard update requires entities to assess whether to net the unrecognized tax benefit with a deferred tax asset as of the reporting date. The Company adopted ASU 2013-11 in the first quarter of fiscal 2014, which resulted in a decrease of $132.5 million to the unrecognized tax benefit and an offsetting decrease to the long-term deferred tax asset.
In April 2014, the FASB issued ASU 2014-08, “Presentation of Financial Statements (Topic 205) and Property, Plant, and Equipment (Topic 360): Reporting Discontinued Operations and Disclosures of Disposals of Components of an Entity.” This pronouncement changes the requirements for reporting discontinued operations in Subtopic 205-20. A discontinued operation may include a component of an entity or a group of components of an entity, or a business or nonprofit activity. A disposal of a component of an entity or a group of components of an entity is required to be reported in discontinued operations if the disposal represents a strategic shift that has (or will have) a major effect on an entity’s operations and financial results when any of certain criteria are met. Currently, a component of an entity that is a reportable segment, an operating segment, a reporting unit, a subsidiary or an asset group is eligible for discontinued operations. Certain disclosure requirements relating to discontinued operations are also updated in this pronouncement. ASU 2014-08 is effective for fiscal years beginning after December 15, 2014. Early adoption is allowed for discontinued operations that have not been previously reported. The Company early adopted this standard, effective February 21, 2014. The adoption of this standard did not have a material impact on the Company’s financial position, results of operations and related disclosures for the fiscal year 2014.
In April 2015, the Financial Accounting Standards Board (“FASB”) issued Accounting Standards Update (“ASU”) 2015-03, “Interest - Imputation of Interest (Subtopic 835-30): Simplifying the Presentation of Debt Issuance Costs.” The objective of this ASU is to simplify the presentation of debt issuance costs by requiring that debt issuance costs related to a recognized debt liability be presented
| F-45 | (Continued) |
Table of Contents
AB ACQUISITION LLC AND SUBSIDIARIES
Notes to Consolidated Financial Statements
in the balance sheet as a direct deduction from the carrying amount of that debt liability, consistent with debt discounts. This ASU is effective for financial statements issued for fiscal years beginning after December 15, 2015 for publicly traded companies and interim periods within those fiscal years. Early adoption is permitted for financial statements that have not been previously issued. The Company early adopted ASU 2015-03 as of March 1, 2015. As a result of the adoption, the Company retrospectively reclassified $187.8 million and $47.7 million of unamortized debt issuance costs as of February 28, 2015 and February 20, 2014, respectively, from Other assets to a reduction in long-term debt. The adoption did not have an impact on the Company’s Condensed Consolidated Statement of Operations or the Condensed Consolidated Statement of Cash Flows.
Recently Issued Accounting Standards: In May 2014, the FASB issued ASU 2014-09, “Revenue from Contracts with Customers” (Topic 606). The core principle of the guidance is that an entity should recognize revenue to depict the transfer of promised goods or services to customers in an amount that reflects the consideration to which the entity expects to be entitled in exchange for those goods or services. To achieve that core principle, an entity should apply the following steps: 1) identify the contract(s) with a customer, 2) identify the performance obligations in the contract, 3) determine the transaction price, 4) allocate the transaction price to the performance obligations in the contract, and 5) recognize revenue when (or as) the entity satisfies a performance obligation. For public entities, this pronouncement is effective for annual reporting periods beginning after December 15, 2016. Early application is not permitted. The Company is currently evaluating the impact of this pronouncement.
In April 2015, the FASB issued ASU 2015-04, “Compensation—Retirement Benefits (Topic 715): Practical Expedient for the Measurement Date of an Employer’s Defined Benefit Obligation and Plan Assets.” This ASU gives an employer whose fiscal year-end does not coincide with a calendar month-end (e.g., an entity that has a 52- or 53-week fiscal year) the ability, as a practical expedient, to measure defined benefit retirement obligations and related plan assets as of the month-end that is closest to its fiscal year-end. This amendment is effective for fiscal years beginning after December 15, 2015, and interim periods within those fiscal years. Early application is permitted. The Company is currently evaluating the impact of this ASU.
Note 2—Acquisitions
Safeway acquisition
On January 30, 2015, the Company completed its acquisition of Safeway by acquiring all of the outstanding shares of Safeway for cash consideration of $34.92 per share, or $8,263.5 million, and issuing contingent value rights of $1.0266 and $0.0488 per share relating to Safeway’s 49% interest in Casa Ley and deferred consideration related to Safeway’s previous sale of the Property Development Centers, LLC (“PDC”) assets, respectively, for an aggregate fair value of $270.9 million. The Casa Ley contingent value right will entitle the holder to a pro rata share of the net proceeds from the sale of Casa Ley. In the event that Casa Ley is not sold prior to January 30, 2018, holders of the Casa Ley contingent value rights will be entitled to receive their pro rata portion of the fair market value of such remaining interest minus certain fees, expenses and assumed taxes that would have been deducted from the proceeds of a sale of Casa Ley. The PDC contingent value right will entitle the holder to a pro rata share of the net proceeds from any deferred consideration relating to the previous sale of the PDC assets. At the time of the acquisition, Safeway operated 1,325 supermarkets under the banners Safeway, Vons, Pavilions, Randalls, Tom Thumb and Carrs Quality Centers, with an extensive network of distribution, manufacturing and food processing facilities. Safeway also owned and operated GroceryWorks.com Operating Company, LLC an online grocery channel. The acquisition was financed through a combination of debt financing and equity contributions from existing members.
| F-46 | (Continued) |
Table of Contents
AB ACQUISITION LLC AND SUBSIDIARIES
Notes to Consolidated Financial Statements
The Safeway acquisition allows the Company to expand into various new and existing markets and provides the Company access to a broad range of brands and own brand products. The acquisition was accounted for under the acquisition method of accounting. In a business combination, the purchase price is allocated to the fair values of the identifiable assets and liabilities, with any excess of purchase price over the fair value recognized as goodwill. The fair values of the identifiable assets and liabilities assumed were based on the Company’s estimates and assumptions using various market, income and cost valuation approaches. The following table summarizes the assets acquired and liabilities assumed at the date of the Safeway acquisition (in millions):
| January 30, 2015 | ||||
| Cash |
$ | 2,202.9 | ||
| Receivables |
348.4 | |||
| Inventories |
2,493.7 | |||
| Other current assets |
614.1 | |||
| Property and equipment |
8,078.2 | |||
| Intangible assets |
3,102.2 | |||
| Other assets |
719.6 | |||
|
|
|
|||
| Total assets acquired |
17,559.1 | |||
| Current liabilities |
3,009.9 | |||
| Long-term capital lease obligations |
514.2 | |||
| Long-term debt |
2,470.3 | |||
| Long-term deferred taxes |
1,782.6 | |||
| Other long-term liabilities |
2,204.9 | |||
|
|
|
|||
| Total liabilities assumed |
9,981.9 | |||
|
|
|
|||
| Net assets purchased |
7,577.2 | |||
| Goodwill |
957.2 | |||
|
|
|
|||
| Total purchase consideration |
$ | 8,534.4 | ||
|
|
|
|||
| The identifiable intangible assets acquired consisted of the following as of the date of the Safeway acquisition (in millions): |
| |||
| Trade names |
$ | 1,458.0 | ||
| Beneficial lease rights |
367.2 | |||
| Customer lists, including prescription files and licenses |
865.2 | |||
| Internally developed software and loyalty program technology |
375.3 | |||
|
|
|
|||
| Total finite intangible assets |
3,065.7 | |||
| Liquor licenses |
36.5 | |||
|
|
|
|||
| Total identifiable intangible assets |
$ | 3,102.2 | ||
|
|
|
|||
The above amounts represent the Company’s allocation of purchase price. The goodwill recorded of $957.2 million is primarily attributable to the operational and administrative synergies expected to arise from the acquisition. The acquisition is treated as a stock purchase for income tax purposes, and the assets acquired and liabilities assumed as part of the acquisition did not result in a step up of tax basis, and goodwill is not deductible for tax purposes. Third-party acquisition-related costs of $110.5 million in fiscal 2014 and $5.9 million in fiscal 2013 were expensed as incurred as a component of Selling and administrative expenses.
| F-47 | (Continued) |
Table of Contents
AB ACQUISITION LLC AND SUBSIDIARIES
Notes to Consolidated Financial Statements
As part of the Safeway acquisition, the Company assumed long-term debt and long-term capital lease obligations with fair values of $2,470.3 million and $514.2 million, respectively. Immediately following the acquisition, the Company redeemed $864.6 million of assumed debt and paid accrued interest and breakage fees of $8.6 million.
Safeway contributed revenues of $2,696.0 million and an operating loss of $184.2 million for the period from January 31, 2015 to February 28, 2015.
Unaudited Supplemental Pro Forma Information
The pro forma financial information as presented below is for informational purposes only and is not indicative of operations that would have been achieved from the Safeway acquisition had they occurred at the beginning of fiscal 2013. The pro forma results exclude the results of operations for the divested stores and PDC. Supplemental information on an unaudited pro forma basis is as follows (in millions):
| Fiscal 2014 | Fiscal 2013 | |||||||
| Net sales and other revenue |
$ | 57,496.9 | $ | 52,145.4 | ||||
| (Loss) income from continuing operations, net of tax |
$ | (281.5 | ) | $ | 739.3 | |||
The unaudited pro forma supplemental amounts have been calculated to reflect interest expense and additional depreciation and amortization that would have been charged assuming the fair value adjustments to the acquired assets and assumed liabilities and related financing events had been applied from the beginning of fiscal 2013 with the related tax effects.
United acquisition
On December 29, 2013, the Company, through its wholly owned subsidiary, Albertson’s LLC, acquired United for $362.1 million in cash (“United acquisition”). At the time of the acquisition, United operated 51 traditional, specialty and Hispanic retail food stores under its United Supermarkets, Market Street and Amigos banners, seven convenience stores and 26 fuel centers under its United Express banner and three distribution centers. United is located in 30 markets across north and west Texas.
The acquisition of United, with its focus on selection, quality and customer service, allowed the Company to add a complementary base of stores in Texas. To fund the United acquisition, the Company amended its Term Loan and Asset-Based Revolving Credit Agreement on December 27, 2013.
| F-48 | (Continued) |
Table of Contents
AB ACQUISITION LLC AND SUBSIDIARIES
Notes to Consolidated Financial Statements
The following table summarizes the final allocation of the fair value of the assets acquired and liabilities assumed (in millions):
| December 29, 2013 | ||||
| Cash and cash equivalents |
$ | 19.6 | ||
| Receivables |
28.6 | |||
| Inventories |
117.8 | |||
| Other current assets |
3.5 | |||
| Property and equipment |
241.8 | |||
| Intangible assets |
74.2 | |||
| Other assets |
4.5 | |||
|
|
|
|||
| Total assets acquired |
490.0 | |||
|
|
|
|||
| Current liabilities |
118.9 | |||
| Long-term capital lease obligations |
5.9 | |||
| Other long-term liabilities |
71.0 | |||
|
|
|
|||
| Total liabilities assumed |
195.8 | |||
|
|
|
|||
| Total identifiable net assets |
294.2 | |||
| Goodwill |
67.9 | |||
|
|
|
|||
| Total purchase consideration |
$ | 362.1 | ||
|
|
|
|||
The identifiable intangible assets acquired consisted of the following as of the acquisition date (in millions):
| Trade names |
$ | 32.9 | ||
| Beneficial lease rights |
13.5 | |||
| Customer prescription files |
27.8 | |||
|
|
|
|||
| Total identifiable intangible assets |
$ | 74.2 | ||
|
|
|
The goodwill recorded as part of the acquisition was attributable to the United workforce and the operational synergies expected from the acquisition, and is not tax deductible. Acquisition-related costs for the United acquisition of $10.3 million in fiscal 2013 were expensed as incurred as a component of Selling and administrative expenses.
Vons REIT, Inc. acquisition
On October 10, 2013, the Company purchased all of the stock of Vons REIT, Inc. (“Vons”) for $30.0 million in cash. Vons owned and operated four Dominick’s-bannered stores in the Chicago metropolitan area at the time of the acquisition. The Vons acquisition was accounted for under the acquisition method of accounting. The identifiable tangible and intangible assets acquired and liabilities assumed were at fair value based on management’s estimates and assumptions using a combination of market, income and cost valuation approaches. No goodwill was recorded as a result of the Vons acquisition.
| F-49 | (Continued) |
Table of Contents
AB ACQUISITION LLC AND SUBSIDIARIES
Notes to Consolidated Financial Statements
NAI acquisition
On March 21, 2013, the Company acquired from SuperValu all of the issued and outstanding shares of NAI pursuant to a Stock Purchase Agreement for a total purchase consideration of $253.6 million, including $69.9 million of working capital adjustments, and assumed debt and capital lease obligations with a carrying value prior to the acquisition date of $3.2 billion. The purchase consideration was primarily cash and a short-term payable that was fully paid as of February 20, 2014. The estimated fair value of debt and capital leases assumed was $2.6 billion on the acquisition date of March 21, 2013. Subsequent to the original issuance of its fiscal 2013 consolidated financial statements, the Company determined there was $102.9 million of cash paid for the NAI acquisition that was classified as a cash outflow from operating activities that should have been classified as a cash outflow from investing activities. As a result, the Company corrected the presentation of the fiscal 2013 Consolidated Statement of Cash Flows to classify the $102.9 million as a cash flow from investing activities. This correction had no impact on the Company’s Consolidated Balance Sheets or Consolidated Statements of Operation and Comprehensive (Loss) Income for any periods presented. The Company has evaluated the correction and concluded that it is not material.
The NAI acquisition was accounted for under the acquisition method of accounting. The fair values of the identifiable tangible and intangible assets acquired and liabilities assumed were based on management’s estimates and assumptions using various market, income and cost valuation approaches.
The following table summarizes the final allocation of the fair value of assets acquired and liabilities assumed in the NAI acquisition (in millions):
| March 21, 2013 | ||||
| Cash |
$ | 111.2 | ||
| Receivables |
215.2 | |||
| Inventories |
1,408.6 | |||
| Other current assets |
69.2 | |||
| Property and equipment |
4,615.0 | |||
| Intangible assets |
1,502.9 | |||
| Other assets |
389.6 | |||
|
|
|
|||
| Total assets acquired |
8,311.7 | |||
| Current liabilities |
1,498.3 | |||
| Long-term capital lease obligations |
430.0 | |||
| Long-term debt |
2,036.4 | |||
| Long-term deferred taxes |
313.6 | |||
| Other long-term liabilities |
1,774.1 | |||
|
|
|
|||
| Total liabilities assumed |
6,052.4 | |||
|
|
|
|||
| Net assets acquired |
2,259.3 | |||
| Excess of net assets acquired over purchase consideration |
2,005.7 | |||
|
|
|
|||
| Total purchase consideration |
$ | 253.6 | ||
|
|
|
|||
| F-50 | (Continued) |
Table of Contents
AB ACQUISITION LLC AND SUBSIDIARIES
Notes to Consolidated Financial Statements
The identifiable intangible assets acquired consisted of the following as of the acquisition date (in millions):
| March 21, 2013 | ||||
| Trade names |
$ | 407.0 | ||
| Beneficial lease rights |
519.3 | |||
| Customer lists, including prescription files, covenants not to compete and naming rights |
552.5 | |||
|
|
|
|||
| Total of finite life intangible assets |
1,478.8 | |||
| Restricted covenants and liquor licenses |
24.1 | |||
|
|
|
|||
| Total identifiable intangible assets |
$ | 1,502.9 | ||
|
|
|
|||
The Company recognized a bargain purchase gain of $2,005.7 million as the amount by which the fair value of the net assets acquired exceeded the purchase consideration paid. The bargain purchase was recognized as a gain within the Consolidated Statements of Operations and Comprehensive (Loss) Income. The Company believes it was able to acquire the net assets for lower than fair value due to the seller’s financial condition, together with the Company’s historical experience and position with the acquired banners. These factors resulted in NAI being marketed in a limited manner without exposure to the usual and customary marketing conditions. The Company incurred $34.0 million of acquisition-related costs to complete the NAI acquisition, and these costs were expensed as incurred in the Company’s results of operations.
Unaudited Supplemental Pro Forma Information
The pro forma financial information as presented below is for informational purposes only and is not indicative of operations that would have been achieved from the NAI, Vons and United acquisitions had they all occurred at the beginning of fiscal 2012. Supplemental information on an unaudited pro forma basis is as follows (in millions):
| Fiscal 2013 | Fiscal 2012 | |||||||
| Net sales and other revenue |
$ | 22,653.3 | $ | 22,412.0 | ||||
| Loss from continuing operations, net of tax |
$ | 571.2 | $ | 177.3 | ||||
The unaudited pro forma supplemental amounts have been calculated to reflect interest expense and additional depreciation and amortization that would have been charged assuming the fair value adjustments to the acquired assets and assumed liabilities and related financing events had been applied from the beginning of fiscal 2012 with the related tax effects.
Note 3—Lease Exit Costs and Properties Held for Sale
Lease Exit Costs
Changes to the Company’s lease exit cost reserves for closed properties consisted of the following (in millions):
| February 28, 2015 | February 20, 2014 | |||||||
| Beginning balance |
$ | 55.1 | $ | 11.4 | ||||
| Additions |
22.9 | 46.9 | ||||||
| Payments |
(21.4 | ) | (1.1 | ) | ||||
| Disposals, transferred to held for sale |
(13.1 | ) | (2.1 | ) | ||||
|
|
|
|
|
|||||
| Ending balance |
$ | 43.5 | $ | 55.1 | ||||
|
|
|
|
|
|||||
| F-51 | (Continued) |
Table of Contents
AB ACQUISITION LLC AND SUBSIDIARIES
Notes to Consolidated Financial Statements
The Company closed 12 non-strategic stores in fiscal 2014, 45 in fiscal 2013 and 13 in fiscal 2012. Lease exit costs related to closed properties were recorded at the time of closing. Additions to the lease exit cost reserves for closed properties were recorded as a component of Selling and administrative expenses.
Properties Held for Sale
On December 19, 2014, in connection with the pending Safeway acquisition, the Company, together with Safeway, announced that they entered into agreements to sell 111 Albertsons and 57 Safeway stores across eight states to four separate buyers. Divestiture of these stores was required by the Federal Trade Commission as a condition of closing the Safeway acquisition and was contingent upon the completion of the Safeway acquisition. The aggregate sales price of these stores is $327.5 million plus the book value of inventory. The proceeds from the sale will be used to pay outstanding borrowings under Albertson’s Term Loans and Albertson’s Asset-Based Loan Facility per the respective terms of the credit facilities. As a result, the Company recorded an impairment loss on the Albertsons stores of $233.4 million during the fourth quarter of fiscal 2014. The related assets and liabilities have been classified as held for sale, net of the impairment loss. No gain or loss was recorded for the Safeway stores, as the related assets and liabilities were recorded for purchase accounting at fair value less the cost to sell. The divestiture of these stores commenced upon completion of the Safeway acquisition and closed in the first fiscal quarter of 2015 in accordance with the asset purchase agreements. Revenue and income before taxes associated with the divested Albertsons stores included in the Company’s fiscal 2014 results were $2,070.1 million and $25.9 million, respectively. Revenue and income before taxes associated with the divested Safeway stores for the four weeks ended February 28, 2015 were $89.1 million and $2.8 million, respectively.
Assets held for sale and liabilities held for sale are recorded in Other current assets and Other current liabilities, respectively, and consisted of the following (in millions):
| February 28, 2015 | February 20, 2014 | |||||||
| Assets held for sale: |
||||||||
| Beginning balance |
$ | 9.3 | $ | 26.3 | ||||
| Transfers in |
558.1 | 35.4 | ||||||
| Disposals |
(46.2 | ) | (52.4 | ) | ||||
|
|
|
|
|
|||||
| Ending balance |
$ | 521.2 | $ | 9.3 | ||||
|
|
|
|
|
|||||
| Liabilities held for sale: |
||||||||
| Beginning balance |
$ | 2.1 | $ | — | ||||
| Transfers in |
103.2 | 2.1 | ||||||
| Disposals |
(14.9 | ) | — | |||||
|
|
|
|
|
|||||
| Ending balance |
$ | 90.4 | $ | 2.1 | ||||
|
|
|
|
|
|||||
Discontinued Operations
The Company adopted ASU 2014-8, Subtopic 205-20 on February 21, 2014, which changed the requirements for reporting discontinued operations. Based on the guidelines set forth in ASU 2014-8, the Company did not have any discontinued operations in fiscal 2014. For fiscal 2013 and 2012, the results of operations and related costs of stores or groups of stores that were held for sale or closed
| F-52 | (Continued) |
Table of Contents
AB ACQUISITION LLC AND SUBSIDIARIES
Notes to Consolidated Financial Statements
were reported as Income from discontinued operations, net of tax. The notes to the consolidated financial statements exclude discontinued operations for all prior periods, unless otherwise noted.
The results of discontinued operations are summarized as follows (in millions):
| Fiscal 2013 | Fiscal 2012 | |||||||
| Net sales |
$ | 52.7 | $ | 55.0 | ||||
| Income from discontinued operations, net of tax |
$ | 19.5 | $ | 49.2 | ||||
Note 4—Property and Equipment
Property and equipment consisted of the following (in millions):
| February 28, 2015 | February 20, 2014 | |||||||
| Land |
$ | 2,951.1 | $ | 1,134.5 | ||||
| Buildings |
5,464.8 | 2,464.2 | ||||||
| Property under construction |
233.6 | 50.7 | ||||||
| Leasehold improvements |
1,023.7 | 155.0 | ||||||
| Fixtures and equipment |
2,551.3 | 920.3 | ||||||
| Buildings under capital leases |
872.0 | 440.4 | ||||||
|
|
|
|
|
|||||
| Total property and equipment |
13,096.5 | 5,165.1 | ||||||
| Accumulated depreciation and accumulated amortization of capitalized lease assets |
(1,072.3 | ) | (618.4 | ) | ||||
|
|
|
|
|
|||||
| Total property and equipment, net |
$ | 12,024.2 | $ | 4,546.7 | ||||
|
|
|
|
|
|||||
Depreciation expense was $523.1 million, $526.1 million and $15.5 million for fiscal 2014, 2013 and 2012, respectively. Amortization expense related to capitalized lease assets was $45.5 million and $35.8 million in fiscal 2014 and 2013, respectively. Amortization expense related to capitalized lease assets in fiscal 2012 was not material. Fixed asset impairment charges of $227.7 million, $2.0 million and $1.8 million were recorded as a component of Selling and administrative expenses in fiscal 2014, 2013 and 2012, respectively. Fiscal 2014 impairment losses related primarily to the divestiture of the Albertsons stores.
Note 5—Goodwill and Intangible Assets
The following table summarizes the changes in the Company’s goodwill balances (in millions):
| February 28, 2015 | February 20, 2014 | |||||||
| Balance at beginning of year |
$ | 71.4 | $ | 3.5 | ||||
| Activity during the year |
957.2 | 67.9 | ||||||
|
|
|
|
|
|||||
| Balance at end of year |
$ | 1,028.6 | $ | 71.4 | ||||
|
|
|
|
|
|||||
| F-53 | (Continued) |
Table of Contents
AB ACQUISITION LLC AND SUBSIDIARIES
Notes to Consolidated Financial Statements
The Company’s Intangible assets consisted of the following (in millions):
| February 28, 2015 | February 20, 2014 | |||||||||||||||||||||||||||
| Estimated useful lives (Years) |
Gross carrying amount |
Accumulated amortization |
Net | Gross carrying amount |
Accumulated amortization |
Net | ||||||||||||||||||||||
| Trade names |
40 | $ | 1,900.8 | $ | (24.4 | ) | $ | 1,876.4 | $ | 441.7 | $ | (10.8 | ) | $ | 430.9 | |||||||||||||
| Beneficial lease rights |
12 | 868.8 | (124.7 | ) | 744.1 | 587.8 | (89.1 | ) | 498.7 | |||||||||||||||||||
| Customer prescription files |
5 | 1,395.2 | (212.9 | ) | 1,182.3 | 577.2 | (103.1 | ) | 474.1 | |||||||||||||||||||
| Covenants not to compete |
5 | 1.3 | (0.7 | ) | 0.6 | 1.0 | (0.2 | ) | 0.8 | |||||||||||||||||||
| Internally developed software |
5 | 375.3 | (5.8 | ) | 369.5 | — | — | — | ||||||||||||||||||||
|
|
|
|
|
|
|
|
|
|
|
|
|
|||||||||||||||||
| Total finite-lived intangible assets |
4,541.4 | (368.5 | ) | 4,172.9 | 1,607.7 | (203.2 | ) | 1,404.5 | ||||||||||||||||||||
| Liquor licenses and restricted covenants |
Indefinite | 62.1 | — | 62.1 | 28.3 | — | 28.3 | |||||||||||||||||||||
|
|
|
|
|
|
|
|
|
|
|
|
|
|||||||||||||||||
| Total intangible assets, net |
$ | 4,603.5 | $ | (368.5 | ) | $ | 4,235.0 | $ | 1,636.0 | $ | (203.2 | ) | $ | 1,432.8 | ||||||||||||||
|
|
|
|
|
|
|
|
|
|
|
|
|
|||||||||||||||||
In connection with the acquisitions, total Intangible assets acquired of $4,679.3 million were valued at fair value at the respective acquisition dates.
Amortization expense for intangible assets with finite useful lives was $201.2 million, $157.1 million and $0.7 million for fiscal 2014, 2013 and 2012, respectively. Estimated future amortization expense associated with the net carrying amount of intangibles with finite lives is as follows (in millions):
| Fiscal Year |
Amortization Expected |
|||
| 2015 |
$ | 494.7 | ||
| 2016 |
480.4 | |||
| 2017 |
473.9 | |||
| 2018 |
375.3 | |||
| 2019 |
333.9 | |||
| Thereafter |
2,014.7 | |||
|
|
|
|||
| Total |
$ | 4,172.9 | ||
|
|
|
|||
During fiscal 2014, the Company had intangible asset impairment charges of $39.2 million, the majority of which related to the Albertsons divested stores. There were no intangible asset impairment charges for fiscal 2013 or 2012.
The Company had long-term liabilities for unfavorable operating lease intangibles related to above-market leases of $775.4 million and $369.2 million at February 28, 2015 and February 20, 2014, respectively. Amortization of unfavorable operating leases recorded as a reduction of expense was $51.8 million, $40.9 million and $1.3 million for fiscal 2014, 2013 and 2012, respectively.
| F-54 | (Continued) |
Table of Contents
AB ACQUISITION LLC AND SUBSIDIARIES
Notes to Consolidated Financial Statements
Note 6—Fair Value Measurements
The accounting guidance for fair value established a framework for measuring fair value and established a three-level valuation hierarchy for disclosure of fair value measurement. The valuation hierarchy is based upon the transparency of inputs to the valuation of an asset or liability at the measurement date. The three levels are defined as follows:
| Level 1— | Quoted prices in active markets for identical assets or liabilities; | |
| Level 2— | Inputs other than quoted prices included within Level 1 that are either directly or indirectly observable; | |
| Level 3— | Unobservable inputs in which little or no market activity exists, requiring an entity to develop its own assumptions that market participants would use to value the asset or liability. | |
Fair value is defined as the price that would be received to sell an asset or paid to transfer a liability in an orderly transaction between market participants at the measurement date.
The following table presents assets and liabilities which are measured at fair value on a recurring basis at February 28, 2015 (in millions):
| Fair Value Measurements | ||||||||||||||||
| Total | Quoted prices in active markets for identical assets (Level 1) |
Significant observable inputs (Level 2) |
Significant unobservable inputs (Level 3) |
|||||||||||||
| Assets: |
||||||||||||||||
| Cash equivalents: |
||||||||||||||||
| Money market |
$ | 565.0 | $ | 565.0 | $ | — | $ | — | ||||||||
| Short-term investments (1) |
24.1 | 17.1 | 7.0 | — | ||||||||||||
| Non-current investments (2) |
55.3 | 8.4 | 46.9 | — | ||||||||||||
|
|
|
|
|
|
|
|
|
|||||||||
| Total |
$ | 644.4 | $ | 590.5 | $ | 53.9 | $ | — | ||||||||
|
|
|
|
|
|
|
|
|
|||||||||
| Liabilities: |
||||||||||||||||
| Derivative contracts (3) |
$ | 121.7 | $ | — | $ | 121.7 | $ | — | ||||||||
| Contingent consideration (4) |
270.9 | — | — | 270.9 | ||||||||||||
|
|
|
|
|
|
|
|
|
|||||||||
| Total |
$ | 392.6 | $ | — | $ | 121.7 | $ | 270.9 | ||||||||
|
|
|
|
|
|
|
|
|
|||||||||
| (1) | Classified as available-for-sale securities and included in Other current assets on the Consolidated Balance Sheet. |
| (2) | Classified as available-for-sale securities and included in Other assets on the Consolidated Balance Sheet. |
| (3) | Included in Other current liabilities on the Consolidated Balance Sheet. |
| (4) | Included in Other long-term liabilities on the Consolidated Balance Sheet. |
In fiscal 2013, the Company classified available-for-sale securities within Level 1 of the fair value hierarchy, as the estimated fair value was determined using quoted market prices from the underlying over-the-counter publicly traded securities. As of February 20, 2014, the fair value of the Company’s available-for-sale securities was $5.3 million.
| F-55 | (Continued) |
Table of Contents
AB ACQUISITION LLC AND SUBSIDIARIES
Notes to Consolidated Financial Statements
The Company records its CVR obligations at fair value using a combined income and market approach. The CVR obligation is estimated using the income approach of a discounted cash flow model with a weighted average cost of capital of 10.0%, and a guideline company method resulting in adjusted total invested capital. As of February 28, 2015, the estimated fair value of the CVR obligations were $270.9 million. The above inputs used for determining the fair value of the CVR obligations are Level 3 fair value measurements. Changes in the fair value of the CVR obligations can result from changes to the discount rates, as well as the Mexican currency value relative to the US Dollar.
A reconciliation of the beginning and ending balances for Level 3 liabilities for the fiscal year ended February 28, 2015 follows (in millions):
| Contingent consideration |
||||
| Balance, beginning of year |
$ | — | ||
| Additions |
270.9 | |||
|
|
|
|||
| Balance, end of year |
$ | 270.9 | ||
|
|
|
|||
For fiscal 2013, for certain of the Company’s financial instruments, including cash and cash equivalents, receivables, accounts payable, accrued salaries and wages and other current assets and liabilities, the fair values approximate carrying values due to their short-term maturities.
The estimated fair value of the Company’s debt, including current maturities, was based on Level 2 inputs, being market quotes or values for similar instruments, and interest rates currently available to the Company for the issuance of debt with similar terms and remaining maturities as a discount rate for the remaining principal payments. At February 28, 2015, the fair value of total debt was $12,095.2 million compared to a carrying value of $11,782.1 million. At February 20, 2014, the fair value of total debt was $3,267.4 million compared to the carrying value of $3,279.8 million.
Assets Measured at Fair Value on a Nonrecurring Basis
Except in relation to assets classified as held-for-sale and held-and-used, no assets have been adjusted to fair value on a nonrecurring basis. The Company’s held-for-sale assets are classified as Level 3 of the fair value hierarchy and are valued primarily based on estimated selling prices less costs of disposal.
Note 7—Derivative Financial Instruments
Interest Rate Risk Management
The Company is exposed to market risk from fluctuations in interest rates. The Company manages its exposure to interest rate fluctuations through the use of interest rate swaps (“Cash Flow Hedges”). The Company’s risk management objective and strategy with respect to interest rate swaps is to protect the Company against adverse fluctuations in interest rates by reducing its exposure to variability in cash flows relating to interest payments on a portion of its outstanding debt. The Company is meeting its objective by hedging the risk of changes in its cash flows (interest payments) attributable to changes in the LIBOR rate, the designated benchmark interest rate being hedged (the “hedged risk”), on an amount of the Company’s debt principal equal to the then-outstanding swap notional.
| F-56 | (Continued) |
Table of Contents
AB ACQUISITION LLC AND SUBSIDIARIES
Notes to Consolidated Financial Statements
Deal-Contingent Swap
On April 16, 2014, the Company entered into a deal-contingent interest rate swap (“Deal- Contingent Swap”) used to hedge against adverse fluctuations in interest rates by reducing its exposure to variability in cash flows relating to interest payments on anticipated variable rate debt issuances in connection with the Safeway acquisition. In accordance with the swap agreement, the Company receives a floating rate of interest and pays a fixed rate of interest for the life of the contract. The aggregate notional amount of the Deal-Contingent Swap is $2,960.2 million. At the close of the Safeway acquisition, the Company designated it as a cash flow hedge. The fair value of the swap on the designation date was $96.1 million with changes in fair value recorded through earnings for the period prior to the designation date. This charge is included in Other expense, net in the fiscal 2014 Consolidated Statement of Operations and Comprehensive (Loss) Income.
Cash Flow Interest Rate Swaps
On April 3, 2014 and July 2, 2014, the Company entered into several additional swaps with notional amounts of $446.0 million, $993.0 million and $841.5 million, maturing in March 2016, March 2019 and June 2021, respectively, to hedge against variability in cash flows relating to interest payments on a portion of the Company’s outstanding variable rate term debt. The aggregate notional amount of the Swaps, including the Deal-Contingent Swap, is $5,240.7 million, of which $5,182.7 million are designated as Cash Flow Hedges as defined by GAAP. The undesignated portion of the Company’s interest rate swaps is attributable to principal payments expected to be made through the loan’s maturity.
As of February 28, 2015, the fair value of the cash flow interest rate swaps of $116.5 million is recorded in Other current liabilities. The Company did not have interest rate swaps as of or prior to February 20, 2014.
Activity related to the Company’s derivative instruments designated as Cash Flow Hedges during the fiscal year ended February 28, 2015 consisted of the following (in millions):
| Derivatives Designated as Hedging Instruments |
Amount of Loss Recognized from Derivatives Fiscal 2014 |
Location of Loss Recognized from Derivatives |
||||||
| Designated interest rate swaps |
$ | (20.6 | ) | |
Other comprehensive (loss) income, net of tax |
| ||
Activity related to the Company’s derivative instruments not designated as hedging instruments during the fiscal year ended February 28, 2015 consisted of the following (in millions):
| Derivatives Not Designated as Hedging Instruments |
Amount of Loss Recognized from Derivatives Fiscal 2014 |
Location of Loss Recognized from Derivatives |
||||||
| Deal-Contingent Swap (through date of designation) |
$ | (96.1 | ) | Other expense, net | ||||
| Undesignated and ineffective portion of interest rate swaps |
(0.9 | ) | Other expense, net | |||||
| F-57 | (Continued) |
Table of Contents
AB ACQUISITION LLC AND SUBSIDIARIES
Notes to Consolidated Financial Statements
Note 8—Long-Term Debt
The Company’s long-term debt as of February 28, 2015 and February 20, 2014, net of debt discounts of $376.4 million and $322.9 million, respectively, and deferred financing costs of $187.8 million and $47.7 million, respectively, consisted of the following (in millions):
| February 28, 2015 |
February 20, 2014 |
|||||||
| Albertson’s Term Loans, Due 2019 to 2021, interest range of 4.25% to 5.5% |
$ | 6,077.0 | $ | 1,390.6 | ||||
| Albertson’s Asset-Based Loan Facility, average interest rate of 1.94% and 2.29%, respectively |
980.0 | 210.0 | ||||||
| NAI Asset-Based Loan Facility, average interest rate of 3.1875% |
— | 150.0 | ||||||
| NAI 4.75% Senior Secured Term Loan Due 2021 |
822.9 | — | ||||||
| NAI 7.45% Debentures due 2029 |
530.3 | 516.5 | ||||||
| Albertson’s 7.75% Senior Secured Notes Due 2022 |
583.6 | — | ||||||
| Safeway 7.25% Debentures Due 2031 |
573.8 | — | ||||||
| NAI 8.00% Debentures Due 2031 |
346.5 | 340.4 | ||||||
| NAI 6.34% to 7.15% Medium-Term Notes due 2017—2028 |
244.1 | 236.8 | ||||||
| Safeway 5.0% Senior Notes Due 2019 |
271.2 | — | ||||||
| NAI 8.70% Debentures Due 2030 |
204.6 | 202.1 | ||||||
| NAI 7.75% Debentures Due 2026 |
166.1 | 161.6 | ||||||
| Safeway 7.45% Senior Debentures Due 2027 |
153.0 | — | ||||||
| Safeway 3.95% Senior Notes Due 2020 |
138.2 | — | ||||||
| Safeway 4.75% Senior Notes Due 2021 |
131.3 | — | ||||||
| Safeway 6.35% Notes Due 2017 |
106.8 | — | ||||||
| Safeway 3.4% Senior Notes Due 2016 |
79.9 | — | ||||||
| American Stores 8.00% Debentures Due 2026 |
3.6 | 3.7 | ||||||
| American Stores 7.90% Debentures Due 2017 |
1.9 | 2.0 | ||||||
| Other Notes Payable, Unsecured |
155.1 | — | ||||||
| Mortgage Notes Payable, Secured |
24.4 | 18.4 | ||||||
|
|
|
|
|
|||||
| Total debt |
11,594.3 | 3,232.1 | ||||||
| Less current maturities |
(502.9 | ) | (32.3 | ) | ||||
|
|
|
|
|
|||||
| Long-term portion |
$ | 11,091.4 | $ | 3,199.8 | ||||
|
|
|
|
|
|||||
The Albertson’s and NAI Term Loans, Albertson’s and NAI Asset-Based Loan Facilities and certain of the outstanding notes and debentures have restrictive covenants, subject to the right to cure in certain circumstances, calling for the acceleration of payments due in the event of a breach of a covenant or a default in the payment of a specified amount of indebtedness due under certain debt arrangements. The Company was in compliance with all such covenants and provisions as of and for the fiscal years ended February 28, 2015 and February 20, 2014.
Each of the credit agreements for the Albertson’s and NAI Asset-Based Loan Facilities and Albertson’s and NAI Term Loans restrict the ability of Albertson’s or NAI, as the case may be, and the indenture for the 2022 Notes restricts the ability of Albertson’s Holdings, to pay dividends and distribute property to their respective equity holders. Each of the agreements contains customary exceptions for such dividends and distributions, including up to specified maximum dollar amounts or if certain financial ratios are satisfied. As a result, all of the Company’s consolidated net assets are effectively restricted with respect to their ability to be transferred to the parent company, AB Acquisition LLC. AB Acquisition LLC has no separate assets other than its investments in its subsidiaries, and all of its business operations are conducted through its operating subsidiaries.
| F-58 | (Continued) |
Table of Contents
AB ACQUISITION LLC AND SUBSIDIARIES
Notes to Consolidated Financial Statements
Albertson’s Term Loans
On March 21, 2013, in conjunction with the NAI acquisition, Albertson’s entered into a Term Loan Agreement in the amount of $1,150.0 million, consisting of Term B Loans with an interest rate of LIBOR plus 4.50% and an expiration date of March 21, 2016. On May 9, 2013, Albertson’s amended the original Term Loan (“Amendment 1”), dividing the Term B Loan into Term B-1 and Term B-2 Loans. A Term B-1 Loan of $450.0 million was re-priced with an interest rate of LIBOR plus 3.25% and an expiration date of March 21, 2016. A Term B-2 Loan of $700.0 million was re-priced with an interest rate of LIBOR plus 3.75% and an expiration date of March 21, 2019. The Term Loans include a floor on LIBOR set at 1.0%. On September 19, 2013, Albertson’s entered into a second amendment to update certain restrictive covenants in Amendment 1, and on December 27, 2013, Albertson’s entered into a third amendment to increase the outstanding borrowings on the Term B-2 Loans to $996.5 million, with all other terms remaining the same. The Term Loans require annual principal payments of 1.0% of the original amended loan balance, paid quarterly.
On May 5, 2014, Albertson’s entered into a fourth amendment converting the B-1 Loan into the B-2 Loan for a total principal amount of $1,440.6 million. The terms on the Term B-2 Loan remain consistent with Amendment 1.
On August 25, 2014, Albertson’s amended and restated the Term Loan facility (“fifth amendment”), which provided funds for the Safeway acquisition to be held in escrow, consisting of a $950.0 million Term B-3 Loan and a $3,609.0 million Term B-4 Loan, with an original debt discount of $68.4 million. Prior to the release from escrow upon consummation of the Safeway acquisition, the Term B-3 and B-4 Loans accrued fees at rates of 4.0% and 4.5% per annum, respectively. Following the release from escrow, borrowings under the Term B-3 Loan now bear interest at the current LIBOR rate, subject to a 1.0% floor, plus 4.0%. Following the release from escrow, borrowings under the Term B-4 Loan now bear interest at the current LIBOR rate, subject to a 1.0% floor, plus 4.5%. The Term B-3 Loan has a maturity date of August 25, 2019, and the Term B-4 Loan has a maturity date of August 25, 2021. The Term B-3 Loan requires annual principal payments starting on June 30, 2015 based on rates ranging from 5.0% to 15.0% of the outstanding balance, paid quarterly. The Term B-4 Loan requires annual principal payments starting on June 30, 2015 of 1.0% of the original amended balance, paid quarterly.
On October 23, 2014, Albertson’s executed an incremental amendment to the Term Loan facility, which created a Term B-4-1 Loan of $300.0 million. The terms are identical to the Term B-4 Loan except for the closing fee on the Term B-4-1 Loan was 0.5%. The $300.0 million Term B-4-1 Loan was funded on October 23, 2014. The proceeds of the Term B-4-1 Loan were released from escrow upon closing of the Safeway acquisition, and all applicable closing fees are netted from any amount repaid. The proceeds from the Term B-4-1 Loan were $298.5 million, net of $1.5 million original issue discount. The Term B-4-1 Loan requires annual principal payments starting June 30, 2015 of 1.0% of the original amended balance, paid quarterly.
Pursuant to the fifth amendment, no principal payments were made on the Term B-2 Loan during the third or fourth quarter of fiscal 2014, and future principal payments are not required until June 2015. On the date of the Safeway acquisition, the Term B-2 Loan was repriced with an interest rate of LIBOR plus 4.375% with a maturity date of March 21, 2019.
The Albertson’s Term Loan facilities are guaranteed by Albertson’s existing and future direct and indirect wholly owned domestic subsidiaries that are not borrowers, subject to certain exceptions. The
| F-59 | (Continued) |
Table of Contents
AB ACQUISITION LLC AND SUBSIDIARIES
Notes to Consolidated Financial Statements
Albertson’s Term Loan facilities are secured by (i) a first-priority lien on substantially all of the assets of the borrowers and guarantors (other than accounts receivable, inventory and related assets of the proceeds thereof (the “Albertson’s ABL priority collateral”)) and (ii) a second-priority lien on substantially all of the Albertson’s ABL priority collateral.
NAI Term Loans
On June 27, 2014, in anticipation of the Safeway acquisition, NAI entered into a Senior Secured Term Loan Agreement in the amount of $850.0 million, with an interest rate of LIBOR, subject to a 1.0% floor, plus 3.75% and an expiration date of June 27, 2021. The borrowings are guaranteed by NAI’s existing and future direct and indirect wholly owned domestic subsidiaries that are not borrowers, subject to certain exceptions. The borrowings are secured by (i) a first-priority lien on (a) all of the borrowers’ and guarantors’ real property, equipment, fixtures and intellectual property, certain other property relating solely to or constituting proceeds of such assets and all proceeds of the foregoing and (b) equity interests in NAI and its subsidiaries and intercompany notes, certain dividends and distributions with respect thereto and proceeds thereof and (ii) a second-priority lien on all of the borrowers’ and guarantors’ accounts, inventory, documents, letters of credit and letters of credit rights, investment property (excluding equity interests in the Company and its subsidiaries), general intangibles (excluding intellectual property), deposit accounts, scripts and prescription files, and certain related assets, and all proceeds of the foregoing (the “NAI ABL priority collateral”). The agreement requires annual principal payments of 1.0% of the original loan balance, paid quarterly.
In conjunction with the new Senior Secured Term Loan Agreement, the Company capitalized an additional $23.0 million of deferred financing costs and $4.3 million of original issue discount.
Asset-Based Loan Facilities
On March 21, 2013, and in conjunction with the NAI acquisition, Albertson’s repaid and replaced an existing ABL Facility of $350.0 million with a new asset-based loan facility in the amount of $850.0 million (the “Albertson’s ABL”), and NAI entered into an asset-based loan facility of $400.0 million (the “NAI ABL”), in each case providing for borrowings collateralized by accounts receivable, customer pharmacy files, inventory and certain other assets.
Albertson’s ABL: The Albertson’s ABL had an interest rate of LIBOR (subject to a 1.0% floor) plus a margin ranging from 1.75% to 2.25% and also provided a letter-of-credit (“LOC”) sub-facility of $400.0 million. On September 19, 2013, Albertson’s amended the Albertson’s ABL and on December 27, 2013, Albertson’s entered into a second amendment to the Albertson’s ABL facility (the “Amended Albertson’s ABL”), increasing the commitment to $950.0 million, with a maturity date of March 21, 2018. The Amended Albertson’s ABL continued to provide for a LOC sub-facility of $400.0 million. The Amended Albertson’s ABL has a loan interest rate of LIBOR plus a margin ranging from 1.75% to 2.25%. The margin is determined by the average daily excess availability percentage for the most recent quarterly period. In addition, a facility fee ranging from 0.25% to 0.375% is charged for any unused portion of the Amended Albertson’s ABL, which is based on the average daily unused amount as a percentage of the aggregate commitments during the most recent fiscal quarter ended. The fees for the Amended Albertson’s ABL LOC sub-facility are based upon the Amended Albertson’s ABL interest rate margin plus a fronting fee of 0.125%. Concurrently with the Safeway acquisition, the Amended Albertson’s ABL was amended and restated to provide for borrowing capacity of up to $3.0 billion and to extend the maturity date to the earlier of January 30, 2020 and the date that is 91 days
| F-60 | (Continued) |
Table of Contents
AB ACQUISITION LLC AND SUBSIDIARIES
Notes to Consolidated Financial Statements
prior to the final maturity of certain material indebtedness (if not prepaid or extended prior to such 91st day). As amended and restated, the Amended Albertson’s ABL has a loan interest rate of LIBOR plus a margin ranging from 1.50% to 2.00% and also provides for a LOC sub-facility of $1.25 billion. Facility and fronting fees remain unchanged. The Amended Albertson’s ABL contains no financial covenants unless and until (i) an event of default under the Amended Albertson’s ABL has occurred and is continuing or (ii) the failure of Albertson’s to maintain excess availability of at least 10.0% of the aggregate commitments at any time or (iii) excess availability is less than $200.0 million. If any such events occur, then Albertson’s is required to maintain a fixed charge coverage ratio of 1.0 to 1.0 until such event of default is cured or waived or the 30th day after the other trigger event ceases to exist.
Borrowings outstanding under the Amended Albertson’s ABL as of February 28, 2015 consisted of loans of $980.0 million and letters of credit issued under the LOC sub-facilities of $272.1 million. Borrowings outstanding under the Amended Albertson’s ABL as of February 20, 2014 consisted of loans of $210.0 million and letters of credit issued under the LOC sub-facilities of $54.3 million.
The Amended Albertson’s ABL is guaranteed by Albertson’s existing and future direct and indirect wholly owned domestic subsidiaries that are not borrowers, subject to certain exceptions. The Amended Albertson’s ABL is secured by (i) a first-priority lien on substantially all of the Albertson’s ABL priority collateral and (ii) a third-priority lien on substantially all other assets (other than real property).
NAI ABL: The NAI ABL has an interest rate ranging from LIBOR plus 1.75% to 2.25% and a facility fee on the unused portion ranging from 0.25% to 0.375%. NAI also entered into a separate LOC facility in the amount of $125.0 million. The NAI LOC facility had an interest rate of 1.75% and a facility fee on the unused portion of 0.25%.
On January 24, 2014, NAI replaced the NAI ABL with an amended ABL facility (the “Amended NAI ABL”) in the amount of $1,200.0 million, which expires on the earlier of January 24, 2019 and the date that is 91 days prior to final maturity of certain material indebtedness (if not prepaid or extended prior to such 91st day). Included in the Amended NAI ABL is a $600.0 million sub-facility for LOCs. In connection with entering into the NAI Term Loan facility, the amount of the Amended NAI ABL was reduced to $1,000.0 million, and $5.0 million of the NAI ABL capitalized deferred financing costs were written off. All other terms of the NAI ABL remained unchanged. Borrowings under the Amended NAI ABL are secured by (i) a first priority lien on the NAI ABL priority collateral and (ii) a second-priority lien on the other collateral securing the NAI Term Loan facility (excluding any real estate that NAI has not elected to include in the borrowing base under the Amended NAI ABL). The Amended NAI ABL interest rate is based upon LIBOR plus a margin of 2.5% to 3.0%. The margin is determined by the average daily excess availability percentage for the most recent quarterly period. In addition, a facility fee ranging from 0.375% to 0.50% is charged for any unused portion of the Amended NAI ABL, which is based on the average daily unused amount as a percentage of the aggregate commitments during the most recent fiscal quarter ended. The fees for the Amended NAI ABL LOC sub-facility are based upon the Amended NAI ABL interest rate margin plus a fronting fee of 0.125%. The Amended NAI ABL had $418.7 million and $431.3 million of outstanding issued LOC as of February 28, 2015 and February 20, 2014, respectively.
In conjunction with the Amended NAI ABL, the Company also entered into a separate amended and restated LOC facility agreement (“Amended NAI LOC facility”) with available credit of $125.0 million and an expiration date of January 24, 2019. The Amended NAI LOC facility has a fee of 1.75%, and a facility fee on the unused portion of 0.25%. The Amended NAI LOC facility had $104.6 million and $120.5 million of outstanding issued LOCs as of February 28, 2015 and February 20, 2014, respectively.
| F-61 | (Continued) |
Table of Contents
AB ACQUISITION LLC AND SUBSIDIARIES
Notes to Consolidated Financial Statements
The Amended NAI ABL contains no covenants unless and until (i) an event of default under the Amended NAI ABL has occurred and is continuing or (ii) the failure of NAI to maintain excess availability of at least 10.0% of the aggregate commitments at any time. If any of such events occur, NAI is required to maintain a fixed charge coverage ratio of 1.0 to 1.0 until such event of default is cured or waived or the 30th day after the other trigger event ceases to exist.
2022 Notes
On October 23, 2014, Albertson’s completed the sale of $1,145.0 million of principal amount of 7.75% Senior Secured Notes (“2022 Notes”) which will mature on October 15, 2022. The net proceeds from the sale of the 2022 Notes were $1,128.4 million, net of $16.6 million of original issue discount. Safeway is a co-issuer of the 2022 Notes. Albertson’s also capitalized an additional $6.3 million of deferred financing costs. Pursuant to the Safeway acquisition, Safeway became a co-obligor on the 2022 Notes. The 2022 Notes are guaranteed by Albertsons’ current and future direct and indirect domestic subsidiaries (other than Safeway), subject to certain exceptions. Interest on the 2022 Notes is payable semi-annually in arrears on April 15 and October 15 of each year, commencing on April 15, 2015. On February 9, 2015, following the Safeway acquisition, Albertson’s redeemed $535.4 million of the 2022 Notes. As of February 28, 2015, the outstanding balance was $609.6 million, before debt discount.
The 2022 Notes are secured by (i) a second-priority lien on substantially all of the assets of Albertson’s, Safeway and the guarantors (other than the Albertson’s ABL priority collateral), and (ii) a third-priority lien on the Albertson’s ABL priority collateral.
Safeway Debt
Safeway has outstanding notes and debentures with a fair value of $2,470.3 million (the “Safeway Debt”). Immediately following the Safeway acquisition, Safeway redeemed $864.6 million of the Safeway Debt.
The Safeway Debt maturing in 2016, 2017 and 2019 is guaranteed by Albertson’s and its subsidiaries that guarantee the 2022 Notes. The Safeway Debt maturing in 2020, 2021, 2027 and 2031 is not guaranteed. The Safeway Debt maturing in 2016, 2017 and 2019 is secured on a pari passu basis with the 2022 Notes by all of the collateral that secures the 2022 Notes. The Safeway Debt maturing in 2020, 2021, 2027 and 2031 is equally and ratably secured on a pari passu basis with the 2022 Notes to the extent of certain of the collateral owned by Safeway and its subsidiaries.
NAI’s Unsecured Debentures and Medium-Term Notes
NAI has outstanding various series of debentures and medium-term notes in the aggregate principal amount of $1,780.6 million, before debt discounts, that were issued by a predecessor entity prior to the NAI acquisition. Such debentures and medium-term notes are unsecured and are not guaranteed. Interest is payable semi-annually in accordance with their respective underlying terms.
American Stores Company, LLC Debentures and Medium Term Notes
At the time of the NAI acquisition, a wholly owned subsidiary of NAI, American Stores Company, LLC (“American Stores”), had outstanding 7.90% Debentures due 2017 (the “2017 Debentures”), 8.00% Debentures due 2026 (the “2026 Debentures”) and 7.10% Medium Term Notes, Series B due 2028 (the “2028 Notes”) totaling $467.4 million.
| F-62 | (Continued) |
Table of Contents
AB ACQUISITION LLC AND SUBSIDIARIES
Notes to Consolidated Financial Statements
On December 13, 2013, American Stores commenced a tender offer to purchase for cash all of its outstanding 2017 Debentures and 2026 Debentures, and 2028 Notes, culminating in the repurchase and retirement of substantially all the related debt for $619.9 million. As a result of the debt repurchase, the Company recorded a loss on extinguishment of debt of $49.1 million. As of February 28, 2015, the non-repurchased balance of $5.0 million continues to be guaranteed by SuperValu and continues to be cash collateralized.
The Company’s debentures and medium-term notes are unsecured and interest is payable semi-annually in accordance with their respective underlying terms.
As of February 28, 2015 the future maturities of long-term debt, excluding deferred financing costs, consisted of the following (in millions):
| 2015 |
$ | 503.4 | ||
| 2016 |
217.1 | |||
| 2017 |
324.3 | |||
| 2018 |
219.1 | |||
| 2019 |
2,286.5 | |||
| Thereafter |
8,608.1 | |||
|
|
|
|||
| Total |
$ | 12,158.5 | ||
|
|
|
Deferred Financing Costs and Interest Expense
Financing costs incurred to obtain all financing other than ABL financing are recognized as a direct reduction from the carrying amount of the debt liability. Deferred financing costs recorded as a reduction of debt were $187.8 million and $47.7 million as of February 28, 2015 and February 20, 2014, respectively.
Financing costs incurred to obtain ABL financing are capitalized and amortized over the term of the related debt facilities, using the effective interest method. Deferred financing costs associated with ABL financing are included in Other assets and were $75.0 million and $51.0 million as of February 28, 2015 and February 20, 2014, respectively. For fiscal 2014, total amortization expense of $65.3 million included $36.8 million of deferred financing costs written off in connection with Term Loan amendments and reductions. For fiscal 2013, total amortization expense of $25.1 million included $9.0 million of deferred financing costs written off in connection with Term Loan amendments. For fiscal 2012, amortization expense of deferred financing costs was $1.3 million.
Interest expense, net consisted of the following (in millions):
| Fiscal 2014 | Fiscal 2013 | Fiscal 2012 | ||||||||||
| ABL facility, senior secured notes, term loans, notes and debentures |
$ | 454.1 | $ | 246.0 | $ | 2.8 | ||||||
| Capital lease obligations |
77.5 | 63.3 | 1.4 | |||||||||
| Amortization and write off of deferred financing costs |
65.3 | 25.1 | 1.2 | |||||||||
| Amortization and write off of debt discount |
6.8 | 1.3 | — | |||||||||
| Loss on extinguishment of debt |
— | 49.1 | — | |||||||||
| Other |
29.5 | 5.3 | 1.8 | |||||||||
|
|
|
|
|
|
|
|||||||
| Total interest expense |
$ | 633.2 | $ | 390.1 | $ | 7.2 | ||||||
|
|
|
|
|
|
|
|||||||
| F-63 | (Continued) |
Table of Contents
AB ACQUISITION LLC AND SUBSIDIARIES
Notes to Consolidated Financial Statements
Note 9—Members’ Equity
Interests in the Company held by its members are presented as “units.” The Company effected a unit split in fiscal 2014, discussed below. All share and per share information set forth in the accompanying Consolidated Financial Statements and the related footnotes thereto, with the exception of this footnote, has been retroactively adjusted to reflect the January 30, 2015 stock split described below.
As of February 23, 2012, the Company had 880 Class A units and 106 Class B units issued and outstanding.
Class A Units
The Class A units represented percentage ownership interests in the Company. The original 880 Class A units were granted on June 1, 2006 to the members of the Company in connection with their initial investments. The holders of the Class A units were entitled to participate first in cash distributions of the Company in connection with their respective ownership percentages: (i) up to an amount equal to the aggregate of the original invested capital not already returned, (ii) accrued distributions based on a rate of 10.0% per annum on the capital not already paid through previous distributions and the aggregate amounts accrued but not yet distributed and (iii) once the minimum amounts were distributed, then pro rata in accordance with their ownership percentage with respect to Class A and Class B units. In the event of a dissolution of the Company and liquidation of its assets, the same distribution terms applied after payment to creditors. The Class A unitholders were also entitled to allocations of profits and losses of the Company for each fiscal period in accordance with the liquidation distribution terms. Class A members held voting rights equal to their percentage ownership of Class A units.
Class B Units
The Class B units represented percentage ownership interests in the Company. One hundred eighteen Class B units were granted to management on June 1, 2006 and vested over four years. At the end of the vesting period, 12 Class B units were forfeited, resulting in 106 outstanding Class B units. The holders of the fully vested units were entitled to participate in cash distributions of the Company based on their respective ownership percentages on a subordinate basis to the Class A members. In the event of a dissolution of the Company and liquidation of its assets, the same distribution terms applied after payment to creditors. The Class B unitholders were also entitled to allocations of profits and losses derived from the Company for each fiscal period in accordance with the liquidation distribution terms. Class B units held no voting rights.
March 2013 Tracking Unit Issuance and Member Contributions
In connection with the NAI acquisition on March 21, 2013, the Class A and Class B units then outstanding were exchanged into Class A and Class B Albertson’s (“ABS”) units, and a new class of Class A and Class B NAI units were issued. Additional Class A ABS units and NAI units were also issued with the investment of $250.0 million from the institutional investors. The Company also granted Class C units to certain executives with participation rights that allow participation in profits subordinate to the Class A ABS and NAI units and the Class B ABS and NAI units.
| F-64 | (Continued) |
Table of Contents
AB ACQUISITION LLC AND SUBSIDIARIES
Notes to Consolidated Financial Statements
Class A and Class B ABS Units
The Class A and Class B ABS units represented percentage ownership interests in the Company. The holders of the Class A and Class B ABS units were entitled to participate in cash distributions of Albertson’s in connection with their respective ownership percentages of Class A and Class B ABS units up to an amount equal to, in aggregate with Class A and Class B ABS distributions and Class A and Class B NAI distributions, $550.0 million plus an annual return of 8.0%. Upon achieving the distribution target, the holders of Class A and Class B ABS units and Class C units shared pro rata in the distributions of ABS. In the event of a dissolution of the Company and liquidation of its assets, the same distribution terms applied after payment to creditors. The Class A and Class B ABS unitholders are entitled to allocations of profits and losses derived from ABS for each fiscal period in accordance with the liquidation distribution terms. The Class A ABS units maintained voting interests that were commensurate with their ownership percentage of Class A ABS units. Class B ABS units held no voting rights.
Class A and Class B NAI Units
The Class A and Class B NAI units represented percentage ownership interests in the Company. The holders of the units were entitled to participate in cash distributions of NAI in connection with their respective ownership percentages of NAI up to an amount equal to, in aggregate with Class A and Class B NAI distributions and Class A and Class B ABS distributions of $550.0 million plus an annual return of 8.0%. Upon achieving the distribution target, the holders of Class A and Class B NAI units and Class C units shared pro rata in the distributions of NAI. In the event of a dissolution of the Company and liquidation of its assets, the same distribution terms applied after payment to creditors. The Class A and Class B NAI unitholders were entitled to allocations of profits and losses derived from NAI for each fiscal period in accordance with the liquidation distribution terms. Class A and Class B NAI units held no voting rights.
Class C Units
The Class C units represented percentage ownership interests in the Company that were issued to management. Holders of the vested Class C units were entitled to participate in cash distributions of ABS and NAI based on their respective ownership percentages on a subordinate basis to the distribution target of $550.0 million and 8.0% annual interest distributed to ABS and NAI unitholders. In the event of a dissolution of the Company and liquidation of its assets, the same distribution terms applied after payment to creditors. The Class C units vested over three years with one-third of the units vesting on each of the subsequent three anniversaries of the grant date. The Class C unitholders were entitled to allocations of profits and losses derived from ABS and NAI for each fiscal period in accordance with the liquidation distribution terms. Class C units held no voting rights.
January 2015 Member Unit Split and Member Contributions
On January 30, 2015, the Company effected a 70,699 for 1 unit split of the Company’s then outstanding Class A and Class B ABS units and Class A and Class B NAI units and effected a 25,598 for 1 unit split of the Company’s then outstanding Class C units (collectively, the “Fiscal 2014 Unit Splits”). In connection with the Safeway acquisition, these units were exchanged into a single class of ABS units and a single class of NAI units. Concurrent with the Safeway acquisition, the Company also established a class of Safeway units and issued equity-based compensation in the form of the Series-1 incentive units and the Investor incentive units.
| F-65 | (Continued) |
Table of Contents
AB ACQUISITION LLC AND SUBSIDIARIES
Notes to Consolidated Financial Statements
Immediately following the Fiscal 2014 Unit Splits, certain investors and management contributed $1,250.0 million and $54.8 million, respectively, in the Company in exchange for additional ABS and NAI units. Management’s contribution of $33.2 million was in connection with the termination of the Company’s long-term incentive plans (“LTIPs”). The remaining contribution of $21.6 million was funded in the form of a loan from the Company to its executive officers for the purchase of 2.8 million units each of ABS units, NAI units and Safeway units and is accounted for as an equity-based compensation award.
The equityholders’ agreement, as amended, with the existing holders of the ABS, NAI, and Safeway units, provides, among other things, for preemptive or anti-dilution rights that entitle the unitholder the right to purchase additional units to give them the same pro rata percentage ownership in the event additional units are issued. Restrictions on the transfer of units require that a member transfer its ABS units, NAI units and Safeway units on a pari passu percentage basis to the total number of ABS units, NAI units and Safeway units to the same holder. Furthermore, if the Company enters into a recapitalization, reorganization, merger, conversion, contribution, exchange and/or other restructuring in connection with an initial public offering (“IPO”), each investor member will receive a proportionate number of shares such that the fair value of the units exchanged will equal the fair value of units received.
The members’ agreement, as amended, established a management board comprised of 10 voting members, representing the institutional and individual investors. In addition, each member will maintain certain voting rights commensurate with the ownership in the Company. No specific voting rights are associated with the share classes described below. The Company has issued an identical number of ABS units, NAI units and Safeway units to its members, each of which holds a similar ownership percentage in each class of unit and has similar features. Each class of unit participates in the profits and losses of the respective subsidiary. The Company characterizes a single unit each of ABS, NAI and Safeway units as a Common unit.
Albertson’s Units (ABS Units)
The ABS Units represent percentage ownership interests in the Company. The holders of the units are entitled to participate in cash distributions of Albertson’s in connection with their respective ownership percentages of ABS units up to an amount, in aggregate with the NAI and Safeway distributions, of $2,308.6 million. Upon achieving aggregate distributions of $2,308.6 million, cash distributions of Albertson’s will be made to unitholders pro rata in proportion to the number of ABS units, vested Series-1 incentive units and Investor incentive units outstanding. In the event of a dissolution of the Company and liquidation of its assets, the same distribution terms will apply after payment to creditors. The ABS unitholders are entitled to allocations of profits and losses derived from Albertson’s for each fiscal period in accordance with the liquidation distribution terms.
New Albertson’s Units (NAI Units)
The NAI units represent percentage ownership interests in the Company. The holders of the units are entitled to participate in cash distributions of NAI in connection with their respective ownership percentages of NAI units up to an amount, in aggregate with the Albertson’s and Safeway distributions, of $2,308.6 million. Upon achieving aggregate distributions of $2,308.6 million, cash distributions of NAI will be made to unitholders pro rata in proportion to the number of NAI units, vested Series-1 incentive units and Investor incentive units outstanding. In the event of a dissolution of the Company
| F-66 | (Continued) |
Table of Contents
AB ACQUISITION LLC AND SUBSIDIARIES
Notes to Consolidated Financial Statements
and liquidation of its assets, the same distribution terms will apply after payment to creditors. The NAI unitholders are entitled to allocations of profits and losses derived from NAI for each fiscal period in accordance with the liquidation distribution terms.
Safeway Units
The Safeway units represent percentage ownership interests in the Company. The holders of the units are entitled to participate in cash distributions of Safeway in connection with their respective ownership percentages of Safeway units up to an amount, in aggregate with the Albertson’s and NAI distributions, of $2,308.6 million. Upon achieving aggregate distributions of $2,308.6 million, cash distributions of Safeway will be made to unitholders pro rata in proportion to the number of Safeway units, vested Series-1 incentive units and Investor incentive units outstanding. In the event of a dissolution of the Company and liquidation of its assets, the same distribution terms will apply after payment to creditors. The Safeway unitholders are entitled to allocations of profits and losses derived from Safeway for each fiscal period in accordance with the liquidation distribution terms.
Series-1 Incentive Units
The Company granted 3.3 million Series-1 incentive units to a member of management, with 16.8 million Series-1 incentive units reserved for future issuance. The holders of the units are entitled to participate in cash distributions of Albertson’s, NAI and Safeway based on their respective ownership percentages of the aggregate of ABS units, NAI units, Safeway units, vested Series-1 incentive units and Investor incentive units outstanding. All distributions are on a subordinate basis to the $2,308.6 million aggregate distributions to Albertson’s, NAI and Safeway unitholders; after which they participate on a pro rata basis. The Series-1 incentive units are accounted for as employee equity-based compensation.
Investor Incentive Units
The Company also granted 14.9 million Investor incentive units to five institutional investors and a member of management. The holders of the Investor Incentive units are entitled to participate in cash distributions of Albertson’s, NAI and Safeway based on their respective ownership percentages of aggregate ABS, NAI and Safeway units, vested Series-1 incentive units and Investor incentive units outstanding. All distributions are on a subordinate basis to the $2,308.6 million aggregate distributions to Albertson’s, NAI and Safeway unitholders, after which they participate on a pro rata basis. The units are convertible to an equal number of ABS units, NAI units and Safeway units reflecting the fair market value of such units as of the conversion date, which is the earlier of (i) January 30, 2020 and (ii) the effective date of consummation of an IPO of the Company (or any conversion entity) or a sale of all or substantially all of the equity of the Company or of the consolidated assets of the Company and its subsidiaries. The Investor incentive units vested immediately and contain no voting rights.
The Investor incentive units issued to the five institutional investors were accounted for under the guidance for equity-based payments to non-employees. The Investor incentive units issued to the member of management were accounted for as employee equity-based compensation.
Members’ Equity Presentation and Disclosure
As discussed above, the Company effected the Fiscal 2014 Unit Splits, which has been applied retroactively in the accompanying Consolidated Financial Statements and the related footnotes thereto, with the exception of this footnote.
| F-67 | (Continued) |
Table of Contents
AB ACQUISITION LLC AND SUBSIDIARIES
Notes to Consolidated Financial Statements
As of February 28, 2015, the Company has authorized 300.0 million Common units, with each Common unit consisting of a single ABS Unit, a NAI Unit and a Safeway Unit, of which 297.2 million Common units are issued and outstanding, with 2.8 million units representing the units associated with member loans described above. The Company has also issued 14.9 million units of Investor incentive units, of which 11.6 million were issued to certain institutional investors and 3.3 million to a member of management. The Company has also authorized 20.1 million units of Series-1 incentive units, of which 3.3 million units have been granted as of February 28, 2015 and are subject to vesting terms.
The following table depicts how the historical equity capitalization is presented in the Consolidated Statements of Members’ (Deficit) Equity. This presentation is based on the underlying subsidiaries’ profits and losses that these units participate in, which are also described in the preceding paragraphs.
| Consolidated Statements of Members’ (Deficit) Equity |
ABS units | NAI units | Safeway units | |||
| Fiscal 2012 | Class A units Class B units |
|||||
| Fiscal 2013 | Class A ABS units Class B ABS units |
Class A NAI units Class B NAI units |
||||
| Fiscal 2014 | ABS units | NAI units | Safeway units |
Note 10—Equity-Based Compensation
The Company has issued incentive units and other units to management and key investors who provided consulting services to the Company under the equityholders’ agreement, as amended. Compensation costs for employees are recognized, net of any estimated forfeitures, on a straight-line basis over the requisite service periods. For equity awards issued as of February 28, 2015, no forfeiture rate was assumed due to the limited number of executive employees who were granted the awards and the remote likelihood of their termination of employment prior to the end of any requisite service period associated with the vesting of the award. Equity-based compensation expense recognized in the accompanying Consolidated Statements of Operations and Comprehensive (Loss) Income was $344.1 million and $6.2 million in fiscal 2014 and fiscal 2013, respectively. No tax benefit was recognized for equity-based compensation for fiscal 2014 and fiscal 2013.
The equity-based compensation expense consisted of the following:
| Fiscal 2014 | Fiscal 2013 | |||||||
| Equity-based compensation expense related to employees: |
||||||||
| Class C units |
$ | 14.1 | $ | 6.2 | ||||
| Investor incentive units and Series-1 incentive units |
76.2 | — | ||||||
| Loans to members |
62.2 | — | ||||||
|
|
|
|
|
|||||
| Equity-based compensation expense to employees |
$ | 152.5 | $ | 6.2 | ||||
|
|
|
|
|
|||||
| Equity-based compensation expense to non-employees |
||||||||
| Investor incentive units |
191.6 | — | ||||||
|
|
|
|
|
|||||
| Equity-based compensation expense to non-employees |
191.6 | — | ||||||
|
|
|
|
|
|||||
| Total equity-based compensation expense |
$ | 344.1 | $ | 6.2 | ||||
|
|
|
|
|
|||||
| F-68 | (Continued) |
Table of Contents
AB ACQUISITION LLC AND SUBSIDIARIES
Notes to Consolidated Financial Statements
Class C Units
On March 21, 2013, the Company granted 103 Class C units (2.6 million Class C units following a 25,598 for 1 split on January 30, 2015) to certain key executives under the Company’s Class C Interest Plan. These grants are accounted for as a grant of equity awards to employees in accordance with GAAP. The fair value of these grants is based on the grant date fair value, which was based on the enterprise valuation of the Company at the date of grant, the Class C units’ ownership percentage and residual cash flows distributed to C unit holders after the tracking units hurdles were met. The estimated total fair value is charged to compensation expense on a straight-line basis over the vesting term of three years, with one-third of the units vesting on each of the subsequent three anniversaries of the grant date. During fiscal 2014, concurrently with the termination of the Company’s LTIPs, the vesting of unvested Class C units was accelerated resulting in compensation expense of $9.8 million. The fully vested units were then subsequently exchanged for ABS and NAI units in conjunction with the Safeway acquisition.
Class C Unit activity for each period was as follows:
| Number of Class C units |
Weighted average grant date fair value per unit |
|||||||
| Units outstanding at February 21, 2013 |
— | $ | — | |||||
| Granted |
2,641,428 | 7.70 | ||||||
|
|
|
|||||||
| Units outstanding at February 20, 2014 |
2,641,428 | 7.70 | ||||||
| Vested |
(2,641,428 | ) | 7.70 | |||||
|
|
|
|||||||
| Units outstanding at February 28, 2015 |
— | $ | — | |||||
|
|
|
|||||||
Investor Incentive Units
The Company also granted 14.9 million fully vested, non-forfeitable Investor incentive units to five investors and a member of management. The 11.6 million units granted and issued to the Company’s investors were treated as non-employee compensation for merger and acquisition services related to the Safeway acquisition and direct equity issuance services. The value of the units was $22.11 per unit, or $255.5 million, of which $191.6 million was recorded in the Consolidated Statements of Operations as compensation expense for services. The remaining $63.9 million was equity issuance costs and recorded as a reduction in proceeds from member contributions. The 3.3 million Investor incentive units granted to a member of management were recorded as employee compensation cost. The fair value of the units was $22.11 per unit, or $74.1 million, and was recorded as compensation cost in the Consolidated Statements of Operations and also reflected in the Consolidated Statements of Members’ (Deficit) Equity.
Series-1 Incentive Units
On January 30, 2015, the Company granted 3.3 million Series-1 incentive units to a member of management, with an additional 16.8 million authorized and reserved for future issuance. 50% of the Incentive units have a service vesting period of four years from the date awarded and vest 25% on each of the subsequent four anniversaries of such date. These time-based units are subject to accelerated vesting in certain limited circumstances, such as upon an initial public offering or change in control of the Company, or prorated vesting due to termination without cause, termination by the employee for good reason or due to the employee’s death or disability.
| F-69 | (Continued) |
Table of Contents
AB ACQUISITION LLC AND SUBSIDIARIES
Notes to Consolidated Financial Statements
The remaining 50% of the incentive units have performance-based vesting terms, which vest 25% on the last day of Safeway’s fiscal year for each of the following four fiscal years, subject to specific performance targets. For the units subject to a service period, the estimated total fair value is charged to compensation expense on a straight-line basis over the vesting of four years and vest 25% on each of the subsequent four anniversaries of such date. For the units subject to a performance condition, compensation cost will be recognized on a graded vesting basis when probable and based on the estimated quantity of awards for which it is probable that the performance conditions will be achieved. All performance-based units that have not vested as of the fiscal year commencing in 2018 shall terminate. Upon the consummation of an IPO, the unvested units subject to performance conditions are converted into units subject to a continuation of service condition.
Incentive unit activity for each period was as follows:
| Investor incentive units |
Series 1 incentive units |
Weighted average grant date fair value per unit |
||||||||||
| Units unvested at February 20, 2014 |
— | — | $ | — | ||||||||
| Granted |
14,907,871 | 3,350,083 | 22.11 | |||||||||
| Vested |
(14,907,871 | ) | — | 22.11 | ||||||||
| Forfeited |
— | — | — | |||||||||
|
|
|
|
|
|||||||||
| Units unvested at February 28, 2015 |
— | 3,350,083 | $ | 22.11 | ||||||||
|
|
|
|
|
|||||||||
The aggregate fair value and grant date of Investor incentive units that vested in fiscal 2014 was $330.0 million.
As of February 28, 2015, the Company had yet to recognize $71.9 million in unrecognized compensation cost related to unvested equity-based compensation arrangements granted under the Company’s Series-1 Incentive Unit Plan.
Member Loans to Employees
Upon termination of the Company’s LTIPs, certain executives were entitled to the right to receive a loan from the Company to purchase additional ABS and NAI units. Employees took loans of $21.6 million to purchase an additional 2.8 million units. At February 28, 2015, the principal amounts due to the Company under outstanding notes receivable were $21.6 million. Each loan is collateralized by the additional units purchased with the loan, but in the event the loan amount exceeds the fair value of the units when repaid, the employee must repay the loan with other assets owned by the employee. Any distributions received with respect to any equity held by the individual in the Company must first be used to pay the loan. The loans are treated as non-recourse for accounting purposes and accounted for as equity-based compensation. Upon issuance the units issued to employees were fully vested, and as such we recognized compensation expense with an offsetting entry to Members’ Investment. The units associated with the loan are not transferable, and the loans are payable on the earliest of: five years from January 30, 2015 or six months following the employee’s termination, the date of the consummation of an IPO or the consummation of a corporate transaction constituting a change in control. The estimated fair value of equity granted under the loans during 2014 was $62.2 million.
The Company determined fair value of unvested and issued awards on the grant date using an option pricing model adjusted for a lack of marketability and using an expected term or time to liquidity based on judgments made by management. Expected volatility is calculated based upon historical
| F-70 | (Continued) |
Table of Contents
AB ACQUISITION LLC AND SUBSIDIARIES
Notes to Consolidated Financial Statements
volatility data from a group of comparable companies over a time frame consistent with the expected life of the awards. The expected risk-free rate is based on the U.S. Treasury yield curve rates in effect at the time of the grant using the term most consistent with the expected life of the award. Dividend yield was estimated at zero, as the Company does not anticipate making regular future distributions to unitholders. As part of calculating fair value for its equity-based awards, the Company estimates the enterprise value underlying the equity-based awards. The most recent valuation was performed as of January 2015 using a Market and Income approach weighted at 50% each. The Market Approach uses the Guideline Public Company Method, which focuses on comparing the subject entity to selected reasonably similar (or guideline) publicly traded companies, while the Income approach uses discounted cash flows to measure the value of the enterprise by estimating the present worth of the net economic benefit (cash receipts less cash outlays) to be received over the life of the Company.
The valuations used to determine the fair values of the Class C units, Investor incentive units, Series-1 incentive units and Member loans to employees were retrospective. The following weighted-average assumptions used, by year, to value the Company’s equity-based awards are as follows:
| February 28, 2015 | ||||
| Dividend yield |
—% | |||
| Expected volatility |
42.4% | |||
| Risk-free interest rate |
0.47% | |||
| Time to liquidity |
2 years | |||
| Discount for lack of marketability |
16.0% | |||
Note 11—Net (loss) Income Per Unit
The Company calculates EPU separately for the Tracking group and for the Residual group using the two-class method, which are both presented on the Consolidated Statements of Operations. Under the two-class method, EPU is determined for the Tracking group and the Residual group based on the separate earnings attributed to actual distributions to the respective classes of units and undistributed earnings available for distribution to the respective classes of units.
The Company treats ABS, NAI and Safeway units as tracking units due to their participation (or “tracking”) of the earnings of the individual subsidiaries. ABS, NAI and Safeway units have been presented as one Tracking group, as each member holds a pro rata share of each of the units, the units are contractually inseparable from one another and the individual unit distributions are co-dependent on the distributions of the other units due to an aggregate distribution target, as defined. Tracking units issued to members through employee loans (as described in Note 10—Equity-based compensation) participate in distributions of the Tracking group but are not outstanding and were excluded from the Tracking group diluted EPU in Fiscal 2014 because their inclusion would be anti-dilutive.
The Residual Group consists of the Class C units, Series-1 incentive units and Investor incentive Units, of which the Investor Incentive Units participate in earnings and distributions on a pro rata basis at the AB Acquisition LLC level with the Tracking Group once the distribution hurdles of the Tracking Group have been met. Unvested Class C units and Series-1 incentive units do not participate in earnings and distributions until fully vested, and were included in the Residual group diluted EPU in Fiscal 2013.
In fiscal 2014, units of 0.2 million and 1.4 million for the Tracking group and Residual group, respectively, have been excluded from diluted weighted-average units outstanding because their inclusion would be anti-dilutive.
| F-71 | (Continued) |
Table of Contents
AB ACQUISITION LLC AND SUBSIDIARIES
Notes to Consolidated Financial Statements
The following table sets forth the computation of basic and diluted net income (loss) per Tracking group unit and diluted net (loss) income per Residual group unit (in millions, per unit amounts):
| Fiscal 2014 | Fiscal 2013 | Fiscal 2012 | ||||||||||
| Net (loss) income |
$ | (1,225.2 | ) | $ | 1,732.6 | $ | 79.0 | |||||
| Less: income from discontinued operations |
— | 19.5 | 49.2 | |||||||||
|
|
|
|
|
|
|
|||||||
| Net (loss) income from continuing operations |
(1,225.2 | ) | 1,713.1 | 29.8 | ||||||||
| Less: distributions to Tracking group |
34.5 | — | 50.0 | |||||||||
| Less: undistributed (loss) income available to Tracking group up to Distribution Targets |
(1,259.7 | ) | 594.0 | — | ||||||||
|
|
|
|
|
|
|
|||||||
| Net income (loss) from continuing operations available to Tracking group and Residual group |
$ | — | $ | 1,119.1 | $ | (20.2 | ) | |||||
|
|
|
|
|
|
|
|||||||
| Net (loss) income from continuing operations and distributions attributable to: |
||||||||||||
| Tracking group—basic |
$ | (1,225.2 | ) | $ | 1,713.1 | $ | 29.8 | |||||
| Residual group—basic |
— | — | — | |||||||||
| Tracking group—diluted |
(1,225.2 | ) | 1,690.4 | 29.8 | ||||||||
| Residual group—diluted |
— | 22.7 | — | |||||||||
| Net income from discontinued operations and distributions attributable to: |
||||||||||||
| Tracking group—basic |
$ | — | $ | 19.5 | $ | 49.2 | ||||||
| Residual group—basic |
— | — | — | |||||||||
| Tracking group—diluted |
— | 19.1 | 49.2 | |||||||||
| Residual group—diluted |
— | 0.4 | — | |||||||||
| Weighted average Tracking group units outstanding used in computing net income attributable to Tracking group—basic and diluted |
141.42 | 123.49 | 69.71 | |||||||||
| Weighted average Residual group units outstanding used in computing net income attributable to Residual group—basic |
2.68 | — | — | |||||||||
| Dilutive effect of Class C units |
— | 2.45 | — | |||||||||
|
|
|
|
|
|
|
|||||||
| Weighted average units for calculating diluted earnings per unit—Residual group |
2.68 | 2.45 | — | |||||||||
| (Loss) income from continuing operations per unit attributable to: |
||||||||||||
| Tracking group—basic |
$ | (8.66 | ) | $ | 13.87 | $ | 0.43 | |||||
| Residual group—basic |
— | — | — | |||||||||
| Tracking group—diluted |
(8.66 | ) | 13.69 | 0.43 | ||||||||
| Residual group—diluted |
— | 9.27 | — | |||||||||
| Income from discontinued operations per unit attributable to: |
||||||||||||
| Tracking group—basic |
$ | — | $ | 0.16 | $ | 0.71 | ||||||
| Residual group—basic |
— | — | — | |||||||||
| Tracking group—diluted |
— | 0.15 | 0.71 | |||||||||
| Residual group—diluted |
— | 0.16 | — | |||||||||
| F-72 | (Continued) |
Table of Contents
AB ACQUISITION LLC AND SUBSIDIARIES
Notes to Consolidated Financial Statements
Note 12—Leases
The Company leases certain retail stores, distribution centers, office facilities and equipment from third parties. The typical lease period is 15 to 20 years with renewal options for varying terms and, to a limited extent, options to purchase. Certain leases contain percent rent based on sales, escalation clauses or payment of executory costs, such as property taxes, utilities, insurance and maintenance.
Future minimum lease payments to be made by the Company for non-cancelable operating lease and capital lease obligations as of February 28, 2015 consisted of the following (in millions):
| Lease Obligations | ||||||||
| Fiscal year |
Operating Leases | Capital Leases | ||||||
| 2015 |
$ | 735.7 | $ | 202.2 | ||||
| 2016 |
688.7 | 192.4 | ||||||
| 2017 |
620.1 | 171.2 | ||||||
| 2018 |
538.9 | 142.8 | ||||||
| 2019 |
455.1 | 130.2 | ||||||
| Thereafter |
2,858.2 | 669.5 | ||||||
|
|
|
|
|
|||||
| Total future minimum obligations |
$ | 5,896.7 | 1,508.3 | |||||
|
|
|
|||||||
| Less interest |
(533.6 | ) | ||||||
|
|
|
|||||||
| Present value of net future minimum lease obligations |
974.7 | |||||||
| Less current portion |
(121.1 | ) | ||||||
|
|
|
|||||||
| Long-term obligations |
$ | 853.6 | ||||||
|
|
|
|||||||
The Company subleases certain property to third parties. Future minimum tenant rental income under these non-cancelable operating leases as of February 28, 2015 was $358.8 million.
Rent expense and tenant rental income under operating leases consisted of the following (in millions):
| Fiscal 2014 | Fiscal 2013 | Fiscal 2012 | ||||||||||
| Minimum rent |
$ | 371.3 | $ | 300.8 | $ | 53.4 | ||||||
| Contingent rent |
4.7 | 3.3 | 0.5 | |||||||||
|
|
|
|
|
|
|
|||||||
| Total rent expense |
376.0 | 304.1 | 53.9 | |||||||||
| Tenant rental income |
(51.9 | ) | (45.3 | ) | (19.2 | ) | ||||||
|
|
|
|
|
|
|
|||||||
| Total rent expense, net of tenant rental income |
$ | 324.1 | $ | 258.8 | $ | 34.7 | ||||||
|
|
|
|
|
|
|
|||||||
Note 13—Income Taxes
The components of (loss) income before income taxes consisted of the following (in millions):
| Fiscal 2014 | Fiscal 2013 | Fiscal 2012 | ||||||||||
| Domestic |
$ | (1,379.1 | ) | $ | 1,140.5 | $ | 31.5 | |||||
| Foreign |
0.5 | — | — | |||||||||
|
|
|
|
|
|
|
|||||||
| $ | (1,378.6 | ) | $ | 1,140.5 | $ | 31.5 | ||||||
|
|
|
|
|
|
|
|||||||
| F-73 | (Continued) |
Table of Contents
AB ACQUISITION LLC AND SUBSIDIARIES
Notes to Consolidated Financial Statements
The components of income tax (benefit) expense consisted of the following (in millions):
| Fiscal 2014 | Fiscal 2013 | Fiscal 2012 | ||||||||||
| Current |
||||||||||||
| Federal |
$ | 8.5 | $ | 67.8 | $ | — | ||||||
| State |
8.2 | 17.2 | 1.7 | |||||||||
| Foreign |
— | — | — | |||||||||
|
|
|
|
|
|
|
|||||||
| Total Current |
16.7 | 85.0 | 1.7 | |||||||||
| Deferred |
||||||||||||
| Federal |
(110.9 | ) | (561.1 | ) | — | |||||||
| State |
(59.2 | ) | (96.5 | ) | — | |||||||
| Foreign |
— | — | — | |||||||||
|
|
|
|
|
|
|
|||||||
| Total Deferred |
(170.1 | ) | (657.6 | ) | — | |||||||
|
|
|
|
|
|
|
|||||||
| Income Tax (Benefit) Expense, Continuing Operations |
$ | (153.4 | ) | $ | (572.6 | ) | $ | 1.7 | ||||
|
|
|
|
|
|
|
|||||||
The difference between the actual tax provision and the tax provision computed by applying the statutory federal income tax rate to losses from continuing operations before income taxes was attributable to the following (in millions):
| Fiscal 2014 | Fiscal 2013 | Fiscal 2012 | ||||||||||
| Income tax (benefit) expense at federal statutory rate |
$ | (482.5 | ) | $ | 399.1 | $ | 11.0 | |||||
| State income taxes, net of federal benefit |
(38.4 | ) | (30.5 | ) | 1.7 | |||||||
| Change in valuation allowance |
6.4 | 2.0 | — | |||||||||
| Unrecognized tax benefits |
11.3 | (15.5 | ) | — | ||||||||
| Members’ loss (income) |
251.0 | (581.4 | ) | (11.0 | ) | |||||||
| Common control transaction |
13.3 | (357.7 | ) | — | ||||||||
| Effect of tax rate change |
(3.7 | ) | — | — | ||||||||
| Indemnification liability |
(26.3 | ) | — | — | ||||||||
| Transaction costs |
62.1 | — | — | |||||||||
| Nondeductible equity compensation |
51.0 | — | — | |||||||||
| Other |
2.4 | 11.4 | — | |||||||||
|
|
|
|
|
|
|
|||||||
| Income tax (benefit) expense, continuing operations |
$ | (153.4 | ) | $ | (572.6 | ) | $ | 1.7 | ||||
|
|
|
|
|
|
|
|||||||
Taxes on income from limited liability companies held in partnership are payable by the members in accordance with their respective ownership percentages. Accordingly, the Company recorded an adjustment to income tax expense (benefit) of $251.0 million, $(581.4) million and $(11.0) million for Fiscal 2014, Fiscal 2013 and Fiscal 2012, respectively. Immediately subsequent to the March 21, 2013 acquisition of NAI, the Company sold and transferred the Albertsons-bannered stores and six distribution centers from NAI to Albertson’s LLC and recorded an adjustment to income tax expense (benefit) of $13.3 million and $(357.7) million for fiscal 2014 and fiscal 2013, respectively. The adjustment primarily represents a net reduction of deferred tax liabilities related to the sale and transfer.
| F-74 | (Continued) |
Table of Contents
AB ACQUISITION LLC AND SUBSIDIARIES
Notes to Consolidated Financial Statements
Deferred income taxes reflect the net tax effects of temporary differences between the bases of assets and liabilities for financial reporting and income tax purposes. The Company’s deferred tax assets and liabilities consisted of the following (in millions):
| February 28, 2015 | February 20, 2014 | |||||||
| Deferred tax assets: |
||||||||
| Compensation and benefits |
$ | 231.6 | $ | 16.2 | ||||
| Net operating loss |
65.1 | 153.5 | ||||||
| Pension & postretirement benefits |
329.5 | 18.6 | ||||||
| Reserves |
38.4 | 8.3 | ||||||
| Self-Insurance |
385.1 | 164.5 | ||||||
| Tax credits |
32.6 | 10.7 | ||||||
| Other |
161.3 | 49.0 | ||||||
|
|
|
|
|
|||||
| Gross deferred tax assets |
1,243.6 | 420.8 | ||||||
| Less: valuation allowance |
(90.4 | ) | (51.7 | ) | ||||
|
|
|
|
|
|||||
| Total deferred tax assets |
1,153.2 | 369.1 | ||||||
| Deferred tax liabilities: |
||||||||
| Debt discount |
111.9 | 123.6 | ||||||
| Depreciation and amortization |
2,168.3 | 79.5 | ||||||
| Inventories |
491.3 | 138.7 | ||||||
| Investment in foreign operations |
163.9 | — | ||||||
| Other |
61.0 | 13.1 | ||||||
|
|
|
|
|
|||||
| Total deferred tax liabilities |
2,996.4 | 354.9 | ||||||
|
|
|
|
|
|||||
| Net deferred tax (liability) asset |
$ | (1,843.2 | ) | $ | 14.2 | |||
|
|
|
|
|
|||||
| Current deferred tax asset |
$ | — | $ | — | ||||
| Current deferred tax liability |
(145.4 | ) | (85.4 | ) | ||||
| Noncurrent deferred tax asset |
93.0 | 144.8 | ||||||
| Noncurrent deferred tax liability |
(1,790.8 | ) | (45.2 | ) | ||||
|
|
|
|
|
|||||
| Total |
$ | (1,843.2 | ) | $ | 14.2 | |||
|
|
|
|
|
|||||
In connection with the Safeway acquisition, the Company recorded a $1,807.7 million net deferred tax liability as of January 30, 2015.
The Company assesses the available positive and negative evidence to estimate if sufficient future taxable income will be generated to use the existing deferred tax assets. On the basis of this evaluation, as of February 28, 2015, a valuation allowance of $90.4 million has been recorded for the portion of the deferred tax asset that is not more likely than not to be realized. The Company will continue to evaluate the need to adjust the valuation allowance. The amount of the deferred tax asset considered realizable, however, could be adjusted if the Company continues to incur losses in the future.
The Company currently has federal and state net operating loss (“NOL”) carryforwards of $247.5 million and $771.5 million, respectively, which will begin to expire in 2015 and continue through the fiscal year ending February 2035. As of February 28, 2015, the Company had federal and state credit carryforwards of $2.7 million and $47.4 million, respectively, the majority of which will expire in 2023.
| F-75 | (Continued) |
Table of Contents
AB ACQUISITION LLC AND SUBSIDIARIES
Notes to Consolidated Financial Statements
Changes in the Company’s unrecognized tax benefits consisted of the following (in millions):
| February 28, 2015 | February 20, 2014 | |||||||
| Beginning balance |
$ | 180.4 | $ | — | ||||
| Increase from acquisitions |
262.7 | 147.0 | ||||||
| Increase related to tax positions taken in the current year |
10.6 | 152.3 | ||||||
| Increase related to tax positions taken in prior years |
19.9 | 8.8 | ||||||
| Decrease related to tax position taken in prior years |
(15.5 | ) | (10.8 | ) | ||||
| Foreign currency translation |
(0.1 | ) | — | |||||
| Decrease related to settlements with taxing authorities |
(4.9 | ) | (115.5 | ) | ||||
| Decrease related to lapse of statute of limitations |
(1.6 | ) | (1.4 | ) | ||||
|
|
|
|
|
|||||
| Ending balance |
$ | 451.5 | $ | 180.4 | ||||
|
|
|
|
|
|||||
Included in the balance of unrecognized tax benefits as of February 28, 2015, February 20, 2014 and February 21, 2013 are tax positions of $221.6 million, $103.0 million and $32.4 million, respectively, which would reduce the Company’s effective tax rate if recognized in future periods. Of the $221.6 million that could impact tax expense, the Company has recorded $12.8 million of indemnification assets that would offset any future recognition. As of February 28, 2015, the Company is no longer subject to federal income tax examinations for the fiscal years prior to 2007, and in most states, is no longer subject to state income tax examinations for fiscal years before 2007. The Company recognizes accrued interest and penalties related to unrecognized tax benefits as a component of income tax expense. The Company recognized expense (benefit) related to interest and penalties, net of settlement adjustments, of $(1.2) million, $(5.9) million and $7.0 million for fiscal 2014, 2013 and 2012, respectively. The Company does not expect any material amount of unrecognized tax benefits to reverse in the next 12 months.
Note 14—Employee Benefit Plans and Collective Bargaining Agreements
Pension Plans
The Company sponsors a defined benefit pension plan (the “Shaw’s Plan”) covering union employees under the Shaw’s banner. The Company also sponsors a defined benefit pension plan (the “Safeway Plan”) for substantially all of its employees under the Safeway banners not participating in multiemployer pension plans. The Company also sponsors a frozen plan covering certain employees under the United banners and a Retirement Restoration Plan that provides death benefits and supplemental income payments for certain senior executives after retirement. The Retirement Restoration Plan is unfunded.
The Safeway Plan and the Retirement Restoration Plan were acquired as part of the Safeway acquisition in fiscal 2014. The United Plan was acquired as part of the United acquisition in fiscal 2013.
Other Post-Retirement Benefits
In addition to the Company’s pension plans, the Company acquired plans as part of the Safeway acquisition that provide post-retirement medical and life insurance benefits to certain employees. Retirees share a portion of the cost of the post-retirement medical plans. The Company pays all the cost of the life insurance plans. The plans are unfunded.
| F-76 | (Continued) |
Table of Contents
AB ACQUISITION LLC AND SUBSIDIARIES
Notes to Consolidated Financial Statements
The following table provides a reconciliation of the changes in the retirement plans’ benefit obligation and fair value of assets over the two-year period ended February 28, 2015 and a statement of funded status as of fiscal year-end 2014 and fiscal year-end 2013 (in millions):
| Pension | Other Post- Retirement Benefits |
|||||||||||
| Fiscal 2014 | Fiscal 2013 | Fiscal 2014 | ||||||||||
| Change in projected benefit obligation: |
||||||||||||
| Beginning balance |
$ | 357.4 | $ | — | $ | — | ||||||
| NAI acquisition |
— | 307.0 | — | |||||||||
| United acquisition |
— | 53.9 | — | |||||||||
| Safeway acquisition |
2,452.9 | — | 19.4 | |||||||||
| Service cost |
13.5 | 9.4 | — | |||||||||
| Interest cost |
24.5 | 13.1 | 0.1 | |||||||||
| Actuarial gain |
(61.9 | ) | (19.7 | ) | (0.3 | ) | ||||||
| Benefit payments |
(61.6 | ) | (6.3 | ) | (0.2 | ) | ||||||
|
|
|
|
|
|
|
|||||||
| Ending balance |
$ | 2,724.8 | $ | 357.4 | $ | 19.0 | ||||||
|
|
|
|
|
|
|
|||||||
| Change in fair value of plan assets: |
||||||||||||
| Beginning balance |
$ | 298.1 | $ | — | $ | — | ||||||
| NAI acquisition |
— | 214.7 | — | |||||||||
| United acquisition |
— | 49.7 | — | |||||||||
| Safeway acquisition |
1,547.3 | — | — | |||||||||
| Actual return on plan assets |
88.2 | 24.3 | — | |||||||||
| Employer contributions |
272.1 | 15.7 | 0.2 | |||||||||
| Benefit payments |
(61.6 | ) | (6.3 | ) | (0.2 | ) | ||||||
|
|
|
|
|
|
|
|||||||
| Ending balance |
$ | 2,144.1 | $ | 298.1 | $ | — | ||||||
|
|
|
|
|
|
|
|||||||
| Components of net amount recognized in financial position: |
||||||||||||
| Other current liabilities |
$ | (5.5 | ) | $ | — | $ | (1.9 | ) | ||||
| Other long-term liabilities |
(575.2 | ) | (59.3 | ) | (17.1 | ) | ||||||
|
|
|
|
|
|
|
|||||||
| Funded status |
$ | (580.7 | ) | $ | (59.3 | ) | $ | (19.0 | ) | |||
|
|
|
|
|
|
|
|||||||
Amounts recognized in Accumulated other comprehensive (loss) income consisted of the following (in millions):
| Pension | Other Post- Retirement Benefits |
|||||||||||
| Fiscal 2014 | Fiscal 2013 | Fiscal 2014 | ||||||||||
| Net actuarial gain |
$ | (150.1 | ) | $ | (29.4 | ) | $ | (0.3 | ) | |||
| F-77 | (Continued) |
Table of Contents
AB ACQUISITION LLC AND SUBSIDIARIES
Notes to Consolidated Financial Statements
Information for the Company’s pension plans, all of which have an accumulated benefit obligation in excess of plan assets as of fiscal year-end 2014 and 2013, is shown below (in millions):
| February 28, 2015 | February 20, 2014 | |||||||
| Projected benefit obligation |
$ | 2,724.8 | $ | 357.4 | ||||
| Accumulated benefit obligation |
2,659.5 | 357.4 | ||||||
| Fair value of plan assets |
2,144.1 | 298.1 | ||||||
The following tables provide the components of net expense for the retirement plans and other changes in plan assets and benefit obligations recognized in other comprehensive income (in millions):
| Pension | Other Post- Retirement Benefits |
|||||||||||
| Fiscal 2014 | Fiscal 2013 | Fiscal 2014 | ||||||||||
| Components of net expense: |
||||||||||||
| Estimated return on plan assets |
$ | (29.9 | ) | $ | (14.5 | ) | $ | — | ||||
| Service cost |
13.5 | 9.4 | — | |||||||||
| Interest cost |
24.5 | 13.1 | 0.1 | |||||||||
| Settlement loss |
0.5 | — | — | |||||||||
|
|
|
|
|
|
|
|||||||
| Net expense |
$ | 8.6 | $ | 8.0 | $ | 0.1 | ||||||
| Changes in plan assets and benefit obligations recognized in Other comprehensive income (loss): |
||||||||||||
| Net actuarial gain |
$ | (120.7 | ) | $ | (29.5 | ) | $ | (0.3 | ) | |||
|
|
|
|
|
|
|
|||||||
| Total net expense and changes in plan assets and benefit obligations recognized in Other comprehensive income (loss) |
$ | (112.1 | ) | $ | (21.5 | ) | $ | (0.2 | ) | |||
|
|
|
|
|
|
|
|||||||
Prior service costs are amortized on a straight-line basis over the average remaining service period of active participants. When the accumulation of actuarial gains and losses exceeds 10% of the greater of the projected benefit obligation and the fair value of plan assets, the excess is amortized over the average remaining service period of active participants. No prior service costs or estimated net actuarial gain or loss is expected to be amortized from other comprehensive income into periodic benefit cost during fiscal 2015.
Assumptions
The actuarial assumptions used to determine year-end projected benefit obligations for pension plans were as follows:
| February 28, 2015 | February 20, 2014 | |||||||
| Discount rate |
3.92 | % | 4.96 | % | ||||
| Rate of compensation increase |
3.32 | % | 2.00 | % | ||||
| F-78 | (Continued) |
Table of Contents
AB ACQUISITION LLC AND SUBSIDIARIES
Notes to Consolidated Financial Statements
The actuarial assumptions used to determine net periodic benefit costs for pension plans were as follows:
| February 28, 2015 | February 20, 2014 | |||||||
| Discount rate |
3.75 | % | 4.62 | % | ||||
| Expected return on plan assets: |
6.97 | % | 7.17 | % | ||||
The Company has adopted and implemented an investment policy for the defined benefit pension plans that incorporates a strategic long-term asset allocation mix designed to meet the Company’s long-term pension requirements. This asset allocation policy is reviewed annually and, on a regular basis, actual allocations are rebalanced to the prevailing targets. The following table summarizes actual allocations for the Safeway Plan which had $1.9 billion in plan assets at February 28, 2015:
| Plan assets | ||||||||
| Asset category |
Target | February 28, 2015 | ||||||
| Equity |
65 | % | 64.9 | % | ||||
| Fixed income |
35 | % | 34.1 | % | ||||
| Cash and other |
— | 1.0 | % | |||||
|
|
|
|
|
|||||
| Total |
100 | % | 100.0 | % | ||||
|
|
|
|
|
|||||
Shaw’s Plan assets are held in an individual trust and invested in commingled investment vehicles holding domestic and international equity securities, domestic fixed income securities and other investment classes. The Company employs a total-return approach whereby a diversified mix of asset class investments is used to maximize the long-term return of plan assets for an acceptable level of risk. Risk is managed through careful consideration of the plan liabilities, plan funded status and the Company’s financial condition. The asset allocation policy is reviewed annually, and allocations are monitored regularly and rebalanced on an as-needed basis. Plan assets are invested using active and passive investment strategies. Passive or “indexed” strategies attempt to replicate the performance of a market benchmark. Monitoring activities to evaluate performance against targets and measure investment risk take place on an ongoing basis through annual liability measurements, periodic asset/liability studies, and quarterly investment portfolio reviews. The following table summarizes the actual allocations for the Shaw’s Plan which had $240.0 million in plan assets as of February 28, 2015:
| Plan assets | ||||||||||||
| Asset Category |
Target | February 28, 2015 | February 20, 2014 | |||||||||
| Domestic equity |
35 | % | 34.9 | % | 35.3 | % | ||||||
| International equity |
20 | % | 20.2 | % | 15.0 | % | ||||||
| Fixed income |
45 | % | 44.9 | % | 49.7 | % | ||||||
|
|
|
|
|
|
|
|||||||
| Total |
100 | % | 100.0 | % | 100.0 | % | ||||||
|
|
|
|
|
|
|
|||||||
| F-79 | (Continued) |
Table of Contents
AB ACQUISITION LLC AND SUBSIDIARIES
Notes to Consolidated Financial Statements
The target market value of equity securities for the United Plan is 50% of plan assets. If the equity percentage exceeds 60% or drops below 40%, the asset allocation is adjusted to target. The following table summarizes the actual allocations for the United Plan, which had $52 million in plan assets as of February 28, 2015:
| Plan assets | ||||||||||||
| Asset category |
Target | February 28, 2015 | February 20, 2014 | |||||||||
| Equity |
50 | % | 55.0 | % | 50.9 | % | ||||||
| Fixed income(1) |
— | 32.9 | % | 36.8 | % | |||||||
| Cash and other(1) |
— | 12.1 | % | 12.3 | % | |||||||
|
|
|
|
|
|||||||||
| Total |
100.0 | % | 100.0 | % | ||||||||
|
|
|
|
|
|||||||||
| (1) | No formal allocation percentages have been established for these asset categories. Allocations are evaluated monthly and adjusted to meet the cash needs of the plan. |
The investment policy also emphasizes the following key objectives: (i) maintaining a diversified portfolio among asset classes and investment styles; (ii) maintaining an acceptable level of risk in pursuit of long-term economic benefit; (iii) maximizing the opportunity for value-added returns from active investment management while establishing investment guidelines and monitoring procedures for each investment manager to ensure that the characteristics of the portfolio are consistent with the original investment mandate; and (iv) maintaining adequate controls over administrative costs.
Expected return on pension plan assets is based on historical experience of the Company’s portfolios and the review of projected returns by asset class on broad, publicly traded equity and fixed-income indices, as well as target asset allocation. The Company’s target asset allocation mix is designed to meet the Company’s long-term pension requirements.
Pension Plan Assets
The fair value of the Company’s pension plan assets at February 28, 2015, excluding pending transactions of $45.1 million, by asset category are as follows (in millions):
| Fair Value Measurements | ||||||||||||||||
| Asset category: |
Total | Quoted Prices in Active Markets for Identical Assets (Level 1) |
Significant observable inputs (Level 2) |
Significant unobservable inputs (Level 3) |
||||||||||||
| Cash and cash equivalents(1) |
$ | 20.4 | $ | 9.6 | $ | 10.8 | $ | — | ||||||||
| Short-term investment collective trust(2) |
47.4 | — | 47.4 | — | ||||||||||||
| Common and preferred stock:(3) |
||||||||||||||||
| Domestic common and preferred stock |
306.1 | 306.1 | — | — | ||||||||||||
| International common stock |
67.2 | 67.2 | — | — | ||||||||||||
| Common collective trust funds(2) |
914.3 | — | 914.3 | — | ||||||||||||
| Corporate bonds(4) |
153.7 | — | 153.7 | — | ||||||||||||
| Mortgage- and other asset-backed securities(5) |
71.0 | — | 71.0 | — | ||||||||||||
| Mutual funds(6) |
219.2 | 63.9 | 155.3 | — | ||||||||||||
| U.S. government securities(7) |
324.4 | — | 324.3 | 0.1 | ||||||||||||
| Other securities(8) |
65.5 | 0.1 | 41.2 | 24.2 | ||||||||||||
|
|
|
|
|
|
|
|
|
|||||||||
| Total |
$ | 2,189.2 | $ | 446.9 | $ | 1,718.0 | $ | 24.3 | ||||||||
|
|
|
|
|
|
|
|
|
|||||||||
| F-80 | (Continued) |
Table of Contents
AB ACQUISITION LLC AND SUBSIDIARIES
Notes to Consolidated Financial Statements
| (1) | The carrying value of these items approximates fair value. |
| (2) | These investments are valued based on the Net Asset Value (“NAV”) of the underlying investments and are provided by the fund issuers. |
| (3) | The fair value of common stock is based on the exchange quoted market prices. When quoted prices are not available for preferred stock, an industry standard valuation model is used which maximizes observable inputs. |
| (4) | The fair value of corporate bonds is generally based on yields currently available on comparable securities of issuers with similar credit ratings. When quoted prices are not available for identical or similar bonds, the fair value is based upon an industry valuation model, which maximizes observable inputs. |
| (5) | The fair value of mortgage- and other asset-backed securities is generally based on yields currently available on comparable securities of issuers with similar credit ratings. When quoted prices are not available for comparable securities, the fair value is based upon an industry model which maximizes observable inputs. |
| (6) | These investments are publicly traded investments, which are valued using the NAV. The NAV of the mutual funds is a quoted price in an active market. The NAV is determined once a day after the closing of the exchange based upon the underlying assets in the fund, less the fund’s liabilities, expressed on a per share basis. |
| (7) | The fair value of U.S. government securities is based on quoted market prices when available. When quoted prices are not available, the fair value of U.S. government securities is based on yields currently available on comparable securities or on an industry valuation model that maximizes observable inputs. |
| (8) | Level 2 Other Securities, which consist primarily of U.S. municipal bonds, foreign government bonds and foreign agency securities are valued based on yields currently available on comparable securities of issuers with similar credit ratings. Also included in Other Securities are exchange-traded derivatives that are valued based on quoted prices in an active market for identical derivative assets and liabilities. Non-exchange-traded derivatives are valued using industry valuation models, which maximize observable inputs, such as interest-rate yield curve data, foreign exchange rates and applicable spot and forward rates. |
Level 3 Other Securities consist primarily of a commingled fund valued based on the NAV of the underlying investments and is provided by the fund issuer.
A reconciliation of the beginning and ending balances for Level 3 assets for the fiscal year ended February 28, 2015 follows (in millions):
| Fair Value Measured Using Significant Unobservable Inputs (Level 3) |
||||||||||||||||||||
| Total | Corporate Bonds |
Mortgage- and other Asset- Backed Securities |
U.S. Government Securities |
Other Securities |
||||||||||||||||
| Balance, beginning of year |
$ | — | $ | — | $ | — | $ | — | $ | — | ||||||||||
| Safeway acquisition |
26.2 | 0.7 | 0.3 | 0.1 | 25.1 | |||||||||||||||
| Purchases, sales, settlements, net |
(2.6 | ) | (0.7 | ) | — | — | (1.9 | ) | ||||||||||||
| Transfer out of Level 3 |
(0.3 | ) | — | (0.3 | ) | — | — | |||||||||||||
| Unrealized gains |
1.0 | — | — | — | 1.0 | |||||||||||||||
|
|
|
|
|
|
|
|
|
|
|
|||||||||||
| Balance, end of year |
$ | 24.3 | $ | — | $ | — | $ | 0.1 | $ | 24.2 | ||||||||||
|
|
|
|
|
|
|
|
|
|
|
|||||||||||
| F-81 | (Continued) |
Table of Contents
AB ACQUISITION LLC AND SUBSIDIARIES
Notes to Consolidated Financial Statements
The fair value of assets of the Company’s pension plan assets as of February 20, 2014, by asset category, consisted of the following (in millions):
| Fair Value Measurements | ||||||||||||||||
| Asset category: |
Total | Quoted prices in active markets for identical assets (Level 1) |
Significant observable inputs (Level 2) |
Significant unobservable inputs (Level 3) |
||||||||||||
| Cash and cash equivalents(1) |
$ | 6.8 | $ | 6.8 | $ | — | $ | — | ||||||||
| Domestic common stock(2) |
25.2 | 25.2 | — | — | ||||||||||||
| Common collective trust funds(3) |
248.0 | — | 248.0 | — | ||||||||||||
| Corporate bonds(4) |
8.4 | — | 8.4 | — | ||||||||||||
| U.S. government securities(5) |
9.7 | — | 9.7 | — | ||||||||||||
|
|
|
|
|
|
|
|
|
|||||||||
| Total |
$ | 298.1 | $ | 32.0 | $ | 266.1 | $ | — | ||||||||
|
|
|
|
|
|
|
|
|
|||||||||
| (1) | The carrying value of these items approximates fair value. |
| (2) | The fair value of common stock is based on the exchange quoted market prices. When quoted prices are not available for preferred stock, an industry standard valuation model is used which maximizes observable inputs. |
| (3) | These investments are valued based on the NAV of the underlying investments and are provided by the fund issuers. |
| (4) | The fair value of corporate bonds is generally based on yields currently available on comparable securities of issuers with similar credit ratings. When quoted prices are not available for identical or similar bonds, the fair value is based upon an industry valuation model that maximizes observable inputs. |
| (5) | The fair value of U.S. government securities is based on quoted market prices when available. When quoted prices are not available, the fair value of U.S. government securities is based on yields currently available on comparable securities or on an industry valuation model that maximizes observable inputs. |
Contributions
In the fourth quarter of fiscal 2014, the Company contributed $260.0 million to the Safeway Plan under a settlement with the Pension Benefit Guaranty Corporation in connection with the Safeway acquisition closing. The Company expects to contribute approximately $7.9 million to its pension and post-retirement plans in fiscal 2015. The Company’s funding policy for the defined benefit pension plan is to contribute the minimum contribution required under the Employee Retirement Income Security Act of 1974, as amended, and other applicable laws as determined by the Company’s external actuarial consultant. At the Company’s discretion, additional funds may be contributed to the defined benefit pension plans. The Company will recognize contributions in accordance with applicable regulations, with consideration given to recognition for the earliest plan year permitted.
| F-82 | (Continued) |
Table of Contents
AB ACQUISITION LLC AND SUBSIDIARIES
Notes to Consolidated Financial Statements
Estimated Future Benefit Payments
The following benefit payments, which reflect expected future service as appropriate, are expected to be paid (in millions):
| Pension benefits |
Other benefits |
|||||||
| 2015 |
$ | 155.9 | $ | 2.2 | ||||
| 2016 |
156.9 | 2.1 | ||||||
| 2017 |
158.9 | 2.0 | ||||||
| 2018 |
160.2 | 1.9 | ||||||
| 2019 |
161.7 | 1.9 | ||||||
| 2020 – 2024 |
821.7 | 7.7 | ||||||
Multiemployer Pension Plans
The Company contributes to various multiemployer pension plans. These multiemployer plans generally provide retirement benefits to participants based on their service to contributing employers. The benefits are paid from assets held in trust for that purpose. Plan trustees typically are responsible for determining the level of benefits to be provided to participants as well as the investment of the assets and plan administration. Expense is recognized in connection with these plans as contributions are funded.
The risks of participating in these multiemployer plans are different from the risks associated with single-employer plans in the following respects:
| • | Assets contributed to the multiemployer plan by one employer may be used to provide benefits to employees of other participating employers. |
| • | If a participating employer stops contributing to the plan, the unfunded obligations of the plan may be borne by the remaining participating employers. |
| • | If the Company chooses to stop participating in some multiemployer plans, or makes market exits or store closures or otherwise has participation in the plan fall below certain levels, the Company may be required to pay those plans an amount based on the underfunded status of the plan, referred to as a withdrawal liability. The Company records the actuarially determined estimated liability at an undiscounted amount. |
The Company’s participation in these plans is outlined in the table below. The EIN-Pension Plan Number column provides the Employee Identification Number (“EIN”) and the three-digit plan number, if applicable. Unless otherwise noted, the most recent Pension Protection Act zone status (“PPA”) available for fiscal 2014 and 2013 is for the plan’s year ending at December 31, 2014 and December 31, 2013, respectively. The zone status is based on information received from the plans and is certified by each plan’s actuary. The FIP/RP Status Pending/Implemented column indicates plans for which a financial improvement plan (“FIP”) or a rehabilitation plan (“RP”) is either pending or has been implemented by the plan trustees.
Certain plans have been aggregated in the Other funds line in the following table, as the contributions to each of these plans are not individually material. None of the Company’s collective bargaining agreements require that a minimum contribution be made to these plans.
| F-83 | (Continued) |
Table of Contents
AB ACQUISITION LLC AND SUBSIDIARIES
Notes to Consolidated Financial Statements
As a part of the Safeway acquisition, the Company assumed withdrawal liabilities related to Safeway’s previous closure of its Dominick’s division. The respective pension plans have asserted that the Company may become obligated to pay an estimated maximum withdrawal liability of approximately $510 million if one of the pension plans, the UFCW & Employers Midwest Pension Fund (the “UFCW Midwest Plan”), were to experience a mass withdrawal. A mass withdrawal would require monthly installment payments to be made by the Company in perpetuity. The Company’s annual installment payments would be limited to 20 years if the Company is not part of, or the UFCW Midwest Plan does not experience, a mass withdrawal. Upon the Safeway acquisition, the Company recorded a $221.8 million multiemployer pension withdrawal liability related to Safeway’s withdrawal from these plans, a difference of $288.2 million from the maximum withdrawal liability. The Company’s current estimate of the withdrawal liability is based on the fact that a mass withdrawal from the UFCW Midwest Plan has not occurred and management’s belief that a mass withdrawal liability is remote. The Company is also disputing in arbitration certain factors used to determine the allocation of the unfunded vested benefits and therefore the annual pension payment installments due to the UFCW Midwest Plan. The Company’s estimated liability reflects its best estimate of the probable outcome of this arbitration. Based on the current facts and circumstances, the Company believes it is reasonably possible that the estimated liability could change from the amount currently recorded as a result of the arbitration, but because management believes that a mass withdrawal from the UFCW Midwest Plan is remote, it believes the payment of the maximum liability of $510 million is also remote.
The number of employees covered by the Company’s multiemployer plans increased significantly from February 21, 2013 to February 20, 2014, and again from February 20, 2014 to February 28, 2015, affecting the year-to-year comparability of the contributions. The increase in employees covered is a direct result of the NAI acquisition and Safeway acquisition.
| F-84 | (Continued) |
Table of Contents
AB ACQUISITION LLC AND SUBSIDIARIES
Notes to Consolidated Financial Statements
The following tables contain information about the Company’s multiemployer plans:
| EIN—PN | Pension Protection Act zone status(1) |
Company’s 5% of total plan contributions |
FIP/RP status pending/ implemented | |||||||||||
| Pension fund |
2014 | 2013 | 2013 | 2012 | ||||||||||
| Southern California United Food & Commercial Workers Unions and Food Employers Joint Pension Plan |
951939092—001 | Red 3/31/2015 |
Red 3/31/2014 |
Yes 3/31/2014 |
Yes 3/31/2013 |
Implemented | ||||||||
| UFCW Union and Participating Food Industry Employers Tri-State Pension Fund |
236396097—001 | Red | Red | Yes | Yes | Implemented | ||||||||
| Western Conference of Teamsters Pension Plan |
916145047—001 | Green | Green | No | No | No | ||||||||
| UFCW Local 152 Retail Meat Pension Fund |
2362096956—001 | Red 6/30/2014 |
Red 6/30/2013 |
Yes 6/30/2013 |
Yes 6/30/2012 |
Implemented | ||||||||
| UFCW-Northern California Employers Joint Pension Trust Fund |
946313554—001 | Red | Red | Yes | Yes | Implemented | ||||||||
| Sound Retirement Trust (formerly Retail Clerks Pension |
916069306—001 | Red 9/30/2014 |
Red 9/30/2013 |
Yes 9/30/2013 |
Yes 9/30/2012 |
Implemented | ||||||||
| UFCW International Union—Industry Pension Fund |
516055922—001 | Green 6/30/2014 |
Green 6/30/2013 |
No 6/30/2013 |
No 6/30/2012 |
Implemented | ||||||||
| Retail Food Employers and UFCW Local 711 Pension Trust Fund |
516031512—001 | Red | Red | Yes | Yes | Implemented | ||||||||
| Food Employers Labor Relations Association and United Food and Commercial Workers Pension Fund |
526128473—001 | Red | Red | No | No | Implemented | ||||||||
| Teamsters Pension Trust Fund of Philadelphia and Vicinity |
23-1511735—001 | Yellow | Yellow | No | No | Implemented | ||||||||
| Rocky Mountain UFCW Unions & Employers Pension Plan |
846045986—001 | Green | Green | Yes | Yes | No | ||||||||
| Bakery and Confectionery Union and Industry International Pension Fund |
526118572—001 | Red | Red | Yes | Yes | Implemented | ||||||||
| Intermountain Retail Store Employee Pension Trust |
916187192—001 | Red 8/31/2014 |
Red 8/31/2013 |
Yes 8/31/2013 |
Yes 8/31/2012 |
Implemented | ||||||||
| Oregon Retail Employees Pension Trust |
936074377—001 | Green | Red | Yes | Yes | No | ||||||||
| Desert States Employers & UFCW Unions Pension Plan |
846277982—001 | Green | Green | Yes | Yes | No | ||||||||
| UFCW Local 1245 Labor Management Pension Plan |
516090661—001 | Red | Red | Yes | Yes | Implemented | ||||||||
| Washington Meat Industry Pension Trust |
916134141—001 | Red 6/30/2014 |
Red 6/30/2013 |
No 6/30/2013 |
No 6/30/2012 |
No | ||||||||
| F-85 | (Continued) |
Table of Contents
AB ACQUISITION LLC AND SUBSIDIARIES
Notes to Consolidated Financial Statements
| Contributions of Company (in millions) |
Surcharge imposed(3) |
Expiration date of collective bargaining agreements |
Total collective bargaining agreements |
Most significant collective bargaining agreement(s) |
||||||||||||||||||||||
| Pension fund |
2014 | 2013 | 2012 | Count | Expiration | % head- count(4) |
||||||||||||||||||||
| Southern California United Food & Commercial Workers Unions and Food Employers Joint Pension Plan |
$ | 35.3 | $ | 29.7 | $ | 1.0 | No | 3/6/2016 to 5/8/2016 |
19 | 14 | 3/6/2016 | 99 | % | |||||||||||||
| UFCW Union and Participating Food Industry Employers Tri-State Pension Fund |
$ | 14.5 | $ | 14.3 | $ | 14.6 | Yes | 2/2/2013 to 1/31/2018 |
4 | 1 | 1/31/2018 | 39 | % | |||||||||||||
| Western Conference of Teamsters Pension Plan |
$ | 14.0 | $ | 0.9 | $ | — | No | 9/20/2014 to 10/6/2018 |
57 | 1 | 10/1/2016 | 23 | % | |||||||||||||
| UFCW Local 152 Retail Meat Pension Fund |
$ | 7.8 | $ | 7.7 | $ | 7.3 | Yes | 5/3/2016 to 5/4/2016 |
2 | 1 | 5/4/2016 | 97 | % | |||||||||||||
| UFCW-Northern California Employers Joint Pension Trust Fund |
$ | 7.2 | $ | — | $ | — | No | 8/3/2013 to 7/23/2016 |
20 | 14 | 10/11/2014 | 93 | % | |||||||||||||
| Sound Retirement Trust (formerly Retail Clerks Pension Trust)(2) |
$ | 6.3 | $ | 3.1 | $ | — | No | 1/10/2015 to 9/20/2017 |
72 | 6 | 5/7/2016 | 53 | % | |||||||||||||
| UFCW International Union—Industry Pension Fund |
$ | 5.0 | $ | 4.4 | $ | 4.2 | No | 8/23/2014 to 7/16/2016 |
3 | 1 | 8/23/2014 | 98 | % | |||||||||||||
| Retail Food Employers and UFCW Local 711 Pension Trust Fund |
$ | 4.1 | $ | 3.4 | $ | — | No | 5/19/2013 to 3/1/2015 |
7 | 4 | 3/1/2015 | 99 | % | |||||||||||||
| Food Employers Labor Relations Association and United Food and Commercial Workers Pension Fund |
$ | 3.6 | $ | 2.0 | $ | 2.0 | Yes | 10/29/2016 to 9/30/2017 |
8 | 4 | 10/29/2016 | 89 | % | |||||||||||||
| Teamsters Pension Trust Fund of Philadelphia and Vicinity |
$ | 2.3 | $ | 2.0 | $ | 1.8 | No | 7/1/2019 | 1 | 1 | 7/1/2019 | 100 | % | |||||||||||||
| Rocky Mountain UFCW Unions & Employers Pension Plan |
$ | 2.1 | $ | 1.1 | $ | 1.0 | No | 9/12/2015 to 8/27/2016 |
52 | 10 | 9/12/2015 | 50 | % | |||||||||||||
| Bakery and Confectionery Union and Industry International Pension Fund |
$ | 1.9 | $ | — | $ | — | Yes | 11/7/2011 to 9/17/2017 |
62 | 5 | 4/8/2017 | 36 | % | |||||||||||||
| Intermountain Retail Store Employee Pension Trust |
$ | 1.5 | $ | 1.3 | $ | — | Yes | 2/18/2012 to 7/25/2015 |
60 | 16 | 3/31/2014 | 33 | % | |||||||||||||
| Oregon Retail Employees Pension Trust |
$ | 1.3 | $ | 1.5 | $ | — | No | 7/25/2015 to 1/21/2017 |
48 | 5 | 7/25/2015 | 33 | % | |||||||||||||
| Desert States Employers & UFCW Unions Pension Plan |
$ | 1.1 | $ | 0.2 | $ | — | No | 10/29/2016 to 11/3/2018 |
8 | 2 | 10/29/2016 | 67 | % | |||||||||||||
| UFCW Local 1245 Labor Management Pension Plan |
$ | 1.1 | $ | 1.0 | $ | 0.9 | Yes | 11/21/2015 | 1 | 1 | 11/21/2015 | 100 | % | |||||||||||||
| Washington Meat Industry Pension Trust |
$ | 1.1 | $ | — | $ | — | No | 9/12/2015 to 7/23/2016 |
8 | 3 | 5/7/2016 | 79 | % | |||||||||||||
| Other funds |
$ | 3.2 | $ | 1.6 | $ | 0.3 | ||||||||||||||||||||
|
|
|
|
|
|
|
|||||||||||||||||||||
| Total Company contributions to U.S. multiemployer pension plans |
$ | 113.4 | $ | 74.2 | $ | 33.1 | ||||||||||||||||||||
|
|
|
|
|
|
|
|||||||||||||||||||||
| F-86 | (Continued) |
Table of Contents
AB ACQUISITION LLC AND SUBSIDIARIES
Notes to Consolidated Financial Statements
| (1) | PPA established three categories (or “zones”) of plans: (1) “Green Zone” for healthy; (2) “Yellow Zone” for endangered; and (3) “Red Zone” for critical. These categories are based upon the funding ratio of the plan assets to plan liabilities. In general, Green Zone plans have a funding ratio greater than 80%, Yellow Zone plans have a funding ratio between 65—79%, and Red Zone plans have a funding ratio less than 65%. |
| (2) | Sound Retirement Trust information includes former Washington Meat Industry Pension Trust due to merger into Sound Retirement Trust, effective June 30, 2014. |
| (3) | PPA surcharges are five percent or ten percent of eligible contributions and may not apply to all collective bargaining agreements or total contributions to each plan. |
| (4) | Employees on which the Company may contribute under these most significant collective bargaining agreements as a percent of all employees on which the Company may contribute to the respective fund. |
Collective Bargaining Agreements
As of February 28, 2015, the Company had approximately 265,000 employees, of which approximately 174,000 were covered by collective bargaining agreements. During fiscal 2014, collective bargaining agreements covering approximately 50,000 employees were renegotiated. During fiscal 2015, 233 collective bargaining agreements covering approximately 73,000 employees are scheduled to expire.
Multiemployer Health and Welfare Plans
The Company makes contributions to multiemployer health and welfare plans in amounts set forth in the related collective bargaining agreements. These plans provide medical, dental, pharmacy, vision and other ancillary benefits to active employees and retirees as determined by the trustees of each plan. The vast majority of the Company’s contributions covers active employees and as such, may not constitute contributions to a postretirement benefit plan. However, the Company is unable to separate contribution amounts to postretirement benefit plans from contribution amounts paid to active plans. Total contributions to multiemployer health and welfare plans were $316.2 million, $260.4 million and $6.6 million for fiscal 2014, 2013 and 2012, respectively.
Defined Contribution Plans and Supplemental Retirement Plans
Many of the Company’s employees are eligible to contribute a percentage of their compensation to defined contribution plans (“401(k) Plans”). Participants in the 401(k) Plans may become eligible to receive a profit-sharing allocation in the form of a discretionary Company contribution based on employee compensation. In addition, the Company may also provide matching contributions based on the amount of eligible compensation contributed by the employee. The Company provides supplemental retirement benefits through the Albertson’s LLC Executive Deferred Compensation Makeup Plan and the United Supplemental Plan, which provide certain key employees with retirement benefits that supplement those provided by the 401(k) Plans. All Company contributions to the 401(k) Plans are made at the discretion of the Company’s Board of Managers. Total contributions for these plans were $37.0 million, $28.5 million and $6.3 million for fiscal 2014, 2013 and 2012, respectively.
On October 10, 2014, the Company, with the unanimous consent of the plan participants, terminated its LTIPs. The termination of this plan resulted in a charge totaling $78.0 million, which was recorded as compensation expense during the fiscal year ended February 28, 2015. In connection with
| F-87 | (Continued) |
Table of Contents
AB ACQUISITION LLC AND SUBSIDIARIES
Notes to Consolidated Financial Statements
the termination, certain plan participants were required to purchase equity of AB acquisition at an amount equal to 50.0% of their LTIPs payouts upon closing of the Safeway acquisition. The total value of units purchased by these plan participants was approximately $33.2 million.
Note 15—Related Parties
Symphony Investors LLC Tender Offer
On March 21, 2013, associated with the NAI acquisition, Symphony Investors LLC (“Symphony”), which is owned by a consortium of investors led by Cerberus, acquired 21.1% of SuperValu shares. Symphony held 20.7% of SuperValu shares at February 28, 2015.
Transition Services Agreement with SuperValu
The Consolidated Financial Statements include expenses for certain support functions provided by SuperValu through Transition Services Agreements (“TSA”) including, but not limited to, general corporate expenses related to finance, legal, information technology, warehouse and distribution, human resources, communications, processing and handling cardholder data and procurement of goods. Prior to March 21, 2013, the cost structure of the TSA was based mainly on the number of Company stores and distribution centers serviced by SuperValu, as well as a fixed annual fee of $20.0 million. On March 21, 2013, the Company entered into a new TSA with SuperValu for a total annual fee of $200.0 million, paid monthly over the first 12 months of the new TSA. In December 2013, the fee of $200.0 million was renegotiated with SuperValu and reduced to $193.0 million. Beginning in month 13, fees are calculated on a per-store and distribution center basis of fixed and variable costs for services. The Company also paid a transition fee of $60.0 million amortized on a straight line basis over the 30-month life of the agreement.
On September 12, 2014, the Company exercised its right to renew the term of the TSA with SuperValu for an additional year. The original TSA had an initial term expiring on September 21, 2015 and included 10 options for additional one-year renewals with notice given to SuperValu at least 12 months prior to the expiration of the then current term. The renewal extends the TSA through September 21, 2016.
On April 16, 2015, the Company entered into a letter agreement regarding the TSA with SuperValu (the “TSA Letter Agreement”) pursuant to which SuperValu will provide services to the Company as needed to transition and wind down the TSA and the services SuperValu provides under the TSA. In exchange for these transition and wind down services, the agreement calls for eight payments of $6.3 million every six months for aggregate fees of $50.0 million. These payments are separate from and incremental to the fixed and variable fees the Company pays to SuperValu under the TSA. The parties also agreed to negotiate in good faith if either the costs associated with the transition and wind down services are materially higher (i.e. 5.0% or more) than anticipated, or SuperValu is not performing in all material respects the transition and wind down services as needed to support the Company’s transition and wind down activities.
| F-88 | (Continued) |
Table of Contents
AB ACQUISITION LLC AND SUBSIDIARIES
Notes to Consolidated Financial Statements
Summary of SuperValu activity
Related party activities with SuperValu that are included in the Consolidated Statements of Operations and Comprehensive Loss consisted of the following (in millions):
| Fiscal 2014 | Fiscal 2013 | |||||||
| Supply agreements included in Cost of sales |
$ | 1,359.4 | $ | 1,389.8 | ||||
| Selling and administrative expenses |
215.2 | 202.4 | ||||||
|
|
|
|
|
|||||
| Total |
$ | 1,574.6 | $ | 1,592.2 | ||||
|
|
|
|
|
|||||
Trademark Cross-Licensing Agreements
In conjunction with the NAI acquisition, the Company entered into separate trademark cross-licensing agreements with SuperValu. These cross-licensing agreements include a limited royalty-free license to certain proprietary rights (e.g., trademarks, trade names, trade dress, service markets, banners, etc.) among and between the entities, for an initial period of three years.
Cerberus
Immediately after the consummation of the NAI acquisition from SuperValu, the Company paid Cerberus a transaction fee of $15.0 million. As a result of the Safeway acquisition and pursuant to the members’ agreement, as amended, the management agreement with Cerberus was terminated, and the remaining annual management fees of $9.0 million were paid by the Company. A new agreement with Cerberus and the consortium of investors commenced on January 30, 2015, requiring a management fee of $13.8 million, payable annually beginning January 30, 2015. The agreement term is four years. The Company also paid an affiliate of Cerberus, Cerberus Operations and Advisory Committee, LLC, fees totaling $1.7 million and $0.5 million in fiscal 2014 and fiscal 2013, respectively, for consulting services provided in connection with improving the Company’s operations.
Note 16—Commitments and Contingencies and Off Balance Sheet Arrangements
Guarantees
California Department of Industrial Relations: On October 24, 2012, the Office of Self-Insurance Plans, a program within the director’s office of the California Department of Industrial Relations (the “DIR”), notified SuperValu that additional security was required to be posted in connection with the Company’s, and certain other subsidiaries’, California self-insured workers’ compensation obligations pursuant to applicable regulations. The notice from the DIR stated that the additional security was required as a result of an increase in estimated future liabilities, as determined by the DIR pursuant to a review of the self-insured California workers’ compensation claims with respect to the applicable businesses, and a decline in SuperValu’s net worth. A security deposit of $271.0 million was demanded in addition to security of $427.0 million provided through SuperValu’s participation in California’s Self-Insurer’s Security Fund (the “Fund”). SuperValu appealed this demand. The Fund has attempted to create a secured interest in certain assets of the Company for the total amount of the additional security deposit. The dispute with the Fund and the DIR was resolved through a settlement agreement as part of the NAI acquisition on March 21, 2013, and the primary obligation to the Fund and the DIR was retained by the Company following the NAI acquisition. Subsequent to the NAI acquisition, the Company set up a fund of $75.0 million to be used for the payment of future claims. In addition, the Company provided to the DIR a $225.0 million LOC to collateralize any of the self-insurance workers’ compensation future obligations in excess of the $75.0 million fund. As of February 28, 2015, the balance remaining in the fund for payment of future claims was immaterial. Prior to January 21, 2014, the California Self Insurers’ Security Fund also held mortgage liens against
| F-89 | (Continued) |
Table of Contents
AB ACQUISITION LLC AND SUBSIDIARIES
Notes to Consolidated Financial Statements
the Jewel real estate assets as collateral. On January 21, 2014, the Company entered into a Collateral Substitution Agreement with the California Self-Insurers’ Security Fund to provide an irrevocable LOC to replace the mortgage liens against the Jewel real estate assets and the previously issued $225.0 million LOC. The amount of the LOC is adjusted semi-annually based on annual filings of an actuarial study reflecting liabilities as of December 31 of each year reduced by claim closures and settlements. The related LOC was $338.0 million and $431.0 million as of February 28, 2015 and February 20, 2014, respectively.
The Company is contingently liable for leases that have been assigned to various third parties, including those in connection with facility closings and dispositions. The Company could be required to satisfy the obligations under the leases if any of the assignees are unable to fulfill their lease obligations. Due to the wide distribution of the Company’s assignments among third parties and various other remedies available, the Company believes the likelihood that it will be required to assume a material amount of these obligations is remote. Accordingly, no amount has been recorded in the accompanying Consolidated Balance Sheets for these contingent obligations. The Company expenses legal costs associated with loss contingencies as incurred.
The Company also provides guarantees, indemnifications and assurances to others in the ordinary course of its business.
Legal Contingencies
Various claims and lawsuits arising in the normal course of business, including suits charging violations of certain wage and hour or civil rights laws, are pending against the Company. Some of these suits purport or have been determined to be class actions and/or seek substantial damages. Any damages that may be awarded in antitrust cases will be automatically trebled.
The Company continually evaluates its exposure to loss contingencies arising from pending or threatened litigation and believes it has made provisions where the loss contingency can be reasonably estimated and an adverse outcome is probable. Nonetheless, assessing and predicting the outcomes of these matters involves substantial uncertainties. Management currently believes that the aggregate range of reasonably possible loss for the Company’s exposure in excess of amounts accrued is expected to be immaterial to the Company. It remains possible that despite management’s current belief, material differences in actual outcomes or changes in management’s evaluation or predictions could arise that could have a material effect on the Company’s financial condition, results of operations or cash flows.
Appraisal of Safeway Inc.: Certain holders of Safeway common stock, who held approximately 17.7 million shares, sought appraisal rights under Section 262 of the Delaware General Corporation Law, requesting a determination that the per share merger consideration payable in the Safeway acquisition does not represent fair value for their shares. Five petitions for appraisal were filed in Delaware Chancery Court, consolidated under the title In re Appraisal of Safeway Inc., on behalf of all former holders of Safeway common stock who had demanded appraisal. In May 2015, the Company settled with respect to five of the seven petitioners representing approximately 14.0 million shares for approximately $621 million. The settlement amount includes the merger consideration of $34.92 per share, or $487 million, with the additional $134 million recorded as an operating expense in the fourth quarter of fiscal 2014. Approximately $100 million of the $621 million was paid as of February 28, 2015, with the remaining amount recorded in Other current liabilities as of February 28, 2015. The appraisal action is ongoing with respect to two remaining petitioners, with trial on the merits set to commence in April 2016. These remaining petitioners are holders of approximately 3.74 million shares
| F-90 | (Continued) |
Table of Contents
AB ACQUISITION LLC AND SUBSIDIARIES
Notes to Consolidated Financial Statements
and have previously accepted a tender offer of the merger consideration of $34.92 per share acquisition consideration, which stops statutory interest from accruing on the amount of any recovery. If the remaining petitioners are successful in the appraisal proceeding, they could be entitled to more for their stock than the per share acquisition consideration payable in the acquisition, plus statutory interest on that additional amount. As of February 28, 2015, the Company has recorded a liability for these remaining petitioners.
Security Breach: On August 14, 2014, AB Acquisition announced that it had experienced a criminal intrusion by installation of malware on a portion of its computer network that processes payment card transactions for retail store locations for its Shaw’s, Star Market, Acme, Jewel-Osco and Albertsons retail banners. On September 29, 2014, the Company announced that it had experienced a second and separate criminal intrusion. The Company believes these were attempts to collect payment card data. The Company, relying on its IT service provider, SuperValu, took immediate steps to secure the affected part of its network. The Company believes that it has eradicated the malware used in each intrusion. The Company has notified federal law enforcement authorities, the major payment card networks, and its insurance carriers and is cooperating in their efforts to investigate these intrusions. As required by the payment card networks, the Company retained a firm to conduct a forensic investigation into the intrusions. Recently, the firm issued a report for the first intrusion (a copy of which has been provided to the card networks), finding that, although the Company’s network had previously been found to be compliant with payment card industry data security standards (PCI DSS), not all of these standards had been met, and this non-compliance may have contributed to or caused at least some portion of the compromise that occurred during the first intrusion. A report for the second intrusion is still pending. The Company believes it is probable that the payment card networks will make claims against the Company following the conclusion of the ongoing forensic investigation and associated analysis. These claims will likely include amounts for incremental counterfeit fraud losses and non-ordinary course operating expenses (such as card reissuance costs) that the payment card networks assert they or their issuing banks have incurred. If the payment card networks assert claims against it, the Company currently intends to dispute those claims and assert available defenses. At the present time, the Company cannot reasonably estimate a range of losses because to date no claims have been asserted and because significant factual and legal issues remain unresolved. The Company will continue to evaluate information as it becomes known and will record an estimate for losses at the time or times when it is both probable that a loss has been incurred and the amount of the loss is reasonably estimable. As a result of the criminal intrusions, two class action complaints were filed against the Company by consumers and are currently pending, Mertz v. SuperValu Inc. et al. filed in federal court in the state of Minnesota and Rocke v. SuperValu Inc. et al. filed in federal court in the state of Idaho, alleging deceptive trade practices, negligence and invasion of privacy. Plaintiffs seek unspecified damages. The Judicial Panel on Multidistrict Litigation has consolidated the class actions and transferred the cases to the District of Minnesota. Based on proceedings to date, the Company is currently unable to determine the probability of the outcome of this matter or the range of reasonably possible loss, if any.
Cicairos, et al / Bluford: On August 18, 2001, a group of truck drivers from Safeway’s Tracy, California distribution center filed an action in California Superior Court, San Joaquin County entitled Cicairos, et al. v. Summit Logistics, alleging that Summit Logistics, the entity with whom Safeway contracted to operate the distribution center until August 2003, failed to provide meal periods, rest periods and itemized wage statements to the drivers in violation of California state law. Under its contract with Summit, Safeway is obligated to defend and indemnify Summit Logistics in this lawsuit. On February 6, 2007, another group of truck drivers from the Tracy distribution center filed a similar action in the same court, entitled Bluford, et al. v. Safeway Inc., alleging essentially the same claims
| F-91 | (Continued) |
Table of Contents
AB ACQUISITION LLC AND SUBSIDIARIES
Notes to Consolidated Financial Statements
against Safeway. After lengthy litigation in the trial and appellate courts, both cases were certified as class actions and assigned to a single judge for all purposes in October 2013. On February 18, 2015, the parties signed a preliminary agreement of settlement that calls for Safeway to pay approximately $31.0 million in total. This amount consists of a settlement fund of $30.2 million, out of which will be paid relief to the class, and attorneys’ fees and costs as awarded by the court. Safeway will also pay third-party settlement administrator costs, and its employer share of FICA/Medicare taxes. The motion
for preliminary approval of the settlement has been granted. A hearing on the motion for final approval of the settlement is set for August 14, 2015. At this time, the Company does not believe that financial exposure to loss in excess of the amount accrued is probable.
Drug Enforcement Agency: The Company has received two subpoenas from the Drug Enforcement Administration (“DEA”) concerning Safeway’s record keeping, reporting and related practices associated with the loss or theft of controlled substances. We are not a party to any pending DEA administrative or judicial proceeding arising from or related to these subpoenas. The Company is cooperating with the DEA in all investigative matters.
Newman Development Group of Pottstown: On March 20, 2002, Safeway’s Genuardi subsidiary was sued by a real estate developer for breach of a lease in the Court of Common Pleas, Chester County (Pa.), in a case entitled Newman Development Group of Pottstown, LLC v. Genuardi’s Family Markets, Inc. and Safeway Inc. On December 19, 2006, the trial court entered a judgment in favor of Newman in the amount of $0.3 million. On April 25, 2008, the appellate court remanded the case to the trial court for recalculation of damages. On February 25, 2010, the trial court entered a judgment in favor of Newman in the amount of $18.5 million. Safeway appealed, and on March 18, 2011, the appellate court held that Safeway had waived its right to appeal. The Pennsylvania Supreme Court vacated this order on November 1, 2012. On July 29, 2013, an appellate court panel reversed three key elements of the trial court’s damages calculation in Safeway’s favor. On August 19, 2014, a rehearing by the appellate court en banc rejected the panel’s July 29, 2013 ruling, effectively reinstating the $18.5 million judgment. The Pennsylvania Supreme Court declined to hear Safeway’s appeal on June 24, 2015, and the case will return to the trial court for calculation of interest and attorneys’ fees and entry of judgment. At this time, the Company does not believe that financial exposure to loss in excess of the amount accrued is probable.
Rodman: On June 17, 2011, a customer of Safeway’s home delivery business (safeway.com) filed a class action complaint in the United States District Court for the Northern District of California entitled Rodman v. Safeway Inc., alleging that Safeway had inaccurately represented on its home delivery website that the prices paid there were the same as the prices in the brick-and-mortar retail store. Rodman asserted claims for breach of contract and unfair business practices under California law. The court certified a class for the breach of contract claim, but denied class treatment for the California business practices claims. On Rodman’s motion for partial summary judgment, the court held that Rodman had established a prima facie claim for breach of contract, and that Safeway had not effectively cured the breach by revising the language on its website in November 2011. The court noted that its ruling did not address Safeway’s affirmative defenses or the calculation of damages. The matter is set for trial on October 5, 2015. Based on proceedings to date, the Company is currently unable to determine the probability of the outcome of this matter or the range of reasonably possible loss, if any.
| F-92 | (Continued) |
Table of Contents
AB ACQUISITION LLC AND SUBSIDIARIES
Notes to Consolidated Financial Statements
Other Commitments
In the ordinary course of business, the Company enters into various supply contracts to purchase products for resale and purchase and service contracts for fixed asset and information technology commitments. These contracts typically include volume commitments or fixed expiration dates, termination provisions and other standard contractual considerations.
Note 17—Other Comprehensive Income or Loss
Total comprehensive earnings are defined as all changes in members’ equity during a period, other than those from investments by or distributions to members. Generally, for the Company, total comprehensive income equals net income plus or minus adjustments for pension and other post-retirement liabilities and interest rate swaps.
While total comprehensive earnings are the activity in a period and are largely driven by net earnings in that period, accumulated other comprehensive income or loss (“AOCI”) represents the cumulative balance of other comprehensive income, net of tax, as of the balance sheet date. AOCI is primarily the cumulative balance related to pension adjustments and interest rate swaps. Changes in the AOCI balance by component are shown below (in millions):
| Fiscal 2014 | ||||||||||||||||
| Pension plan items |
Interest rate swaps |
Other | Total Comprehensive income (loss) including noncontrolling interests |
|||||||||||||
| Beginning balance |
$ | 17.8 | $ | — | $ | 0.2 | $ | 18.0 | ||||||||
| Other comprehensive income (loss) before reclassifications |
120.7 | (30.5 | ) | 2.5 | 92.7 | |||||||||||
| Amounts reclassified from Accumulated other comprehensive income (loss) |
— | 11.3 | — | 11.3 | ||||||||||||
| Tax (expense) benefit |
(61.4 | ) | (1.4 | ) | 0.4 | (62.4 | ) | |||||||||
|
|
|
|
|
|
|
|
|
|||||||||
| Net current-period other comprehensive income (loss) |
59.3 | (20.6 | ) | 2.9 | 41.6 | |||||||||||
|
|
|
|
|
|
|
|
|
|||||||||
| Ending balance |
$ | 77.1 | $ | (20.6 | ) | $ | 3.1 | $ | 59.6 | |||||||
|
|
|
|
|
|
|
|
|
|||||||||
| Fiscal 2013 | ||||||||||||||||
| Pension plan items |
Interest rate swaps |
Other | Total Comprehensive income (loss) including noncontrolling interests |
|||||||||||||
| Beginning balance |
$ | — | $ | — | $ | — | $ | — | ||||||||
| Other comprehensive income before reclassifications |
29.5 | — | 0.2 | 29.7 | ||||||||||||
| Tax (expense) |
(11.7 | ) | — | — | (11.7 | ) | ||||||||||
|
|
|
|
|
|
|
|
|
|||||||||
| Net current-period other comprehensive income (loss) |
17.8 | — | 0.2 | 18.0 | ||||||||||||
|
|
|
|
|
|
|
|
|
|||||||||
| Ending balance |
$ | 17.8 | $ | — | $ | 0.2 | $ | 18.0 | ||||||||
|
|
|
|
|
|
|
|
|
|||||||||
Note 18—Subsequent Events
The Company has evaluated all subsequent events as of July 7, 2015, which represents the date of issuance of these Consolidated Financial Statements.
| F-93 | (Continued) |
Table of Contents
Report of Independent Registered Public Accounting Firm
To the Board of Directors and Stockholders of Safeway Inc.:
We have audited the accompanying consolidated balance sheets of Safeway Inc. and subsidiaries (the “Company”) as of January 3, 2015 and December 28, 2013, and the related consolidated statements of income, comprehensive (loss) income, stockholders’ equity, and cash flows for each of the three years in the period ended January 3, 2015. These financial statements are the responsibility of the Company’s management. Our responsibility is to express an opinion on these financial statements based on our audits.
We conducted our audits in accordance with the standards of the Public Company Accounting Oversight Board (United States). Those standards require that we plan and perform the audit to obtain reasonable assurance about whether the financial statements are free of material misstatement. An audit includes examining, on a test basis, evidence supporting the amounts and disclosures in the financial statements. An audit also includes assessing the accounting principles used and significant estimates made by management, as well as evaluating the overall financial statement presentation. We believe that our audits provide a reasonable basis for our opinion.
In our opinion, such consolidated financial statements present fairly, in all material respects, the financial position of Safeway Inc. and subsidiaries as of January 3, 2015 and December 28, 2013, and the results of their operations and their cash flows for each of the three years in the period ended January 3, 2015, in conformity with accounting principles generally accepted in the United States of America.
/s/ Deloitte & Touche LLP
San Francisco, CA
March 3, 2015
F-94
Table of Contents
Consolidated Statements of Income
(In millions, except per-share amounts)
| 53 Weeks 2014 |
52 Weeks 2013 |
52 Weeks 2012 |
||||||||||
| Sales and other revenue |
$ | 36,330.2 | $ | 35,064.9 | $ | 35,161.5 | ||||||
| Cost of goods sold |
(26,648.2 | ) | (25,833.4 | ) | (25,932.4 | ) | ||||||
|
|
|
|
|
|
|
|||||||
| Gross profit |
9,682.0 | 9,231.5 | 9,229.1 | |||||||||
| Operating and administrative expense |
(9,147.5 | ) | (8,680.0 | ) | (8,593.7 | ) | ||||||
|
|
|
|
|
|
|
|||||||
| Operating profit |
534.5 | 551.5 | 635.4 | |||||||||
| Interest expense |
(198.9 | ) | (273.0 | ) | (300.6 | ) | ||||||
| Loss on extinguishment of debt |
(84.4 | ) | (10.1 | ) | — | |||||||
| Loss on foreign currency translation |
(131.2 | ) | (57.4 | ) | — | |||||||
| Other income, net |
45.0 | 40.6 | 27.4 | |||||||||
|
|
|
|
|
|
|
|||||||
| Income before income taxes |
165.0 | 251.6 | 362.2 | |||||||||
| Income taxes |
(61.8 | ) | (34.5 | ) | (113.0 | ) | ||||||
|
|
|
|
|
|
|
|||||||
| Income from continuing operations, net of tax |
103.2 | 217.1 | 249.2 | |||||||||
| Income from discontinued operations, net of tax |
9.3 | 3,305.1 | 348.9 | |||||||||
|
|
|
|
|
|
|
|||||||
| Net income before allocation to noncontrolling interests |
112.5 | 3,522.2 | 598.1 | |||||||||
| Less noncontrolling interests |
0.9 | (14.7 | ) | (1.6 | ) | |||||||
|
|
|
|
|
|
|
|||||||
| Net income attributable to Safeway Inc. |
$ | 113.4 | $ | 3,507.5 | $ | 596.5 | ||||||
|
|
|
|
|
|
|
|||||||
| Basic earnings per share: |
||||||||||||
| Continuing operations |
$ | 0.44 | $ | 0.90 | $ | 1.01 | ||||||
| Discontinued operations |
$ | 0.04 | $ | 13.63 | $ | 1.40 | ||||||
|
|
|
|
|
|
|
|||||||
| Total |
$ | 0.48 | $ | 14.53 | $ | 2.41 | ||||||
|
|
|
|
|
|
|
|||||||
| Diluted earnings per share: |
||||||||||||
| Continuing operations |
$ | 0.44 | $ | 0.89 | $ | 1.00 | ||||||
| Discontinued operations |
$ | 0.04 | $ | 13.49 | $ | 1.40 | ||||||
|
|
|
|
|
|
|
|||||||
| Total |
$ | 0.48 | $ | 14.38 | $ | 2.40 | ||||||
|
|
|
|
|
|
|
|||||||
| Weighted average shares outstanding—basic |
228.8 | 239.1 | 245.6 | |||||||||
| Weighted average shares outstanding—diluted |
230.7 | 241.5 | 245.9 | |||||||||
See accompanying notes to consolidated financial statements.
| F-95 |
Table of Contents
Consolidated Statements of Comprehensive (Loss) Income
(In millions)
| 53 Weeks 2014 |
52 Weeks 2013 |
52 Weeks 2012 |
||||||||||
| Net income before allocation to noncontrolling interests |
$ | 112.5 | $ | 3,522.2 | $ | 598.1 | ||||||
| Other comprehensive income (loss): |
||||||||||||
| Translation adjustments, net of tax |
0.2 | (65.0 | ) | (3.1 | ) | |||||||
| Pension and post-retirement benefits adjustment to funded status, net of tax |
(185.0 | ) | 179.5 | (79.7 | ) | |||||||
| Recognition of pension and post-retirement benefits actuarial loss, net of tax |
31.8 | 66.3 | 69.5 | |||||||||
| Other, net of tax |
0.2 | (1.1 | ) | 1.0 | ||||||||
|
|
|
|
|
|
|
|||||||
| Total other comprehensive (loss) income |
(152.8 | ) | 179.7 | (12.3 | ) | |||||||
|
|
|
|
|
|
|
|||||||
| Comprehensive (loss) income including noncontrolling interests |
(40.3 | ) | 3,701.9 | 585.8 | ||||||||
| Comprehensive income (loss) attributable to noncontrolling interests |
0.9 | (14.7 | ) | (1.6 | ) | |||||||
|
|
|
|
|
|
|
|||||||
| Comprehensive (loss) income attributable to Safeway Inc. |
$ | (39.4 | ) | $ | 3,687.2 | $ | 584.2 | |||||
|
|
|
|
|
|
|
|||||||
See accompanying notes to consolidated financial statements.
| F-96 |
Table of Contents
Consolidated Balance Sheets
(In millions, except per-share amounts)
| Year-end 2014 |
Year-end 2013 |
|||||||
| Assets |
||||||||
| Current assets: |
||||||||
| Cash and equivalents |
$ | 2,255.1 | $ | 4,647.3 | ||||
| Receivables |
373.4 | 1,211.4 | ||||||
| Merchandise inventories, net of LIFO reserve of $53.1 and $58.1 |
2,187.9 | 2,089.6 | ||||||
| Income tax receivable |
476.1 | — | ||||||
| Prepaid expenses and other current assets |
277.1 | 371.5 | ||||||
| Assets held for sale |
39.5 | 143.9 | ||||||
|
|
|
|
|
|||||
| Total current assets |
5,609.1 | 8,463.7 | ||||||
|
|
|
|
|
|||||
| Property: |
||||||||
| Land |
1,376.8 | 1,583.2 | ||||||
| Buildings |
5,666.7 | 5,774.0 | ||||||
| Leasehold improvements |
2,804.1 | 2,836.2 | ||||||
| Fixtures and equipment |
6,517.9 | 6,979.1 | ||||||
| Property under capital leases |
708.3 | 550.2 | ||||||
|
|
|
|
|
|||||
| 17,073.8 | 17,722.7 | |||||||
| Less accumulated depreciation and amortization |
(10,297.3 | ) | (10,185.2 | ) | ||||
|
|
|
|
|
|||||
| Total property, net |
6,776.5 | 7,537.5 | ||||||
| Goodwill |
330.9 | 464.5 | ||||||
| Investment in unconsolidated affiliate |
205.8 | 196.1 | ||||||
| Other assets |
454.7 | 557.7 | ||||||
|
|
|
|
|
|||||
| Total assets |
$ | 13,377.0 | $ | 17,219.5 | ||||
|
|
|
|
|
|||||
| Liabilities and Stockholders’ Equity |
||||||||
| Current liabilities: |
||||||||
| Current maturities of notes and debentures |
$ | 3.2 | $ | 252.9 | ||||
| Current obligations under capital leases |
94.7 | 49.3 | ||||||
| Accounts payable |
1,609.6 | 3,376.4 | ||||||
| Accrued salaries and wages |
449.8 | 419.4 | ||||||
| Deferred income taxes |
29.4 | — | ||||||
| Income taxes payable |
— | 1,135.2 | ||||||
| Other accrued liabilities |
566.8 | 623.2 | ||||||
|
|
|
|
|
|||||
| Total current liabilities |
2,753.5 | 5,856.4 | ||||||
|
|
|
|
|
|||||
| Long-term debt: |
||||||||
| Notes and debentures |
2,472.9 | 3,515.3 | ||||||
| Obligations under capital leases |
429.1 | 375.5 | ||||||
|
|
|
|
|
|||||
| Total long-term debt |
2,902.0 | 3,890.8 | ||||||
| Dominick’s multiemployer pension plan withdrawal liability |
455.0 | 294.8 | ||||||
| Pension and post-retirement benefit obligations |
765.0 | 451.4 | ||||||
| Accrued claims and other liabilities |
1,051.1 | 851.0 | ||||||
|
|
|
|
|
|||||
| Total liabilities |
7,926.6 | 11,344.4 | ||||||
| Commitments and contingencies |
||||||||
| Stockholders’ equity: |
||||||||
| Common stock: par value $0.01 per share; 1,500 shares authorized; 245.8 and 244.2 shares issued |
2.5 | 2.4 | ||||||
| Additional paid-in capital |
2,051.3 | 1,981.9 | ||||||
| Treasury stock at cost: 14.4 and 14.1 shares |
(491.8 | ) | (480.6 | ) | ||||
| Accumulated other comprehensive loss |
(421.7 | ) | (271.1 | ) | ||||
| Retained earnings |
4,310.1 | 4,586.9 | ||||||
|
|
|
|
|
|||||
| Total Safeway Inc. equity |
5,450.4 | 5,819.5 | ||||||
| Noncontrolling interest |
— | 55.6 | ||||||
|
|
|
|
|
|||||
| Total equity |
5,450.4 | 5,875.1 | ||||||
|
|
|
|
|
|||||
| Total liabilities and stockholders’ equity |
$ | 13,377.0 | $ | 17,219.5 | ||||
|
|
|
|
|
|||||
See accompanying notes to consolidated financial statements.
F-97
Table of Contents
Consolidated Statements of Cash Flows
(In millions)
| 53 Weeks 2014 |
52 Weeks 2013 |
52 Weeks 2012 |
||||||||||
| Operating Activities: |
||||||||||||
| Net income before allocation to noncontrolling interest |
$ | 112.5 | $ | 3,522.2 | $ | 598.1 | ||||||
| Income from discontinued operations, net of tax |
(9.3 | ) | (3,305.1 | ) | (348.9 | ) | ||||||
|
|
|
|
|
|
|
|||||||
| Income from continuing operations, net of tax |
103.2 | 217.1 | 249.2 | |||||||||
| Reconciliation to net cash flow from operating activities: |
||||||||||||
| Depreciation expense |
921.5 | 922.2 | 952.8 | |||||||||
| Loss on foreign currency |
131.2 | 57.4 | — | |||||||||
| Property impairment charges |
56.1 | 35.6 | 33.6 | |||||||||
| Share-based employee compensation |
24.7 | 50.4 | 48.4 | |||||||||
| LIFO (income) expense |
(5.0 | ) | (14.3 | ) | 0.7 | |||||||
| Equity in earnings of unconsolidated affiliate |
(16.2 | ) | (17.6 | ) | (17.5 | ) | ||||||
| Net pension and post-retirement benefits expense |
76.2 | 114.8 | 129.0 | |||||||||
| Contributions to pension and post-retirement benefit plans |
(13.3 | ) | (56.3 | ) | (110.3 | ) | ||||||
| Gain on sale of PDC |
(22.0 | ) | — | — | ||||||||
| Gain on property dispositions and lease exit costs, net |
(38.8 | ) | (51.2 | ) | (48.3 | ) | ||||||
| Loss on extinguishment of debt |
84.4 | 10.1 | — | |||||||||
| Increase in accrued claims and other liabilities |
26.2 | 9.2 | 60.5 | |||||||||
| Deferred income taxes |
89.6 | (276.6 | ) | (36.1 | ) | |||||||
| Other |
20.8 | 36.9 | 20.2 | |||||||||
| Changes in working capital items: |
||||||||||||
| Receivables |
16.5 | (32.0 | ) | 20.3 | ||||||||
| Inventories at FIFO cost |
(128.1 | ) | (76.5 | ) | (107.4 | ) | ||||||
| Prepaid expenses and other current assets |
63.4 | (49.5 | ) | (20.5 | ) | |||||||
| Income taxes |
(90.6 | ) | 71.0 | (54.3 | ) | |||||||
| Payables and accruals |
87.9 | 120.7 | 106.2 | |||||||||
|
|
|
|
|
|
|
|||||||
| Net cash flow from operating activities—continuing operations |
1,387.7 | 1,071.4 | 1,226.5 | |||||||||
| Net cash flow (used by) from operating activities—discontinued operations |
(2,008.9 | ) | 230.1 | 343.2 | ||||||||
|
|
|
|
|
|
|
|||||||
| Net cash flow (used by) from operating activities |
(621.2 | ) | 1,301.5 | 1,569.7 | ||||||||
|
|
|
|
|
|
|
|||||||
| Investing Activities: |
||||||||||||
| Cash paid for property additions |
(711.2 | ) | (738.2 | ) | (800.1 | ) | ||||||
| Proceeds from sale of PDC |
637.2 | — | — | |||||||||
| Proceeds from sale of property |
99.2 | 220.3 | 263.0 | |||||||||
| Proceeds from company-owned life insurance policies |
— | 68.7 | — | |||||||||
| Restricted cash proceeds from the sale of PDC |
(61.9 | ) | — | — | ||||||||
| Increase in restricted cash |
(40.0 | ) | — | — | ||||||||
| Release of restricted cash for payment of mortgage |
40.0 | — | — | |||||||||
| Advances to Blackhawk |
(27.7 | ) | — | — | ||||||||
| Other |
(51.2 | ) | 6.5 | (56.1 | ) | |||||||
|
|
|
|
|
|
|
|||||||
| Net cash flow used by investing activities—continuing operations |
(115.6 | ) | (442.7 | ) | (593.2 | ) | ||||||
| Net cash flow from investing activities—discontinued operations |
226.1 | 5,352.3 | 21.2 | |||||||||
|
|
|
|
|
|
|
|||||||
| Net cash flow from (used by) investing activities |
110.5 | 4,909.6 | (572.0 | ) | ||||||||
| F-98 | (Continued) |
Table of Contents
SAFEWAY INC. AND SUBSIDIARIES
Consolidated Statements of Cash Flows
(In millions)
| 53 Weeks 2014 |
52 Weeks 2013 |
52 Weeks 2012 |
||||||||||
| Financing Activities: |
||||||||||||
| Additions to long-term borrowings |
$ | 239.8 | $ | 785.5 | $ | 3,508.1 | ||||||
| Proceeds from PDC sale for development properties recorded (See Note D) |
120.1 | — | — | |||||||||
| Principal payments on long-term borrowings |
(1,731.7 | ) | (2,171.5 | ) | (3,390.6 | ) | ||||||
| Payments of debt extinguishment costs |
(82.0 | ) | (11.0 | ) | — | |||||||
| Purchase of treasury stock |
— | (663.7 | ) | (1,274.5 | ) | |||||||
| Dividends paid |
(251.8 | ) | (181.4 | ) | (163.9 | ) | ||||||
| Net proceeds from exercise of stock options |
29.7 | 240.1 | 3.8 | |||||||||
| Excess tax benefit from share-based employee compensation |
15.4 | 6.7 | 1.3 | |||||||||
| Other |
(11.6 | ) | (8.6 | ) | (13.3 | ) | ||||||
|
|
|
|
|
|
|
|||||||
| Net cash flow used by financing activities—continuing operations |
(1,672.1 | ) | (2,003.9 | ) | (1,329.1 | ) | ||||||
| Net cash flow (used by) from financing activities—discontinued operations |
(54.9 | ) | 157.7 | (44.7 | ) | |||||||
|
|
|
|
|
|
|
|||||||
| Net cash flow used by financing activities |
(1,727.0 | ) | (1,846.2 | ) | (1,373.8 | ) | ||||||
|
|
|
|
|
|
|
|||||||
| Effect of changes in exchange rates on cash |
(154.5 | ) | (69.8 | ) | (1.1 | ) | ||||||
|
|
|
|
|
|
|
|||||||
| (Decrease) increase in cash and equivalents |
(2,392.2 | ) | 4,295.1 | (377.2 | ) | |||||||
| Cash and Equivalents: |
||||||||||||
| Beginning of year |
4,647.3 | 352.2 | 729.4 | |||||||||
|
|
|
|
|
|
|
|||||||
| End of year |
$ | 2,255.1 | $ | 4,647.3 | $ | 352.2 | ||||||
|
|
|
|
|
|
|
|||||||
| Other Cash Information—Continuing and Discontinued Operations: |
||||||||||||
| Cash payments during the year for: |
||||||||||||
| Interest |
$ | 218.5 | $ | 289.2 | $ | 322.3 | ||||||
| Income taxes, net of refunds |
1,397.7 | 497.2 | 380.9 | |||||||||
| Non-Cash Investing and Financing Activities—Continuing and Discontinued Operations: |
||||||||||||
| Capital lease obligations entered into |
$ | 180.0 | $ | 78.0 | $ | 48.1 | ||||||
| Purchases of property, plant and equipment included in accounts payable |
71.8 | 128.3 | 107.8 | |||||||||
| Mortgage notes assumed in property additions |
— | — | 42.9 | |||||||||
See accompanying notes to consolidated financial statements.
F-99
Table of Contents
Consolidated Statements of Stockholders’ Equity
(In millions, except per-share amounts)
| 53 Weeks 2014 |
52 Weeks 2013 |
52 Weeks 2012 |
||||||||||
| Common Stock: |
||||||||||||
| Balance, beginning of year |
$ | 2.4 | $ | 6.1 | $ | 6.0 | ||||||
| Options exercised |
0.1 | — | 0.1 | |||||||||
| Retirement of treasury stock(1) |
— | (3.7 | ) | — | ||||||||
|
|
|
|
|
|
|
|||||||
| Balance, end of year |
2.5 | 2.4 | 6.1 | |||||||||
|
|
|
|
|
|
|
|||||||
| Additional Paid-In Capital: |
||||||||||||
| Balance, beginning of year |
1,981.9 | 4,505.6 | 4,463.9 | |||||||||
| Share-based employee compensation |
27.7 | 59.1 | 55.1 | |||||||||
| Options exercised/cancelled, net |
40.4 | 210.6 | (11.9 | ) | ||||||||
| Initial public offering of Blackhawk, net |
— | 161.5 | — | |||||||||
| Retirement of treasury stock(1) |
— | (2,989.0 | ) | — | ||||||||
| Other(2) |
1.3 | 34.1 | (1.5 | ) | ||||||||
|
|
|
|
|
|
|
|||||||
| Balance, end of year |
2,051.3 | 1,981.9 | 4,505.6 | |||||||||
|
|
|
|
|
|
|
|||||||
| Treasury Stock: |
||||||||||||
| Balance, beginning of year |
(480.6 | ) | (9,119.8 | ) | (7,874.4 | ) | ||||||
| Purchase of treasury stock |
— | (663.7 | ) | (1,240.3 | ) | |||||||
| Retirement of treasury stock(1) |
— | 9,313.4 | — | |||||||||
| Other |
(11.2 | ) | (10.5 | ) | (5.1 | ) | ||||||
|
|
|
|
|
|
|
|||||||
| Balance, end of year |
(491.8 | ) | (480.6 | ) | (9,119.8 | ) | ||||||
|
|
|
|
|
|
|
|||||||
| Retained Earnings: |
||||||||||||
| Balance, beginning of year |
4,586.9 | 7,585.6 | 7,151.1 | |||||||||
| Net income attributable to Safeway Inc. |
113.4 | 3,507.5 | 596.5 | |||||||||
| Cash dividends declared ($0.890, $0.775 and $0.670 per share) |
(205.8 | ) | (185.5 | ) | (162.0 | ) | ||||||
| Distribution of Blackhawk(3) |
(184.4 | ) | — | — | ||||||||
| Retirement of treasury stock(1) |
— | (6,320.7 | ) | — | ||||||||
|
|
|
|
|
|
|
|||||||
| Balance, end of year |
4,310.1 | 4,586.9 | 7,585.6 | |||||||||
|
|
|
|
|
|
|
|||||||
| Accumulated Other Comprehensive Loss: |
||||||||||||
| Balance, beginning of year |
(271.1 | ) | (73.8 | ) | (61.5 | ) | ||||||
| Translation adjustments |
0.2 | (65.0 | ) | (3.1 | ) | |||||||
| Pension and post-retirement benefits adjustment to funded status (net of tax of $118.5, $87.1 and $45.5) |
(185.0 | ) | 179.5 | (79.7 | ) | |||||||
| Recognition of pension and post-retirement benefits actuarial loss (net of tax of $20.5, $38.7 and $40.5) |
31.8 | 66.3 | 69.5 | |||||||||
| Distribution of Blackhawk(3) |
2.2 | — | — | |||||||||
| Sale of Canada Safeway Limited(4) |
— | (377.0 | ) | — | ||||||||
| Other (net of tax of $0.2, $0.6 and $0.5) |
0.2 | (1.1 | ) | 1.0 | ||||||||
|
|
|
|
|
|
|
|||||||
| Balance, end of year |
(421.7 | ) | (271.1 | ) | (73.8 | ) | ||||||
|
|
|
|
|
|
|
|||||||
| F-100 | (Continued) |
Table of Contents
SAFEWAY INC. AND SUBSIDIARIES
Consolidated Statements of Stockholders’ Equity
(In millions, except per-share amounts)
| 53 Weeks 2014 |
52 Weeks 2013 |
52 Weeks 2012 |
||||||||||
| Noncontrolling Interests: |
||||||||||||
| Balance, beginning of year |
$ | 55.6 | $ | 5.5 | $ | 6.0 | ||||||
| Noncontrolling interests acquired through Blackhawk’s acquisition of Retailo |
— | 6.9 | — | |||||||||
| Net earnings attributable to noncontrolling interests, net of tax |
(0.9 | ) | 14.7 | 1.6 | ||||||||
| Distribution of Blackhawk(3) |
(56.3 | ) | — | — | ||||||||
| Other(2) |
1.6 | 28.5 | (2.1 | ) | ||||||||
|
|
|
|
|
|
|
|||||||
| Balance, end of year |
— | 55.6 | 5.5 | |||||||||
|
|
|
|
|
|
|
|||||||
| Total Equity |
$ | 5,450.4 | $ | 5,875.1 | $ | 2,909.2 | ||||||
|
|
|
|
|
|
|
|||||||
| Number of Shares Issued | ||||||||||||
| Common Stock: |
||||||||||||
| Balance, beginning of year |
244.2 | 605.3 | 604.5 | |||||||||
| Options exercised |
1.7 | 9.6 | 0.1 | |||||||||
| Restricted stock grants, net of forfeitures |
(0.1 | ) | 0.5 | 0.7 | ||||||||
| Performance share awards |
— | 0.4 | — | |||||||||
| Retirement of treasury stock(1) |
— | (371.6 | ) | — | ||||||||
|
|
|
|
|
|
|
|||||||
| Balance, end of year |
245.8 | 244.2 | 605.3 | |||||||||
|
|
|
|
|
|
|
|||||||
| Number of Shares | ||||||||||||
| Treasury Stock: |
||||||||||||
| Balance, beginning of year |
(14.1 | ) | (365.8 | ) | (307.9 | ) | ||||||
| Purchase of treasury stock |
— | (19.5 | ) | (57.6 | ) | |||||||
| Retirement of treasury stock(1) |
— | 371.6 | — | |||||||||
| Other |
(0.3 | ) | (0.4 | ) | (0.3 | ) | ||||||
|
|
|
|
|
|
|
|||||||
| Balance, end of year |
(14.4 | ) | (14.1 | ) | (365.8 | ) | ||||||
|
|
|
|
|
|
|
|||||||
| (1) | Safeway retired 371.6 million shares in 2013. See Note L under the caption “Retirement of Treasury Stock.” |
| (2) | Fiscal 2013 primarily results from Blackhawk IPO. |
| (3) | Safeway distributed its remaining shares of Blackhawk to Safeway stockholders in 2014. See Note B. |
| (4) | Safeway completed the sale of CSL in 2013. See Note B. |
See accompanying notes to consolidated financial statements.
F-101
Table of Contents
Notes to Consolidated Financial Statements
Note A: The Company and Significant Accounting Policies
The Company Safeway Inc. (“Safeway” or the “Company”) is one of the largest food and drug retailers in the United States, with 1,326 stores as of year-end 2014. Safeway’s U.S. retail operations are located principally in California, Hawaii, Oregon, Washington, Alaska, Colorado, Arizona, Texas, and the Mid-Atlantic region. In support of its retail operations, the Company has an extensive network of distribution, manufacturing and food processing facilities. The Company also owns and operates GroceryWorks.com Operating Company, LLC, an online grocery channel, doing business under the names Safeway.com and Vons.com (collectively “Safeway.com”).
On January 30, 2015, Safeway was acquired by AB Acquisition LLC (“AB Acquisition”) pursuant to an Agreement and Plan of Merger (as amended on April 7, 2014 and on June 13, 2014, the “Merger Agreement”), with AB Acquisition LLC , Albertson’s Holdings LLC (“Albertsons Holdings”), a subsidiary of AB Acquisition, Albertson’s LLC (“Albertson’s LLC”), a subsidiary of Albertsons Holdings, and Saturn Acquisition Merger Sub, Inc. (“Merger Sub” and together with AB Acquisition, Albertsons Holdings and Albertson’s LLC, “Albertsons”), a subsidiary of Albertsons Holdings, in a transaction hereinafter referred to as the “Merger.” See Note V to the consolidated financial statements for additional information. Unless otherwise noted, these consolidated financial statements and accompanying notes do not give effect to the Merger.
On December 23, 2014, Safeway and its wholly-owned real-estate development subsidiary, Property Development Centers, LLC (“PDC”), sold substantially all of the net assets of PDC to Terramar Retail Centers, LLC (“Terramar”). Due to leasing back certain properties, Safeway will have significant continuing involvement with a number of the properties subsequent to the sale of PDC. Therefore, the operating results are not reported in discontinued operations in the consolidated statements of income. See Note D to the consolidated financial statements for additional information.
Blackhawk Network Holdings, Inc. (“Blackhawk”) was a majority-owned subsidiary of Safeway until Safeway completed the distribution of 37.8 million shares of Blackhawk stock that it owned to its stockholders on April 14, 2014. The operating results of Blackhawk are reported as discontinued operations in the consolidated statements of income for all periods presented. See Note B to the consolidated financial statements for additional information.
During the fourth quarter of 2013, the Company exited the Chicago market, where it operated 72 Dominick’s stores. The operating results of Dominick’s are reported as discontinued operations in the consolidated statements of income for all periods presented. In addition, certain assets and liabilities associated with Dominick’s are reported as assets and liabilities held for sale at December 28, 2013 and some Dominick’s properties continued to be classified as held for sale at January 3, 2015. See Note B to the consolidated financial statements for additional information.
On November 3, 2013, Safeway completed the sale of substantially all of the net assets of Canada Safeway Limited (“CSL” now known as CSL IT Services ULC) to Sobeys Inc. (“Sobeys”), a wholly-owned subsidiary of Empire Company Limited. As a result, the operating results of CSL are reported as discontinued operations in the consolidated statements of income for all periods presented. See Note B to the consolidated financial statements for additional information.
Unless otherwise indicated, the notes accompanying the consolidated financial statements reflect the Company’s continuing operations.
| F-102 | (Continued) |
Table of Contents
SAFEWAY INC. AND SUBSIDIARIES
Notes to Consolidated Financial Statements
The Company also has a 49% ownership interest in Casa Ley, S.A. de C.V. (“Casa Ley”), which operates 206 food and general merchandise stores in Western Mexico. See Note V.
Basis of Presentation The consolidated financial statements include Safeway Inc., a Delaware corporation, and all majority-owned subsidiaries and have been prepared in accordance with accounting principles generally accepted in the United States of America. Intercompany transactions and balances have been eliminated in consolidation. The Company’s investment in Casa Ley is reported using the equity method. Safeway’s equity in earnings of Casa Ley is based on financial information prepared in accordance with accounting principles generally accepted in the United States and is recorded on a one-month delay basis because financial information for the latest month is not available from Casa Ley in time to be included in Safeway’s consolidated results until the following reporting period.
Fiscal Year The Company’s fiscal year ends on the Saturday nearest December 31. The last three fiscal years consist of the 53-week period ended January 3, 2015 (“fiscal 2014” or “2014”), the 52-week period ended December 28, 2013 (“fiscal 2013” or “2013”) and the 52-week period ended December 29, 2012 (“fiscal 2012” or “2012”).
Correction to Cash Flow Classification Subsequent to the issuance of the fiscal 2013 consolidated financial statements, the Company determined that the $57.4 million loss on foreign currency translation within the 2013 consolidated statement of cash flows was reflected as a reduction in net cash flow from operating activities, and should not have reduced operating cash flow for U.S. GAAP purposes. As a result, the 2013 presentation has been corrected to increase cash flows from operating activities—continuing operations by $57.4 million with an offset to the line item Effect of changes in exchange rates on cash. Safeway assessed the materiality of this adjustment on previously issued financial statements in accordance with the SEC’s Staff Accounting Bulletin (“SAB”) No. 99 and concluded that the correction was not material. This correction results in no other changes to the consolidated financial statements and had no effect on the change in cash or ending cash.
Use of Estimates The preparation of financial statements in conformity with accounting principles generally accepted in the United States of America requires management to make estimates and assumptions that affect the reported amounts of assets and liabilities, disclosure of contingent assets and liabilities at the date of the financial statements and the reported amounts of revenues and expenses during the reporting period. Actual results could differ from those estimates.
Translation of Foreign Currencies Assets and liabilities of the Company’s foreign subsidiaries and Casa Ley are translated into U.S. dollars at year-end rates of exchange, and income and expenses are translated at average rates during the year. Adjustments resulting from translating financial statements into U.S. dollars, net of applicable income taxes, are included as a separate component in the statement of comprehensive income, within accumulated other comprehensive income in the consolidated balance sheets and within the consolidated statements of stockholders’ equity.
After the net asset sale of Canadian operations (“Sale of Canadian Operations”), the adjustments resulting from translation of retained assets and liabilities denominated in Canadian dollars are included in the statement of income as a foreign currency gain or loss. Foreign currency loss was $131.2 million in fiscal 2014 and $57.4 million in fiscal 2013. The Company made a reclassification on the 2013 consolidated statement of cash flows to correct the classification of the loss on foreign currency.
| F-103 | (Continued) |
Table of Contents
SAFEWAY INC. AND SUBSIDIARIES
Notes to Consolidated Financial Statements
Revenue Recognition Retail store sales are recognized at the point of sale. Sales tax is excluded from revenue. Internet sales are recognized when the merchandise is delivered to the customer. Discounts provided to customers in connection with loyalty cards are accounted for as a reduction of sales.
Safeway records a deferred revenue liability when it sells Safeway gift cards. Safeway records a sale when a customer redeems the gift card. Safeway gift cards do not expire. The Company reduces the liability and increases other revenue for the unused portion of gift cards (“breakage”) after two years, the period at which redemption is considered remote. Breakage amounts were $1.8 million, $1.9 million and $1.8 million in 2014, 2013 and 2012, respectively.
Cost of Goods Sold Cost of goods sold includes cost of inventory sold during the period, including purchase and distribution costs. These costs include inbound freight charges, purchasing and receiving costs, warehouse inspection costs, warehousing costs and other costs of Safeway’s distribution network. All vendor allowances are recorded as a reduction of cost of goods when earned. Advertising and promotional expenses are also included as a component of cost of goods sold. Such costs are expensed in the period the advertisement occurs. Advertising and promotional expenses totaled $325.5 million in 2014, $371.6 million in 2013 and $415.9 million in 2012.
Cash and Equivalents Cash and equivalents include short-term investments with original maturities of less than three months and credit and debit card sales transactions which settle within a few business days of year end.
There were no book overdrafts included in accounts payable at year-end 2014. At year-end 2013, book overdrafts of $84.5 million were included in accounts payable.
Receivables Receivables include pharmacy and miscellaneous trade receivables.
Merchandise Inventories Merchandise inventory of $1,755.3 million at year-end 2014 and $1,643.2 million at year-end 2013 is valued at the lower of cost on a last-in, first-out (“LIFO”) basis or market value. Such LIFO inventory had a replacement or current cost of $1,808.4 million at year-end 2014 and $1,701.3 million at year-end 2013. Liquidations of LIFO layers during the three years reported did not have a material effect on the results of operations. The remaining inventory consists primarily of perishables, pharmacy and fuel inventory. Perishables are counted every four weeks and are carried at the last purchased cost or the last four-week average cost, which approximates first-in, first-out (“FIFO”) cost. Pharmacy and fuel inventories are carried at the last purchased cost, which approximates FIFO cost. The Company records an inventory shrink adjustment upon physical counts and also provides for estimated inventory shrink adjustments for the period between the last physical inventory and each balance sheet date.
Property and Depreciation Property is stated at cost. Depreciation expense on buildings and equipment is computed on the straight-line method using the following lives:
| Stores and other buildings |
7 to 40 years | |||
| Fixtures and equipment |
3 to 15 years |
Safeway capitalizes eligible costs to acquire or develop internal-use software that are incurred during the application development stage as part of fixtures and equipment. Capitalized costs related to internal-use software are amortized using the straight-line method over the estimated useful lives of the assets.
| F-104 | (Continued) |
Table of Contents
SAFEWAY INC. AND SUBSIDIARIES
Notes to Consolidated Financial Statements
Property under capital leases and leasehold improvements is amortized on a straight-line basis over the shorter of the remaining terms of the leases or the estimated useful lives of the assets.
Company-Owned Life Insurance Policies Safeway has company-owned life insurance policies that have a cash surrender value. During 2013, Safeway borrowed against these policies. The Company has no current intention of repaying the loans prior to maturity or cancellation of the policies. Therefore, we offset the cash surrender value by the related loans. At January 3, 2015, the cash surrender value of the policies was $57.1 million, and the balance of the policy loans was $40.7 million, resulting in a net cash surrender value of $16.4 million. At December 28, 2013, the cash surrender value of the policies was $58.5 million, and the balance of the policy loans was $40.9 million, resulting in a net cash surrender value of $17.6 million.
Employee Benefit Plans The Company recognizes in its consolidated balance sheet an asset for its employee benefit plan’s overfunded status or a liability for underfunded status. The Company measures plan assets and obligations that determine the funded status as of fiscal year end. See Note N.
Self-Insurance The Company is primarily self-insured for workers’ compensation, automobile and general liability costs. The self-insurance liability is determined actuarially, based on claims filed and an estimate of claims incurred but not yet reported, and is discounted using a risk-free rate of interest. The present value of such claims was calculated using a discount rate of 1.50% in 2014, 1.75% in 2013 and 0.75% in 2012.
A summary of changes in Safeway’s self-insurance liability is as follows (in millions):
| 2014 | 2013 | 2012 | ||||||||||
| Beginning balance |
$ | 432.7 | $ | 480.1 | $ | 470.9 | ||||||
| Expense, including the effect of discount rate |
153.9 | 98.6 | 151.6 | |||||||||
| Claim payments |
(151.2 | ) | (137.2 | ) | (142.5 | ) | ||||||
| Disposal of discontinued operations |
— | (8.8 | ) | — | ||||||||
| Currency translation |
— | — | 0.1 | |||||||||
| Reclass insurance recoveries to receivable |
25.2 | — | — | |||||||||
|
|
|
|
|
|
|
|||||||
| Ending balance |
460.6 | 432.7 | 480.1 | |||||||||
|
|
|
|
|
|
|
|||||||
| Less current portion |
(113.3 | ) | (108.6 | ) | (137.4 | ) | ||||||
|
|
|
|
|
|
|
|||||||
| Long-term portion |
$ | 347.3 | $ | 324.1 | $ | 342.7 | ||||||
|
|
|
|
|
|
|
|||||||
Beginning in 2014, the Company has recorded estimated insurance recoveries as a receivable, rather than netting the recoveries against the liability.
The current portion of the self-insurance liability is included in other accrued liabilities, and the long-term portion is included in accrued claims and other liabilities in the consolidated balance sheets. The total undiscounted liability, net of insurance receivables, was $477.4 million at year-end 2014 and $477.2 million at year-end 2013.
Deferred Rent
Rent Escalations. The Company recognizes escalating rent provisions on a straight-line basis over the lease term.
| F-105 | (Continued) |
Table of Contents
SAFEWAY INC. AND SUBSIDIARIES
Notes to Consolidated Financial Statements
Rent Holidays. Certain of the Company’s operating leases contain rent holidays. For these leases, Safeway recognizes the related rent expense on a straight-line basis starting at the earlier of the first rent payment or the date of possession of the leased property. The difference between the amounts charged to expense and the rent paid is recorded as deferred lease incentives and amortized over the lease term.
Income Taxes Income tax expense or benefit reflects the amount of taxes payable or refundable for the current year, the impact of deferred tax liabilities and deferred tax assets, accrued interest on tax deficiencies and refunds and accrued penalties on tax deficiencies. Deferred income taxes represent future net tax effects resulting from temporary differences between the financial statement and tax basis of assets and liabilities using enacted tax rates in effect for the year in which the differences are expected to reverse.
A valuation allowance is established for deferred tax assets if it is more likely than not that these items will either expire before the Company is able to realize their benefits, or that future deductibility is uncertain. Periodically, the valuation allowance is reviewed and adjusted based on management’s assessments of realizable deferred tax assets.
Tax positions are recognized when they are more likely than not to be sustained upon examination. The amount recognized is measured as the largest amount of benefit that is more likely than not of being realized upon settlement. The Company is subject to periodic audits by the Internal Revenue Service and other foreign, state and local taxing authorities. These audits may challenge certain of the Company’s tax positions such as the timing and amount of income and deductions and the allocation of taxable income to various tax jurisdictions. The Company evaluates its tax positions and establishes liabilities in accordance with the applicable accounting guidance on uncertainty in income taxes. These tax uncertainties are reviewed as facts and circumstances change and are adjusted accordingly. This requires significant management judgment in estimating final outcomes. Actual results could materially differ from these estimates and could significantly affect the Company’s effective tax rate and cash flows in future years.
Financial Instruments
Interest rate swaps. The Company has, from time to time, entered into interest rate swap agreements to change its portfolio mix of fixed- and floating-rate debt to more desirable levels. Interest rate swap agreements involve the exchange with a counterparty of fixed- and floating-rate interest payments periodically over the life of the agreements without exchange of the underlying notional principal amounts. The differential to be paid or received is recognized over the life of the agreements as an adjustment to interest expense. The Company’s counterparties have been major financial institutions.
Energy contracts. The Company has entered into contracts to purchase electricity and natural gas at fixed prices for a portion of its energy needs. Safeway expects to take delivery of the electricity and natural gas in the normal course of business. Contracts that qualify for the normal purchase exception under derivatives and hedging accounting guidance are not marked to market. Energy purchased under these contracts is expensed as delivered.
Fair Value of Financial Instruments Disclosures of the fair value of certain financial instruments are required, whether or not recognized in the balance sheet. The Company estimated the fair values
| F-106 | (Continued) |
Table of Contents
SAFEWAY INC. AND SUBSIDIARIES
Notes to Consolidated Financial Statements
presented below using appropriate valuation methodologies and market information available as of year end. Considerable judgment is required to develop estimates of fair value, and the estimates presented are not necessarily indicative of the amounts that the Company could realize in a current market exchange. The use of different market assumptions or estimation methodologies could have a material effect on the estimated fair values. Additionally, the fair values were estimated at year end, and current estimates of fair value may differ significantly from the amounts presented.
The following methods and assumptions were used to estimate the fair value of each class of financial instruments:
Cash and equivalents, accounts receivable, accounts payable. The carrying amount of these items approximates fair value.
Short-term investments. These investments are readily convertible to cash, and the carrying amount of these items approximates fair value.
Notes receivables. The Company’s notes receivables, included in other assets, are comprised primarily of notes receivable resulting from the sale of real estate. The fair value of note receivables is estimated by discounting expected future cash flows using interest rates, adjusted for credit risk, at which similar loans could be made under current market conditions. The carrying value of notes receivables, which approximates fair value, was $108.0 million at January 3, 2015 and $101.0 million at December 28, 2013. Approximately $27.7 million of the notes receivables at January 3, 2015 were Safeway advances to Blackhawk. These advances funded Blackhawk’s estimated tax payments on the distribution of Blackhawk shares which are explained in Note B under the caption “Blackhawk”. With the closing of the Merger on January 30, 2015, Blackhawk is not required to repay these advances.
Long-term debt, including current maturities. Market values quoted in public markets are used to estimate the fair value of publicly traded debt. To estimate the fair value of debt issues that are not quoted in public markets, the Company uses those interest rates that are currently available to it for issuance of debt with similar terms and remaining maturities as a discount rate for the remaining principal payments.
Store Lease Exit Costs and Impairment Charges Safeway regularly reviews its stores’ operating performance and assesses the Company’s plans for certain store and plant closures. Losses related to the impairment of long-lived assets are recognized when expected future cash flows are less than the asset’s carrying value. The Company evaluates the carrying value of the assets in relation to its expected future cash flows. If the carrying value is greater than the future cash flows, a provision is made for the impairment of the assets to write the assets down to estimated fair value. Fair value is determined by estimating net future cash flows, discounted using a risk-adjusted rate of return. The Company calculates impairment on a store-by-store basis. These provisions are recorded as a component of operating and administrative expense.
When stores that are under long-term leases close, the Company records a liability for the future minimum lease payments and related ancillary costs, net of estimated cost recoveries that may be achieved through subletting properties or through favorable lease terminations, discounted using a risk-adjusted rate of interest. This liability is recorded at the time the store is closed. Activity included in the reserve for store lease exit costs is disclosed in Note E.
| F-107 | (Continued) |
Table of Contents
SAFEWAY INC. AND SUBSIDIARIES
Notes to Consolidated Financial Statements
Accumulated Other Comprehensive Loss Accumulated other comprehensive loss, net of applicable taxes, consisted of the following at year-end (in millions):
| 2014 | 2013 | 2012 | ||||||||||
| Translation adjustments |
$ | (136.4 | ) | $ | (139.0 | ) | $ | 399.0 | ||||
| Pension and post-retirement benefits adjustment to funded status |
(588.0 | ) | (403.0 | ) | (737.8 | ) | ||||||
| Recognition of pension and post-retirement benefits actuarial loss |
304.1 | 272.5 | 265.5 | |||||||||
| Other |
(1.4 | ) | (1.6 | ) | (0.5 | ) | ||||||
|
|
|
|
|
|
|
|||||||
| Total |
$ | (421.7 | ) | $ | (271.1 | ) | $ | (73.8 | ) | |||
|
|
|
|
|
|
|
|||||||
At the closing of the Sale of Canadian Operations, the Company recorded the related balance of cumulative translation adjustment, pension and post-retirement benefit adjustment to funded status and recognition of pension and post-retirement benefits actuarial loss which related to CSL as part of the gain on the sale. See Note B.
Stock-Based Employee Compensation Safeway accounts for all share-based payments to employees, including grants of employee stock options, as compensation cost based on the fair value on the date of grant. The Company determines fair value of such awards using the Black-Scholes option pricing model. The Black-Scholes option pricing model incorporates certain assumptions, such as risk-free interest rate, expected volatility, expected dividend yield and expected life of options, in order to arrive at a fair value estimate.
New Accounting Pronouncements
In May 2014, the Financial Accounting Standards Board (“FASB”) issued Accounting Standards Update (“ASU”) No. 2014-09, “Revenue from Contracts with Customers,” which provides guidance for revenue recognition. The standard’s core principle is that a company will recognize revenue when it transfers promised goods or services to customers in an amount that reflects the consideration to which the company expects to be entitled in exchange for those goods or services. The new guidance is effective for annual reporting periods beginning after December 15, 2016, including interim periods within that reporting period. Early application is not permitted. The Company is currently assessing the potential impact of ASU No. 2014-09 on its financial statements.
On April 10, 2014, the FASB issued ASU No. 2014-08 “Reporting Discontinued Operations and Disclosures of Disposals of Components of an Entity.” ASU No. 2014-08 changes the criteria for reporting discontinued operations and modifies related disclosure requirements. The new guidance is effective on a prospective basis for fiscal years beginning after December 15, 2014, and interim periods within annual periods beginning on or after December 15, 2015. The Company is currently assessing the future impact of ASU No. 2014-08 on its financial statements.
Note B: Assets and Liabilities Held for Sale and Discontinued Operations
Assets and Liabilities Held for Sale In the fourth quarter of 2013, the Company announced its intention to exit the Chicago market, where it operated 72 Dominick’s stores. During the fourth quarter of 2013, the Company sold or closed its Dominick’s stores. Certain Dominick’s properties were classified as held for sale at December 28, 2013, and some Dominick’s properties continued to be classified as held
| F-108 | (Continued) |
Table of Contents
SAFEWAY INC. AND SUBSIDIARIES
Notes to Consolidated Financial Statements
for sale at January 3, 2015. Additionally, the Company had other real estate assets held for sale. Assets and liabilities held for sale at January 3, 2015 and December 28, 2013 were as follows (in millions):
| January 3, 2015 |
December 28, 2013 |
|||||||
| Assets held for sale: |
||||||||
| Dominick’s property, net, held for sale |
$ | 5.6 | $ | 136.7 | ||||
| Other United States real estate assets held for sale |
33.9 | 7.2 | ||||||
|
|
|
|
|
|||||
| Total assets held for sale |
$ | 39.5 | $ | 143.9 | ||||
|
|
|
|
|
|||||
| January 3, 2015 |
December 28, 2013 |
|||||||
| Liabilities held for sale: |
||||||||
| Dominick’s |
||||||||
| Deferred gain on property dispositions |
$ | — | $ | 9.0 | ||||
| Obligations under capital leases |
— | 5.2 | ||||||
| Deferred rent |
— | 2.6 | ||||||
| Other liabilities |
— | 1.4 | ||||||
|
|
|
|
|
|||||
| Total liabilities held for sale(1) |
$ | — | $ | 18.2 | ||||
|
|
|
|
|
|||||
| (1) | Included in Other Accrued Liabilities on the consolidated balance sheet. |
| F-109 | (Continued) |
Table of Contents
SAFEWAY INC. AND SUBSIDIARIES
Notes to Consolidated Financial Statements
Discontinued Operations The notes to the consolidated financial statements exclude discontinued operations, unless otherwise noted. Historical financial information for CSL, Dominick’s and Blackhawk presented in the consolidated income statements has been reclassified to discontinued operations to conform to current-year presentation. The historical operating results of Genuardi’s stores have not been reflected in discontinued operations because the historical financial operating results were not material to the Company’s consolidated financial statements for all periods presented. Financial information for discontinued operations is shown below (in millions):
| 2014 | 2013 | 2012 | ||||||||||
| Sales and other revenue: |
||||||||||||
| CSL(1) |
$ | — | $ | 5,447.9 | $ | 6,695.8 | ||||||
| Dominick’s |
7.3 | 1,394.8 | 1,465.2 | |||||||||
| Blackhawk(1) |
305.6 | 1,074.2 | 906.8 | |||||||||
|
|
|
|
|
|
|
|||||||
| Total |
$ | 312.9 | $ | 7,916.9 | $ | 9,067.8 | ||||||
|
|
|
|
|
|
|
|||||||
| (Loss) income from discontinued operations, before income taxes: |
||||||||||||
| CSL(1) |
$ | — | $ | 286.2 | $ | 442.3 | ||||||
| Dominick’s(2) |
(186.8 | ) | (92.0 | ) | (50.4 | ) | ||||||
| Blackhawk(1) |
(4.4 | ) | 84.4 | 74.2 | ||||||||
|
|
|
|
|
|
|
|||||||
| Total |
$ | (191.2 | ) | $ | 278.6 | $ | 466.1 | |||||
|
|
|
|
|
|
|
|||||||
| Gain (loss) on sale or disposal of operations, net of lease exit costs and transaction costs, before income taxes: |
||||||||||||
| CSL(3) |
$ | (6.8 | ) | $ | 4,783.1 | $ | — | |||||
| Dominick’s(4) |
140.9 | (493.1 | ) | — | ||||||||
| Blackhawk |
(5.9 | ) | — | — | ||||||||
| Genuardi’s |
— | — | 52.4 | |||||||||
|
|
|
|
|
|
|
|||||||
| Total |
$ | 128.2 | $ | 4,290.0 | $ | 52.4 | ||||||
|
|
|
|
|
|
|
|||||||
| Total (loss) income from discontinued operations, before income taxes |
$ | (63.0 | ) | $ | 4,568.6 | $ | 518.5 | |||||
| Income taxes on discontinued operations |
72.3 | (1,263.5 | ) | (169.6 | ) | |||||||
|
|
|
|
|
|
|
|||||||
| Income from discontinued operations, net of tax |
$ | 9.3 | $ | 3,305.1 | $ | 348.9 | ||||||
|
|
|
|
|
|
|
|||||||
| (1) | For CSL, 2013 reflects 44 weeks of activity compared to 52 weeks in 2012. For Blackhawk, 2014 reflects 15 weeks of activity compared to 52 weeks in the prior years. |
| (2) | 2014 includes charges of $159.4 million to increase the multiemployer pension withdrawal liability. |
| (3) | In accordance with ASU No. 2013-05, “Parent’s Accounting for the Cumulative Translation Adjustment upon Derecognition of Certain Subsidiaries or Groups of Assets within a Foreign Entity or of an Investment in a Foreign Entity,” the Company transferred the cumulative translation adjustment relating to Canadian operations from Accumulated Other Comprehensive Loss on the balance sheet to gain on the Sale of Canadian Operations. |
| (4) | 2013 includes a charge of $310.8 million for the estimated multiemployer pension plan withdrawal liability. |
Sale of Canadian Operations On November 3, 2013, Safeway completed the Sale of Canadian Operations to Sobeys for CAD5.8 billion (USD5.6 billion) in cash plus the assumption of certain liabilities.
| F-110 | (Continued) |
Table of Contents
SAFEWAY INC. AND SUBSIDIARIES
Notes to Consolidated Financial Statements
Dominick’s During the fourth quarter of 2013, Safeway sold or closed all Dominick’s stores. Cash proceeds on the sale of these stores sold in fiscal 2013 were $72.2 million. Stores closed in 2013 but sold in fiscal 2014 had cash proceeds of $246.3 million. The sale of these stores resulted in a pre-tax gain of $140.9 million in fiscal 2014 and a pre-tax loss of $493.1 million in fiscal 2013, which includes a charge of $310.8 million for the estimated multiemployer pension plan withdrawal liability. During fiscal 2014, the Company increased the estimated multiemployer pension plan withdrawal liability by $159.4 million, which is included in loss from discontinued operations in the following table. See Note O for a discussion and reconciliation of this withdrawal liability.
Blackhawk On March 24, 2014, Safeway’s Board of Directors declared a special stock dividend to its stockholders of all of the 37.8 million shares of Class B common stock of Blackhawk owned by Safeway, representing approximately 94.2% of the total outstanding shares of Blackhawk’s Class B common stock and approximately 72% of the total number of shares of Blackhawk common stock of all classes outstanding. On April 14, 2014, Safeway distributed the special stock dividend to all Safeway stockholders of record as of April 3, 2014 (the “Record Date”). The distribution took place in the form of a pro rata dividend of Blackhawk Class B common stock to each Safeway stockholder of record as of the Record Date.
With the completion of the Merger subsequent to year-end, Safeway’s distribution of Blackhawk shares is taxable. Based on Safeway’s preliminary estimates and after the application of $82 million in tax payments previously made in connection with Safeway’s sale of shares in the initial public offering of Blackhawk’s Class A common stock in April 2013, Safeway expects that the distribution of Blackhawk shares will result in an incremental tax liability of approximately $360 million, which Safeway is required to fund. In accordance with generally accepted accounting principles, Safeway did not consider the probability of the Merger occurring and, therefore, has not recorded a liability for its obligation to fund Blackhawk’s tax obligation. During 2014, Safeway paid approximately $355 million of the incremental tax liability.
In addition, during 2014, Blackhawk made certain estimated tax payments to certain state tax jurisdictions. Safeway advanced approximately $27.7 million to Blackhawk to fund these estimated tax payments. Safeway recorded these advances as receivables on the condensed consolidated balance sheet because, in accordance with generally accepted accounting principles, Safeway did not consider the probability of the Merger occurring. In the event the Merger did not occur, Blackhawk would have been required to repay these advances to Safeway.
Genuardi’s In January 2012, Safeway announced the planned sale or closure of its Genuardi’s stores, located in the Eastern United States. These transactions were completed during 2012 with cash proceeds of $107.0 million and a pre-tax gain of $52.4 million ($31.9 million after tax).
Note C: Blackhawk
Initial Public Offering of Blackhawk On April 24, 2013, Blackhawk, a former Safeway subsidiary, completed its initial public offering of 11.5 million shares of its Class A common stock at $23.00 per share on the NASDAQ Global Select Market, which included the exercise by the underwriters for the offering of an option to purchase 1.5 million shares of Class A common stock. The offering consisted solely of shares offered by existing stockholders, including Safeway. As part of the IPO, Safeway sold 11.3 million shares of Class A common stock of Blackhawk for proceeds of $243.6 million ($238.0 million, net of professional service fees), reducing the Company’s ownership from approximately 95% to approximately 73% of Blackhawk’s total outstanding shares of common
| F-111 | (Continued) |
Table of Contents
SAFEWAY INC. AND SUBSIDIARIES
Notes to Consolidated Financial Statements
stock. Safeway recorded these net proceeds as an increase to Additional Paid-In Capital and used these net proceeds to reduce debt. Additionally, the Company recorded a $76.5 million tax liability on the sale of these shares as a reduction to Additional Paid-In Capital and $5.8 million as an increase to tax expense. The taxes were paid in the fourth quarter of 2013. Additionally, Safeway incurred a $17.9 million deferred tax expense related to the retained shares in Blackhawk.
Distribution of Blackhawk Safeway owned 37.8 million shares, or approximately 72%, of Blackhawk, which the Company distributed to its stockholders on April 14, 2014. See Note B.
Acquisitions On November 29, 2013, Blackhawk acquired 100% of the outstanding common stock of Retailo, a German privately-held company which is a third-party gift card distribution network in Germany, Austria and Switzerland. Blackhawk acquired Retailo for total purchase consideration of $70.2 million. The following table summarizes the purchase price allocation which was based upon the estimated fair value of each asset and liability (in millions):
| Settlement receivables |
$ | 18.1 | ||
| Settlement payables |
(14.8 | ) | ||
| Other liabilities, net |
(0.7 | ) | ||
| Deferred income taxes, net |
(7.4 | ) | ||
| Identifiable technology and intangible assets |
45.7 | |||
| Noncontrolling interests |
(6.9 | ) | ||
| Goodwill(1) |
36.2 | |||
|
|
|
|||
| Total consideration |
$ | 70.2 | ||
|
|
|
| (1) | See Note D. |
Noncontrolling interests result from third-party ownership interests in certain subsidiaries of Retailo.
On November 12, 2013, Blackhawk acquired substantially all of the net assets of InteliSpend from Maritz Holdings Inc., a privately-held company, for total purchase consideration of $97.5 million. InteliSpend delivers intelligent prepaid solutions for business needs: employee rewards, wellness, sales incentives, expense management and promotional programs. The following table summarizes the purchase price allocation which was based upon the estimated fair value of each asset and liability (in millions):
| Cash and cash equivalents |
$ | 15.0 | ||
| Trading securities |
29.4 | |||
| Accounts receivable |
7.9 | |||
| Cardholder liabilities |
(31.4 | ) | ||
| Customer deposits |
(12.5 | ) | ||
| Other tangible assets, net |
(4.0 | ) | ||
| Deferred taxes |
(0.3 | ) | ||
| Identifiable technology and intangible assets |
39.2 | |||
| Goodwill(1) |
54.2 | |||
|
|
|
|||
| Total consideration |
$ | 97.5 | ||
|
|
|
| (1) | See Note D. |
| F-112 | (Continued) |
Table of Contents
SAFEWAY INC. AND SUBSIDIARIES
Notes to Consolidated Financial Statements
Blackhawk sold the trading securities for cash on the day after closing, and this sale is presented as an inflow from investing activities in the accompanying consolidated statements of cash flows.
Note D: Property Development Centers
On December 23, 2014, Safeway and its wholly owned real estate development subsidiary, PDC, sold substantially all of the net assets of PDC to Terramar. PDC’s assets were comprised of shopping centers that are completed or under development. Most of these centers included a grocery store that was leased back to Safeway. The sale was consummated pursuant to an Asset Purchase Agreement dated as of December 22, 2014 by and among Safeway, PDC and Terramar.
The following table summarizes the gain on this transaction (in millions).
| Total cash proceeds |
$ | 759.0 | ||
| Less proceeds for development properties recorded as Other Notes Payable |
(120.1 | ) | ||
| Less cash paid for prorates |
(1.7 | ) | ||
|
|
|
|||
| Total cash proceeds classified as investing activities |
637.2 | |||
| Net book value |
(464.9 | ) | ||
|
|
|
|||
| Total gain on sale of PDC |
172.3 | |||
| Less gain deferred on sale leasebacks(1) |
(150.3 | ) | ||
|
|
|
|||
| Gain on sale of PDC |
$ | 22.0 | ||
|
|
|
| (1) | Current portion of $25.3 million is included in other accrued liabilities, and the long-term portion of $125.0 million is included in accrued claims and other liabilities in the consolidated balance sheet at year-end 2014. |
Due to leasing back certain of these properties, Safeway has significant continuing involvement with a number of the properties subsequent to the sale. As a result, Safeway deferred the gain on the sale of those properties. Under GAAP, Safeway is still considered the owner of certain properties consisting primarily of the properties under development. Consequently, proceeds of $120.1 million received for those properties have been recorded as Other Notes Payable and classified as a cash inflow from financing activities.
Safeway undertook the sale of PDC in connection with the Merger. See Note V.
Note E: Goodwill
Goodwill represents the excess of cost of an acquired business over the fair value of the identifiable tangible and intangible assets acquired and liabilities assumed in a business combination. Goodwill is not subject to amortization but must be evaluated for impairment.
Safeway tests goodwill for impairment annually (on the first day of the fourth quarter) or whenever events or circumstances indicate that it is more likely than not that the fair value of a reporting unit is below its carrying value.
The impairment test is a two-step process. In the first step, the Company determines if the fair value of the reporting units is less than the book value. Under generally accepted accounting
| F-113 | (Continued) |
Table of Contents
SAFEWAY INC. AND SUBSIDIARIES
Notes to Consolidated Financial Statements
principles, a reporting unit is either the equivalent to, or one level below, an operating segment. Each reporting unit constitutes a business for which discrete financial information is available and for which management regularly reviews the operating results. Safeway’s operating segments are our retail divisions. Safeway’s reporting units are generally consistent with its operating segments.
Companies are allowed perform the first step of the two-step impairment process by assessing qualitative factors to determine whether events or circumstances exist which lead to a determination that it is more likely than not that the fair value of a reporting unit is less than its carrying amount. After assessing the totality of events and circumstances, we conclude that it is more likely than not that the fair value of our reporting units with goodwill is greater than the book value and, therefore, that there is no goodwill impairment.
If Safeway concludes that fair value is greater than the book value, Safeway does not have to proceed to step two, and Safeway can conclude there is no goodwill impairment. If the Company concludes that the fair value of a reporting unit is less than book value, the Company must perform step two, in which it calculates the implied fair value of goodwill and compares it to carrying value. If the carrying value of goodwill exceeds the implied fair value of goodwill, such excess represents the amount of goodwill impairment.
Determining the fair value of a reporting unit involves the use of significant estimates and assumptions. The estimated fair value of each reporting unit is based on an average of the guideline company method and the discounted cash flow method. These methods are based on historical and forecasted amounts specific to each reporting unit and consider sales, gross profit, operating profit and cash flows and general economic and market conditions, as well as the impact of planned business and operational strategies. Safeway bases its fair value estimates on assumptions it believes to be reasonable at the time, but such assumptions are subject to inherent uncertainty. Measuring the fair value of reporting units would constitute a Level 3 measurement under the fair value hierarchy. See Note I for a discussion of levels.
Based upon the results of our 2014, 2013 and 2012 analyses, no impairment of goodwill was indicated in 2014, 2013 or 2012.
| F-114 | (Continued) |
Table of Contents
SAFEWAY INC. AND SUBSIDIARIES
Notes to Consolidated Financial Statements
A summary of changes in Safeway’s goodwill is as follows (in millions):
| 2014 | 2013 | |||||||||||||||
| U.S. | U.S. | Canada | Total | |||||||||||||
| Balance—beginning of year: |
||||||||||||||||
| Goodwill |
$ | 4,455.8 | $ | 4,364.9 | $ | 97.9 | $ | 4,462.8 | ||||||||
| Accumulated impairment charges |
(3,991.3 | ) | (3,991.3 | ) | — | (3,991.3 | ) | |||||||||
|
|
|
|
|
|
|
|
|
|||||||||
| 464.5 | 373.6 | 97.9 | 471.5 | |||||||||||||
|
|
|
|
|
|
|
|
|
|||||||||
| Activity during the year: |
||||||||||||||||
| Distribution of Blackhawk Stock(2) |
(133.6 | ) | — | — | — | |||||||||||
| Disposal of CSL goodwill(1) |
— | — | (97.9 | ) | (97.9 | ) | ||||||||||
| Blackhawk acquisition of Retailo(2) |
— | 36.2 | — | 36.2 | ||||||||||||
| Blackhawk acquisition of InteliSpend(2) |
— | 54.2 | — | 54.2 | ||||||||||||
| Translation adjustments |
— | 0.5 | — | 0.5 | ||||||||||||
|
|
|
|
|
|
|
|
|
|||||||||
| (133.6 | ) | 90.9 | (97.9 | ) | (7.0 | ) | ||||||||||
|
|
|
|
|
|
|
|
|
|||||||||
| Balance—end of year: |
||||||||||||||||
| Goodwill |
4,322.2 | 4,455.8 | — | 4,455.8 | ||||||||||||
| Accumulated impairment charges |
(3,991.3 | ) | (3,991.3 | ) | — | (3,991.3 | ) | |||||||||
|
|
|
|
|
|
|
|
|
|||||||||
| $ | 330.9 | $ | 464.5 | $ | — | $ | 464.5 | |||||||||
|
|
|
|
|
|
|
|
|
|||||||||
| (1) | See Note B. |
| (2) | See Note C. |
Note F: Store Lease Exit Costs and Impairment Charges
Impairment Write-Downs Safeway recognized impairment charges on the write-down of long-lived assets of $56.1 million in 2014, $35.6 million in 2013 and $33.6 million in 2012. These charges are included as a component of operating and administrative expense.
Store Lease Exit Costs The reserve for store lease exit costs includes the following activity for 2014, 2013 and 2012 (in millions):
| 2014 | 2013 | 2012 | ||||||||||
| Beginning balance |
$ | 181.0 | $ | 76.5 | $ | 77.0 | ||||||
| Provision for estimated net future cash flows of additional closed stores(1) |
1.2 | 6.1 | 19.4 | |||||||||
| Provision for estimated net future cash flows of Dominick’s closed stores(2) |
— | 113.6 | — | |||||||||
| Net cash flows, interest accretion, changes in estimates of net future cash flows(3) |
(37.1 | ) | (15.2 | ) | (19.9 | ) | ||||||
| Net cash flows, interest accretion, changes in estimates of net future cash flows for Dominick’s disposed stores(4) |
(15.9 | ) | — | — | ||||||||
|
|
|
|
|
|
|
|||||||
| Ending balance |
$ | 129.2 | $ | 181.0 | $ | 76.5 | ||||||
|
|
|
|
|
|
|
|||||||
| (1) | Estimated net future cash flows represents future minimum lease payments and related ancillary costs from the date of closure to the end of the remaining lease term, net of estimated cost recoveries that may be achieved through subletting properties or through favorable lease terminations. |
| F-115 | (Continued) |
Table of Contents
SAFEWAY INC. AND SUBSIDIARIES
Notes to Consolidated Financial Statements
| (2) | Estimated net future cash flows for Dominick’s stores closed during the fourth quarter of 2013. |
| (3) | Net cash flows, interest accretion, changes in estimates of net future cash flows for all stores other than Dominick’s stores disposed of in 2014. |
| (4) | Net cash flows, interest accretion, changes in estimates of net future cash flows for Dominick’s stores disposed of in 2014. |
Store lease exit costs are included as a component of operating and administrative expense, with the exception of Dominick’s locations closed in the fourth quarter of 2013 which are included in the loss on disposal of operations. For all stores, the liability is included in accrued claims and other liabilities.
Note G: Financing
Notes and debentures were composed of the following at year end (in millions):
| 2014 | 2013 | |||||||
| Term credit agreement, unsecured |
$ | — | $ | 400.0 | ||||
| Mortgage notes payable, secured |
4.7 | 46.8 | ||||||
| 5.625% Senior Notes due 2014, unsecured |
— | 250.0 | ||||||
| 3.40% Senior Notes due 2016, unsecured |
80.0 | 400.0 | ||||||
| 6.35% Senior Notes due 2017, unsecured |
100.0 | 500.0 | ||||||
| 5.00% Senior Notes due 2019, unsecured |
500.0 | 500.0 | ||||||
| 3.95% Senior Notes due 2020, unsecured |
500.0 | 500.0 | ||||||
| 4.75% Senior Notes due 2021, unsecured |
400.0 | 400.0 | ||||||
| 7.45% Senior Debentures due 2027, unsecured |
150.0 | 150.0 | ||||||
| 7.25% Senior Debentures due 2031, unsecured |
600.0 | 600.0 | ||||||
| Other notes payable, unsecured |
141.4 | 21.4 | ||||||
|
|
|
|
|
|||||
| 2,476.1 | 3,768.2 | |||||||
| Less current maturities |
(3.2 | ) | (252.9 | ) | ||||
|
|
|
|
|
|||||
| Long-term portion |
$ | 2,472.9 | $ | 3,515.3 | ||||
|
|
|
|
|
|||||
Commercial Paper During 2014, the average commercial paper borrowing was $28.5 million and had a weighted-average interest rate of 0.63%. During 2013, the average commercial paper borrowing was $43.9 million which had a weighted-average interest rate of 0.68%.
Bank Credit Agreement At January 3, 2015, the Company had a $1,500.0 million credit agreement (the “Credit Agreement”) with a syndicate of banks that was scheduled to terminate on June 1, 2015. The Credit Agreement provided to Safeway (i) a four-year revolving domestic credit facility of up to $1,250.0 million for U.S. dollar advances and (ii) a $400.0 million subfacility of the domestic facility for issuance of standby and commercial letters of credit. The Credit Agreement also provided for an increase in the credit facility commitments up to an additional $500.0 million, subject to the satisfaction of certain conditions. On June 30, 2014, the Company terminated a $250.0 million Canadian credit facility. The Credit Agreement contained various covenants that restricted, among other things and subject to certain exceptions, the ability of Safeway and its subsidiaries to incur certain liens, make certain asset sales, enter into certain mergers or amalgamations, engage in certain transactions with stockholders and affiliates and alter the character of its business from that conducted on the closing date. The Credit Agreement also contained two financial maintenance covenants: (i) an interest coverage ratio that required Safeway not to permit the ratio of consolidated Adjusted EBITDA,
| F-116 | (Continued) |
Table of Contents
SAFEWAY INC. AND SUBSIDIARIES
Notes to Consolidated Financial Statements
as defined in the Credit Agreement, to consolidated interest expense to be less than 2.0:1.0, and (ii) a leverage ratio that required Safeway not to permit the ratio of consolidated total debt, less unrestricted cash in excess of $75.0 million, to consolidated Adjusted EBITDA, to exceed 3.5:1.0. As of January 3, 2015, the Company was in compliance with these covenant requirements. As of January 3, 2015, there were no borrowings, and letters of credit totaled $27.2 million under the Credit Agreement. Total unused borrowing capacity under the credit agreement was $1,472.8 million as of January 3, 2015.
U.S. borrowings under the credit agreement carried interest at one of the following rates selected by the Company: (1) the prime rate; (2) a rate based on rates at which Eurodollar deposits are offered to first-class banks by the lenders in the bank credit agreement plus a pricing margin based on the Company’s debt rating or interest coverage ratio (the “Pricing Margin”); or (3) rates quoted at the discretion of the lenders.
During 2014, the Company paid facility fees ranging from 0.15% to 0.225% on the total amount of the credit facility.
Issuances of Senior Unsecured Indebtedness The Company did not issue any senior unsecured debt in 2014 or 2013.
Redemption of Notes
Fiscal 2014 In August 2014, Safeway paid $802.7 million to redeem $320.0 million of the 3.40% Senior Notes due 2016 and $400.0 million of the 6.35% Senior Notes due 2017. The $802.7 million included principal payments of $720.0 million, make-whole premiums of $80.2 million and accrued interest of $2.5 million. Unamortized deferred finance fees of $2.2 million were also expensed.
In accordance with the Merger Agreement, the Company contributed $40.0 million in cash to PDC in the second quarter of 2014. This cash was to be held in a reserve account until the earlier to occur of (i) payment in full of the mortgage indebtedness encumbering a shopping center in Lahaina, Hawaii and (ii) the release of the Company from any guaranty obligations in connection with such indebtedness. During the third quarter of 2014, the Company deposited $40.0 million with a trustee and achieved a full legal defeasance of the mortgage indebtedness and was released from the guaranty obligations associated with such indebtedness. Therefore, during the third quarter of 2014, the Company extinguished the $40.8 million mortgage from the condensed consolidated balance sheet.
These transactions resulted in a loss on extinguishment of debt of $84.4 million in 2014, which consisted of $80.2 million in make-whole premiums on the Senior Notes, the write-off of $2.4 million of unamortized deferred finance fees and $1.8 million of third-party costs associated with the defeasance of the Lahaina mortgage.
Fiscal 2013 In the fourth quarter of 2013, the Company redeemed $500.0 million of 6.25% Senior Notes due March 15, 2014. This redemption resulted in a make-whole premium of $6.7 million, before tax.
In the fourth quarter of 2013, the Company deposited CAD304.5 million (USD292.2 million) in an account with the Trustee under the indenture governing the CAD300.0 million (USD287.9 million), 3.00% Second Series Notes due March 31, 2014. Safeway met the conditions for satisfaction and discharge of the Company’s obligations under the indenture and, as a result, extinguished the CAD300.0 million (USD287.9 million) notes and CAD304.5 million (USD292.2 million) cash from the consolidated balance sheet.
| F-117 | (Continued) |
Table of Contents
SAFEWAY INC. AND SUBSIDIARIES
Notes to Consolidated Financial Statements
These transactions resulted in a loss on extinguishment of debt of $10.1 million in 2013, which consisted of make-whole premiums of $6.7 million and prepaid interest of $3.4 million.
Mortgage Notes Payable Mortgage notes payable at year-end 2014 have remaining terms ranging from less than four years to approximately seven years, had a weighted-average interest rate during 2014 of 8.10% and are secured by properties with a net book value of approximately $30.1 million.
Other Notes Payable Other notes payable at year-end 2014 have remaining terms ranging from one year to 21 years and had a weighted average interest rate of 7.16% during 2014. At year-end 2014, Other Notes Payable includes $120.1 million of proceeds for PDC properties where Safeway is still considered the owner under GAAP. See Note D.
Annual Debt Maturities As of year-end 2014, annual debt maturities (principal payments only) were as follows (in millions). Many of the notes payable include make-whole provisions:
| 2015 |
$ | 3.2 | ||
| 2016 |
84.6 | |||
| 2017 |
105.0 | |||
| 2018 |
6.8 | |||
| 2019 |
505.1 | |||
| Thereafter |
1,771.4 | |||
|
|
|
|||
| $ | 2,476.1 | |||
|
|
|
Letters of Credit The Company had letters of credit of $27.8 million outstanding at year-end 2014, of which $27.2 million were issued under the credit agreement. The letters of credit are maintained primarily to support performance, payment, deposit or surety obligations of the Company. The Company pays commissions ranging from 1.00% to 1.28% on the face amount of the letters of credit.
Fair Value At year-end 2014 and year-end 2013, the estimated fair value of debt, including current maturities, was $2,525.3 million and $3,949.7 million, respectively.
See Note V under the caption “Effect of Merger on Debt” for additional information.
Note H: Financial Instruments
Safeway manages interest rate risk through the strategic use of fixed- and variable-interest rate debt and, from time to time, interest rate swaps. The Company does not utilize financial instruments for trading or other speculative purposes, nor does it utilize leveraged financial instruments. At year-end 2014, the Company had no interest rate swaps outstanding.
| F-118 | (Continued) |
Table of Contents
SAFEWAY INC. AND SUBSIDIARIES
Notes to Consolidated Financial Statements
Note I: Fair Value Measurements
The accounting guidance for fair value measurements prioritizes the inputs used in measuring fair value into the following hierarchy:
| Level 1 | Quoted prices (unadjusted) in active markets for identical assets or liabilities; | |
| Level 2 | Inputs other than quoted prices included within Level 1 that are either directly or indirectly observable; | |
| Level 3 | Unobservable inputs in which little or no market activity exists, therefore requiring an entity to develop its own assumptions about the assumptions that market participants would use in pricing. | |
The following table presents assets and liabilities which are measured at fair value on a recurring basis at January 3, 2015 (in millions):
| Fair Value Measurements | ||||||||||||||||
| Total | Quoted prices in active markets for identical assets (Level 1) |
Significant observable inputs (Level 2) |
Significant unobservable inputs (Level 3) |
|||||||||||||
| Assets: |
||||||||||||||||
| Cash equivalents: |
||||||||||||||||
| Money market |
$ | 1,884.0 | $ | 1,884.0 | $ | — | $ | — | ||||||||
| Commercial paper |
124.2 | — | 124.2 | — | ||||||||||||
| Short-term investments(1) |
24.4 | 16.8 | 7.6 | — | ||||||||||||
| Non-current investments(2) |
46.5 | — | 46.5 | — | ||||||||||||
|
|
|
|
|
|
|
|
|
|||||||||
| Total |
$ | 2,079.1 | $ | 1,900.8 | $ | 178.3 | $ | — | ||||||||
|
|
|
|
|
|
|
|
|
|||||||||
| Liabilities: |
||||||||||||||||
| Contingent consideration(3) |
$ | 2.6 | $ | — | $ | — | $ | 2.6 | ||||||||
|
|
|
|
|
|
|
|
|
|||||||||
| Total |
$ | 2.6 | $ | — | $ | — | $ | 2.6 | ||||||||
|
|
|
|
|
|
|
|
|
|||||||||
| (1) | Included in Prepaid Expenses and Other Current Assets on the balance sheet. |
| (2) | Included in Other Assets on the balance sheet. |
| (3) | Included in Other Accrued Liabilities and Accrued Claims and Other Liabilities on the balance sheet. |
A reconciliation of the beginning and ending balances for Level 3 liabilities for the year ended January 3, 2015 follows (in millions):
| Contingent consideration |
||||
| Balance, beginning of year |
$ | 2.9 | ||
| Settlements |
(0.3 | ) | ||
|
|
|
|||
| Balance, end of year |
$ | 2.6 | ||
|
|
|
|||
| F-119 | (Continued) |
Table of Contents
SAFEWAY INC. AND SUBSIDIARIES
Notes to Consolidated Financial Statements
The following table presents assets and liabilities which are measured at fair value on a recurring basis at December 28, 2013 (in millions):
| Fair Value Measurements | ||||||||||||||||
| Total | Quoted prices in active markets for identical assets (Level 1) |
Significant observable inputs (Level 2) |
Significant unobservable inputs (Level 3) |
|||||||||||||
| Assets: |
||||||||||||||||
| Cash equivalents |
||||||||||||||||
| Term deposits |
$ | 2,818.0 | $ | — | $ | 2,818.0 | $ | — | ||||||||
| Money market |
449.0 | 449.0 | — | — | ||||||||||||
| Bankers’ acceptances |
309.6 | — | 309.6 | — | ||||||||||||
| Commercial paper |
274.0 | — | 274.0 | — | ||||||||||||
| Short-term investments(1) |
81.0 | 42.0 | 39.0 | — | ||||||||||||
| Non-current investments(2) |
38.0 | — | 38.0 | — | ||||||||||||
|
|
|
|
|
|
|
|
|
|||||||||
| Total |
$ | 3,969.6 | $ | 491.0 | $ | 3,478.6 | $ | — | ||||||||
|
|
|
|
|
|
|
|
|
|||||||||
| Liabilities: |
||||||||||||||||
| Contingent consideration(3) |
$ | 2.9 | $ | — | $ | — | $ | 2.9 | ||||||||
|
|
|
|
|
|
|
|
|
|||||||||
| Total |
$ | 2.9 | $ | — | $ | — | $ | 2.9 | ||||||||
|
|
|
|
|
|
|
|
|
|||||||||
| (1) | Included in Prepaid Expenses and Other Current Assets on the balance sheet. |
| (2) | Included in Other Assets on the balance sheet. |
| (3) | Included in Accrued Claims and Other Liabilities on the balance sheet. |
A reconciliation of the beginning and ending balances for Level 3 liabilities for the year ended December 28, 2013 follows (in millions):
| Contingent consideration |
||||
| Balance, beginning of year |
$ | 21.8 | ||
| Settlements |
(4.2 | ) | ||
| Gains |
(14.7 | ) | ||
|
|
|
|||
| Balance, end of year |
$ | 2.9 | ||
|
|
|
|||
In determining the fair value of assets and liabilities, the Company maximizes the use of quoted market prices and minimizes the use of unobservable inputs. The Level 1 fair values are based on quoted market values for identical assets. The fair values of Level 2 assets and liabilities are determined using prices from pricing agencies and financial institutions that develop values based on observable inputs in active markets. Level 3 fair values are determined from industry valuation models based on externally developed inputs.
In connection with the Company’s evaluation of long-lived assets for impairment, certain long-lived assets were measured at fair value on a nonrecurring basis using Level 3 inputs as defined in the fair value hierarchy. Fair value of long-lived assets is determined by estimating the amount and timing of net future cash flows (including rental expense for leased properties, sublease rental income, common area maintenance costs and real estate taxes) and discounting them using a risk-adjusted
| F-120 | (Continued) |
Table of Contents
SAFEWAY INC. AND SUBSIDIARIES
Notes to Consolidated Financial Statements
rate of interest. Safeway estimates future cash flows based on its experience and knowledge of the market in which the store is located and may use real estate brokers. During fiscal 2014, long-lived assets with a carrying value of $117.0 million were written down to their estimated fair value of $60.9 million, resulting in an impairment charge of $56.1 million. During fiscal 2013, long-lived assets with a carrying value of $63.5 million were written down to their estimated fair value of $27.9 million, resulting in an impairment charge of $35.6 million.
Note J: Lease Obligations
At year-end 2014, Safeway leased approximately 53% of its stores. Most leases have renewal options, typically with increased rental rates during the option period. Certain of these leases contain options to purchase the property at amounts that approximate fair market value.
As of year-end 2014, future minimum rental payments applicable to non-cancelable capital and operating leases with remaining terms in excess of one year were as follows (in millions):
| Capital leases |
Operating leases |
|||||||
| 2015 |
$ | 128.9 | $ | 450.7 | ||||
| 2016 |
118.0 | 424.8 | ||||||
| 2017 |
98.5 | 380.3 | ||||||
| 2018 |
70.1 | 328.7 | ||||||
| 2019 |
59.7 | 279.4 | ||||||
| Thereafter |
259.7 | 1,878.5 | ||||||
|
|
|
|
|
|||||
| Total minimum lease payments |
734.9 | $ | 3,742.4 | |||||
|
|
|
|||||||
| Less amounts representing interest |
(211.1 | ) | ||||||
|
|
|
|||||||
| Present value of net minimum lease payments |
523.8 | |||||||
|
|
|
|||||||
| Less current obligations |
(94.7 | ) | ||||||
|
|
|
|||||||
| Long-term obligations |
$ | 429.1 | ||||||
|
|
|
|||||||
Future minimum lease payments under non-cancelable capital and operating lease agreements have not been reduced by future minimum sublease rental income of $145.9 million.
Amortization expense for property under capital leases was $73.7 million in 2014, $46.1 million in 2013 and $26.3 million in 2012. Accumulated amortization of property under capital leases was $324.2 million at year-end 2014 and $251.9 million at year-end 2013.
| F-121 | (Continued) |
Table of Contents
SAFEWAY INC. AND SUBSIDIARIES
Notes to Consolidated Financial Statements
The following schedule shows the composition of total rental expense for all operating leases (in millions):
| 2014 | 2013 | 2012 | ||||||||||
| Property leases: |
||||||||||||
| Minimum rentals |
$ | 379.1 | $ | 365.5 | $ | 365.7 | ||||||
| Contingent rentals(1) |
8.8 | 7.3 | 7.7 | |||||||||
| Less rentals from subleases |
(11.5 | ) | (11.1 | ) | (9.4 | ) | ||||||
|
|
|
|
|
|
|
|||||||
| 376.4 | 361.7 | 364.0 | ||||||||||
| Equipment leases |
11.8 | 20.4 | 20.4 | |||||||||
|
|
|
|
|
|
|
|||||||
| $ | 388.2 | $ | 382.1 | $ | 384.4 | |||||||
|
|
|
|
|
|
|
|||||||
| (1) | In general, contingent rentals are based on individual store sales. |
Note K: Interest Expense
Interest expense consisted of the following (in millions):
| 2014 | 2013 | 2012 | ||||||||||
| Commercial paper |
$ | 0.2 | $ | 3.2 | $ | 6.0 | ||||||
| Bank credit agreement |
2.7 | 1.9 | 1.7 | |||||||||
| Term credit agreement |
2.3 | 7.3 | 8.7 | |||||||||
| Mortgage notes payable |
1.7 | 2.7 | 1.8 | |||||||||
| 5.80% Senior Notes due 2012 |
— | — | 29.1 | |||||||||
| Floating Rate Senior Notes due 2013 |
— | 4.3 | 2.7 | |||||||||
| 3.00% Second Series Notes due 2014 |
— | 7.4 | 9.0 | |||||||||
| 6.25% Senior Notes due 2014 |
— | 29.9 | 31.3 | |||||||||
| 5.625% Senior Notes due 2014 |
8.7 | 14.1 | 14.1 | |||||||||
| 3.40% Senior Notes due 2016 |
9.4 | 13.6 | 13.6 | |||||||||
| 6.35% Senior Notes due 2017 |
22.3 | 31.8 | 31.8 | |||||||||
| 5.00% Senior Notes due 2019 |
25.0 | 25.0 | 25.0 | |||||||||
| 3.95% Senior Notes due 2020 |
19.7 | 19.7 | 19.7 | |||||||||
| 4.75% Senior Notes due 2021 |
19.0 | 19.0 | 19.0 | |||||||||
| 7.45% Senior Debentures due 2027 |
11.2 | 11.2 | 11.2 | |||||||||
| 7.25% Senior Debentures due 2031 |
43.5 | 43.5 | 43.5 | |||||||||
| Other notes payable |
1.6 | 1.8 | 1.7 | |||||||||
| Obligations under capital leases |
33.8 | 38.0 | 39.7 | |||||||||
| Amortization of deferred finance costs |
4.0 | 7.4 | 6.9 | |||||||||
| Interest rate swap agreements |
— | — | (5.0 | ) | ||||||||
| Capitalized interest |
(6.2 | ) | (8.8 | ) | (10.9 | ) | ||||||
|
|
|
|
|
|
|
|||||||
| $ | 198.9 | $ | 273.0 | $ | 300.6 | |||||||
|
|
|
|
|
|
|
|||||||
Note L: Capital Stock
Shares Authorized and Issued Authorized preferred stock consists of 25.0 million shares, of which none were outstanding during 2014, 2013 or 2012. Authorized common stock consists of 1.5 billion shares at $0.01 par value per share. Common stock outstanding at year-end 2014 was 231.4 million shares (net of 14.4 million shares of treasury stock) and 230.1 million shares at year-end 2013 (net of 14.1 million shares of treasury stock).
| F-122 | (Continued) |
Table of Contents
SAFEWAY INC. AND SUBSIDIARIES
Notes to Consolidated Financial Statements
Shares Repurchased The Company did not repurchase any common stock during 2014 under its stock repurchase program. Safeway repurchased 19.5 million shares at an average cost of $33.93 and a total cost of $663.7 million (including commissions) during 2013 and 57.6 million shares at an average cost of $21.51 and a total cost of $1,240.3 million (including commissions) during 2012.
Retirement of Treasury Stock In 2014, the Company did not retire any shares of its repurchased common stock. In 2013, the Company retired 371.6 million shares of its repurchased common stock. The par value of the repurchased shares was charged to common stock, with the excess purchase price over par value allocated between paid-in capital and retained earnings. In 2012, the Company did not retire any shares of its repurchased common stock.
Stock Option Plans Under Safeway’s stock option plans, the Company may grant incentive and non-qualified options to purchase common stock at an exercise price equal to or greater than the fair market value at the grant date. Options generally vest over four or five years. Vested options are exercisable in part or in full at any time prior to the expiration date of six to 10 years from the date of the grant.
1999 Amended and Restated Equity Participation Plan Under the 1999 Amended and Restated Equity Participation Plan (the “1999 Plan”), options generally vest over four, five or seven years. Although the 1999 Plan remains in full force and effect, there will be no more grants under this plan. Vested options are exercisable in part or in full at any time prior to the expiration date of six to 10 years from the date of the grant. Shares issued as a result of stock option exercises will be funded with the issuance of new shares. The 2007 Equity and Incentive Award Plan (the “2007 Plan”) and the 2011 Equity and Incentive Award Plan (the “2011 Plan”), discussed below, succeed the 1999 Plan. See Note V for additional information.
2007 Equity and Incentive Award Plan In May 2007, the stockholders of Safeway approved the 2007 Plan. Under the 2007 Plan, Safeway may grant or issue stock options, stock appreciation rights, restricted stock units, deferred stock, dividend equivalents, performance awards and stock payments, or any combination thereof. Safeway may grant incentive and non-qualified options to purchase common stock at an exercise price equal to or greater than the fair market value at the grant date. Options to purchase 8.1 million shares were available for grant at January 3, 2015 under this plan. Shares issued as a result of the 2007 Plan may be treasury shares, authorized but unissued shares or shares purchased in the open market. See Note V for additional information.
2011 Equity and Incentive Award Plan In May 2011, the stockholders of Safeway approved the 2011 Plan. Under the 2011 Plan, Safeway may grant or issue stock options, stock appreciation rights, restricted stock, restricted stock units, deferred stock, dividend equivalents, performance awards and stock payments, or any combination thereof to participants other than Safeway’s Chief Executive Officer. Safeway may grant incentive and non-qualified options to purchase common stock at an exercise price equal to or greater than the fair market value at the grant date. At January 3, 2015, 6.0 million shares of common stock were available for issuance under this plan. Shares issued as a result of the 2011 Plan may be treasury shares, authorized but unissued shares or shares purchased in the open market. See Note V for additional information.
Restricted Stock Awards and Restricted Stock Units The Company awarded 748,611 shares, 747,708 shares and 695,816 shares of restricted stock in 2014, 2013 and 2012, respectively, to certain officers and key employees. These shares vested over a period of between three to five years and
| F-123 | (Continued) |
Table of Contents
SAFEWAY INC. AND SUBSIDIARIES
Notes to Consolidated Financial Statements
were subject to certain transfer restrictions and forfeiture prior to vesting. Deferred stock compensation, representing the fair value of the stock at the measurement date of the award, is amortized to compensation expense over the vesting period. The amortization of restricted stock resulted in compensation expense for continuing operations of $25.5 million in 2014, $15.8 million in 2013 and $13.1 million in 2012. See Note V for additional information.
Performance Share Awards In 2014, 2013 and 2012, Safeway granted performance share awards to certain executives. These performance share awards, covering a target of approximately 2.7 million shares, vested over three years. The 2014 performance share awards were subject to the achievement of specified levels of revenue growth and return on invested capital, as modified based on the Company’s total stockholder return. The 2013 and 2012 performance share awards were subject to the achievement of earnings per share goals determined on a compound annual growth rate basis relative to the S&P 500. Safeway recorded expense of $3.5 million in 2014 related to the 2014 awards. The Company recorded expense of $14.9 million in 2013 and $9.8 million in 2012 related to the 2013 and 2012 awards based on the then expected achievement of the performance targets. In the second quarter of 2014, the Company determined that it no longer believed that achievement of the performance targets related to the 2013 and 2012 awards was probable. Accordingly, in the second quarter of 2014, the Company reversed $18.8 million of previously recorded expense on unvested performance shares.
Pursuant to the terms of the Merger Agreement, all of the performance shares vested upon closing of the Merger. However, in accordance with generally accepted accounting principles, Safeway did not consider the probability of the Merger occurring in recording stock-based compensation expense.
On January 30, 2015, subsequent to the fiscal 2014 year end and in connection with the Merger, all outstanding stock option awards, performance shares, restricted stock units and restricted stock awards issued pursuant to various stockholder-approved plans and a stockholder-authorized employee stock purchase plan were automatically canceled in exchange for the right to receive certain cash consideration.
Activity in the Company’s stock option plans for the year ended January 3, 2015 was as follows:
| Options | Weighted- average exercise price |
Aggregate intrinsic value (in millions) |
||||||||||
| Outstanding, beginning of year |
7,728,655 | $ | 21.85 | $ | 82.3 | |||||||
|
|
|
|||||||||||
| 2014 Activity: |
||||||||||||
| Granted |
773,347 | 38.02 | ||||||||||
| Canceled |
(433,808 | ) | 22.29 | |||||||||
| Exercised |
(1,913,866 | ) | 18.42 | |||||||||
|
|
|
|||||||||||
| Outstanding, end of year |
6,154,328 | $ | 19.95 | $ | 93.4 | |||||||
|
|
|
|||||||||||
| Exercisable, end of year(1) |
2,869,781 | $ | 17.31 | $ | 51.1 | |||||||
|
|
|
|||||||||||
| Vested and expected to vest, end of year(2) |
5,215,892 | $ | 19.38 | $ | 82.2 | |||||||
|
|
|
|||||||||||
| (1) | The remaining weighted-average contractual life of these options is 5.3 years. |
| (2) | The remaining weighted-average contractual life of these options is 6.6 years. |
| F-124 | (Continued) |
Table of Contents
SAFEWAY INC. AND SUBSIDIARIES
Notes to Consolidated Financial Statements
Weighted-average fair value of options granted during the year:
| 2012 |
$ | 4.50 | ||
| 2013 |
6.67 | |||
| 2014 |
8.13 |
The total intrinsic value of options exercised was $30.7 million in 2014, $47.0 million in 2013 and $0.7 million in 2012. As of year-end 2014, there was $25.4 million of total unrecognized compensation cost related to nonvested stock-based compensation arrangements granted under the Company’s stock option plans. That cost is expected to be recognized over a weighted-average period of 2.3 years.
Additional Stock Plan Information Safeway accounts for stock-based employee compensation in accordance with generally accepted accounting principles for stock compensation. The Company determines fair value of such awards using the Black-Scholes option pricing model. The following weighted-average assumptions used, by year, to value Safeway’s grants are as follows:
| 2014 | 2013 | 2012 | ||||||||||
| Expected life (in years) |
6.25 | 6.25 – 6.5 | 6.25 – 6.5 | |||||||||
| Expected stock volatility |
27.9 | % | 31.6% – 33.0 | % | 30.6% – 33.9 | % | ||||||
| Risk-free interest rate |
2.0 | % | 1.1% – 2.1 | % | 0.9% – 1.3 | % | ||||||
| Expected dividend yield during the expected term |
2.8 | % | 3.5% – 4.0 | % | 2.8% – 3.7 | % | ||||||
The expected term of the awards was determined utilizing the “simplified method” outlined in SEC Staff Accounting Bulletin No. 107 that utilizes the following formula: (vesting term + original contract term)/2. Expected stock volatility was determined based upon a combination of historical volatility for periods preceding the measurement date and estimates of implied volatility based upon open interests in traded option contracts on Safeway common stock. The risk-free interest rate was based on the yield curve in effect at the time the options were granted, using U.S. constant maturities over the expected life of the option. Expected dividend yield is based on Safeway’s dividend policy at the time the options were granted.
The following table summarizes information about unvested Safeway restricted stock as of January 3, 2015:
| Awards | Weighted- average grant date fair value |
|||||||
| Unvested, beginning of year |
2,232,263 | $ | 22.45 | |||||
| Granted |
748,611 | 36.84 | ||||||
| Vested |
(761,233 | ) | 23.11 | |||||
| Canceled |
(137,311 | ) | 25.63 | |||||
|
|
|
|||||||
| Unvested, end of year |
2,082,330 | $ | 27.12 | |||||
|
|
|
|||||||
At the date of vest, the fair value of restricted stock awards vested during the year was $28.7 million in 2014, $16.4 million in 2013 and $14.2 million in 2012. At January 3, 2015, there was $52.9 million of total unrecognized compensation cost related to non-vested restricted stock awards. The cost is expected to be recognized over a weighted average period of 2.7 years.
| F-125 | (Continued) |
Table of Contents
SAFEWAY INC. AND SUBSIDIARIES
Notes to Consolidated Financial Statements
Total share-based compensation expenses for continuing operations recognized as a component of operating and administrative expense is as follows (in millions):
| 2014 | 2013 | 2012 | ||||||||||
| Share-based compensation expense |
$ | 24.7 | $ | 50.4 | $ | 48.4 | ||||||
| Income tax benefit |
(9.7 | ) | (19.6 | ) | (18.7 | ) | ||||||
|
|
|
|
|
|
|
|||||||
| Share-based compensation expense recognized in earnings, net of tax |
$ | 15.0 | $ | 30.8 | $ | 29.7 | ||||||
|
|
|
|
|
|
|
|||||||
Note M: Taxes on Income
The components of income before income tax expense are as follows (in millions):
| 2014 | 2013 | 2012 | ||||||||||
| Domestic |
$ | 159.5 | $ | 258.3 | $ | 370.7 | ||||||
| Foreign |
5.5 | (6.7 | ) | (8.5 | ) | |||||||
|
|
|
|
|
|
|
|||||||
| $ | 165.0 | $ | 251.6 | $ | 362.2 | |||||||
|
|
|
|
|
|
|
|||||||
The components of income tax expense are as follows (in millions):
| 2014 | 2013 | 2012 | ||||||||||
| Current: |
||||||||||||
| Federal |
$ | (33.9 | ) | $ | 301.7 | $ | 146.9 | |||||
| State |
4.2 | 11.8 | 5.1 | |||||||||
| Foreign |
1.9 | (2.4 | ) | (2.9 | ) | |||||||
|
|
|
|
|
|
|
|||||||
| (27.8 | ) | 311.1 | 149.1 | |||||||||
|
|
|
|
|
|
|
|||||||
| Deferred: |
||||||||||||
| Federal |
78.5 | (273.9 | ) | (35.4 | ) | |||||||
| State |
11.2 | (2.7 | ) | (0.7 | ) | |||||||
| Foreign |
(0.1 | ) | — | — | ||||||||
|
|
|
|
|
|
|
|||||||
| 89.6 | (276.6 | ) | (36.1 | ) | ||||||||
|
|
|
|
|
|
|
|||||||
| $ | 61.8 | $ | 34.5 | $ | 113.0 | |||||||
|
|
|
|
|
|
|
|||||||
Reconciliation of the provision for income taxes at the U.S. federal statutory income tax rate to the Company’s income taxes is as follows (dollars in millions):
| 2014 | 2013 | 2012 | ||||||||||
| Statutory rate |
35 | % | 35 | % | 35 | % | ||||||
| Income tax expense using federal statutory rate |
$ | 57.8 | $ | 88.1 | $ | 126.8 | ||||||
| State taxes on income net of federal benefit |
9.9 | 5.9 | 2.9 | |||||||||
| Charitable donations of inventory |
(9.2 | ) | (9.6 | ) | (4.3 | ) | ||||||
| Federal tax credits |
(4.0 | ) | (11.2 | ) | (2.2 | ) | ||||||
| Reversal of deferred tax liability on life insurance |
— | (17.2 | ) | — | ||||||||
| Equity earnings of foreign affiliate |
3.6 | (13.3 | ) | (8.4 | ) | |||||||
| Other |
3.7 | (8.2 | ) | (1.8 | ) | |||||||
|
|
|
|
|
|
|
|||||||
| $ | 61.8 | $ | 34.5 | $ | 113.0 | |||||||
|
|
|
|
|
|
|
|||||||
| F-126 | (Continued) |
Table of Contents
SAFEWAY INC. AND SUBSIDIARIES
Notes to Consolidated Financial Statements
In 2013, Safeway withdrew $68.7 million from the accumulated cash surrender value of corporate-owned life insurance (“COLI”) policies purchased in the early 1980s and determined that a majority of the remaining cash surrender value would be received in the future through tax-free death benefits. Consequently, Safeway reversed deferred taxes on that remaining cash surrender value and reduced tax expense by $17.2 million.
Significant components of the Company’s net deferred tax asset at year end are as follows (in millions):
| 2014 | 2013 | |||||||
| Deferred tax assets: |
||||||||
| Pension liability |
$ | 391.4 | $ | 279.8 | ||||
| Workers’ compensation and other claims |
184.3 | 152.0 | ||||||
| Employee benefits |
165.1 | 155.7 | ||||||
| Accrued claims and other liabilities |
90.4 | 92.4 | ||||||
| Reserves not currently deductible |
77.3 | 63.8 | ||||||
| Federal deduction of state taxes |
3.5 | 51.2 | ||||||
| State tax credit carryforwards |
21.7 | 21.3 | ||||||
| Operating loss carryforwards |
— | 8.8 | ||||||
| Other assets |
45.6 | 9.5 | ||||||
|
|
|
|
|
|||||
| $ | 979.3 | $ | 834.5 | |||||
|
|
|
|
|
|||||
| 2014 | 2013 | |||||||
| Deferred tax liabilities: |
||||||||
| Property |
$ | (546.8 | ) | $ | (430.0 | ) | ||
| Inventory |
(311.7 | ) | (273.3 | ) | ||||
| Investment in Blackhawk |
— | (17.9 | ) | |||||
| Investments in foreign operations |
(10.9 | ) | (6.5 | ) | ||||
|
|
|
|
|
|||||
| (869.4 | ) | (727.7 | ) | |||||
|
|
|
|
|
|||||
| Net deferred tax asset |
$ | 109.9 | $ | 106.8 | ||||
|
|
|
|
|
|||||
Deferred tax assets and liabilities are reported in the balance sheet as follows (in millions):
| 2014 | 2013 | |||||||
| Current deferred tax assets(1) |
$ | — | $ | 51.8 | ||||
| Noncurrent deferred tax assets(2) |
139.3 | 55.0 | ||||||
| Current deferred tax liability |
(29.4 | ) | — | |||||
| Noncurrent deferred tax liability |
— | — | ||||||
|
|
|
|
|
|||||
| Net deferred tax asset |
$ | 109.9 | $ | 106.8 | ||||
|
|
|
|
|
|||||
| (1) | Included in Prepaid Expenses and Other Current Assets. |
| (2) | Included in Other Assets. |
At January 3, 2015, the Company had state tax credit carryforwards of $34.6 million which expire in 2023.
| F-127 | (Continued) |
Table of Contents
SAFEWAY INC. AND SUBSIDIARIES
Notes to Consolidated Financial Statements
At year-end 2014, no deferred tax liability has been recognized for the $180.0 million of unremitted foreign earnings because the Company intends to utilize those earnings in the foreign operations for an indefinite period of time. If Safeway did not consider these earnings to be indefinitely reinvested, the deferred tax liability would have been in the range of $50 million to $80 million at year-end 2014.
A reconciliation of the beginning and ending amount of unrecognized tax benefits follows (in millions):
| 2014 | 2013 | 2012 | ||||||||||
| Balance at beginning of year |
$ | 137.5 | $ | 119.4 | $ | 161.3 | ||||||
| Additions based on tax positions related to the current year |
12.8 | 75.6 | 2.7 | |||||||||
| Reduction for tax positions of current year |
— | (4.9 | ) | — | ||||||||
| Additions for tax positions of prior years |
112.6 | 0.2 | 2.2 | |||||||||
| Reductions for tax positions of prior years |
— | (47.1 | ) | (46.9 | ) | |||||||
| Foreign currency translation |
— | (0.3 | ) | 0.1 | ||||||||
| Expiration of statute of limitations |
— | (1.3 | ) | — | ||||||||
| Settlements |
(0.2 | ) | (4.1 | ) | — | |||||||
|
|
|
|
|
|
|
|||||||
| Balance at end of year |
$ | 262.7 | $ | 137.5 | $ | 119.4 | ||||||
|
|
|
|
|
|
|
|||||||
As of January 3, 2015, December 28, 2013 and December 29, 2012, the balance of unrecognized tax benefits included tax positions of $132.8 million (net of tax), $60.1 million (net of tax) and $42.9 million (net of tax), respectively, that would reduce the Company’s effective income tax rate if recognized in future periods. The $132.8 million of tax positions as of January 3, 2015 include $125.1 million of tax positions related to discontinued operations and $7.7 million of tax positions related to continuing operations.
Continuing operations income tax expense in 2014, 2013 and 2012 included expense of $0.3 million (net of tax), benefit of $5.9 million (net of tax) and benefit of $5.6 million (net of tax), respectively, related to interest and penalties. As of January 3, 2015 and December 28, 2013, the Company’s accrual for net interest and penalties were receivables of $0.2 million and $5.2 million, respectively.
The Company and its domestic subsidiaries file income tax returns with federal, state and local tax authorities within the United States. The Company’s foreign affiliates file income tax returns in various foreign jurisdictions, the most significant of which are Canada and certain of its provinces. The Company expects that it will no longer be subject to federal income tax examinations for fiscal years before 2007, and is no longer subject to state and local income tax examinations for fiscal years before 2007. With limited exceptions, including proposed deficiencies which the Company is protesting, Safeway’s Canadian affiliates are no longer subject to examination by Canada and certain of its provinces for fiscal years before 2006.
The Company does not anticipate that total unrecognized tax benefits will change significantly in the next 12 months.
| F-128 | (Continued) |
Table of Contents
SAFEWAY INC. AND SUBSIDIARIES
Notes to Consolidated Financial Statements
Note N: Employee Benefit Plans
Pension Plans The Company maintains defined benefit, non-contributory retirement plans for substantially all of its employees not participating in multiemployer pension plans. Safeway recognizes the funded status of its retirement plans on its consolidated balance sheet.
Other Post-Retirement Benefits In addition to the Company’s pension plans, the Company sponsors plans that provide post-retirement medical and life insurance benefits to certain employees. Retirees share a portion of the cost of the post-retirement medical plans. Safeway pays all the costs of the life insurance plans. The Company also sponsors a Retirement Restoration Plan that provides death benefits and supplemental income payments for senior executives after retirement. All of these Other Post-Retirement Benefit Plans are unfunded.
Canadian Pension and Other Post-Retirement Plans Sobeys assumed Safeway’s Canadian pension and post-retirement plan obligations as part of the overall purchase of Safeway’s Canadian operations in November 2013. Accordingly, the activity in these plans is not included in this footnote unless otherwise noted.
Beginning in 2013, the Company maintains a defined contribution plan for Safeway’s continuing employees in Canada. The plan provides an annual retirement benefit into a fund that is managed by the employee. Plan contributions are based on the employees age, earnings and years of participation in the plan. The Company also makes discretionary contributions. Contributions to the defined contribution plan totaled $0.8 million in 2014 and $0.1 million in 2013.
| F-129 | (Continued) |
Table of Contents
SAFEWAY INC. AND SUBSIDIARIES
Notes to Consolidated Financial Statements
The following table provides a reconciliation of the changes in the retirement plans’ benefit obligation and fair value of assets over the two-year period ended January 3, 2015 and a statement of the funded status as of year-end 2014 and year-end 2013 (in millions):
| Pension | Other Post-Retirement Benefits |
|||||||||||||||
| 2014 | 2013 | 2014 | 2013 | |||||||||||||
| Change in projected benefit obligation: |
||||||||||||||||
| Beginning balance |
$ | 2,023.4 | $ | 2,635.4 | $ | 79.5 | $ | 135.0 | ||||||||
| Service cost |
42.5 | 42.0 | 0.9 | 0.7 | ||||||||||||
| Interest cost |
96.4 | 85.4 | 3.4 | 3.2 | ||||||||||||
| Plan amendments |
0.2 | 0.2 | — | |||||||||||||
| Actuarial loss (gain) |
254.0 | (56.3 | ) | 12.4 | (5.0 | ) | ||||||||||
| Plan participant contributions |
— | — | 0.9 | 1.0 | ||||||||||||
| Benefit payments |
(172.5 | ) | (133.3 | ) | (7.3 | ) | (7.2 | ) | ||||||||
| Change in projected benefit obligation related to CSL |
— | (39.5 | ) | — | 1.3 | |||||||||||
| Disposal of CSL |
— | (510.5 | ) | — | (49.5 | ) | ||||||||||
|
|
|
|
|
|
|
|
|
|||||||||
| Ending balance |
$ | 2,244.0 | $ | 2,023.4 | $ | 89.8 | $ | 79.5 | ||||||||
|
|
|
|
|
|
|
|
|
|||||||||
| Change in fair value of plan assets: |
||||||||||||||||
| Beginning balance |
$ | 1,644.2 | $ | 1,845.7 | $ | — | $ | — | ||||||||
| Actual return on plan assets |
82.6 | 268.6 | — | — | ||||||||||||
| Employer contributions |
6.9 | 50.1 | 6.4 | 6.2 | ||||||||||||
| Plan participant contributions |
— | — | 0.9 | 1.0 | ||||||||||||
| Benefit payments |
(172.5 | ) | (133.3 | ) | (7.3 | ) | (7.2 | ) | ||||||||
| Change in fair value of plan assets related to CSL |
— | 32.8 | — | — | ||||||||||||
| Disposal of CSL |
— | (419.7 | ) | — | — | |||||||||||
|
|
|
|
|
|
|
|
|
|||||||||
| Ending balance |
$ | 1,561.2 | $ | 1,644.2 | $ | — | $ | — | ||||||||
|
|
|
|
|
|
|
|
|
|||||||||
| Components of net amount recognized in financial position: |
||||||||||||||||
| Other accrued liabilities (current liability) |
$ | (1.1 | ) | $ | (1.1 | ) | $ | (6.4 | ) | $ | (6.2 | ) | ||||
| Pension and post-retirement benefit obligations (non-current liability) |
(681.7 | ) | (378.1 | ) | (83.4 | ) | (73.3 | ) | ||||||||
|
|
|
|
|
|
|
|
|
|||||||||
| Funded status |
$ | (682.8 | ) | $ | (379.2 | ) | $ | (89.8 | ) | $ | (79.5 | ) | ||||
|
|
|
|
|
|
|
|
|
|||||||||
Amounts recognized in accumulated other comprehensive income consist of the following (in millions):
| Pension | Other Post-Retirement Benefits |
|||||||||||||||
| 2014 | 2013 | 2014 | 2013 | |||||||||||||
| Net actuarial loss |
$ | 611.8 | $ | 365.0 | $ | 22.9 | $ | 10.6 | ||||||||
| Prior service cost (credit) |
4.8 | 14.3 | (1.0 | ) | (1.1 | ) | ||||||||||
|
|
|
|
|
|
|
|
|
|||||||||
| $ | 616.6 | $ | 379.3 | $ | 21.9 | $ | 9.5 | |||||||||
|
|
|
|
|
|
|
|
|
|||||||||
| F-130 | (Continued) |
Table of Contents
SAFEWAY INC. AND SUBSIDIARIES
Notes to Consolidated Financial Statements
Information for Safeway’s pension plans, all of which have an accumulated benefit obligation in excess of plan assets as of year-end 2014 and 2013, is shown below (in millions):
| 2014 | 2013 | |||||||
| Projected benefit obligation |
$ | 2,244.0 | $ | 2,023.4 | ||||
| Accumulated benefit obligation |
2,179.6 | 1,978.3 | ||||||
| Fair value of plan assets |
1,561.2 | 1,644.2 | ||||||
The following tables provide the components of net expense for the retirement plans and other changes in plan assets and benefit obligations recognized in other comprehensive income (in millions):
| Pension | Other Post-Retirement Benefits |
|||||||||||||||||||||||
| Components of net expense: |
2014 | 2013 | 2012 | 2014 | 2013 | 2012 | ||||||||||||||||||
| Estimated return on plan assets |
$ | (119.3 | ) | $ | (107.9 | ) | $ | (101.0 | ) | $ | — | $ | — | $ | — | |||||||||
| Service cost |
42.5 | 42.0 | 40.3 | 0.9 | 0.7 | 0.6 | ||||||||||||||||||
| Interest cost |
96.4 | 85.4 | 91.8 | 3.4 | 3.2 | 3.6 | ||||||||||||||||||
| Settlement loss |
— | — | 5.9 | — | — | — | ||||||||||||||||||
| Curtailment loss |
— | — | 1.8 | — | — | — | ||||||||||||||||||
| Amortization of prior service cost (credit) |
9.7 | 12.8 | 15.3 | (0.1 | ) | (0.1 | ) | (0.1 | ) | |||||||||||||||
| Amortization of net actuarial loss |
42.3 | 77.8 | 70.3 | 0.4 | 0.9 | 0.5 | ||||||||||||||||||
|
|
|
|
|
|
|
|
|
|
|
|
|
|||||||||||||
| Net expense |
$ | 71.6 | $ | 110.1 | $ | 124.4 | $ | 4.6 | $ | 4.7 | $ | 4.6 | ||||||||||||
|
|
|
|
|
|
|
|
|
|
|
|
|
|||||||||||||
| Changes in plan assets and benefit obligations recognized in other comprehensive income: |
||||||||||||||||||||||||
| Net actuarial loss (gain) |
$ | 290.6 | $ | (216.9 | ) | $ | 97.8 | $ | 12.7 | $ | (5.0 | ) | $ | 6.6 | ||||||||||
| Recognition of net actuarial loss |
(42.3 | ) | (77.8 | ) | (76.3 | ) | (0.4 | ) | (0.9 | ) | (0.5 | ) | ||||||||||||
| Prior service credit |
0.2 | 0.2 | 0.5 | — | — | — | ||||||||||||||||||
| Recognition of prior service (cost) credit |
(9.7 | ) | (12.8 | ) | (17.0 | ) | 0.1 | 0.1 | 0.1 | |||||||||||||||
| Changes relating to discontinued operations |
— | (55.5 | ) | 9.0 | — | (3.0 | ) | (5.0 | ) | |||||||||||||||
|
|
|
|
|
|
|
|
|
|
|
|
|
|||||||||||||
| Total recognized in other comprehensive income |
238.8 | (362.8 | ) | 14.0 | 12.4 | (8.8 | ) | 1.2 | ||||||||||||||||
|
|
|
|
|
|
|
|
|
|
|
|
|
|||||||||||||
| Total net expense and changes in plan assets and benefit obligations recognized in comprehensive income |
$ | 310.4 | $ | (252.7 | ) | $ | 138.4 | $ | 17.0 | $ | (4.1 | ) | $ | 5.8 | ||||||||||
|
|
|
|
|
|
|
|
|
|
|
|
|
|||||||||||||
Prior service costs are amortized on a straight-line basis over the average remaining service period of active participants. Actuarial gains and losses are amortized over the average remaining service life of active participants when the accumulation of such gains and losses exceeds 10% of the greater of the projected benefit obligation and the fair value of plan assets. The Company uses its fiscal year-end date as the measurement date for its plans. In 2014, Safeway adopted the Society of Actuaries’ 2014 mortality rate table. This had the effect of increasing Safeway’s projected benefit obligation by $168 million.
| F-131 | (Continued) |
Table of Contents
SAFEWAY INC. AND SUBSIDIARIES
Notes to Consolidated Financial Statements
The actuarial assumptions used to determine year-end projected benefit obligations for pension plans were as follows:
| 2014 | 2013 | 2012 | ||||||||||
| Discount rate: |
||||||||||||
| United States plans |
4.00 | % | 4.90 | % | 4.20 | % | ||||||
| Canadian plans |
NA | NA | 4.00 | % | ||||||||
| Combined weighted-average rate |
NA | NA | 4.16 | % | ||||||||
| Rate of compensation increase: |
||||||||||||
| United States plans |
3.00 | % | 3.00 | % | 3.00 | % | ||||||
| Canadian plans |
NA | NA | 2.75 | % | ||||||||
The actuarial assumptions used to determine net periodic benefit costs for pension plans were as follows:
| 2014 | 2013 | 2012 | ||||||||||
| Discount rate |
4.90 | % | 4.20 | % | 4.94 | % | ||||||
| Expected return on plan assets: |
7.50 | % | 7.50 | % | 7.75 | % | ||||||
| Rate of compensation increase |
3.00 | % | 3.00 | % | 3.00 | % | ||||||
The Company has adopted and implemented an investment policy for the defined benefit pension plans that incorporates a strategic long-term asset allocation mix designed to meet the Company’s long-term pension requirements. This asset allocation policy is reviewed annually and, on a regular basis, actual allocations are rebalanced to the prevailing targets. The following table summarizes actual allocations for Safeway’s plans at year-end:
| Plan assets | ||||||||||||
| Asset category |
Target | 2014 | 2013 | |||||||||
| Equity |
65 | % | 65.8 | % | 66.4 | % | ||||||
| Fixed income |
35 | % | 32.9 | % | 31.9 | % | ||||||
| Cash and other |
— | 1.3 | % | 1.7 | % | |||||||
|
|
|
|
|
|
|
|||||||
| Total |
100 | % | 100.0 | % | 100.0 | % | ||||||
|
|
|
|
|
|
|
|||||||
The investment policy also emphasizes the following key objectives: (1) maintain a diversified portfolio among asset classes and investment styles; (2) maintain an acceptable level of risk in pursuit of long-term economic benefit; (3) maximize the opportunity for value-added returns from active investment management while establishing investment guidelines and monitoring procedures for each investment manager to ensure the characteristics of the portfolio are consistent with the original investment mandate; and (4) maintain adequate controls over administrative costs.
Expected return on pension plan assets is based on historical experience of the Company’s portfolio and the review of projected returns by asset class on broad, publicly traded equity and fixed-income indices, as well as target asset allocation. Safeway’s target asset allocation mix is designed to meet the Company’s long-term pension requirements.
| F-132 | (Continued) |
Table of Contents
SAFEWAY INC. AND SUBSIDIARIES
Notes to Consolidated Financial Statements
The fair value of Safeway’s pension plan assets at January 3, 2015, excluding pending transactions of $41.5 million, by asset category are as follows (in millions):
| Fair Value Measurements | ||||||||||||||||
| Total | Quoted prices in active markets for identical assets (Level 1) |
Significant observable inputs (Level 2) |
Significant unobservable inputs (Level 3) |
|||||||||||||
| Asset category: |
||||||||||||||||
| Cash and cash equivalents(1) |
$ | 9.6 | $ | 1.3 | $ | 8.3 | $ | — | ||||||||
| Short-term investment collective trust(2) |
47.5 | — | 47.5 | — | ||||||||||||
| Common and preferred stock:(3) |
||||||||||||||||
| Domestic common and preferred stock |
293.6 | 293.5 | 0.1 | — | ||||||||||||
| International common stock |
34.6 | 34.6 | — | — | ||||||||||||
| Common collective trust funds(2) |
523.6 | — | 523.6 | — | ||||||||||||
| Corporate bonds(4) |
121.3 | — | 120.6 | 0.7 | ||||||||||||
| Mortgage- and other asset-backed securities(5) |
63.4 | — | 63.4 | — | ||||||||||||
| Mutual funds(6) |
183.2 | 34.2 | 149.0 | — | ||||||||||||
| U.S. government securities(7) |
263.8 | — | 263.7 | 0.1 | ||||||||||||
| Other securities(8) |
62.8 | 0.7 | 37.6 | 24.5 | ||||||||||||
|
|
|
|
|
|
|
|
|
|||||||||
| Total |
$ | 1,603.4 | $ | 364.3 | $ | 1,213.8 | $ | 25.3 | ||||||||
|
|
|
|
|
|
|
|
|
|||||||||
| (1) | The carrying value of these items approximates fair value. |
| (2) | These investments are valued based on the Net Asset Value (“NAV”) of the underlying investments and are provided by the fund issuers. |
| (3) | The fair value of common stock is based on the exchange quoted market prices. When quoted prices are not available for preferred stock, an industry standard valuation model is used which maximizes observable inputs. |
| (4) | The fair value of corporate bonds is generally based on yields currently available on comparable securities of issuers with similar credit ratings. When quoted prices are not available for identical or similar bonds, the fair value is based upon an industry valuation model, which maximizes observable inputs. |
| (5) | The fair value of mortgage- and other asset-backed securities is generally based on yields currently available on comparable securities of issuers with similar credit ratings. When quoted prices are not available for comparable securities, the fair value is based upon an industry model which maximizes observable inputs. |
| (6) | These investments are publicly traded investments which are valued using the NAV. The NAV of the mutual funds is a quoted price in an active market. The NAV is determined once a day after the closing of the exchange based upon the underlying assets in the fund, less the fund’s liabilities, expressed on a per-share basis. |
| (7) | The fair value of U.S. government securities is based on quoted market prices when available. When quoted prices are not available, the fair value of U.S. government securities is based on yields currently available on comparable securities or on an industry valuation model which maximizes observable inputs. |
| (8) | Other securities, which consist primarily of U.S. municipal bonds, foreign government bonds and foreign agency securities are valued based on yields currently available on comparable securities of issuers with similar credit ratings. |
| F-133 | (Continued) |
Table of Contents
SAFEWAY INC. AND SUBSIDIARIES
Notes to Consolidated Financial Statements
Also included in Other Securities are exchange-traded derivatives that are valued based on quoted prices in an active market for identical derivatives; assets and liabilities. Non-exchange-traded derivatives are valued using industry valuation models, which maximize observable inputs, such as interest-rate yield curve data, foreign exchange rates and applicable spot and forward rates.
See Note I for a discussion of levels.
A reconciliation of the beginning and ending balances for Level 3 assets for the year ended January 3, 2015 follows (in millions):
| Fair Value Measured Using Significant Unobservable Inputs (Level 3) |
||||||||||||||||
| Total | Corporate bonds |
U.S. government securities |
Other securities |
|||||||||||||
| Balance, beginning of year |
$ | 7.9 | $ | — | $ | 0.1 | $ | 7.8 | ||||||||
| Purchases, sales, settlements, net |
19.7 | 0.7 | — | 19.0 | ||||||||||||
| Unrealized gains |
(2.3 | ) | — | — | (2.3 | ) | ||||||||||
|
|
|
|
|
|
|
|
|
|||||||||
| Balance, end of year |
$ | 25.3 | $ | 0.7 | $ | 0.1 | $ | 24.5 | ||||||||
|
|
|
|
|
|
|
|
|
|||||||||
The fair value of Safeway’s pension plan assets at December 28, 2013, excluding pending transactions of $37.2 million, by asset category are as follows (in millions):
| Fair Value Measurements | ||||||||||||||||
| Total | Quoted prices in active markets for identical assets (Level 1) |
Significant observable inputs (Level 2) |
Significant unobservable inputs (Level 3) |
|||||||||||||
| Asset category: |
||||||||||||||||
| Cash and cash equivalents(1) |
$ | 30.2 | $ | 29.0 | $ | 1.2 | $ | — | ||||||||
| Short-term investment collective trust(2) |
18.2 | — | 18.2 | — | ||||||||||||
| Common and preferred stock:(3) |
||||||||||||||||
| Domestic common and preferred stock |
270.4 | 269.9 | 0.5 | — | ||||||||||||
| International common stock |
38.5 | 38.5 | — | — | ||||||||||||
| Common collective trust funds(2) |
611.2 | — | 611.2 | — | ||||||||||||
| Corporate bonds(4) |
101.1 | — | 101.1 | — | ||||||||||||
| Mortgage- and other asset-backed securities(5) |
62.3 | — | 62.3 | — | ||||||||||||
| Mutual funds(6) |
183.8 | 5.9 | 177.9 | — | ||||||||||||
| U.S. government securities(7) |
335.8 | — | 335.7 | 0.1 | ||||||||||||
| Other securities(8) |
29.9 | 3.1 | 19.0 | 7.8 | ||||||||||||
|
|
|
|
|
|
|
|
|
|||||||||
| Total |
$ | 1,681.4 | $ | 346.4 | $ | 1,327.1 | $ | 7.9 | ||||||||
|
|
|
|
|
|
|
|
|
|||||||||
| (1) | The carrying value of these items approximates fair value. |
| (2) | These investments are valued based on the Net Asset Value (“NAV”) of the underlying investments and are provided by the fund issuers. |
| (3) | The fair value of common stock is based on the exchange quoted market prices. When quoted prices are not available for preferred stock, an industry standard valuation model is used which maximizes observable inputs. |
| F-134 | (Continued) |
Table of Contents
SAFEWAY INC. AND SUBSIDIARIES
Notes to Consolidated Financial Statements
| (4) | The fair value of corporate bonds is generally based on yields currently available on comparable securities of issuers with similar credit ratings. When quoted prices are not available for identical or similar bonds, the fair value is based upon an industry valuation model, which maximizes observable inputs. |
| (5) | The fair value of mortgage- and other asset-backed securities is generally based on yields currently available on comparable securities of issuers with similar credit ratings. When quoted prices are not available for comparable securities, the fair value is based upon an industry model which maximizes observable inputs. |
| (6) | These investments are publicly traded investments which are valued using the NAV. The NAV of the mutual funds is a quoted price in an active market. The NAV is determined once a day after the closing of the exchange based upon the underlying assets in the fund, less the fund’s liabilities, expressed on a per-share basis. |
| (7) | The fair value of U.S. government securities is based on quoted market prices when available. When quoted prices are not available, the fair value of U.S. government securities is based on yields currently available on comparable securities or on an industry valuation model which maximizes observable inputs. |
| (8) | Other securities, which consist primarily of U.S. municipal bonds, foreign government bonds and foreign agency securities are valued based on yields currently available on comparable securities of issuers with similar credit ratings. |
Valuation techniques are described earlier in this note. See Note I for a discussion of levels.
A reconciliation of the beginning and ending balances for Level 3 assets for the year ended December 28, 2013 follows (in millions):
| Fair Value Measured Using Significant Unobservable Inputs (Level 3) |
||||||||||||||||||||
| Total | Corporate bonds |
Mortgage- and other asset-backed securities |
U.S. government securities |
Other Securities |
||||||||||||||||
| Balance, beginning of year |
$ | 4.0 | $ | 3.4 | $ | 0.5 | $ | 0.1 | $ | — | ||||||||||
| Purchases, sales, settlements, net |
4.0 | (3.4 | ) | (0.5 | ) | — | 7.9 | |||||||||||||
| Unrealized gains |
(0.1 | ) | — | — | — | (0.1 | ) | |||||||||||||
|
|
|
|
|
|
|
|
|
|
|
|||||||||||
| Balance, end of year |
$ | 7.9 | $ | — | $ | — | $ | 0.1 | $ | 7.8 | ||||||||||
|
|
|
|
|
|
|
|
|
|
|
|||||||||||
Contributions Cash contributions are expected to increase to approximately $268 million in 2015, primarily due to the settlement with the Pension Benefit Guaranty Corporation.
Estimated Future Benefit Payments The following benefit payments, which reflect expected future service as appropriate, are expected to be paid (in millions):
| Pension benefits | Other benefits | |||||||
| 2015 |
$ | 140.3 | $ | 6.8 | ||||
| 2016 |
140.4 | 6.7 | ||||||
| 2017 |
141.5 | 6.6 | ||||||
| 2018 |
141.8 | 6.5 | ||||||
| 2019 |
142.4 | 6.4 | ||||||
| 2020—2024 |
709.8 | 23.3 | ||||||
| F-135 | (Continued) |
Table of Contents
SAFEWAY INC. AND SUBSIDIARIES
Notes to Consolidated Financial Statements
Note O: Multiemployer Benefit Plans
Multiemployer Pension Plans Safeway contributes to a number of multiemployer defined benefit pension plans under the terms of collective bargaining agreements that cover its union-represented employees. Benefits generally are based on a fixed amount for each year of service, and, in some cases, are not negotiated with contributing employers or in some cases even known by contributing employers. None of the Company’s collective bargaining agreements require that a minimum contribution be made to these plans.
The risks of participating in U.S. multiemployer pension plans are different from single-employer pension plans in the following aspects:
| a. | Assets contributed to the multiemployer plan by one employer may be used to provide benefits to employees of other participating employers. |
| b. | If a participating employer stops contributing to the plan, the unfunded obligations of the plan may be borne by the remaining participating employers. |
| c. | If Safeway stops participating in some of its multiemployer pension plans, Safeway may be required to pay those plans an amount based on the underfunded status of the plan, referred to as a withdrawal liability. |
The Company made and charged to expense contributions of $277.1 million in 2014, $259.2 million in 2013 and $248.7 million in 2012 to these plans for continuing operations.
In 2013, the Company sold all Canadian operations which terminated our obligation to contribute to Canadian multiemployer pension plans. Due to provincial law in Canada, Safeway is not expected to incur multiemployer pension withdrawal liability associated with the sale.
Also in 2013, the Company sold or closed all stores in the Dominick’s division. As previously reported, Dominick’s participated in certain multiemployer pension plans on which withdrawal liabilities have been or we expect will be incurred due to the Dominick’s closure. Generally, the Company may pay such withdrawal liabilities in installment payments. Withdrawal liabilities are generally subject to a 20-year payment cap, but may extend into perpetuity if a mass withdrawal from the plan occurs.
During the fourth quarter of 2013, Safeway recorded a liability of $310.8 million, which represented the present value of estimated installment payments to be made to the plans based on the best information available at the time, without having yet received demand letters from the multiemployer pension plans. In April 2014 and September 2014, the Company received demand letters from three of the plans. These demand letters called for installment payments greater than Safeway’s original actuarial estimate based on calculations Safeway disputes. The Company has requested a review by the plan trustee of the demands made by the three plans.
| F-136 | (Continued) |
Table of Contents
SAFEWAY INC. AND SUBSIDIARIES
Notes to Consolidated Financial Statements
The Company’s loss estimate is in accordance with ASC 450, “Contingencies.” The following is a rollforward of the estimated multiemployer pension withdrawal liability (in millions):
| Balance at year-end 2013 |
$ | 310.8 | ||
| Accrued interest |
13.7 | |||
| Adjustment for changes in interest rates |
121.1 | |||
| Adjustments to loss estimates based on demand letters |
38.3 | |||
| Installment payments |
(9.5 | ) | ||
|
|
|
|||
| Balance at year-end 2014 |
$ | 474.4 | ||
|
|
|
Accrued interest expense and adjustments to the estimated liability are recorded in discontinued operations. The $455.0 million long-term portion of the estimated liability is included in Accrued Claims and Other Liabilities, and the $19.4 million current portion is included in Other Accrued Liabilities in the condensed consolidated balance sheet.
Pending review of the demand letters received, receipt of a final demand letter, or any negotiated lump sum settlements, the final amount of the withdrawal liability may be greater than or less than the amount recorded, and this difference could be significant. The Company currently estimates the range of potential withdrawal liability to be between $475 million and $607 million.
All information related to multiemployer pension expense or multiemployer post-retirement benefit obligations herein exclude Canada and Dominick’s for all purposes unless otherwise stated.
Safeway’s participation in these plans for the annual period ended January 3, 2015 is outlined in the following tables. All information in the tables is as of January 3, 2015, December 28, 2013 and December 29, 2012 in the columns labeled 2014, 2013 and 2012, respectively, unless otherwise stated. The “EIN-PN” column provides the Employer Identification Number (“EIN”) and the Plan Number (“PN”), if applicable. Unless otherwise noted, the most recent Pension Protection Act (“PPA”) zone status available in 2014 and 2013 is for the plan’s year ending at December 31, 2014, and December 31, 2013, respectively. The zone status is based on information that Safeway received from the plan. Among other factors, generally, plans in critical status (“red zone”) are less than 65 percent funded, plans in endangered or seriously endangered status (“yellow zone” or “orange zone”, respectively) are less than 80 percent funded, and plans at least 80 percent funded are said to be in the “green zone.” The “FIP/RP status pending/implemented” column indicates plans for which a funding improvement plan (“FIP”) or a rehabilitation plan (“RP”) is either pending or has been implemented by the trustees of each plan. Information related to the impact of utilization of extended amortization periods on zone status is either not available or not obtainable without undue cost and effort.
Other than the sale of Safeway’s Canadian operations and Dominick’s, there have been no significant changes that affect the comparability of 2014, 2013, and 2012 contributions.
| F-137 | (Continued) |
Table of Contents
SAFEWAY INC. AND SUBSIDIARIES
Notes to Consolidated Financial Statements
The following two tables contain information about Safeway’s U.S. multiemployer pension plans.
| EIN—PN | Pension Protection Act zone status |
Safeway 5% of total plan contributions |
FIP/RP status pending/ implemented | |||||||||
| Pension fund |
2014 | 2013 | 2013 | 2012 | ||||||||
| UFCW-Northern California Employers Joint Pension Trust Fund |
946313554—001 | Red | Red | Yes | Yes | Implemented | ||||||
| Western Conference of Teamsters Pension Plan |
916145047—001 | Green | Green | No | No | No | ||||||
| Southern California United Food & Commercial Workers Unions and Food Employers Joint Pension Plan |
951939092—001 | Red 3/31/2015 |
Red 3/31/2014 |
Yes 3/31/2014 |
Yes 3/31/2013 |
Implemented | ||||||
| Food Employers Labor Relations Association and United Food and Commercial Workers Pension Fund |
526128473—001 | Red | Red | Yes | Yes | Implemented | ||||||
| Sound Retirement Trust (formerly Retail Clerks Pension Trust)(3) |
916069306—001 | Red 9/30/2014 |
Red 9/30/2013 |
Yes 9/30/2013 |
Yes 9/30/2012 |
Implemented | ||||||
| Bakery and Confectionery Union and Industry International Pension Fund |
526118572—001 | Red | Red | Yes | Yes | Implemented | ||||||
| Rocky Mountain UFCW Unions & Employers Pension Plan |
846045986—001 | Green | Green | Yes | Yes | No | ||||||
| Desert States Employers & UFCW Unions Pension Plan |
846277982—001 | Green | Green | Yes | Yes | No | ||||||
| Mid-Atlantic UFCW and Participating Employers Pension Fund(4) |
461000515—001 | NA | NA | Yes | NA | NA | ||||||
| Denver Area Meat Cutters and Employers Pension Plan |
846097461—001 | Green | Green | Yes | Yes | No | ||||||
| Oregon Retail Employees Pension Trust |
936074377—001 | Green | Red | Yes | Yes | No | ||||||
| Alaska United Food and Commercial Workers Pension Trust |
916123694—001 | Red | Red | Yes | Yes | Implemented | ||||||
| Safeway Multiple Employer Retirement Plan(5) |
943019135—005 | 80%+ | 80%+ | No 12/30/2013 |
No 12/30/2012 |
NA | ||||||
| Retail Food Employers and UFCW Local 711 Pension Trust Fund |
516031512—001 | Red | Red | Yes | Yes | Implemented | ||||||
| Central Pension Fund of the International Union of Operating Engineers and Participating Employers |
366052390—001 | Green 1/31/2015 |
Green 1/31/2014 |
No 1/31/2014 |
No 1/31/2013 |
No | ||||||
| Alaska Teamster-Employer Pension Plan |
926003463—024 | Red 6/30/2015 |
Red 6/30/2014 |
No 6/30/2013 |
No 6/30/2012 |
Implemented | ||||||
| F-138 | (Continued) |
Table of Contents
SAFEWAY INC. AND SUBSIDIARIES
Notes to Consolidated Financial Statements
| Contributions of Safeway (in millions) |
Surcharge imposed(1) |
Expiration date of collective bargaining agreements |
Total collective bargaining agreements |
Most significant collective bargaining agreement(s) | ||||||||||||||||||||
| Pension fund |
2014 | 2013 | 2012 | Count | Expiration | % head- count(2) | ||||||||||||||||||
| UFCW-Northern California Employers Joint Pension Trust Fund |
$ | 83.3 | $ | 77.4 | $ | 72.9 | No | 8/3/2013 to 7/23/2016 |
20 | 14 | 10/11/2014 | 93% | ||||||||||||
| Western Conference of Teamsters Pension Plan |
$ | 47.0 | $ | 45.7 | $ | 43.9 | No | 9/20/2014 to 10/6/2018 |
45 | 1 | 10/1/2016 | 28% | ||||||||||||
| Southern California United Food & Commercial Workers Unions and Food Employers Joint Pension Plan |
$ | 46.7 | $ | 42.1 | $ | 39.3 | No | 3/6/2016 to 5/8/2016 |
14 | 12 | 3/6/2016 | 99% | ||||||||||||
| Food Employers Labor Relations Association and United Food and Commercial Workers Pension Fund |
$ | 18.9 | $ | 19.5 | $ | 23.5 | No | 10/29/2016 to 2/25/2017 |
7 | 4 | 10/29/2016 | 97% | ||||||||||||
| Sound Retirement Trust (formerly Retail Clerks Pension Trust)(3) |
$ | 16.6 | $ | 15.4 | $ | 14.2 | No | 1/10/2015 to 9/20/2017 |
51 | 3 | 5/7/2016 | 50% | ||||||||||||
| Bakery and Confectionery Union and Industry International Pension Fund |
$ | 14.2 | $ | 13.3 | $ | 12.4 | Yes | 11/7/2011 to 9/17/2017 |
39 | 5 | 4/8/2017 | 38% | ||||||||||||
| Rocky Mountain UFCW Unions & Employers Pension Plan |
$ | 10.9 | $ | 11.4 | $ | 11.3 | No | 9/12/2015 to 8/27/2016 |
44 | 8 | 9/12/2015 | 53% | ||||||||||||
| Desert States Employers & UFCW Unions Pension Plan |
$ | 9.1 | $ | 9.5 | $ | 10.5 | No | 10/29/2016 to 11/3/2018 |
4 | 2 | 10/29/2016 | 97% | ||||||||||||
| Mid-Atlantic UFCW and Participating Employers Pension Fund(4) |
$ | 4.9 | $ | 5.0 | NA | NA | 10/29/2016 to 2/25/2017 |
7 | 4 | 10/29/2016 | 97% | |||||||||||||
| Denver Area Meat Cutters and Employers Pension Plan |
$ | 4.7 | $ | 5.0 | $ | 5.0 | No | 9/12/2015 to 7/23/2016 |
42 | 8 | 9/12/2015 | 52% | ||||||||||||
| Oregon Retail Employees Pension Trust |
$ | 4.7 | $ | 4.5 | $ | 4.2 | No | 7/25/2015 to 1/21/2017 |
34 | 4 | 7/25/2015 | 42% | ||||||||||||
| Alaska United Food and Commercial Workers Pension Trust |
$ | 2.1 | $ | 2.0 | $ | 1.9 | No | 5/31/2015 to 2/11/2017 |
10 | 1 | 5/31/2015 | 48% | ||||||||||||
| F-139 | (Continued) |
Table of Contents
SAFEWAY INC. AND SUBSIDIARIES
Notes to Consolidated Financial Statements
| Contributions of Safeway (in millions) |
Surcharge imposed(1) |
Expiration date of collective bargaining agreements |
Total collective bargaining agreements |
Most significant collective bargaining agreement(s) | ||||||||||||||||||||
| Pension fund |
2014 | 2013 | 2012 | Count | Expiration | % head- count(2) | ||||||||||||||||||
| Safeway Multiple Employer Retirement Plan(5) |
$ | 1.8 | $ | 1.9 | $ | 2.4 | NA | NA | NA | NA | NA | NA | ||||||||||||
| Retail Food Employers and UFCW Local 711 Pension Trust Fund |
$ | 1.7 | $ | 1.6 | $ | 1.5 | No | 5/19/2013 to 3/1/2015 |
3 | 2 | 3/1/2015 | 98% | ||||||||||||
| Central Pension Fund of the International Union of Operating Engineers and Participating Employers |
$ | 1.5 | $ | 1.5 | $ | 1.5 | No | 6/4/2016 to 6/15/2019 |
6 | 2 | 4/15/2018 | 45% | ||||||||||||
| Alaska Teamster-Employer Pension Plan |
$ | 1.0 | $ | 1.0 | $ | 1.0 | No | 3/10/2018 to 10/6/2018 |
3 | 2 | 3/10/2018 | 85% | ||||||||||||
| Other funds |
$ | 8.0 | $ | 2.4 | $ | 3.2 | ||||||||||||||||||
|
|
|
|
|
|
|
|||||||||||||||||||
| Total Safeway contributions to U.S. multiemployer pension plans |
$ | 277.1 | $ | 259.2 | $ | 248.7 | ||||||||||||||||||
|
|
|
|
|
|
|
|||||||||||||||||||
NA = not applicable.
| (1) | PPA surcharges are 5% or 10% of eligible contributions and may not apply to all collective bargaining agreements or total contributions made to each plan. |
| (2) | Employees on which Safeway may contribute under these most significant collective bargaining agreements as a percent of all employees on which Safeway may contribute to the respective fund. |
| (3) | Sound Retirement Trust information includes former Washington Meat Industry Pension Trust due to merger into Sound Retirement Trust effective June 30, 2014. |
| (4) | The Mid-Atlantic UFCW & Participating Employers Pension Fund is a multiemployer plan effective January 1, 2013 which provides future service benefits to participants who would have otherwise earned future service under the Food Employers Labor Relations Association and United Food and Commercial Workers Pension Fund. The plan is not expected to be subject to zone status certification or notice or establishment of a funding improvement plan or a rehabilitation plan as per section 432(a) of the Internal Revenue Code since those provisions are required for multiemployer plans in effect on July 16, 2006. |
| (5) | The Safeway Multiple Employer Retirement Plan (“SMERP”) is a multiple employer plan as defined in the Internal Revenue Code. However, the SMERP is characterized as a multiemployer plan by the FASB, even though it is not maintained pursuant to any collective bargaining agreements to which Safeway is party. The plan may be subject to statutory annual minimum contributions based on complex actuarial calculations. Additionally, it has no PPA zone status and is not subject to establishment of a funding improvement plan or a rehabilitation plan or other PPA provisions that apply to multiemployer plans. |
| F-140 | (Continued) |
Table of Contents
SAFEWAY INC. AND SUBSIDIARIES
Notes to Consolidated Financial Statements
At the date the financial statements were issued, Forms 5500 were generally not available for the plan years ending in 2014. Additionally, for the plan year ending March 31, 2012, Safeway contributed more than 5% of the total contributions to the Southern California United Food and Commercial Workers Union and Food Employers Joint Pension Plan.
Multiemployer post-retirement benefit plans other than pensions Safeway contributes to a number of multiemployer post-retirement benefit plans other than pensions under the terms of its collective bargaining agreements that cover union-represented employees. These plans may provide medical, pharmacy, dental, vision, mental health and other ancillary benefits to active employees and retirees as determined by the trustees of each plan. These benefits are not vested. A significant portion of Safeway contributions benefit active employees and, as such, may not constitute contributions to a post-retirement benefit plan. Safeway is unable to separate all contribution amounts paid to benefit active participants in order to separately report contributions paid to provide post-retirement benefits for retirees.
It is estimated that Safeway may have contributed as much as $312.4 million in 2014, $302.0 million in 2013 and as much as $473.3 million in 2012 to fund health and welfare plans for multiemployer post-retirement plans other than pension. Actual funding of post-retirement benefit plans other than pensions is likely much lower as this amount continues to include contributions which benefit active employees.
Note P: Investment in Unconsolidated Affiliates
At year-end 2014, 2013 and 2012, Safeway’s investment in unconsolidated affiliates includes a 49% ownership interest in Casa Ley, which operated 206 food and general merchandise stores in Western Mexico at year-end 2014. See Note V.
Equity in earnings from Safeway’s unconsolidated affiliates, which is included in other income, was income of $16.2 million in 2014, $17.6 million in 2013 and $17.5 million in 2012.
Note Q: Commitments and Contingencies
Legal Matters Certain holders of Safeway common stock have sought appraisal rights under Section 262 of the Delaware General Corporation Law, requesting a determination that the per share merger consideration payable in the Merger does not represent fair value for their shares. On February 19, 2015, a petition for appraisal was filed in Delaware Chancery Court entitled Third Motion Equities Master Fund Ltd v. Safeway Inc., by a stockholder claiming to hold 563,000 shares. On February 25, 2015, a petition for appraisal was filed in Delaware Chancery Court entitled Merion Capital LP and Merion Capital II LP v. Safeway Inc., by stockholders claiming to hold approximately 10.5 million shares. The deadline for filing petitions has not yet expired. If these plaintiffs are successful in any appraisal proceeding, they could be entitled to more for their stock than the per share merger consideration payable in the Merger.
On August 18, 2001, a group of truck drivers from the Company’s Tracy, CA distribution center filed an action in California Superior Court, San Joaquin County entitled Cicairos, et al. v. Summit Logistics, alleging that Summit Logistics, the entity with whom Safeway contracted to operate the distribution center until August 2003, failed to provide meal periods, rest periods and itemized wage statements to the drivers in violation of California state law. Under its contract with Summit, Safeway is obligated to defend and indemnify Summit Logistics in this lawsuit. On February 6, 2007, another
| F-141 | (Continued) |
Table of Contents
SAFEWAY INC. AND SUBSIDIARIES
Notes to Consolidated Financial Statements
group of truck drivers from the Tracy distribution center filed a similar action in the same court, entitled Bluford, et al. v. Safeway Inc., alleging essentially the same claims against the Company. Both cases were subsequently certified as class actions. After lengthy litigation in the trial and appellate courts. On February 20, 2015, the parties signed a preliminary agreement of settlement that calls for the Company to pay approximately $31 million in total. This amount consists of a settlement fund of $30.2 million, out of which will be paid relief to the class, and attorneys’ fees and costs as awarded by the court. In addition to this settlement fund, the Company will pay interest of $10,000 if the distribution to the class is made in August 2015, with additional monthly amounts of interest if later. The Company will also pay third party settlement administrator costs, and its employer share of FICA/Medicare taxes. The Company anticipates that a motion for preliminary court approval of the settlement will be heard in the Spring of 2015. If such preliminary approval is granted, class members will be notified and given the opportunity to file objections to the settlement. Following that, a motion for final approval of the settlement would be filed in mid-2015.
As previously reported, in the second quarter of 2014, the Company received two subpoenas from the Drug Enforcement Administration (“DEA”) concerning the Company’s record keeping, reporting and related practices associated with the loss or theft of controlled substances. The Company continues to cooperate with the DEA on this matter.
As previously reported, in February 2012, Safeway was served with a subpoena issued by a group of California District Attorneys seeking documents and information related to the handling, disposal and reverse logistics of potential hazardous waste within the State. The subject matter of the subpoena relates to the handling and transportation of unsaleable household items, including, but not limited to, cleaners, aerosols, hair shampoos, dye, lotions, light bulbs, batteries, over-the-counter and similar items. On January 2, 2015, the Company settled an action with the State of California, including various California counties, on this matter by agreeing to pay civil penalties and costs and to fund specified Supplemental Environmental Projects in the amount of $9.9 million. As part of the settlement, the Company also agreed to certain ongoing compliance activities with respect to both potential hazardous waste and private health information.
The Company is subject from time to time to various claims and lawsuits arising in the ordinary course of business, including lawsuits involving trade practices, lawsuits alleging violations of state and/or federal wage and hour laws (including alleged violations of meal and rest period laws and alleged misclassification issues), real estate disputes and other matters. Some of these suits purport or may be determined to be class actions and/or seek substantial damages.
It is management’s opinion that although the amount of liability with respect to all of the above matters cannot be ascertained at this time, any resulting liability, including any punitive damages, will not have a material adverse effect on the Company’s business or financial condition.
Commitments The Company has commitments under contracts for the purchase of property and equipment and for the construction of buildings, the purchase of energy and other purchase obligations. Portions of such contracts not completed at year end are not reflected in the consolidated financial statements. These purchase commitments were $257.8 million at year-end 2014.
Note R: Segments
Safeway’s retail business operates in the United States. Safeway is organized into seven geographic retail operating segments (Denver, Eastern, Northern California, Phoenix, Northwest, Texas and Southern California). Across all seven retail operating segments, the Company operates
| F-142 | (Continued) |
Table of Contents
SAFEWAY INC. AND SUBSIDIARIES
Notes to Consolidated Financial Statements
primarily one store format, where each store offers the same general mix of products with similar pricing to similar categories of customers. Safeway does not operate supercenters, warehouse formats, combination clothing/grocery stores or discount stores.
The seven operating segments have been aggregated into one reportable segment called Safeway, because, in the Company’s judgment, the operating segments have similar historical economic characteristics and are expected to have similar economic characteristics and similar long-term financial performance in the future. The principal measures and factors the Company considered in determining whether the economic characteristics are similar are gross margin percentage, operating profit margin, sales growth, capital expenditures, competitive risks, operational risks and challenges, retail store sales, costs of goods sold and employees. In addition, each operating segment has similar products, similar production processes, similar types of customers, similar methods of distribution and a similar regulatory environment. The Company believes that disaggregating its operating segments would not provide material or meaningful additional information.
The following table presents sales revenue by type of similar product (dollars in millions):
| 2014 | 2013 | 2012 | ||||||||||||||||||||||
| Amount | % of total | Amount | % of total | Amount | % of total | |||||||||||||||||||
| Non-perishables(1) |
$ | 15,266.7 | 42.0 | % | $ | 14,811.7 | 42.2 | % | $ | 14,738.0 | 41.9 | % | ||||||||||||
| Perishables(2) |
13,656.5 | 37.6 | % | 12,809.8 | 36.6 | % | 12,548.1 | 35.7 | % | |||||||||||||||
| Fuel |
3,962.2 | 10.9 | % | 4,168.4 | 11.9 | % | 4,594.2 | 13.1 | % | |||||||||||||||
| Pharmacy |
2,805.1 | 7.7 | % | 2,674.9 | 7.6 | % | 2,755.4 | 7.8 | % | |||||||||||||||
| Other(3) |
639.7 | 1.8 | % | 600.1 | 1.7 | % | 525.8 | 1.5 | % | |||||||||||||||
|
|
|
|
|
|
|
|
|
|
|
|
|
|||||||||||||
| Total sales and other revenue |
$ | 36,330.2 | 100.0 | % | $ | 35,064.9 | 100.0 | % | $ | 35,161.5 | 100.0 | % | ||||||||||||
|
|
|
|
|
|
|
|
|
|
|
|
|
|||||||||||||
| (1) | Consists primarily of grocery, soft drinks and other beverages, general merchandise, meal ingredients, frozen foods and snacks. |
| (2) | Consists primarily of produce, meat, dairy, bakery, deli, floral and seafood. |
| (3) | Consists primarily of wholesale sales, commissions on gift cards and other revenue. |
As a result of the Blackhawk IPO and until Safeway distributed all of the Class B common stock of Blackhawk that it owned to Safeway stockholders, the Company presented Blackhawk as a separate reportable segment.
| F-143 | (Continued) |
Table of Contents
SAFEWAY INC. AND SUBSIDIARIES
Notes to Consolidated Financial Statements
The following table presents certain balance sheet information about the Company (in millions):
| Long-lived Assets, Net |
Total Assets | |||||||
| 2014 |
||||||||
| Safeway U.S. |
$ | 6,776.5 | $ | 13,371.4 | ||||
| Dominick’s assets held for sale |
— | 5.6 | ||||||
|
|
|
|
|
|||||
| Total |
$ | 6,776.5 | $ | 13,377.0 | ||||
|
|
|
|
|
|||||
| 2013 |
||||||||
| Safeway U.S. |
$ | 7,457.8 | $ | 15,129.9 | ||||
| Blackhawk |
79.7 | 1,952.9 | ||||||
| Dominick’s assets held for sale |
— | 136.7 | ||||||
|
|
|
|
|
|||||
| Total |
$ | 7,537.5 | $ | 17,219.5 | ||||
|
|
|
|
|
|||||
| 2012 |
||||||||
| Safeway U.S. |
$ | 7,991.1 | $ | 11,007.6 | ||||
| Blackhawk |
67.0 | 1,528.1 | ||||||
| Canada |
1,166.5 | 2,121.3 | ||||||
|
|
|
|
|
|||||
| Total |
$ | 9,224.6 | $ | 14,657.0 | ||||
|
|
|
|
|
|||||
Note S: Income Per Share
The Company computes earnings per share under the two-class method, which is a method of computing earnings per share when an entity has both common stock and participating securities. Unvested restricted stock is considered a participating security because it contains rights to receive nonforfeitable dividends at the same rate as common stock. Under the two-class method, the calculation of basic and diluted earnings per common share excludes the income attributable to participating securities. Additionally, the weighted average shares outstanding exclude the impact of participating securities.
The following table provides reconciliations of net earnings and shares used in calculating income per basic common share to those used in calculating income per diluted common share.
| (In millions, except per-share amounts) |
2014 | 2013 | 2012 | |||||||||||||||||||||
| Diluted | Basic | Diluted | Basic | Diluted | Basic | |||||||||||||||||||
| Income from continuing operations, net of tax |
$ | 103.2 | $ | 103.2 | $ | 217.1 | $ | 217.1 | $ | 249.2 | $ | 249.2 | ||||||||||||
| Distributed and undistributed earnings allocated to participating securities |
(2.8 | ) | (2.8 | ) | (2.1 | ) | (2.1 | ) | (2.3 | ) | (2.3 | ) | ||||||||||||
|
|
|
|
|
|
|
|
|
|
|
|
|
|||||||||||||
| Income from continuing operations available to common stockholders |
100.4 | 100.4 | 215.0 | 215.0 | 246.9 | 246.9 | ||||||||||||||||||
| Income from discontinued operations, net of tax |
9.3 | 9.3 | 3,305.1 | 3,305.1 | 348.9 | 348.9 | ||||||||||||||||||
| Noncontrolling interests—discontinued operations |
0.9 | 0.9 | (14.7 | ) | (14.7 | ) | (1.6 | ) | (1.6 | ) | ||||||||||||||
|
|
|
|
|
|
|
|
|
|
|
|
|
|||||||||||||
| F-144 | (Continued) |
Table of Contents
SAFEWAY INC. AND SUBSIDIARIES
Notes to Consolidated Financial Statements
| (In millions, except per-share amounts) |
2014 | 2013 | 2012 | |||||||||||||||||||||
| Diluted | Basic | Diluted | Basic | Diluted | Basic | |||||||||||||||||||
| Income from discontinued operations attributable to Safeway Inc. |
10.2 | 10.2 | 3,290.4 | 3,290.4 | 347.3 | 347.3 | ||||||||||||||||||
| Distributed and undistributed earnings allocated to participating securities |
(0.3 | ) | (0.3 | ) | (32.1 | ) | (32.1 | ) | (3.1 | ) | (3.1 | ) | ||||||||||||
|
|
|
|
|
|
|
|
|
|
|
|
|
|||||||||||||
| Income from discontinued operations available to common stockholders |
9.9 | 9.9 | 3,258.3 | 3,258.3 | 344.2 | 344.2 | ||||||||||||||||||
|
|
|
|
|
|
|
|
|
|
|
|
|
|||||||||||||
| Net income |
$ | 113.4 | $ | 113.4 | $ | 3,507.5 | $ | 3,507.5 | $ | 596.5 | $ | 596.5 | ||||||||||||
| Distributed and undistributed earnings allocated to participating securities |
(3.1 | ) | (3.1 | ) | (34.2 | ) | (34.2 | ) | (5.4 | ) | (5.4 | ) | ||||||||||||
|
|
|
|
|
|
|
|
|
|
|
|
|
|||||||||||||
| Net income available to common stockholders after earnings allocated to participating securities |
$ | 110.3 | $ | 110.3 | $ | 3,473.3 | $ | 3,473.3 | $ | 591.1 | $ | 591.1 | ||||||||||||
|
|
|
|
|
|
|
|
|
|
|
|
|
|||||||||||||
| Weighted-average common shares outstanding |
228.8 | 228.8 | 239.1 | 239.1 | 245.6 | 245.6 | ||||||||||||||||||
|
|
|
|
|
|
|
|||||||||||||||||||
| Common share equivalents |
1.9 | 2.4 | 0.3 | |||||||||||||||||||||
|
|
|
|
|
|
|
|||||||||||||||||||
| Weighted-average shares outstanding |
230.7 | 241.5 | 245.9 | |||||||||||||||||||||
|
|
|
|
|
|
|
|||||||||||||||||||
| Earnings (loss) per common share: |
||||||||||||||||||||||||
| Continuing operations |
$ | 0.44 | $ | 0.44 | $ | 0.89 | $ | 0.90 | $ | 1.00 | $ | 1.01 | ||||||||||||
| Discontinued operations |
$ | 0.04 | $ | 0.04 | $ | 13.49 | $ | 13.63 | $ | 1.40 | $ | 1.40 | ||||||||||||
|
|
|
|
|
|
|
|
|
|
|
|
|
|||||||||||||
| Total |
$ | 0.48 | $ | 0.48 | $ | 14.38 | $ | 14.53 | $ | 2.40 | $ | 2.41 | ||||||||||||
|
|
|
|
|
|
|
|
|
|
|
|
|
|||||||||||||
Anti-dilutive shares totaling 0.3 million in 2014, 7.8 million in 2013 and 21.6 million in 2012 have been excluded from diluted weighted-average shares outstanding.
Additionally, performance shares totaling 1.9 million for which the Company did not forecast achievement of target have been excluded from diluted weighted average shares for 2014.
Note T: Guarantees
Safeway applies the accounting guidance for guarantees to the Company’s agreements that contain guarantee and indemnification clauses. This guidance requires that, upon issuance of a guarantee, the guarantor must disclose and recognize a liability for the fair value of the obligation it assumes under the guarantee. As of January 3, 2015, Safeway did not have any material guarantees. However, the Company is party to a variety of contractual agreements under which Safeway may be obligated to indemnify the other party for certain matters. These contracts primarily relate to Safeway’s commercial contracts, operating leases, including those that have been assigned, and other real estate contracts, trademarks, intellectual property, financial agreements and various other agreements. Under these agreements, the Company may provide certain routine indemnifications relating to representations and warranties (for example, ownership of assets, environmental or tax indemnifications) or personal injury matters. The terms of these indemnifications range in duration and may not be explicitly defined. Historically, Safeway has not made significant payments for these indemnifications.
| F-145 | (Continued) |
Table of Contents
SAFEWAY INC. AND SUBSIDIARIES
Notes to Consolidated Financial Statements
Additionally, the Company is party to a variety of lease agreements related to the disposition of Genuardi’s, the Company’s Canadian operations and Dominick’s in 2012, 2013 and 2014 for which the Company is now secondarily liable. While the Company may be liable for future payment upon default of these leases, there has been no event that would indicate the Company is liable for future payment , and therefore the Company has not recorded a liability related to these leases at this time.
The Company believes that if it were to incur a loss in any of these matters, the loss would not have a material effect on the Company’s financial condition or results of operations.
Note U: Other Comprehensive Income or Loss
Total comprehensive earnings are defined as all changes in stockholders’ equity during a period, other than those resulting from investments by and distributions to stockholders. Generally, for Safeway, total comprehensive earnings equal net earnings plus or minus adjustments for pension and other post-retirement liabilities and foreign currency translation adjustments. Total comprehensive earnings represent the activity for a period net of tax and were a loss of $152.8 million in 2014, income of $179.7 million in 2013 and a loss of $12.3 million in 2012.
While total comprehensive earnings are the activity in a period and are largely driven by net earnings in that period, accumulated other comprehensive income or loss (“AOCI”) represents the cumulative balance of other comprehensive income, net of tax, as of the balance sheet date. For Safeway, AOCI is primarily the cumulative balance related to pension and other post-retirement benefit adjustments and foreign currency translation adjustments. Changes in the AOCI balance by component are shown below (in millions):
| 2014 | ||||||||||||||||
| Pension and Post- Retirement Benefit Plan Items |
Foreign Currency Items |
Other | Total Comprehensive (Loss) Income Including Noncontrolling Interests |
|||||||||||||
| Beginning balance |
$ | (130.7 | ) | $ | (138.8 | ) | $ | (1.6 | ) | $ | (271.1 | ) | ||||
|
|
|
|
|
|
|
|
|
|||||||||
| Other comprehensive income (loss) before reclassifications |
(303.5 | ) | 0.2 | 0.4 | (302.9 | ) | ||||||||||
| Amounts reclassified from accumulated other comprehensive income |
52.3 | — | 52.3 | |||||||||||||
| Tax benefit (expense) |
98.0 | — | (0.2 | ) | 97.8 | |||||||||||
|
|
|
|
|
|
|
|
|
|||||||||
| Net current-period other comprehensive income (loss) |
(153.2 | ) | 0.2 | 0.2 | (152.8 | ) | ||||||||||
|
|
|
|
|
|
|
|
|
|||||||||
| Distribution of Blackhawk |
— | 2.2 | — | 2.2 | ||||||||||||
|
|
|
|
|
|
|
|
|
|||||||||
| Ending balance |
$ | (283.9 | ) | $ | (136.4 | ) | $ | (1.4 | ) | $ | (421.7 | ) | ||||
|
|
|
|
|
|
|
|
|
|||||||||
| F-146 | (Continued) |
Table of Contents
SAFEWAY INC. AND SUBSIDIARIES
Notes to Consolidated Financial Statements
| 2013 | ||||||||||||||||
| Pension and Post- Retirement Benefit Plan Items |
Foreign Currency Items |
Other | Total Comprehensive (Loss) Income Including Noncontrolling Interests |
|||||||||||||
| Beginning balance |
$ | (472.3 | ) | $ | 399.0 | $ | (0.5 | ) | $ | (73.8 | ) | |||||
|
|
|
|
|
|
|
|
|
|||||||||
| Other comprehensive income (loss) before reclassifications |
266.6 | (65.0 | ) | (1.7 | ) | 199.9 | ||||||||||
| Amounts reclassified from accumulated other comprehensive income |
105.0 | — | — | 105.0 | ||||||||||||
| Tax benefit (expense) |
(125.8 | ) | — | 0.6 | (125.2 | ) | ||||||||||
|
|
|
|
|
|
|
|
|
|||||||||
| Net current-period other comprehensive income (loss) |
245.8 | (65.0 | ) | (1.1 | ) | 179.7 | ||||||||||
|
|
|
|
|
|
|
|
|
|||||||||
| Sale of CSL |
95.8 | (472.8 | ) | — | (377.0 | ) | ||||||||||
|
|
|
|
|
|
|
|
|
|||||||||
| Ending balance |
$ | (130.7 | ) | $ | (138.8 | ) | $ | (1.6 | ) | $ | (271.1 | ) | ||||
|
|
|
|
|
|
|
|
|
|||||||||
| 2012 | ||||||||||||||||
| Pension and Post- Retirement Benefit Plan Items |
Foreign Currency Items |
Other | Total Comprehensive (Loss) Income Including Noncontrolling Interests |
|||||||||||||
| Beginning balance |
$ | (462.1 | ) | $ | 402.1 | $ | (1.5 | ) | $ | (61.5 | ) | |||||
|
|
|
|
|
|
|
|
|
|||||||||
| Other comprehensive (loss) income before reclassifications |
(125.2 | ) | (3.1 | ) | 1.5 | (126.8 | ) | |||||||||
| Amounts reclassified from accumulated other comprehensive income |
110.0 | — | — | 110.0 | ||||||||||||
| Tax benefit (expense) |
5.0 | — | (0.5 | ) | 4.5 | |||||||||||
|
|
|
|
|
|
|
|
|
|||||||||
| Net current-period other comprehensive (loss) income |
(10.2 | ) | (3.1 | ) | 1.0 | (12.3 | ) | |||||||||
|
|
|
|
|
|
|
|
|
|||||||||
| Ending balance |
$ | (472.3 | ) | $ | 399.0 | $ | (0.5 | ) | $ | (73.8 | ) | |||||
|
|
|
|
|
|
|
|
|
|||||||||
Note V: Subsequent Event
Merger Closing Pursuant to the Merger Agreement, on January 30, 2015, Merger Sub merged with and into Safeway with Safeway surviving the Merger as a wholly owned subsidiary of Albertsons Holdings. Further, each share of common stock of Safeway issued and outstanding immediately prior to the effective time of the Merger was cancelled and converted automatically into the right to receive the following (together, the “Per Share Merger Consideration”):
| i. | $34.92 in cash (the “Per Share Cash Merger Consideration”) which consists of $32.50 in initial cash consideration, $2.412 in consideration relating to the sale of PDC and $0.008 in cash consideration relating to a dividend that Safeway received in December 2014 on its 49% interest in Casa Ley, |
| ii. | one contingent value right (“CVR”) relating to Safeway’s interest in Casa Ley, and |
| iii. | one contingent value right relating to any deferred consideration relating to the sale of the PDC assets. |
| F-147 | (Continued) |
Table of Contents
SAFEWAY INC. AND SUBSIDIARIES
Notes to Consolidated Financial Statements
In connection with the closing of the Merger and immediately prior to the effective time of the Merger, each outstanding, unexpired and unexercised option to purchase shares of Safeway common stock (each, a “Safeway Option”), that was granted under any equity incentive plan of Safeway, including the 1999 Amended and Restated Equity Participation Plan, the 2007 Equity and Incentive Award Plan and the 2011 Equity and Incentive Award Plan or any other plan, agreement or arrangement (collectively, the “Safeway Equity Incentive Plans”), whether or not then exercisable or vested, was accelerated, vested and cancelled and converted into the right to receive an amount in cash (subject to any applicable withholding taxes) equal to the product of (A) the total number of shares of Safeway common stock subject to such Safeway Option as of immediately prior to the effective time of the Merger and (B) the excess, if any, of the Per Share Cash Merger Consideration over the exercise price per share (the “Option Price”) of such Safeway Option (the “Option Payment”). In addition, each such Safeway Option that had an Option Price less than the Per Share Cash Merger Consideration received one Casa Ley CVR and one PDC CVR in respect of each share of Safeway common stock subject to such cancelled Safeway Option.
Immediately prior to the effective time of the Merger, each restricted share of Safeway common stock that was outstanding and that was granted pursuant to any Safeway Equity Incentive Plan, whether or not then exercisable or vested, automatically vested and all restrictions thereon lapsed, and all such restricted shares were cancelled and converted into the right to receive the Per Share Merger Consideration.
Immediately prior to the effective time of the Merger, each outstanding performance share award covering shares of Safeway common stock (each a “Performance Share Award”) that was granted under any Safeway Equity Incentive Plan vested at the target levels specified for each such award and was cancelled in exchange for (i) an amount in cash (subject to any applicable withholding taxes) equal to the product of (A) the number of vested shares of Safeway common stock subject to such Performance Share Award (after taking into account any vesting as a result of the Merger) and (B) the Per Share Cash Merger Consideration and (ii) one Casa Ley CVR and one PDC CVR in respect of each vested share of Safeway common stock subject to such Performance Share Award.
Immediately prior to the effective time of the Merger, each outstanding restricted stock unit covering shares of Safeway common stock (each a “Restricted Stock Unit”), that was granted under any Safeway Equity Incentive Plan, whether or not then vested, was accelerated, vested and cancelled in exchange for the right to receive (i) an amount in cash (subject to any applicable withholding taxes) equal to the product of (A) the number of vested shares of Safeway common stock subject to such Restricted Stock Unit and (B) the Per Share Cash Merger Consideration and (ii) one Casa Ley CVR and one PDC CVR in respect of each vested share of Safeway common stock subject to such Restricted Stock Unit.
On January 30, 2015, Safeway entered into a contingent value rights agreement with respect to the Casa Ley CVRs with AB Acquisition, the Shareholder Representative (as defined in the agreement), Computershare Inc. and Computershare Trust Company, N.A., as rights agent (the “Casa Ley CVR Agreement”) providing for the terms of the Casa Ley CVRs. Pursuant to the Casa Ley CVR Agreement, a Casa Ley CVR will entitle the holder to a pro rata share of the net proceeds from the sale of Safeway’s interest in Casa Ley. In the event that Safeway’s interest in Casa Ley is not sold prior to January 30, 2018, holders of the Casa Ley CVRs will be entitled to receive their pro rata portion of the fair market value of such remaining interest minus certain fees, expenses and assumed taxes (based on a 39.25% rate) that would have been deducted from the proceeds of a sale of the Casa Ley interest.
| F-148 | (Continued) |
Table of Contents
SAFEWAY INC. AND SUBSIDIARIES
Notes to Consolidated Financial Statements
On January 30, 2015, Safeway entered into a contingent value rights agreement with respect to the PDC CVRs with AB Acquisition, the Shareholder Representative (as defined in the agreement), Computershare Inc. and Computershare Trust Company, N.A., as rights agent (the “PDC CVR Agreement”) providing for the terms of the PDC CVRs. Pursuant to the PDC CVR Agreement, a PDC CVR will entitle the holder to a pro rata share of the net proceeds from any deferred consideration relating to the sale of the assets of PDC.
Sale of Eastern Division As contemplated by the Merger Agreement, immediately after the closing of the Merger, Safeway completed the sale of its Eastern division business (“EDS”) to New Albertson’s, Inc., an Ohio corporation and indirect subsidiary of Safeway’s ultimate parent company AB Acquisition (“New Albertsons”). In a two-step sale process, Safeway contributed certain EDS assets and liabilities to a newly formed subsidiary and sold the interests in the subsidiary to New Albertsons. New Albertsons acquired the new EDS subsidiary for a purchase price of approximately $659 million, subject to customary adjustments. Safeway also agreed to provide certain intercompany services and licenses to the new EDS subsidiary after the sale.
Effect of Merger on Debt
Change of Control Tender Offer In December 2014, Safeway commenced a change of control tender offer to purchase any and all of the outstanding series of the $500 million of 5.00% Senior Notes due August 15, 2019, the $500 million of 3.95% Senior Notes due August 15, 2020 and the $400 million of 4.75% Senior Notes due December 1, 2021. This offer expired on January 30, 2015 and required Safeway to pay $1,010 per $1,000 principal amount of the senior notes, plus accrued and unpaid interest that were validly tendered. On February 2, 2015, a change of control payment of $873.2 million, based on a principal amount of $864.6 million of tendered notes and $14.2 million of accrued interest was paid.
Credit Agreement At the closing of the Merger, Safeway’s credit agreement, as discussed under the caption “Bank Credit Agreement” in Note G, was terminated.
New Bonds In connection with the Merger, Safeway is an obligor and its domestic subsidiaries are guarantors of $609.7 million in principal amount of 7.750% senior secured notes due 2022 (the “2022 Notes”), after repayment of some of the 2022 Notes on February 9, 2015. As a result of the issuance of these notes and pursuant to Safeway’s existing indenture, our Senior Notes due 2016, Senior Notes due 2017 and Senior Notes due 2019 were guaranteed by Albertson’s Holdings LLC and its domestic subsidiaries, including Safeway’s domestic subsidiaries, and are ratably and equally secured by the assets, subject to certain limited exceptions, of Albertson’s Holdings LLC and its subsidiaries that are co-issuers or guarantors of the 2022 Notes, including Safeway and its subsidiaries. Our Senior Notes due 2020, Senior Notes due 2021, Senior Notes due 2027 and Senior Notes due 2031 are equally and ratably secured by the assets (other than accounts receivable, merchandise inventory, equipment or intellectual property) of Safeway and its domestic subsidiaries, but are not guaranteed by Albertson’s Holdings LLC or any of its subsidiaries, including the Safeway subsidiaries.
ABL Agreement On March 21, 2013, our parent company, Albertson’s Holdings LLC, entered into an asset-based revolving credit agreement among Albertson’s Holdings LLC, Albertson’s LLC, the guarantors from time to time party thereto, the lenders from time to time party thereto and Bank of America N.A., as administrative and collateral agent. This agreement was amended on January 30, 2015 (as amended, the “ABL Agreement”) in connection with the Merger, whereby Albertson’s LLC, Safeway and certain of their affiliates became the borrowers thereunder (the “ABL Borrowers”).
| F-149 | (Continued) |
Table of Contents
SAFEWAY INC. AND SUBSIDIARIES
Notes to Consolidated Financial Statements
The ABL Agreement provides for a $3 billion revolving credit facility (with subfacilities for letters of credit and swingline loans) (the “New ABL Facility”). On January 30, 2015, $980 million of the New ABL Facility was used to repay all debt outstanding under Albertson’s LLC’s existing credit facility, to pay a portion of the Merger consideration and fees and expenses, and to provide working capital to the borrowers. After January 30, 2015, the New ABL Facility may be utilized to fund working capital and general corporate purposes, including permitted acquisitions and other investments.
The New ABL Facility matures on the earlier to occur of (a) January 30, 2020 and (b) the date that is 91 days prior to the final maturity of certain material indebtedness (if such other indebtedness has not been repaid or extended prior to such 91st day).
Note W: Quarterly Information (Unaudited)
The summarized quarterly financial data presented below reflects all adjustments, which in the opinion of management, are of a normal and recurring nature necessary to present fairly the results of operations for the periods presented. (Rounding affects some totals. In millions, except per-share amounts.)
| 53 Weeks | Last 17 Weeks |
Third 12 Weeks(1) |
Second 12 Weeks |
First 12 Weeks |
||||||||||||||||
| 2014 |
||||||||||||||||||||
| Sales and other revenue |
$ | 36,330.2 | $ | 11,677.4 | $ | 8,307.9 | $ | 8,307.2 | $ | 8,037.7 | ||||||||||
| Gross profit |
9,682.0 | 3,258.6 | 2,174.6 | 2,139.5 | 2,109.3 | |||||||||||||||
| Operating profit |
534.5 | 258.3 | 94.2 | 121.5 | 60.5 | |||||||||||||||
| Income (loss) before income taxes(2),(3) |
165.0 | 201.5 | (32.3 | ) | 125.9 | (130.1 | ) | |||||||||||||
| Income (loss) from continuing operations, net of tax |
103.2 | 127.5 | (21.2 | ) | 80.6 | (83.7 | ) | |||||||||||||
| Income (loss) from discontinued operations, net of tax(4) |
9.3 | (21.5 | ) | 30.7 | 15.0 | (14.9 | ) | |||||||||||||
| Net income (loss) attributable to Safeway Inc. |
113.4 | 106.0 | 9.5 | 95.6 | (97.6 | ) | ||||||||||||||
| Basic earnings (loss) per common share: |
||||||||||||||||||||
| Continuing operations |
$ | 0.44 | $ | 0.55 | $ | (0.09 | ) | $ | 0.35 | $ | (0.37 | ) | ||||||||
| Discontinued operations(4) |
0.04 | (0.09 | ) | 0.13 | 0.06 | (0.06 | ) | |||||||||||||
| Total |
0.48 | 0.46 | 0.04 | 0.41 | (0.43 | ) | ||||||||||||||
| Diluted earnings (loss) per common share: |
||||||||||||||||||||
| Continuing operations |
$ | 0.44 | $ | 0.55 | $ | (0.09 | ) | $ | 0.34 | $ | (0.37 | ) | ||||||||
| Discontinued operations(4) |
0.04 | (0.10 | ) | 0.13 | 0.07 | (0.06 | ) | |||||||||||||
| Total |
0.48 | 0.45 | 0.04 | 0.41 | (0.43 | ) | ||||||||||||||
| (1) | Includes loss on extinguishment of debt of $84.4 million. |
| (2) | Includes loss (gain) on foreign currency translation of $19.6 million in the last 17 weeks, $3.8 million in the third 12 weeks, $(45.3) million in the second 12 weeks and $153.1 million in the first 12 weeks. |
| (3) | Includes Merger- and integration-related expenses of $29.7 million in the last 17 weeks, $11.2 million in the third 12 weeks, $3.9 million in the second 12 weeks and $6.3 million in the first 12 weeks. |
| (4) | See Note B Discontinued Operations. |
| F-150 | (Continued) |
Table of Contents
SAFEWAY INC. AND SUBSIDIARIES
Notes to Consolidated Financial Statements
| 52 Weeks | Last 16 Weeks(2) |
Third 12 Weeks |
Second 12 Weeks |
First 12 Weeks |
||||||||||||||||
| 2013 |
||||||||||||||||||||
| Sales and other revenue |
$ | 35,064.9 | $ | 10,814.7 | $ | 8,099.2 | $ | 8,149.8 | $ | 8,001.2 | ||||||||||
| Gross profit |
9,231.5 | 2,865.7 | 2,094.7 | 2,145.8 | 2,125.3 | |||||||||||||||
| Operating profit |
551.5 | 209.9 | 87.9 | 139.4 | 114.2 | |||||||||||||||
| Income before income taxes |
251.6 | 73.6 | 29.8 | 92.0 | 56.2 | |||||||||||||||
| Income from continuing operations, net of tax |
217.1 | 71.6 | 23.4 | 62.5 | 59.6 | |||||||||||||||
| Income (loss) from discontinued operations, net of tax(1) |
3,305.1 | 3,256.5 | 43.0 | (53.7 | ) | 59.2 | ||||||||||||||
| Net income attributable to Safeway Inc. |
3,507.5 | 3,314.3 | 65.8 | 8.4 | 118.9 | |||||||||||||||
| Basic earnings (loss) per common share: |
||||||||||||||||||||
| Continuing operations |
$ | 0.90 | $ | 0.29 | $ | 0.10 | $ | 0.26 | $ | 0.25 | ||||||||||
| Discontinued operations(1) |
13.63 | 13.36 | 0.17 | (0.23 | ) | 0.25 | ||||||||||||||
| Total |
14.53 | 13.65 | 0.27 | 0.03 | 0.50 | |||||||||||||||
| Diluted earnings (loss) per common share: |
||||||||||||||||||||
| Continuing operations |
$ | 0.89 | $ | 0.29 | $ | 0.10 | $ | 0.26 | $ | 0.25 | ||||||||||
| Discontinued operations(1) |
13.49 | 13.17 | 0.17 | (0.23 | ) | 0.24 | ||||||||||||||
| Total |
14.38 | 13.46 | 0.27 | 0.03 | 0.49 | |||||||||||||||
| (1) | See Note B, Discontinued Operations. |
| (2) | In the fourth quarter of 2013, the Company recorded a loss on foreign currency translation of $57.4 million and an impairment of notes receivable of $30.0 million. |
| F-151 | (Continued) |
Table of Contents
The Board of Directors
New Albertson’s, Inc.:
We have audited the accompanying combined financial statements of the New Albertson’s Business of SUPERVALU INC. and subsidiaries, which comprise the combined balance sheets as of February 21, 2013 and February 23, 2012, and the related combined statements of operations and comprehensive income (loss), parent company deficit, and cash flows for each of the fiscal years in the three-year period ended February 21, 2013, and the related notes to the combined financial statements.
Management’s Responsibility for the Financial Statements
Management is responsible for the preparation and fair presentation of these combined financial statements in accordance with U.S. generally accepted accounting principles; this includes the design, implementation, and maintenance of internal control relevant to the preparation and fair presentation of combined financial statements that are free from material misstatement, whether due to fraud or error.
Auditors’ Responsibility
Our responsibility is to express an opinion on these combined financial statements based on our audits. We conducted our audits in accordance with auditing standards generally accepted in the United States of America and in accordance with the auditing standards of the Public Company Accounting Oversight Board (United States). Those standards require that we plan and perform the audit to obtain reasonable assurance about whether the combined financial statements are free from material misstatement.
An audit involves performing procedures to obtain audit evidence about the amounts and disclosures in the combined financial statements. The procedures selected depend on the auditors’ judgment, including the assessment of the risks of material misstatement of the combined financial statements, whether due to fraud or error. In making those risk assessments, the auditor considers internal control relevant to the entity’s preparation and fair presentation of the combined financial statements in order to design audit procedures that are appropriate in the circumstances, but not for the purpose of expressing an opinion on the effectiveness of the entity’s internal control. Accordingly, we express no such opinion. An audit also includes evaluating the appropriateness of accounting policies used and the reasonableness of significant accounting estimates made by management, as well as evaluating the overall presentation of the combined financial statements.
We believe that the audit evidence we have obtained is sufficient and appropriate to provide a basis for our audit opinion.
Opinion
In our opinion, the combined financial statements referred to above present fairly, in all material respects, the financial position of the New Albertson’s Business of SUPERVALU INC. and subsidiaries as of February 21, 2013 and February 23, 2012, and the results of their operations and their cash flows for each of the fiscal years in the three-year period ended February 21, 2013 in accordance with U.S. generally accepted accounting principles.
/s/ KPMG LLP
Boise, Idaho
February 7, 2014
F-152
Table of Contents
NEW ALBERTSON’S BUSINESS OF SUPERVALU INC.
AND SUBSIDIARIES
Combined Balance Sheets
(In millions)
| February 21, 2013 |
February 23, 2012 |
|||||||
| Assets | ||||||||
| Current assets: |
||||||||
| Cash |
$ | 34 | 34 | |||||
| Receivables, net |
248 | 267 | ||||||
| Inventories, net |
1,167 | 1,255 | ||||||
| Other current assets |
53 | 55 | ||||||
|
|
|
|
|
|||||
| Total current assets |
1,502 | 1,611 | ||||||
| Property, plant and equipment, net |
3,891 | 4,268 | ||||||
| Intangible assets, net |
550 | 757 | ||||||
| Deferred tax assets |
90 | 50 | ||||||
| Other assets |
276 | 266 | ||||||
|
|
|
|
|
|||||
| Total assets |
$ | 6,309 | 6,952 | |||||
|
|
|
|
|
|||||
| Liabilities and Parent Company Deficit | ||||||||
| Current Liabilities: |
||||||||
| Accounts payable |
$ | 678 | 803 | |||||
| Accrued vacation, compensation and benefits |
257 | 305 | ||||||
| Current maturities of long-term debt and capital lease obligations |
211 | 322 | ||||||
| Current portion of self-insurance liability |
213 | 242 | ||||||
| Deferred tax liabilities |
184 | 182 | ||||||
| Other current liabilities |
229 | 246 | ||||||
|
|
|
|
|
|||||
| Total current liabilities |
1,772 | 2,100 | ||||||
|
|
|
|
|
|||||
| Long-term debt and capital lease obligations |
4,841 | 5,076 | ||||||
| Pension and other obligations |
112 | 104 | ||||||
| Long-term tax liabilities |
147 | 132 | ||||||
| Long-term self-insurance liability |
686 | 755 | ||||||
| Other long-term liabilities |
288 | 295 | ||||||
| Commitments and contingencies |
||||||||
| Parent company deficit: |
||||||||
| Parent company net investment |
(1,474 | ) | (1,445 | ) | ||||
| Accumulated other comprehensive loss |
(63 | ) | (65 | ) | ||||
|
|
|
|
|
|||||
| Total parent company deficit |
(1,537 | ) | (1,510 | ) | ||||
|
|
|
|
|
|||||
| Total liabilities and parent company deficit |
$ | 6,309 | 6,952 | |||||
|
|
|
|
|
|||||
See accompanying notes to combined financial statements.
F-153
Table of Contents
NEW ALBERTSON’S BUSINESS OF SUPERVALU INC.
AND SUBSIDIARIES
Combined Statements of Operations and Comprehensive Income (Loss)
(In millions)
| February 21, 2013 |
February 23, 2012 |
February 24, 2011 |
||||||||||
| Net sales |
$ | 17,229 | 18,762 | 19,833 | ||||||||
| Cost of sales |
12,136 | 13,243 | 14,010 | |||||||||
|
|
|
|
|
|
|
|||||||
| Gross profit |
5,093 | 5,519 | 5,823 | |||||||||
| Selling and administrative expenses |
5,021 | 5,187 | 5,459 | |||||||||
| Goodwill and intangible asset impairment charges |
170 | 1,000 | 1,668 | |||||||||
|
|
|
|
|
|
|
|||||||
| Operating loss |
(98 | ) | (668 | ) | (1,304 | ) | ||||||
|
|
|
|
|
|
|
|||||||
| Interest: |
||||||||||||
| Interest expense |
455 | 431 | 466 | |||||||||
| Interest income |
(2 | ) | (1 | ) | (2 | ) | ||||||
|
|
|
|
|
|
|
|||||||
| Interest expense, net |
453 | 430 | 464 | |||||||||
|
|
|
|
|
|
|
|||||||
| Loss from operations before income taxes |
(551 | ) | (1,098 | ) | (1,768 | ) | ||||||
| Income tax (benefit) provision |
(16 | ) | (108 | ) | 291 | |||||||
|
|
|
|
|
|
|
|||||||
| Net loss |
(535 | ) | (990 | ) | (2,059 | ) | ||||||
|
|
|
|
|
|
|
|||||||
| Other comprehensive income (loss): |
||||||||||||
| Recognition of pension income (loss), net of tax of $1, tax of $0, and tax of $2, respectively |
2 | (43 | ) | 2 | ||||||||
|
|
|
|
|
|
|
|||||||
| Comprehensive loss |
$ | (533 | ) | (1,033 | ) | (2,057 | ) | |||||
|
|
|
|
|
|
|
|||||||
See accompanying notes to combined financial statements.
F-154
Table of Contents
NEW ALBERTSON’S BUSINESS OF SUPERVALU INC.
AND SUBSIDIARIES
Combined Statements of Parent Company Deficit
(In millions)
| Parent company net investment |
Accumulated other comprehensive earnings (loss) |
Total parent company deficit |
||||||||||
| Balance, February 25, 2010 |
$ | 802 | (24 | ) | 778 | |||||||
| Net loss |
(2,059 | ) | — | (2,059 | ) | |||||||
| Change in parent company net investment |
521 | — | 521 | |||||||||
| Other comprehensive earnings, net of tax of $2 |
— | 2 | 2 | |||||||||
|
|
|
|
|
|
|
|||||||
| Balance, February 24, 2011 |
(736 | ) | (22 | ) | (758 | ) | ||||||
| Net loss |
(990 | ) | — | (990 | ) | |||||||
| Change in parent company net investment |
281 | — | 281 | |||||||||
| Other comprehensive loss, net of tax of $0 |
— | (43 | ) | (43 | ) | |||||||
|
|
|
|
|
|
|
|||||||
| Balance, February 23, 2012 |
(1,445 | ) | (65 | ) | (1,510 | ) | ||||||
| Net loss |
(535 | ) | — | (535 | ) | |||||||
| Change in parent company net investment |
506 | — | 506 | |||||||||
| Other comprehensive earnings, net of tax of $1 |
— | 2 | 2 | |||||||||
|
|
|
|
|
|
|
|||||||
| Balance, February 21, 2013 |
$ | (1,474 | ) | (63 | ) | (1,537 | ) | |||||
|
|
|
|
|
|
|
|||||||
See accompanying notes to combined financial statements.
F-155
Table of Contents
NEW ALBERTSON’S BUSINESS OF SUPERVALU INC.
AND SUBSIDIARIES
Combined Statements of Cash Flows
(In millions)
| February 21, 2013 |
February 23, 2012 |
February 24, 2011 |
||||||||||
| Cash flows from operating activities: |
||||||||||||
| Net loss |
$ | (535 | ) | (990 | ) | (2,059 | ) | |||||
| Adjustments to reconcile net loss to net cash provided by operating activities |
||||||||||||
| Goodwill and intangible asset impairment charges |
170 | 1,000 | 1,668 | |||||||||
| Property, plant and equipment impairment charges |
58 | 9 | 26 | |||||||||
| Net gain on sale of assets and closed properties reserve |
(23 | ) | (1 | ) | (24 | ) | ||||||
| Depreciation and amortization |
524 | 533 | 551 | |||||||||
| LIFO charge |
17 | 43 | 13 | |||||||||
| Deferred income taxes |
(38 | ) | (152 | ) | 252 | |||||||
| Net pension cost |
19 | 14 | 11 | |||||||||
| Contributions to pension plan |
(8 | ) | (10 | ) | (18 | ) | ||||||
| Self-insurance expense |
57 | 60 | 112 | |||||||||
| Self-insurance claim payments |
(155 | ) | (147 | ) | (186 | ) | ||||||
| Amortization of debt premium/discount |
12 | 10 | 8 | |||||||||
| Write offs and amortization of deferred financing fees |
31 | 12 | 12 | |||||||||
| (Gain) loss on debt extinguishment |
— | (11 | ) | 7 | ||||||||
| Other adjustments |
7 | 29 | (22 | ) | ||||||||
| Changes in assets and liabilities: |
||||||||||||
| Receivables |
8 | (3 | ) | 60 | ||||||||
| Inventories |
70 | 49 | 49 | |||||||||
| Accounts payable and accrued liabilities |
(135 | ) | (58 | ) | (108 | ) | ||||||
| Income tax liabilities |
15 | (18 | ) | 34 | ||||||||
| Other changes in operating assets and liabilities |
— | (12 | ) | 51 | ||||||||
|
|
|
|
|
|
|
|||||||
| Net cash provided by operating activities |
94 | 357 | 437 | |||||||||
|
|
|
|
|
|
|
|||||||
| Cash flows from investing activities: |
||||||||||||
| Proceeds from sale of assets |
66 | 114 | 71 | |||||||||
| Purchases of property, plant and equipment |
(235 | ) | (310 | ) | (253 | ) | ||||||
| Other |
(7 | ) | (11 | ) | (21 | ) | ||||||
|
|
|
|
|
|
|
|||||||
| Net cash used in investing activities |
(176 | ) | (207 | ) | (203 | ) | ||||||
|
|
|
|
|
|
|
|||||||
| Cash flows from financing activities: |
||||||||||||
| Proceeds from issuance of long-term debt |
6,241 | 4,452 | 2,949 | |||||||||
| Payments of long-term debt |
(6,566 | ) | (4,842 | ) | (3,648 | ) | ||||||
| Payments of capital lease obligations |
(40 | ) | (36 | ) | (35 | ) | ||||||
| Payments for debt financing costs |
(59 | ) | (7 | ) | (22 | ) | ||||||
| Change in parent company net investment |
506 | 281 | 521 | |||||||||
|
|
|
|
|
|
|
|||||||
| Net cash provided by (used in) financing activities |
82 | (152 | ) | (235 | ) | |||||||
|
|
|
|
|
|
|
|||||||
| Net decrease in cash |
— | (2 | ) | (1 | ) | |||||||
| Cash at beginning of year |
34 | 36 | 37 | |||||||||
|
|
|
|
|
|
|
|||||||
| Cash at end of year |
$ | 34 | 34 | 36 | ||||||||
|
|
|
|
|
|
|
|||||||
| Supplemental cash flow information: |
||||||||||||
| Noncash investing and financing activities were as follows: |
||||||||||||
| Capital lease asset additions and related obligations |
$ | 24 | 40 | 7 | ||||||||
| Purchases of property, plant and equipment included in accounts payable |
9 | 46 | 29 | |||||||||
| Interest paid (net of amount capitalized) |
409 | 401 | 430 | |||||||||
See accompanying notes to combined financial statements.
F-156
Table of Contents
NEW ALBERTSON’S BUSINESS OF SUPERVALU INC.
AND SUBSIDIARIES
Notes to Combined Financial Statements
February 21, 2013 and February 23, 2012
(Dollars in millions)
(1) Description of Business and Basis of Presentation
(a) Business Description
The New Albertson’s Business (NAI or the Business) is not a stand-alone legal entity, however it is a combination of supermarket businesses operating under the banners Jewel-Osco, Shaw’s, Star Market, Acme and Albertsons and their associated in-store pharmacies and dedicated distribution centers, which were part of the retail segment of SUPERVALU INC. (Parent or SUPERVALU) through March 21, 2013. These supermarket stores offer a wide variety of nationally advertised brand name and private-label products, primarily including grocery (both perishable and nonperishable), general merchandise and health and beauty care, as well as pharmacy and fuel.
On March 21, 2013, Parent sold NAI to AB Acquisition LLC (NAI Banner Sale). Immediately after AB Acquisition LLC’s purchase of NAI, NAI sold its Albertsons banner operations, Albertsons dedicated distribution centers and certain other assets (Albertsons Business) to Albertson’s LLC, a wholly owned subsidiary of AB Acquisition LLC (Albertsons Banner Sale). Subsequent to the Albertsons Banner Sale, the Albertsons Business and the remaining supermarket operations within the New Albertson’s Business remain under the common control of AB Acquisition LLC.
(b) Basis of Presentation
These combined financial statements represent the financial position, result of operations and comprehensive income (loss), changes in Parent company deficit, and cash flows of the Business, and were derived by extracting the assets, liabilities, revenues and expenses directly attributable to the Business from the historical accounting records of the Parent, based on accounting policies historically used by Parent. The combined financial statements have been prepared in accordance with SEC Financial Reporting Manual Section 2065, Acquisition of Selected Parts of an Entity May Result in Less Than Full Financial Statements, and Staff Accounting Bulletin (SAB) Topic 1.B., Allocation of Expenses and Related Disclosure in Financial Statements of Subsidiaries, Divisions or Lesser Business Components of Another Entity.
Financial statement items related specifically to the Business have been identified and included in the combined financial statements. These include balance sheet items, revenue, direct costs, labor and benefits, facilities and maintenance, consulting and outside services, and general and administrative costs.
Certain support functions are provided on a centralized basis by Parent on behalf of all its subsidiaries, including the Business, such as distribution, finance, human resources, information technology, facilities, marketing and merchandising, and legal, among others. These expenses have been allocated to NAI on the basis of direct usage when identifiable, with the remainder allocated pro rata based on sales, headcount or other relevant measures of NAI and Parent. The service charges and corporate expense allocations have been determined on a basis that NAI considers to be a reasonable reflection of the utilization of the services provided or the benefit received by NAI during the periods presented. Management believes the assumptions underlying the combined financial statements, including the assumptions used in allocating general corporate expenses from Parent, are reasonable. The allocations may not, however, reflect the expense NAI would have incurred as an
| F-157 | (Continued) |
Table of Contents
NEW ALBERTSON’S BUSINESS OF SUPERVALU INC.
AND SUBSIDIARIES
Notes to Combined Financial Statements
February 21, 2013 and February 23, 2012
(Dollars in millions)
independent business for the periods presented. Actual costs that may have been incurred if NAI had been a stand-alone business would depend on a number of factors, including the actual organizational structure, whether functions were outsourced or performed by employees and strategic decisions made in areas such as procurement, vendor management and distribution. See further discussions in note 12—Related Parties and Allocations.
Certain property, plant, and equipment owned by the Business, including a shared distribution center and a shared service center, are included in these combined financial statements.
Cash was managed centrally by Parent and included daily sweeps of cash receipts to corporate SUPERVALU cash accounts and periodic funding by SUPERVALU of cash disbursements for capital expenditures and operating expenses of NAI. Accordingly, the cash managed by Parent at the corporate level was not allocated to NAI for any of the periods presented. The NAI financial statements reflect transfers of cash to and from Parent’s cash management system as a component of Parent company net investment. Cash in the Combined Balance Sheets as of February 21, 2013 and February 23, 2012 primarily consists of cash held at the retail stores (Store Cash).
Parent debt utilized to fund the original June 2006 Parent acquisition of NAI, and related debt acquisition costs and interest expense, has been allocated to NAI and is reflected in the Combined Statements of Operations and Comprehensive Income (Loss), Balance Sheets and Statements of Cash Flows.
NAI reports and manages its business under one reportable segment. All of NAI’s operations are domestic.
The financial statements have been prepared in accordance with accounting principles generally accepted in the United States (GAAP). All significant transactions and balances between operations within the Business have been eliminated.
(2) Summary of Significant Accounting Policies
(a) Fiscal Year
NAI’s fiscal year ends on the Thursday before the last Saturday in February. NAI’s first quarter consists of 16 weeks while the second, third, and fourth quarters each consist of 12 weeks. The last three fiscal years consist of the 52-week periods ended February 21, 2013 (fiscal 2012), February 23, 2012 (fiscal 2011), and February 24, 2011 (fiscal 2010). Unless the context otherwise indicates, reference to NAI’s fiscal year refers to the calendar year in which such fiscal year commences.
(b) Use of Estimates
The preparation of the Business’s combined financial statements in conformity with GAAP requires management to make estimates and assumptions that affect the reported amounts of assets and liabilities and disclosure of contingent assets and liabilities as of the date of the financial statements and the reported amounts of revenues and expenses for the reporting periods presented. Actual results could differ from those estimates.
| F-158 | (Continued) |
Table of Contents
NEW ALBERTSON’S BUSINESS OF SUPERVALU INC.
AND SUBSIDIARIES
Notes to Combined Financial Statements
February 21, 2013 and February 23, 2012
(Dollars in millions)
(c) Revenue Recognition
Revenues from product sales are recognized at the point of sale. Discounts and allowances provided to customers at the time of sale, including those provided in connection with loyalty cards, are recognized as a reduction in Net sales as the products are sold to customers. Sales tax is excluded from Net sales.
(d) Cost of Sales
Cost of sales includes the cost of inventory sold during the period, including purchasing, receiving, warehousing and distribution costs, associated depreciation expense, and shipping and handling fees.
Advertising expenses are a component of Cost of sales and are expensed as incurred. Advertising expenses were $144, $130 and $88 for fiscal 2012, 2011 and 2010, respectively.
NAI receives allowances and credits from vendors for volume incentives, promotional allowances and, to a lesser extent, new product introductions all of which are typically based on contractual arrangements covering a period of one year or less. NAI recognizes vendor funds for merchandising and buying activities as a reduction of Cost of sales when the related products are sold. Vendor funds that have been earned as a result of completing the required performance under the terms of the underlying agreements but for which the product has not yet been sold are recognized as reductions of inventory. The reduction of inventory for these vendor funds was $38 and $46 as of February 21, 2013 and February 23, 2012, respectively. When payments or rebates can be reasonably estimated and it is probable that the specified target will be met, the payment or rebate is accrued. However, when attaining the milestone is not considered probable, the payment or rebate is recognized only when and if the milestone is achieved. Any upfront payments received for multi-period contracts are generally deferred and amortized on a straight-line basis over the life of the contracts.
(e) Selling and Administrative Expenses
Selling and administrative expenses consist primarily of compensation and benefits of store and corporate employees, marketing and merchandising expense, rent, occupancy, depreciation, amortization and other operating and administrative costs.
(f) Cash
NAI participates in a centralized cash management and financing program established by the Parent.
(g) Allowances for Losses on Receivables
Management makes estimates of the uncollectibility of its accounts receivable. In determining the recorded allowances, management analyzes the value of the collateral, customer financial statements, historical collection experience, aging of receivables and other economic and industry factors. It is possible that the results of the estimation process could be materially impacted by different judgments,
| F-159 | (Continued) |
Table of Contents
NEW ALBERTSON’S BUSINESS OF SUPERVALU INC.
AND SUBSIDIARIES
Notes to Combined Financial Statements
February 21, 2013 and February 23, 2012
(Dollars in millions)
estimations, and assumptions made based on the information considered. The allowance for losses on receivables was $4 as of February 21, 2013 and February 23, 2012. Bad debt expense was $10, $12 and $11 in fiscal 2012, 2011 and 2010, respectively.
(h) Inventories, Net
Inventories are valued at the lower of cost or net realizable value. Substantially all of NAI’s inventory consists of finished goods.
NAI uses either replacement cost or weighted average cost to value discrete inventory items at lower of cost or market before application of any last-in, first-out (LIFO) reserve. As of February 21, 2013 and February 23, 2012, approximately $1,215, or 93%, and $1,289, or 94%, respectively, of NAI’s inventories were valued under the LIFO method.
As of February 21, 2013 and February 23, 2012, approximately 74% and 75%, respectively, of NAI’s inventories were valued under the replacement cost method, before application of any LIFO reserve. The weighted average cost valuation method was used to value approximately 19% of NAI’s inventories as of February 21, 2013 and February 23, 2012, before application of any LIFO reserve.
Under the replacement cost method, the most recent purchase cost is used to calculate the current cost of inventory before application of any LIFO reserve. The replacement cost approach results in inventories being valued at the lower of cost or market because of the high inventory turnover and the resulting low inventory days’ supply on hand combined with infrequent vendor price changes for these items of inventory.
NAI uses either replacement cost or weighted average cost to value certain discrete inventory items under the first-in, first-out method (FIFO). The replacement cost approach under the FIFO method is predominantly utilized in determining the value of high turnover perishable items, including Produce, Deli, Bakery, and Floral.
As of February 21, 2013 and February 23, 2012, approximately seven percent and six percent, respectively, of NAI’s inventories were valued using the replacement cost and weighted average cost methods under the FIFO method of inventory accounting. The replacement cost approach applied under the FIFO method results in inventories being valued at the lower of cost or market because of the very high inventory turnover and the resulting low inventory days’ supply for these items of inventory.
During fiscal 2012, 2011 and 2010, inventory quantities in certain LIFO layers were reduced. These reductions resulted in a liquidation of LIFO inventory quantities carried at lower costs prevailing in prior years as compared with the cost of fiscal 2012, 2011 and 2010 purchases. As a result, Cost of sales decreased by $13, $10 and $6 in fiscal 2012, 2011 and 2010, respectively. If the FIFO method had been used to determine the cost of inventories for which the LIFO method is used, NAI’s inventories would have been higher by approximately $138 and $121 as of February 21, 2013 and February 23, 2012, respectively.
| F-160 | (Continued) |
Table of Contents
NEW ALBERTSON’S BUSINESS OF SUPERVALU INC.
AND SUBSIDIARIES
Notes to Combined Financial Statements
February 21, 2013 and February 23, 2012
(Dollars in millions)
NAI evaluates inventory shortages throughout each fiscal year based on actual physical counts in its facilities. Allowances for inventory shortages are recorded based on the results of these counts to provide for estimated shortages as of the end of each fiscal year.
(i) Reserves for Closed Properties
NAI maintains reserves for costs associated with closures of retail stores, distribution centers and other properties that are no longer being utilized in current operations. NAI provides for closed property lease liabilities based on the present value of the remaining noncancelable lease payments after the closing date, reduced by estimated subtenant rentals that could be reasonably obtained for the property. The closed property lease liabilities usually are paid over the remaining lease terms, which generally range from one to 20 years. Adjustments to closed property reserves primarily relate to changes in expected subtenant income or actual exit costs differing from original estimates. Adjustments are made for changes in estimates in the period in which the changes become known.
(j) Property, Plant and Equipment, Net
Property, plant and equipment are carried at cost. Depreciation or amortization is calculated based on the estimated useful lives of the assets using the straight-line method. Estimated useful lives generally are 10 to 40 years for buildings and major improvements, three to ten years for equipment, and the shorter of the term of the lease or expected life for leasehold improvements and capitalized lease assets. Interest capitalized on property under construction was $1 annually during fiscal 2012, 2011, and 2010.
(k) Goodwill
Parent acquired NAI on June 2, 2006 (the Acquisition). Goodwill represents the excess of the cost of the acquisition over the fair value of the net identifiable assets of the acquired business at the date of the Acquisition. Goodwill was allocated in purchase accounting to NAI’s banner operations based upon the relative fair values as of the date of the Acquisition. NAI reviews goodwill for impairment during the fourth quarter of each year and also if events occur or circumstances change that would more-likely than-not reduce the fair value of the reporting unit below its carrying amount. The reviews consist of comparing estimated fair value to the carrying value at the reporting unit level. NAI’s reporting unit consists of all the banners of NAI and their dedicated distribution centers. During fiscal 2011 and 2010, NAI recorded noncash impairment charges of $697 and $1,411, respectively as a result of the annual goodwill impairment test. The impairment charges were due to the significant and sustained decline in Parent’s market capitalization and estimated discounted future cash flows. As of the end of fiscal 2011 there was no remaining goodwill.
Fair values are determined by using both the market approach, applying a multiple of earnings based on the guideline publicly traded business method, and the income approach, discounting projected future cash flows based on management’s expectations of the current and future operating environment. The rates used to discount projected future cash flows reflect a weighted average cost of capital based on NAI’s industry, capital structure and risk premiums including those reflected in the
| F-161 | (Continued) |
Table of Contents
NEW ALBERTSON’S BUSINESS OF SUPERVALU INC.
AND SUBSIDIARIES
Notes to Combined Financial Statements
February 21, 2013 and February 23, 2012
(Dollars in millions)
market capitalization of Parent. If management identifies the potential for impairment of goodwill, the implied fair value of goodwill is calculated as the difference between the fair value of the reporting unit and the fair value of the underlying assets and liabilities, excluding goodwill. An impairment charge is recorded for any excess of the carrying value over the implied fair value.
NAI reviews the composition of its reporting unit on an annual basis and on an interim basis if events or circumstances indicate that the composition of NAI’s reporting unit may have changed. There were no changes in NAI’s reporting unit as a result of the fiscal 2012, 2011, and 2010 reviews.
(l) Intangible Assets
Intangible assets are specific to NAI and were assigned at the time of the Acquisition. NAI reviews intangible assets with indefinite useful lives, which primarily consist of trade names, for impairment during the fourth quarter of each year, and also if events or changes in circumstances indicate that the asset may be impaired. The reviews consist of comparing estimated fair value to the carrying value. Fair values of NAI’s trade names are determined primarily by discounting an assumed royalty value applied to management’s estimate of projected future revenues associated with the trade names. The cash flows are discounted using rates based on the weighted average cost of capital discussed above and the specific risk profile of the trade names relative to NAI’s other assets. Refer to note 3—Goodwill and Intangible Assets for the results of the goodwill and indefinite useful lives testing performed during fiscal 2012, 2011 and 2010.
Intangible assets with finite lives primarily include favorable operating leases, prescription records and scripts, customer lists, and customer relationships. Intangible assets with a finite life are amortized on a straight-line basis over an estimated economic useful life which ranges from one to 31 years. Intangible assets with finite lives are tested for impairment whenever events or changes in circumstances indicate their carrying value may not be recoverable.
(m) Impairment of Long-Lived Assets
NAI monitors the recoverability of its long-lived assets, such as buildings and equipment, on an ongoing basis and tests the carrying amount of these assets whenever events or changes in circumstances indicate that their carrying amount may not be fully recoverable, including, for example, as a result of current period losses combined with a history of losses or a projection of continuing losses, a significant decrease in the market value of an asset or NAI’s plans for store closures. When such events or changes in circumstances occur, a recoverability test is performed by comparing projected undiscounted future cash flows to the carrying value of the asset or group of assets being tested.
If impairment is identified for long-lived assets to be held and used, the fair value is compared to the carrying value of the group of assets and an impairment charge is recorded for the excess of the carrying value over the fair value. For long-lived assets that are classified as assets held for sale, NAI recognizes impairment charges for the excess of the carrying value plus estimated costs of disposal over the estimated fair value. Fair value is based on current market values or discounted future cash flows that are estimated using Level 3 inputs. NAI estimates fair value based on NAI’s experience and
| F-162 | (Continued) |
Table of Contents
NEW ALBERTSON’S BUSINESS OF SUPERVALU INC.
AND SUBSIDIARIES
Notes to Combined Financial Statements
February 21, 2013 and February 23, 2012
(Dollars in millions)
knowledge of the market in which the property is located and, when necessary, utilizes local real estate brokers. NAI’s estimate of undiscounted cash flows attributable to the asset groups includes only future cash flows that are directly associated with and that are expected to arise as a direct result of the use and eventual disposition of the asset group. Long-lived asset impairment charges are a component of Selling and administrative expenses in the Combined Statements of Operations and Comprehensive Income (Loss).
NAI groups long-lived assets at the lowest level for which identifiable cash flows are largely independent of the cash flows of other assets, which historically has been at the geographic market level. During the second and third quarters of fiscal 2012, certain markets were disaggregated to the store level as economic factors indicated the geographic market level was no longer appropriate.
(n) Deferred Rent
NAI recognizes rent holidays, including the time period during which NAI has access to the property prior to the opening of the site, as well as construction allowances and escalating rent provisions, on a straight-line basis over the term of the operating lease. The deferred rents are included as a component of Other current liabilities and Other long-term liabilities in the Combined Balance Sheets.
(o) Self-Insurance Liabilities
NAI is primarily self-insured for workers’ compensation, automobile and general liability costs. It is NAI’s policy to record its self-insurance liabilities based on management’s estimate of the ultimate cost of reported claims and claims incurred but not yet reported and related expenses, discounted at a risk-free interest rate. The present value of such claims was calculated using discount rates ranging from 0.4% to 5.1% for fiscal 2012, 0.5% to 5.1% for fiscal 2011, and 0.6% to 5.1% for fiscal 2010.
Changes in NAI’s self-insurance liabilities consisted of the following:
| 2012 | 2011 | 2010 | ||||||||||
| Beginning balance |
$ | 997 | 1,084 | 1,158 | ||||||||
| Charge to expense |
57 | 60 | 112 | |||||||||
| Claim payments |
(155 | ) | (147 | ) | (186 | ) | ||||||
|
|
|
|
|
|
|
|||||||
| Ending balance |
899 | 997 | 1,084 | |||||||||
| Less current portion |
(213 | ) | (242 | ) | (281 | ) | ||||||
|
|
|
|
|
|
|
|||||||
| Long-term portion |
$ | 686 | 755 | 803 | ||||||||
|
|
|
|
|
|
|
|||||||
The self-insurance liabilities are net of discounts of $196 and $207 as of February 21, 2013 and February 23, 2012, respectively.
As of February 21, 2013 and February 23, 2012, NAI had reinsurance receivables of $36 and $40, respectively, recorded in Receivables, net, and $110 and $122, respectively, recorded in Other assets in the Combined Balance Sheets.
| F-163 | (Continued) |
Table of Contents
NEW ALBERTSON’S BUSINESS OF SUPERVALU INC.
AND SUBSIDIARIES
Notes to Combined Financial Statements
February 21, 2013 and February 23, 2012
(Dollars in millions)
(p) Benefit Plans
NAI recognizes the funded status of the specific defined benefit plan it sponsors in its Combined Balance Sheets and gains or losses and prior service costs or credits not yet recognized as a component of Other comprehensive income (loss), net of tax, in the Combined Statements of Operations and Comprehensive Income (Loss) and Combined Statements of Parent Company Deficit. The determination of NAI’s obligation and related expense for the NAI sponsored pension benefits is dependent, in part, on management’s selection of certain actuarial assumptions in calculating these amounts. These assumptions include, among other things, the discount rate and the expected long-term rate of return on plan assets. These assumptions are disclosed in note 10—Benefit Plans. Actual results that differ from the assumptions are accumulated and amortized over future periods in accordance with accounting standards.
The Parent sponsors other pension and postretirement plans in various forms covering substantially all employees, including NAI employees, who meet eligibility requirements.
NAI and Parent also contribute to various multiemployer pension plans under collective bargaining agreements, primarily defined benefit pension plans. Pension expense for these plans is recognized as contributions are funded. Refer to note 10—Benefit Plans for additional information on NAI’s participation in those multiemployer plans.
(q) Stock-Based Compensation
Parent maintains various stock option, restricted stock, and performance award plans for benefit of certain key salaried employees, including NAI’s employees. Parent accounts for stock-based compensation in accordance with the Financial Accounting Standards Board (FASB) guidance, which requires all share-based payments to employees to be recognized in the Combined Statements of Operations and Comprehensive Income (Loss) based upon their fair values.
Parent uses the straight-line method to recognize compensation expense based on the fair value on the date of grant, net of the estimated forfeitures, over the requisite period related to each award. The fair value of stock options is estimated as of the date of grant using the Black-Scholes option pricing model using Level 3 inputs. The estimation of the fair value of stock options incorporates certain assumptions, such as risk-free interest rate and expected volatility, dividend yield and life of options.
The fair value of performance awards granted under Parent’s long-term incentive program (LTIP), is estimated as of the date of the grant using the Monte Carlo option pricing model using Level 3 inputs. Certain performance awards contain a variable cash settlement feature that is measured at fair value on a recurring basis using Level 3 inputs as described in note 6—Fair Value Measurements. The estimation of the fair value of each performance award, including the cash settlement feature, incorporates certain assumptions such as risk-free interest rate and expected volatility, dividend yield, and life of the awards. The fair value of the cash settlement feature that is subject to fair value measurement on a recurring basis was insignificant as of February 21, 2013 and February 23, 2012.
Stock-based employee compensation expenses specifically charged to NAI for NAI employees and recognized as a component of Selling and administrative expense within the Combined Statements of Operations and Comprehensive Income (Loss) was $7 annually for fiscal year 2012, 2011 and 2010.
| F-164 | (Continued) |
Table of Contents
NEW ALBERTSON’S BUSINESS OF SUPERVALU INC.
AND SUBSIDIARIES
Notes to Combined Financial Statements
February 21, 2013 and February 23, 2012
(Dollars in millions)
(r) Income Taxes
NAI’s operations are subject to United States federal, state and local income taxes. NAI’s operations have historically been included in the Parent’s income tax returns. In preparing its combined financial statements, NAI has determined its tax provision on a separate return, stand-alone basis.
Because portions of NAI’s operations are included in the Parent’s tax returns, payments to certain tax authorities are made by Parent, and not by NAI. The resulting settlements are reflected as changes in Parent company net investment within the Combined Balance Sheets.
NAI accounts for income taxes in accordance with Accounting Standards Codification (ASC) 740, Income Taxes (ASC 740). ASC 740 requires an asset and liability approach for financial accounting and reporting for income taxes. Under the asset and liability approach, deferred taxes are provided for the net tax effects of temporary differences between the carrying amounts of assets and liabilities for financial reporting and income tax purposes.
Valuation allowances are established where management determines that it is more likely than not that some portion or all of a deferred tax asset will not be realized. Forecasted earnings, future taxable income and future prudent and feasible tax planning strategies are considered in determining the need for a valuation allowance. In the event NAI was not able to realize all or part of its net deferred tax assets in the future, the valuation allowance would be increased. Likewise, if it was determined that NAI was more-likely than-not to realize the net deferred tax assets, the applicable portion of the valuation allowance would reverse.
Deferred income taxes represent future net tax effects of temporary differences between the financial statement and tax basis of assets and liabilities and are measured using enacted tax rates in effect for the year in which the differences are expected to be settled or realized. In addition to differences between the financial statement and tax basis of recorded assets or liabilities, NAI has also recorded certain deferred tax assets not associated with recorded financial statement assets or liabilities, such as tax credit or tax loss carry-forwards. Refer to note 9—Income Taxes for the types of differences that give rise to significant portions of deferred income tax assets and liabilities. Deferred income tax assets are reported as a current or noncurrent asset or liability based on the classification of the related asset or liability or the expected date of reversal.
NAI, through its Parent, is currently in various stages of audits, appeals or other methods of review with authorities from various taxing jurisdictions. NAI establishes liabilities for unrecognized tax benefits in a variety of taxing jurisdictions when, despite management’s belief that NAI’s tax return positions are supportable, certain positions may be challenged and may need to be revised. NAI adjusts these liabilities in light of changing facts and circumstances, such as the progress of a tax audit. NAI also provides interest on these liabilities at the appropriate statutory interest rate. NAI recognizes interest related to unrecognized tax benefits in interest expense and penalties in Selling and administrative expenses in the Combined Statements of Operations and Comprehensive Income (Loss).
| F-165 | (Continued) |
Table of Contents
NEW ALBERTSON’S BUSINESS OF SUPERVALU INC.
AND SUBSIDIARIES
Notes to Combined Financial Statements
February 21, 2013 and February 23, 2012
(Dollars in millions)
(s) Parent Company Deficit
Parent company net investment represents Parent’s net investment in NAI, and reflects the cumulative effects of intercompany transactions between NAI and Parent, Parent contributions to NAI, distributions from NAI to Parent and accumulated net earnings (loss) after taxes of NAI, and is a component of Parent company deficit within the Combined Balance Sheets. Accumulated other comprehensive income (loss) is shown separately within Parent company deficit.
(t) Recently Adopted Accounting Standards
In June 2011, the FASB issued authoritative guidance through Accounting Standard Update (ASU) 2011-05, which amended certain rules regarding the presentation of comprehensive earnings (loss). This amendment requires that all nonowner changes in equity be presented either in a single continuous statement of comprehensive income or in two separate but consecutive statements. ASU 2011-05 became effective for NAI in fiscal 2012. In December 2011, the FASB deferred the provisions dealing with reclassification adjustments beyond ASU 2011-05’s effective date. NAI adopted this amended standard in fiscal 2012 by presenting Combined Statements of Operations and Comprehensive Income (Loss). This standard did not have a material effect on NAI’s Combined Financial Statements, as the standard only affected the presentation of comprehensive earnings (loss).
(u) Recently Issued Accounting Standards
In February 2013, the FASB issued authoritative guidance through ASU 2013-02 surrounding the presentation of items reclassified from Accumulated other comprehensive earnings (loss) to net income. This guidance requires entities to disclose, either in the notes to the financial statements or parenthetically on the face of the statement that reports comprehensive earnings (loss), items reclassified out of Accumulated other comprehensive earnings (loss) and into net earnings in their entirety and the effect of the reclassification on each affected Statement of Operations line item. In addition, for Accumulated other comprehensive earnings (loss) reclassification items that are not reclassified in their entirety into net earnings, a cross reference to other required accounting standard disclosures is required. This guidance is effective for NAI in fiscal 2013. NAI believes that the adoption of this guidance will not have a material impact on its financial condition or results of operations.
(3) Goodwill and Intangible Assets
Changes in the carrying value of NAI’s Goodwill and Intangible assets consisted of the following:
| February 24, 2011 |
Dispositions | Impairments | February 23, 2012 |
|||||||||||||
| Goodwill |
$ | 5,318 | (14 | ) | — | 5,304 | ||||||||||
| Accumulated impairment losses |
(4,607 | ) | — | (697 | ) | (5,304 | ) | |||||||||
|
|
|
|
|
|
|
|
|
|||||||||
| Total goodwill |
$ | 711 | (14 | ) | (697 | ) | — | |||||||||
|
|
|
|
|
|
|
|
|
|||||||||
| F-166 | (Continued) |
Table of Contents
NEW ALBERTSON’S BUSINESS OF SUPERVALU INC.
AND SUBSIDIARIES
Notes to Combined Financial Statements
February 21, 2013 and February 23, 2012
(Dollars in millions)
| February 24, 2011 |
Additions | Impairments | Other net adjustments |
February 23, 2012 |
Additions | Impairments | Other net adjustments |
February 21, 2013 |
||||||||||||||||||||||||||||
| Trade names—indefinite useful lives |
$ | 758 | — | (303 | ) | — | 455 | — | (158 | ) | (2 | ) | 295 | |||||||||||||||||||||||
| Favorable operating leases, prescription records and scripts, customer lists, customer relationships, and other (accumulated amortization of $297 and $327 as of February 23, 2012 and February 21, 2013, respectively) |
595 | 7 | — | (5 | ) | 597 | 1 | (12 | ) | (9 | ) | 577 | ||||||||||||||||||||||||
| Noncompete agreements (accumulated amortization of $3 and $2 as of February 23, 2012 and February 21, 2013, respectively) |
5 | 1 | — | (1 | ) | 5 | — | — | 2 | 7 | ||||||||||||||||||||||||||
|
|
|
|
|
|
|
|
|
|
|
|
|
|
|
|
|
|
|
|||||||||||||||||||
| Total intangible assets |
1,358 | 8 | (303 | ) | (6 | ) | 1,057 | 1 | (170 | ) | (9 | ) | 879 | |||||||||||||||||||||||
| Accumulated amortization |
(254 | ) | (47 | ) | — | 1 | (300 | ) | (40 | ) | — | 11 | (329 | ) | ||||||||||||||||||||||
|
|
|
|
|
|
|
|
|
|
|
|
|
|
|
|
|
|
|
|||||||||||||||||||
| Total intangible assets, net |
$ | 1,104 | 757 | 550 | ||||||||||||||||||||||||||||||||
|
|
|
|
|
|
|
|||||||||||||||||||||||||||||||
Fair values of NAI’s trade names were determined primarily by discounting an assumed royalty value applied to projected future revenues associated with the trade names based on management’s expectations of the current and future operating environment. The tax effected royalty cash flows are discounted using rates based on the weighted average cost of capital and the specific risk profile of the trade names relative to NAI’s other assets. These estimates are impacted by variable factors including inflation, the general health of the economy and market competition. The calculation of the impairment charge contains significant judgments and estimates related to such items as the weighted average cost of capital and the specified risk profile of the trade names, as well as future revenue and profitability.
NAI has a single reporting unit, operating segment, and reportable segment. NAI performed reviews of goodwill and intangible assets with indefinite useful lives for impairment, which indicated that the carrying value of the reporting unit’s goodwill and certain intangible assets with indefinite useful lives exceeded their estimated fair values.
During fiscal 2012, 2011, and 2010, NAI recorded noncash intangible asset impairment charges of $170, $303 and $257, respectively. During fiscal 2011 and 2010, NAI recorded goodwill impairment charges of $697 and $1,411, respectively. NAI disposed of $14 of goodwill associated with the sale of 107 NAI fuel centers during fiscal 2011. As of year-end 2011, there was no remaining goodwill.
The impairment charges were due to the significant and sustained decline in Parent’s market capitalization and estimated discounted future cash flows. The calculation of the impairment charges
| F-167 | (Continued) |
Table of Contents
NEW ALBERTSON’S BUSINESS OF SUPERVALU INC.
AND SUBSIDIARIES
Notes to Combined Financial Statements
February 21, 2013 and February 23, 2012
(Dollars in millions)
contains significant judgments and estimates related to such items as the weighted average cost of capital, future revenue, profitability, cash flows and fair values of assets and liabilities.
Amortization expense for intangible assets with definite useful lives of $40, $47 and $48 was recorded in fiscal 2012, 2011, and 2010. Future amortization expense will average approximately $22 per year for the next five years.
NAI had unfavorable operating lease intangibles, related to certain above-market leases acquired and pushed down by Parent, of $110 and $121 as of February 21, 2013 and February 23, 2012, respectively, included as a component of Other long-term liabilities within the Combined Balance Sheets. Amortization benefit relating to these unfavorable operating leases was $11, $15 and $20 for fiscal 2012, 2011 and 2010, respectively.
(4) Reserves for Closed Properties and Property, Plant and Equipment-Related Impairment Charges
Reserves for Closed Properties
NAI maintains reserves for costs associated with closures of retail stores, distribution centers and other properties that are no longer being utilized in current operations. NAI provides for closed property operating lease liabilities based on the present value of the remaining noncancelable lease payments after the closing date, reduced by estimated subtenant rentals that could be reasonably obtained for the property. Adjustments to closed property reserves primarily relate to changes in expected subtenant income or actual exit costs differing from original estimates.
Changes in NAI’s reserves for closed properties consisted of the following:
| 2012 | 2011 | 2010 | ||||||||||
| Beginning balance |
$ | 79 | 92 | 74 | ||||||||
| Additions |
26 | 9 | 36 | |||||||||
| Payments |
(21 | ) | (26 | ) | (22 | ) | ||||||
| Adjustments |
1 | 4 | 4 | |||||||||
|
|
|
|
|
|
|
|||||||
| Ending balance |
$ | 85 | 79 | 92 | ||||||||
|
|
|
|
|
|
|
|||||||
During fiscal 2010, NAI recorded additional reserves primarily related to the closure of nonstrategic stores in the fourth quarter of fiscal 2010, which resulted in increased payments during fiscal 2011.
During fiscal 2012, the closure of 35 nonstrategic stores was announced. Reserves for operating leases related to these closed properties were recorded at the time of closing and the majority of these store closings were completed in fiscal 2012. The calculation of the closed property charges requires significant judgments and estimates related to such items as future subtenant rentals, discount rates, and future cash flows based on Parent’s experience and knowledge of the market in which the closed property is located, and previous efforts to dispose of similar assets and existing market conditions.
| F-168 | (Continued) |
Table of Contents
NEW ALBERTSON’S BUSINESS OF SUPERVALU INC.
AND SUBSIDIARIES
Notes to Combined Financial Statements
February 21, 2013 and February 23, 2012
(Dollars in millions)
Property, plant and equipment related impairment charges
In fiscal 2012, long-lived assets with a carrying amount of $131 were written down to their fair value of $73, resulting in an impairment charge of $58. NAI groups long-lived assets at the lowest level for which identifiable cash flows are largely independent of the cash flows of other assets, which historically has been at the geographic market level. During the second and third quarters of fiscal 2012, certain markets were disaggregated to the store level as economic factors indicated the geographic market level was no longer appropriate. NAI recorded impairment charges of $41 as a result of the impairment reviews performed during the second and third quarters of fiscal 2012. NAI also reviewed its disaggregated store level long-lived asset groupings during the fourth quarter of fiscal 2012 and recorded impairment charges of $1 as a result of these reviews. The remaining $16 of impairment charges in fiscal 2012 primarily related to the closure of nonstrategic stores.
In fiscal 2011, long-lived assets with a carrying amount of $44 were written down to their fair value of $35, resulting in an impairment charge of $9. In fiscal 2010, NAI recorded $26 of property, plant and equipment related impairment charges.
These impairment charges were measured at fair value on a nonrecurring basis using Level 3 inputs as described in note 6—Fair Value Measurements.
Additions and adjustments to the reserves for closed properties and property, plant and equipment related impairment charges for fiscal 2012, 2011, and 2010 were recorded as a component of Selling and administrative expenses in the Combined Statements of Operations and Comprehensive Income (Loss).
(5) Property, Plant and Equipment
Property, plant and equipment, net, consisted of the following:
| February 21, 2013 |
February 23, 2012 |
|||||||
| Land |
$ | 1,057 | 1,090 | |||||
| Buildings |
2,388 | 2,343 | ||||||
| Property under construction |
9 | 93 | ||||||
| Leasehold improvements |
1,022 | 1,014 | ||||||
| Equipment |
2,081 | 2,015 | ||||||
| Capitalized lease assets |
567 | 570 | ||||||
|
|
|
|
|
|||||
| Total property, plant and equipment |
7,124 | 7,125 | ||||||
| Accumulated depreciation |
(3,034 | ) | (2,680 | ) | ||||
| Accumulated amortization on capitalized lease assets |
(199 | ) | (177 | ) | ||||
|
|
|
|
|
|||||
| Total property, plant and equipment, net |
$ | 3,891 | 4,268 | |||||
|
|
|
|
|
|||||
Depreciation expense was $462, $468, and $489 for fiscal 2012, 2011, and 2010, respectively. Amortization expense related to capitalized lease assets was $33, $33 and $34 for fiscal 2012, 2011, and 2010, respectively.
| F-169 | (Continued) |
Table of Contents
NEW ALBERTSON’S BUSINESS OF SUPERVALU INC.
AND SUBSIDIARIES
Notes to Combined Financial Statements
February 21, 2013 and February 23, 2012
(Dollars in millions)
Parent sold 107 fuel centers for $89 in cash and recognized a pre-tax loss of $7 during fiscal 2011 which is included in the accompanying Combined Statements of Operations and Comprehensive Income (Loss). NAI disposed of $14 of goodwill associated with the sale of its fuel centers.
(6) Fair Value Measurements
Fair value is defined as the price that would be received to sell an asset or paid to transfer a liability in an orderly transaction between market participants at the measurement date. Assets and liabilities recorded at fair value are categorized using defined hierarchical levels directly related to the amount of subjectivity associated with the inputs to fair value measurements, as follows:
| Level 1 |
Quoted prices in active markets for identical assets or liabilities; | |
| Level 2 |
Inputs other than quoted prices included within Level 1 that are either directly or indirectly observable; | |
| Level 3 |
Unobservable inputs in which little or no market activity exists, requiring an entity to develop its own assumptions that market participants would use to value the asset or liability. | |
Impairment charges recorded during fiscal 2012, 2011, and 2010 discussed in note 3—Goodwill and Intangible Assets and note 4—Reserves for Closed Properties and Property, Plant and Equipment-Related Impairment Charges were measured at fair value using Level 3 inputs.
Financial Instruments
For certain of NAI’s financial instruments, including cash, receivables, accounts payable, accrued salaries and other current assets and liabilities, the fair values approximate carrying values due to their short maturities.
The estimated fair value of NAI’s long-term debt (including current maturities) was lower than the book value by approximately $168 and $183 as of February 21, 2013 and February 23, 2012, respectively. The estimated fair value was based on market quotes, where available, or market values for similar instruments, using Level 2 and 3 inputs.
| F-170 | (Continued) |
Table of Contents
NEW ALBERTSON’S BUSINESS OF SUPERVALU INC.
AND SUBSIDIARIES
Notes to Combined Financial Statements
February 21, 2013 and February 23, 2012
(Dollars in millions)
(7) Long-Term Debt
NAI’s long-term debt and capital lease obligations consisted of the following:
| February 21, 2013 |
February 23, 2012 |
|||||||
| 7.45% Debentures due August 2029 |
$ | 650 | 650 | |||||
| 6.34% to 7.15% Medium term notes due through June 2028 |
434 | 440 | ||||||
| 8.00% Debentures due May 2031 |
400 | 400 | ||||||
| 8.00% Debentures due June 2026 |
272 | 272 | ||||||
| 8.70% Debentures due May 2030 |
225 | 225 | ||||||
| 7.75% Debentures due June 2026 |
200 | 200 | ||||||
| 7.25% Debentures due May 2013 |
140 | 140 | ||||||
| 7.90% Debentures due May 2017 |
96 | 96 | ||||||
| Mortgages |
20 | 22 | ||||||
| Capital lease obligations |
798 | 830 | ||||||
| Debt allocated from Parent |
2,021 | 2,315 | ||||||
| Net discount on debt |
(204 | ) | (192 | ) | ||||
|
|
|
|
|
|||||
| Total debt and capital lease obligations |
5,052 | 5,398 | ||||||
| Less current maturities of long-term debt and capital lease obligations |
(211 | ) | (322 | ) | ||||
|
|
|
|
|
|||||
| Long-term debt and capital lease obligations |
$ | 4,841 | 5,076 | |||||
|
|
|
|
|
|||||
As of February 21, 2013, NAI’s debentures and medium term notes are unsecured and interest is payable semi-annually in accordance with the underlying terms of the debentures and medium term notes.
Debt allocated from Parent represents NAI’s proportionate share of Parent’s long-term debt based on the relative portion of Parent debt utilized to fund the initial acquisition of NAI. The debt allocated from Parent had a stated weighted average interest rate of approximately 7.4% and 6.2% as of February 21, 2013 and February 23, 2012, respectively.
Future maturities of long-term debt, including debt allocated from Parent, which excludes the related net discount on debt of $204 and capital lease obligations, as of February 21, 2013 consisted of the following:
| Amount | ||||
| Fiscal year: |
||||
| 2013 |
$ | 174 | ||
| 2014 |
498 | |||
| 2015 |
8 | |||
| 2016 |
898 | |||
| 2017 |
316 | |||
| Thereafter |
2,564 | |||
| F-171 | (Continued) |
Table of Contents
NEW ALBERTSON’S BUSINESS OF SUPERVALU INC.
AND SUBSIDIARIES
Notes to Combined Financial Statements
February 21, 2013 and February 23, 2012
(Dollars in millions)
The maturities above reflect contractual maturities of debt (excluding any remaining debt discounts or premiums) and do not include the potential accelerations of debt allocated from Parent that could arise due to the debt holders’ ability to cause Parent to repurchase the debt.
A significant portion of NAI’s assets were pledged as collateral to secure certain of Parent’s debt. The debt agreements relating to the allocated debt from Parent contain certain operating covenants, which restrict the ability of Parent to take certain actions without permission of the lenders or as otherwise permitted under the agreements. However, these facilities do not require Parent to comply with any financial ratio maintenance covenants. Parent has separately guaranteed the NAI obligations associated with the 8.00% Debentures due June 2026, the 7.90% Debentures due May 2017 and a 7.10% Medium Term Note, due March 2028 with an outstanding balance of $100 as of February 21, 2013.
Deferred financing costs relating to debt allocated from Parent have been allocated by Parent to NAI based on NAI’s proportionate share of Parent’s combined long-term debt. Deferred financing costs included as a component of Other Assets in the Combined Balance Sheets were $71 and $43 as of February 21, 2013 and February 23, 2012, respectively. Deferred financing costs are being amortized over the life of the related debt allocated from Parent. Parent allocated amortization expense, excluding write offs, relating to the deferred financing costs was $11, $12 and $12 for the years ended February 21, 2013, February 23, 2012 and February 24, 2011, respectively, and was included as a component of interest expense within the Combined Statements of Operations and Comprehensive Income (Loss).
Interest expense relating to debt allocated from Parent has been allocated by Parent to NAI based on NAI’s proportionate share of Parent’s combined long-term debt. Parent allocated interest expense was $154, $154 and $135 for the years ended February 21, 2013, February 23, 2012 and February 24, 2011, respectively. The write off of deferred financing fees allocated to NAI related to Parent debt refinancing was $20, $0, and $0 for fiscal years 2012, 2011, and 2010, respectively.
| F-172 | (Continued) |
Table of Contents
NEW ALBERTSON’S BUSINESS OF SUPERVALU INC.
AND SUBSIDIARIES
Notes to Combined Financial Statements
February 21, 2013 and February 23, 2012
(Dollars in millions)
(8) Leases
NAI leases certain retail stores, distribution centers, office facilities and equipment from third parties. Many of these leases include renewal options and, to a limited extent, options to purchase. Future minimum lease payments to be made by NAI for noncancelable operating and capital leases as of February 21, 2013, consist of the following:
| Lease obligations | ||||||||
| Operating leases |
Capital leases |
|||||||
| Fiscal year: |
||||||||
| 2013 |
$ | 230 | 98 | |||||
| 2014 |
225 | 98 | ||||||
| 2015 |
204 | 97 | ||||||
| 2016 |
181 | 95 | ||||||
| 2017 |
164 | 93 | ||||||
| Thereafter |
971 | 866 | ||||||
|
|
|
|
|
|||||
| Total future minimum obligations |
$ | 1,975 | 1,347 | |||||
|
|
|
|||||||
| Less interest |
(549 | ) | ||||||
|
|
|
|||||||
| Present value of net future minimum obligations |
798 | |||||||
| Less current obligations |
(37 | ) | ||||||
|
|
|
|||||||
| Long-term obligations |
$ | 761 | ||||||
|
|
|
|||||||
Total future minimum obligations have not been reduced for future minimum subtenant rentals due under certain operating subleases.
Rent expense and subtenant rentals under operating leases consisted of the following:
| 2012 | 2011 | 2010 | ||||||||||
| Minimum rent |
$ | 256 | 268 | 276 | ||||||||
| Contingent rent |
3 | 4 | 5 | |||||||||
|
|
|
|
|
|
|
|||||||
| 259 | 272 | 281 | ||||||||||
| Subtenant rentals |
(32 | ) | (37 | ) | (38 | ) | ||||||
|
|
|
|
|
|
|
|||||||
| $ | 227 | 235 | 243 | |||||||||
|
|
|
|
|
|
|
|||||||
The Business leases certain owned properties to unrelated outside parties. Rental income under those lease agreements was $22, $24, and $24, for the fiscal years 2012, 2011, and 2010, respectively.
| F-173 | (Continued) |
Table of Contents
NEW ALBERTSON’S BUSINESS OF SUPERVALU INC.
AND SUBSIDIARIES
Notes to Combined Financial Statements
February 21, 2013 and February 23, 2012
(Dollars in millions)
The carrying value of owned property leased to third parties under operating leases was as follows:
| February 21, 2013 |
February 23, 2012 |
|||||||
| Property, plant and equipment |
$ | 18 | 19 | |||||
| Less accumulated depreciation |
(6 | ) | (4 | ) | ||||
|
|
|
|
|
|||||
| Property, plant and equipment, net |
$ | 12 | 15 | |||||
|
|
|
|
|
|||||
Future minimum lease receipts due under these noncancelable operating leases as of February 21, 2013, consist of the following:
| Fiscal year: |
||||
| 2013 |
$ | 13 | ||
| 2014 |
10 | |||
| 2015 |
8 | |||
| 2016 |
7 | |||
| 2017 |
5 | |||
| Thereafter |
7 | |||
|
|
|
|||
| Total minimum receipts |
$ | 50 | ||
|
|
|
(9) Income Taxes
The provision for income taxes (benefit) consisted of the following:
| 2012 | 2011 | 2010 | ||||||||||
| Current: |
||||||||||||
| Federal |
$ | 19 | 38 | 34 | ||||||||
| State |
3 | 6 | 5 | |||||||||
|
|
|
|
|
|
|
|||||||
| Total current |
22 | 44 | 39 | |||||||||
| Deferred |
(38 | ) | (152 | ) | 252 | |||||||
|
|
|
|
|
|
|
|||||||
| Total income tax provision (benefit) |
$ | (16 | ) | (108 | ) | 291 | ||||||
|
|
|
|
|
|
|
|||||||
The difference between the actual tax provision and the tax provision computed by applying the statutory U.S. federal income tax rate to losses before income taxes is attributable to the following:
| 2012 | 2011 | 2010 | ||||||||||
| Federal taxes based on statutory rate |
$ | (193 | ) | (384 | ) | (619 | ) | |||||
| State income taxes, net of federal benefit |
(31 | ) | (60 | ) | (93 | ) | ||||||
| Goodwill impairment |
— | 286 | 567 | |||||||||
| Change in valuation allowance |
210 | 46 | 432 | |||||||||
| Change in long-term tax liabilities |
1 | 9 | 13 | |||||||||
| Charitable contributions |
— | (3 | ) | (5 | ) | |||||||
| IRS settlement |
— | (2 | ) | — | ||||||||
| Other |
(3 | ) | — | (4 | ) | |||||||
|
|
|
|
|
|
|
|||||||
| Total income tax provision (benefit) |
$ | (16 | ) | (108 | ) | 291 | ||||||
|
|
|
|
|
|
|
|||||||
| F-174 | (Continued) |
Table of Contents
NEW ALBERTSON’S BUSINESS OF SUPERVALU INC.
AND SUBSIDIARIES
Notes to Combined Financial Statements
February 21, 2013 and February 23, 2012
(Dollars in millions)
Deferred income taxes reflect the net tax effects of temporary differences between the bases of assets and liabilities for financial reporting and income tax purposes. NAI’s deferred tax assets and liabilities consisted of the following:
| February 21, 2013 |
February 23, 2012 |
|||||||
| Deferred tax assets: |
||||||||
| Compensation and benefits |
$ | 93 | 88 | |||||
| Self-insurance |
251 | 210 | ||||||
| Property and equipment and capitalized lease assets |
358 | 354 | ||||||
| Net operating loss carryforward |
324 | 232 | ||||||
| Other |
83 | 87 | ||||||
|
|
|
|
|
|||||
| Gross deferred tax assets |
1,109 | 971 | ||||||
| Valuation allowance |
(727 | ) | (510 | ) | ||||
|
|
|
|
|
|||||
| Total deferred tax assets |
382 | 461 | ||||||
|
|
|
|
|
|||||
| Deferred tax liabilities: |
||||||||
| Property and equipment and capitalized lease assets |
(31 | ) | (74 | ) | ||||
| Inventories |
(206 | ) | (213 | ) | ||||
| Intangible assets |
(158 | ) | (217 | ) | ||||
| Debt discount |
(74 | ) | (76 | ) | ||||
| Other |
(7 | ) | (13 | ) | ||||
|
|
|
|
|
|||||
| Total deferred tax liabilities |
(476 | ) | (593 | ) | ||||
|
|
|
|
|
|||||
| Net deferred tax liabilities |
$ | (94 | ) | (132 | ) | |||
|
|
|
|
|
|||||
Net deferred tax liabilities of $94 as of February 21, 2013 include long-term deferred tax assets of $90 recorded in Deferred tax assets in the Combined Balance Sheets and current deferred tax liabilities of $184 recorded in Deferred tax liabilities. Net deferred tax liabilities of $132 as of February 23, 2012 include long-term deferred tax assets of $50 recorded in Deferred tax assets and current deferred tax liabilities of $182 recorded in Deferred tax liabilities in the Combined Balance Sheets.
On a separate company basis, NAI would have state and federal net operating loss (NOL) carry forwards of $775 for tax purposes that are not more likely than not to be realized if NAI filed a separate tax return. Accordingly, NAI has recorded a full valuation allowance against such NOL carry forwards. These NOL carry forwards will expire beginning in 2014 and continuing through 2032. In its consolidated tax return, Parent utilized a majority of these NOL carry forwards.
| F-175 | (Continued) |
Table of Contents
NEW ALBERTSON’S BUSINESS OF SUPERVALU INC.
AND SUBSIDIARIES
Notes to Combined Financial Statements
February 21, 2013 and February 23, 2012
(Dollars in millions)
Changes in NAI’s unrecognized tax benefits consisted of the following:
| 2012 | 2011 | 2010 | ||||||||||
| Beginning balance |
$ | 132 | 150 | 115 | ||||||||
| Increase related to tax positions taken in current year |
2 | 10 | 12 | |||||||||
| Decrease related to tax positions taken in current year |
(1 | ) | (1 | ) | (1 | ) | ||||||
| Increase related to tax positions taken in prior years |
92 | 15 | 29 | |||||||||
| Decrease related to tax position taken in prior years |
(77 | ) | (39 | ) | (6 | ) | ||||||
| Increase (decrease) related to lapse of statute of limitations |
(1 | ) | (3 | ) | 1 | |||||||
|
|
|
|
|
|
|
|||||||
| Ending balance |
$ | 147 | 132 | 150 | ||||||||
|
|
|
|
|
|
|
|||||||
Included in the balance of unrecognized tax benefits as of February 21, 2013, February 23, 2012 and February 24, 2011 are tax positions of $32 net of tax, $44 net of tax, and $48 net of tax, respectively, which would reduce NAI’s effective tax rate if recognized in future periods.
NAI, through its Parent, expects to resolve, net of any state tax effect, matters relating to $6 of unrecognized tax benefits within the next 12 months, representing several individually insignificant income tax positions. These unrecognized tax benefits represent items in which NAI may not prevail with certain taxing authorities, based on varying interpretations of the applicable tax law. NAI, through its Parent, is currently in various stages of audits, appeals or other methods of review with authorities from various taxing jurisdictions. The resolution of these unrecognized tax benefits would occur as a result of potential settlements of these negotiations. Based on the information available as of February 21, 2013, NAI does not anticipate significant additional changes to its unrecognized tax benefits.
NAI recognized expense related to interest and penalties, net of settlement adjustments, of $7, $2 and $6 for fiscal 2012, 2011 and 2010, respectively.
NAI, through its Parent, is currently under examination or other methods of review in several tax jurisdictions and remains subject to examination until either the statute of limitations expires for the respective taxing jurisdiction or an agreement is reached between the taxing jurisdiction and NAI. As of February 21, 2013, NAI, through its Parent, is no longer subject to federal income tax examinations for fiscal years before 2007 and in most states is no longer subject to state income tax examinations for fiscal years before 2005.
(10) Benefit Plans
Substantially all employees of NAI are covered by various contributory and noncontributory pension, profit sharing or 401(k) plans. Most union employees participate in multiemployer retirement plans under collective bargaining agreements, unless the collective bargaining agreement provides for participation in plans sponsored by Parent. In addition, Parent provides healthcare and life insurance
| F-176 | (Continued) |
Table of Contents
NEW ALBERTSON’S BUSINESS OF SUPERVALU INC.
AND SUBSIDIARIES
Notes to Combined Financial Statements
February 21, 2013 and February 23, 2012
(Dollars in millions)
benefits for eligible retired employees under postretirement benefit plans. Parent also provides certain health and welfare benefits, including short-term and long-term disability benefits, to inactive disabled employees prior to retirement.
(a) Shaw’s Pension Plan
NAI sponsors a defined benefit pension plan (Shaw’s Pension Plan) covering employees of one of its banners. Participants earn pension benefits based on years of service. The benefit obligation, fair value of plan assets and funded status of the Shaw’s Pension Plan as of February 21, 2013 and February 23, 2012 consisted of the following:
| February 21, 2013 |
February 23, 2012 |
|||||||
| Change in benefit obligation: |
||||||||
| Benefit obligation at beginning of year |
$ | 290 | 228 | |||||
| Service cost |
11 | 8 | ||||||
| Interest cost |
13 | 13 | ||||||
| Actuarial loss |
12 | 46 | ||||||
| Benefits paid |
(6 | ) | (5 | ) | ||||
|
|
|
|
|
|||||
| Benefit obligation at end of year |
320 | 290 | ||||||
|
|
|
|
|
|||||
| February 21, 2013 |
February 23, 2012 |
|||||||
| Changes in plan assets: |
||||||||
| Fair value of plan assets at beginning of year |
$ | 189 | 173 | |||||
| Actual return on plan assets |
20 | 11 | ||||||
| Employer contributions |
8 | 10 | ||||||
| Plan participants’ contributions |
— | — | ||||||
| Benefits paid |
(6 | ) | (5 | ) | ||||
|
|
|
|
|
|||||
| Fair value of plan assets at end of year |
211 | 189 | ||||||
|
|
|
|
|
|||||
| Funded status at end of year |
$ | (109 | ) | (101 | ) | |||
|
|
|
|
|
|||||
Amounts recognized in accumulated other comprehensive loss for Shaw’s Pension Plan consists of the following:
| 2012 | 2011 | |||||||
| Amount recognized in accumulated other comprehensive loss |
$ | (78 | ) | (81 | ) | |||
| Total recognized in accumulated other comprehensive loss, net of tax |
(63 | ) | (65 | ) | ||||
| F-177 | (Continued) |
Table of Contents
NEW ALBERTSON’S BUSINESS OF SUPERVALU INC.
AND SUBSIDIARIES
Notes to Combined Financial Statements
February 21, 2013 and February 23, 2012
(Dollars in millions)
Net periodic benefit expense (income) for Shaw’s Pension Plan consisted of the following:
| 2012 | 2011 | 2010 | ||||||||||
| Net periodic benefit cost: |
||||||||||||
| Service cost |
$ | 11 | 8 | 8 | ||||||||
| Interest cost |
13 | 13 | 12 | |||||||||
| Expected return on plan assets |
(14 | ) | (12 | ) | (12 | ) | ||||||
| Amortization of net actuarial loss |
9 | 5 | 3 | |||||||||
|
|
|
|
|
|
|
|||||||
| Net periodic benefit cost |
19 | 14 | 11 | |||||||||
|
|
|
|
|
|
|
|||||||
| 2012 | 2011 | 2010 | ||||||||||
| Net periodic benefit cost: |
||||||||||||
| Other changes in plan assets and benefit obligations recognized in other comprehensive income (loss): |
||||||||||||
| Net actuarial (gain) loss |
$ | 6 | 48 | (1 | ) | |||||||
| Amortization of net actuarial loss |
(9 | ) | (5 | ) | (3 | ) | ||||||
|
|
|
|
|
|
|
|||||||
| Total recognized in other comprehensive income (loss) |
(3 | ) | 43 | (4 | ) | |||||||
|
|
|
|
|
|
|
|||||||
| Total recognized in net periodic benefit expense and other comprehensive income (loss) |
$ | 16 | 57 | 7 | ||||||||
|
|
|
|
|
|
|
|||||||
The estimated net actuarial loss that will be amortized from accumulated other comprehensive loss into net periodic benefit cost for Shaw’s Pension Plan during fiscal 2013 is $8.
(b) Assumptions
Weighted average assumptions used to determine benefit obligations and net periodic benefit cost for Shaw’s Pension Plan consisted of the following:
| 2012 | 2011 | 2010 | ||||||||||
| Benefit obligation assumptions: |
||||||||||||
| Discount rate(1) |
4.25 | % | 4.25 | % | 5.60 | % | ||||||
| Net periodic benefit cost assumptions:(2) |
||||||||||||
| Discount rate(1) |
4.55 | 5.60 | 6.00 | |||||||||
| Expected rate of return on plan assets(3) |
7.25 | 7.50 | 7.75 | |||||||||
| (1) | NAI reviews the discount rate to be used in connection with Shaw’s Pension Plan annually. In determining the discount rate, NAI uses the yields on corporate bonds (rated AA or better) that coincide with the cash flows of Shaw’s Pension Plan’s estimated benefit payouts. The model uses a yield curve approach to discount each cash flow of the liability stream at an interest rate specifically applicable to the timing of each respective cash flow. The model totals the present value of all cash flows and calculates the equivalent weighted average discount rate by imputing the singular interest rate that equates the total present value with the stream of cash flows. This resulting weighted average discount rate is then used in evaluating the final discount rate used by NAI. |
| F-178 | (Continued) |
Table of Contents
NEW ALBERTSON’S BUSINESS OF SUPERVALU INC.
AND SUBSIDIARIES
Notes to Combined Financial Statements
February 21, 2013 and February 23, 2012
(Dollars in millions)
| (2) | Net periodic benefit cost is measured using weighted average assumptions as of the beginning of each year. |
| (3) | Expected rate of return on plan assets is estimated by utilizing forward-looking, long-term return, risk and correlation assumptions developed and updated annually by NAI. These assumptions are weighted by actual or target allocations to each underlying asset class represented in the pension plan asset portfolio. NAI also assesses the expected long-term rate of return on plan assets assumption by comparison to long-term historical performance on an asset class to ensure the assumption is reasonable. Long-term trends are also evaluated relative to market factors such as inflation, interest rates, and fiscal and monetary policies in order to assess the capital market assumptions. |
NAI calculates its expected return on plan assets by using the market related value of plan assets determined by adjusting the actual fair value of plan assets for unrecognized gains or losses on plan assets. Unrecognized gains or losses represent the difference between actual returns and expected returns on plan assets for each fiscal year and are recognized by NAI evenly over a three year period. Since the market-related value of assets recognizes gains or losses over a three-year period, the future value of assets will be impacted as previously deferred gains or losses are recognized.
(c) Pension Plan Assets
Plan assets are held in a master trust of Parent and invested in separately managed accounts and other commingled investment vehicles holding domestic and international equity securities, domestic fixed income securities and other investment classes. Parent employs a total return approach whereby a diversified mix of asset class investments is used to maximize the long-term return of plan assets for an acceptable level of risk. Alternative investments are also used to enhance risk-adjusted long-term returns while improving portfolio diversification. Risk management is managed through diversification across asset classes, multiple investment manager portfolios and both general and portfolio-specific investment guidelines. Risk tolerance is established through careful consideration of the plan liabilities, plan funded status and Parent’s financial condition. This asset allocation policy mix is reviewed annually and actual versus target allocations are monitored regularly and rebalanced on an as-needed basis. Plan assets are invested using a combination of active and passive investment strategies. Passive, or “indexed” strategies, attempt to mimic rather than exceed the investment performance of a market benchmark. The trust’s active investment strategies employ multiple investment management firms. Managers within each asset class cover a range of investment styles and approaches and are combined in a way that controls for capitalization, and style biases (equities) and interest rate exposures (fixed income) versus benchmark indices. Monitoring activities to evaluate performance against targets and measure investment risk take place on an ongoing basis through annual liability measurements, periodic asset/liability studies, and quarterly investment portfolio reviews.
| F-179 | (Continued) |
Table of Contents
NEW ALBERTSON’S BUSINESS OF SUPERVALU INC.
AND SUBSIDIARIES
Notes to Combined Financial Statements
February 21, 2013 and February 23, 2012
(Dollars in millions)
The asset allocation targets and the actual allocation of pension plan assets are as follows:
| Target | 2012 | 2011 | ||||||||||
| Asset category: |
||||||||||||
| Domestic equity |
30.5 | % | 32.9 | % | 33.9 | % | ||||||
| International equity |
14.0 | 15.3 | 17.8 | |||||||||
| Private equity |
8.0 | 5.4 | 4.8 | |||||||||
| Fixed income |
37.5 | 37.3 | 35.0 | |||||||||
| Real estate |
10.0 | 9.1 | 8.5 | |||||||||
|
|
|
|
|
|
|
|||||||
| Total |
100.0 | % | 100.0 | % | 100.0 | % | ||||||
|
|
|
|
|
|
|
|||||||
The following is a description of the valuation methodologies used for investments measured at fair value:
Common stock—Valued at the closing price reported in the active market in which the individual securities are traded.
Common collective trusts—Valued at net asset value (NAV), which is based on the fair value of the underlying securities owned by the fund and divided by the number of shares outstanding. The NAV unit price is quoted on a private market that is not active. However, the NAV is based on the fair value of the underlying securities within the fund, which are traded on an active market, and valued at the closing price reported on the active market on which those individual securities are traded.
Government securities—Certain government securities are valued at the closing price reported in the active market in which the security is traded. Other government securities are valued based on yields currently available on comparable securities of issuers with similar credit ratings.
Mutual funds—Mutual funds are valued at the closing price reported in the active market in which the individual securities are traded.
Corporate bonds—Valued based on yields currently available on comparable securities of issuers with similar credit ratings. When quoted prices are not available for identical or similar bonds, the fair value is based upon an industry valuation model, which maximizes observable inputs.
Real estate partnerships and Private equity—Valued using the most recent general partner statement of fair value, updated for any subsequent partnership interests’ cash flows or expected changes in fair value.
Mortgage backed securities—Valued based on yields currently available on comparable securities of issuers with similar credit ratings. When quoted prices are not available for identical or similar bonds, the fair value is based upon an industry valuation model, which maximizes observable inputs.
Other—Valued under an approach that maximizes observable inputs, such as gathering consensus data from the market participant’s best estimate of mid-market for actual trades or positions held.
| F-180 | (Continued) |
Table of Contents
NEW ALBERTSON’S BUSINESS OF SUPERVALU INC.
AND SUBSIDIARIES
Notes to Combined Financial Statements
February 21, 2013 and February 23, 2012
(Dollars in millions)
The fair value of assets of Shaw’s Pension Plan held in a master trust as of February 21, 2013, by asset category, consisted of the following:
| Level 1 | Level 2 | Level 3 | Total | |||||||||||||
| Common stock |
$ | 58 | — | — | 58 | |||||||||||
| Common collective trusts—fixed income |
— | 26 | — | 26 | ||||||||||||
| Common collective trusts—equity |
— | 34 | — | 34 | ||||||||||||
| Government securities |
6 | 10 | — | 16 | ||||||||||||
| Mutual funds |
5 | 23 | — | 28 | ||||||||||||
| Corporate bonds |
— | 19 | — | 19 | ||||||||||||
| Real estate partnerships |
— | — | 15 | 15 | ||||||||||||
| Private equity |
— | — | 11 | 11 | ||||||||||||
| Mortgage-backed securities |
— | 4 | — | 4 | ||||||||||||
|
|
|
|
|
|
|
|
|
|||||||||
| Total plan assets at fair value |
$ | 69 | 116 | 26 | 211 | |||||||||||
|
|
|
|
|
|
|
|
|
|||||||||
The fair value of assets of Shaw’s Pension Plan held in a master trust as of February 23, 2012, by asset category, consisted of the following:
| Level 1 | Level 2 | Level 3 | Total | |||||||||||||
| Common stock |
$ | 57 | — | — | 57 | |||||||||||
| Common collective trusts—fixed income |
— | 27 | — | 27 | ||||||||||||
| Common collective trusts—equity |
— | 31 | — | 31 | ||||||||||||
| Government securities |
11 | 8 | — | 19 | ||||||||||||
| Mutual funds |
— | 18 | — | 18 | ||||||||||||
| Corporate bonds |
— | 11 | — | 11 | ||||||||||||
| Real estate partnerships |
— | — | 12 | 12 | ||||||||||||
| Private equity |
— | — | 9 | 9 | ||||||||||||
| Mortgage-backed securities |
— | 4 | — | 4 | ||||||||||||
| Others |
— | 1 | — | 1 | ||||||||||||
|
|
|
|
|
|
|
|
|
|||||||||
| Total plan assets at fair value |
$ | 68 | 100 | 21 | 189 | |||||||||||
|
|
|
|
|
|
|
|
|
|||||||||
| F-181 | (Continued) |
Table of Contents
NEW ALBERTSON’S BUSINESS OF SUPERVALU INC.
AND SUBSIDIARIES
Notes to Combined Financial Statements
February 21, 2013 and February 23, 2012
(Dollars in millions)
The following is a summary of changes in the fair value for Level 3 investments for fiscal years 2012 and 2011:
| Real estate partnerships |
Private equity |
|||||||
| Beginning balance, February 24, 2011 |
$ | 9 | 6 | |||||
| Purchases |
2 | 3 | ||||||
| Sales |
— | (1 | ) | |||||
| Unrealized gains |
1 | 1 | ||||||
| Realized gains and losses |
— | — | ||||||
|
|
|
|
|
|||||
| Ending balance, February 23, 2012 |
12 | 9 | ||||||
| Purchases |
2 | 2 | ||||||
| Sales |
— | (1 | ) | |||||
| Unrealized gains |
1 | 1 | ||||||
| Realized gains and losses |
— | — | ||||||
|
|
|
|
|
|||||
| Ending balance, February 21, 2013 |
$ | 15 | 11 | |||||
|
|
|
|
|
|||||
Contributions
NAI expects to contribute approximately $15 to Shaw’s Pension Plan in fiscal 2013. NAI’s funding policy for the defined benefit pension plan is to contribute the minimum contribution required under the Employee Retirement Income Security Act of 1974, as amended, and other applicable laws as determined by NAI’s external actuarial consultant. At NAI’s discretion, additional funds may be contributed to the pension plan. NAI assesses the relative attractiveness of the use of cash including expected return on assets, discount rates, and cost of debt in order to achieve exemption from participant notices of underfunding. NAI will recognize contributions in accordance with applicable regulations, with consideration given to recognition for the earliest plan year permitted.
Estimated Future Benefit Payments
The estimated future benefit payments to be paid from Shaw’s Pension Plan are as follows:
| Pension benefits |
||||
| Fiscal year: |
||||
| 2013 |
$ | 8 | ||
| 2014 |
9 | |||
| 2015 |
10 | |||
| 2016 |
11 | |||
| 2017 |
12 | |||
| Years 2018—2022 |
73 | |||
| F-182 | (Continued) |
Table of Contents
NEW ALBERTSON’S BUSINESS OF SUPERVALU INC.
AND SUBSIDIARIES
Notes to Combined Financial Statements
February 21, 2013 and February 23, 2012
(Dollars in millions)
(d) Multiemployer Pension Plans
Multiemployer Pension Plans
NAI contributes to various multiemployer pension plans under collective bargaining agreements, primarily defined benefit pension plans. These multiemployer plans generally provide retirement benefits to participants based on their service to contributing employers. The benefits are paid from assets held in trust for that purpose. Plan trustees typically are responsible for determining the level of benefits to be provided to participants as well as the investment of the assets and plan administration. Trustees are appointed in equal number by employers and unions that are parties to the collective bargaining agreement. Expense is recognized in connection with these plans as contributions are funded, in accordance with U.S. GAAP.
The risks of participating in these multiemployer plans are different from the risks associated with single-employer plans in the following respects:
| a. | Assets contributed to the multiemployer plan by one employer may be used to provide benefits to employees of other participating employers. |
| b. | If a participating employer stops contributing to the plan, the unfunded obligations of the plan may be borne by the remaining participating employers. |
| c. | If NAI chooses to stop participating in some multiemployer plans, or makes market exits or store closures or otherwise has participation in the plan drop below certain levels, NAI may be required to pay those plans an amount based on the underfunded status of the plan, referred to as a withdrawal liability. |
NAI’s participation in these plans is outlined in the table below. The EIN-Pension Plan Number column provides the Employer Identification Number (EIN) and the three-digit plan number, if applicable. Unless otherwise noted, the most recent Pension Protection Act zone status (PPA) available in fiscal 2012 and fiscal 2011 relates to the plans’ two most recent fiscal year-ends. The zone status is based on information that Parent received from the plan and is certified by each plan’s actuary. The FIP/RP Status Pending/Implemented column indicates plans for which a financial improvement plan (FIP) or a rehabilitation plan (RP) is either pending or has been implemented by the trustees of each plan.
Certain plans have been aggregated in the All Other Multiemployer Pension Plans line in the following table, as the contributions to each of these plans are not individually material. None of NAI’s collective bargaining agreements require that a minimum contribution be made to these plans. Finally, the number of employees covered by NAI’s multiemployer plans decreased by 14% from fiscal 2011 to fiscal 2012 and by eight percent from fiscal 2010 to fiscal 2011, affecting the period-to-period comparability of the contributions for fiscal years 2012, 2011 and 2010. The reduction in covered employees corresponded to store closures and reductions in headcount.
| F-183 | (Continued) |
Table of Contents
NEW ALBERTSON’S BUSINESS OF SUPERVALU INC.
AND SUBSIDIARIES
Notes to Combined Financial Statements
February 21, 2013 and February 23, 2012
(Dollars in millions)
The following table contains information about NAI’s multiemployer plans:
| EIN—Pension plan number |
Plan month/day end date |
Pension Protection | FIP/RP status |
|||||||||||||||||||||||||||||||||||||
| Act zone status(3) | Contributions | Surcharges | Amortization | |||||||||||||||||||||||||||||||||||||
| Pension Fund |
2012 | 2011 | 2012 | 2011 | 2010 | Imposed (1) | Provisions | |||||||||||||||||||||||||||||||||
| Southern California UFCW Unions and Food Employers Joint Pension Fund |
951939092-001 | 31-Mar | Red | Red | Implemented | $ | 30 | 35 | 37 | No | Yes | |||||||||||||||||||||||||||||
| UFCW Union and Participating Food Industry Employers Tri-State Pension Fund |
236396097-001 | 31-Dec | Red | Red | Implemented | 16 | 15 | 17 | Yes | Yes | ||||||||||||||||||||||||||||||
| Western Conference of Teamsters Pension Plan |
916145047-001 | 31-Dec | Green | Green | No | 10 | 13 | 14 | No | No | ||||||||||||||||||||||||||||||
| UFCW Local 152 Retail Meat Pension Fund |
236209656-001 | 30-Jun | Red | Red | Implemented | 7 | 7 | 7 | Yes | Yes | ||||||||||||||||||||||||||||||
| UFCW International Union —Industry Pension Fund |
516055922-001 | 30-Jun | Green | Green | No | 4 | 4 | 5 | No | No | ||||||||||||||||||||||||||||||
| Retail Food Employers and UFCW Local 711 Pension Trust Fund |
516031512-001 | 31-Dec | Red | Red | Implemented | 3 | 5 | 4 | Yes | Yes | ||||||||||||||||||||||||||||||
| Sound Retirement Fund (AKA Retail Clerks Pension Fund) |
916069306-001 | 30-Sep | Red | Red | Implemented | 3 | 3 | 3 | Yes | Yes | ||||||||||||||||||||||||||||||
| Teamsters Pension Trust Fund of Philadelphia and Vicinity |
231511735-001 | 31-Dec | Yellow | Yellow | Implemented | 2 | — | 1 | No | No | ||||||||||||||||||||||||||||||
| Oregon Retail Employees Pension Trust |
936074377-001 | 31-Dec | Red | Red | Implemented | 1 | 1 | 1 | Yes | No | ||||||||||||||||||||||||||||||
| Intermountain Retail Store Employees Pension Trust |
916187192-001 | 31-Aug | Red | Red | Implemented | 1 | 1 | 1 | Yes | Yes | ||||||||||||||||||||||||||||||
| All Other Multiemployer Pension Plans(2) |
6 | 5 | 6 | |||||||||||||||||||||||||||||||||||||
|
|
|
|
|
|
|
|||||||||||||||||||||||||||||||||||
| Total |
$ | 83 | 89 | 96 | ||||||||||||||||||||||||||||||||||||
|
|
|
|
|
|
|
|||||||||||||||||||||||||||||||||||
| (1) | PPA surcharges are five percent or ten percent of eligible contributions and may not apply to all collective bargaining agreements or total contributions to each plan. |
| (2) | All Other Multiemployer Pension Plans include plans, none of which are individually significant when considering NAI’s contributions to the plan, severity of the underfunded status or other factors. |
| (3) | PPA established three categories (or zones) of plans: (1) “Green Zone” for healthy; (2) “Yellow Zone” for endangered; and (3) “Red Zone” for critical. These categories are based upon the funding ratio of the plan assets to plan liabilities. In general, Green Zone plans have a funding ratio greater than 80%, Yellow Zone plans have a funding ratio between 65—79%, and Red Zone plans have a funding ratio less than 65%. |
| F-184 | (Continued) |
Table of Contents
NEW ALBERTSON’S BUSINESS OF SUPERVALU INC.
AND SUBSIDIARIES
Notes to Combined Financial Statements
February 21, 2013 and February 23, 2012
(Dollars in millions)
The following table describes the expiration of NAI’s collective bargaining agreements associated with the significant multiemployer plans in which NAI participates:
| Pension Fund |
Range of collective bargaining agreement expiration dates |
Total collective bargaining agreements |
Expiration date |
Association under collective bargaining agreement |
Over 5% contribution 2013 |
|||||||||||||||
| Southern California UFCW Unions and Food Employers Joint Pension Fund |
03/07/2011—03/05/2017 | 4 | 3/2/2014 | 98.1 | % | Yes | ||||||||||||||
| Western Conference of Teamsters Pension Plan |
03/01/2010—09/01/2016 | 12 | 9/10/2016 | 24.0 | No | |||||||||||||||
| Retail Food Employers and UFCW Local 711 Pension Trust Fund |
05/10/2012—03/01/2015 | 4 | 3/1/2015 | 90.3 | Yes | |||||||||||||||
| Sound Retirement Fund (AKA Retail Clerks Pension Fund) |
01/04/2009—11/07/2015 | 22 | 8/3/2013 | 19.4 | Yes | |||||||||||||||
| Teamsters Pension Trust Fund of Philadelphia and Vicinity |
07/01/2011—07/01/2014 | 1 | 7/1/2014 | 100.0 | No | |||||||||||||||
| Oregon Retail Employees Pension Trust |
01/20/2008—08/06/2016 | 15 | 8/1/2015 | 43.6 | Yes | |||||||||||||||
| Intermountain Retail Store Employees Pension Trust |
02/17/2008—07/25/2015 | 44 | 3/31/2014 | 18.7 | Yes | |||||||||||||||
| UFCW Union and Participating Food Industry Employers Tri-State Pension Fund |
02/03/2008—01/25/2014 | 4 | 02/02/2012 | 43.5 | % | Yes | ||||||||||||||
| UFCW Local 152 Retail Meat Pension Plan |
05/04/2009—05/04/2013 | 2 | 05/04/2013 | 93.5 | Yes | |||||||||||||||
| UFCW International Union-Industry Pension Fund |
03/07/2010—09/05/2015 | 3 | 08/23/2014 | 97.4 | No | |||||||||||||||
| (1) | NAI participating employees in the most significant collective bargaining agreement as a percent of all NAI employees participating in the respective fund. |
| F-185 | (Continued) |
Table of Contents
NEW ALBERTSON’S BUSINESS OF SUPERVALU INC.
AND SUBSIDIARIES
Notes to Combined Financial Statements
February 21, 2013 and February 23, 2012
(Dollars in millions)
Collective Bargaining Agreements
As of February 21, 2013, NAI had approximately 82,000 employees. Approximately 61,000 employees were covered by collective bargaining agreements. During fiscal 2012, 55 collective bargaining agreements covering 12,000 employees were renegotiated. During fiscal 2013, 36 collective bargaining agreements covering approximately 11,500 employees are scheduled to expire.
Multiemployer Health and Welfare Plans
NAI makes contributions to multiemployer health and welfare plans, which cover certain NAI union employees, in amounts set forth in the related collective bargaining agreements. These plans provide medical, dental, pharmacy, vision, and other ancillary benefits to active employees and retirees as determined by the trustees of each plan. The vast majority of contributions benefit active employees and as such, may not constitute contributions to a postretirement benefit plan. However, NAI is unable to separate contribution amounts to postretirement benefit plans from contribution amounts paid to active plans.
NAI contributed $265, $274, and $273 for fiscal years 2012, 2011 and 2010, respectively, to multiemployer health and welfare plans.
(e) Participation in Parent Benefit Plans
Certain employees of NAI are eligible to participate in various Parent sponsored benefit plans.
Defined Contribution Plans
Many of NAI’s employees are eligible to contribute to the Parent’s defined contribution plans, whereby employees can contribute a portion of their compensation, a portion of which is matched by the Parent. Once the contribution has been paid, the Parent and NAI have no further payment obligation.
Total NAI contribution expenses for these plans were $53, $56, and $61 for fiscal years 2012, 2011 and 2010, respectively. Matching contributions were reduced or eliminated in January 2013 for most employees.
Defined Benefit Pension Plan
Certain of NAI’s employees meeting minimum age and service requirements participate in the SUPERVALU INC. Retirement Plan (Parent Pension Plan), which is a defined benefit plan sponsored by Parent. The NAI allocated expense related to this Parent sponsored defined benefit pension plan was $52, $54 and $38 for fiscal years 2012, 2011 and 2010, respectively.
For fiscal years 2012 and 2011, the Parent Pension Plan was approximately 71% and 67% funded, respectively. Parent made total contributions to the SUPERVALU Inc. Retirement Plan of $90 and $72 for fiscal years 2012 and 2011, respectively.
| F-186 | (Continued) |
Table of Contents
NEW ALBERTSON’S BUSINESS OF SUPERVALU INC.
AND SUBSIDIARIES
Notes to Combined Financial Statements
February 21, 2013 and February 23, 2012
(Dollars in millions)
Post-Employment Benefits
NAI recognizes an obligation for benefits provided to former or inactive employees. NAI, through its Parent, is self-insured for certain disability plan programs, the primary benefits paid to inactive employees prior to retirement. As of February 21, 2013 and February 23, 2012, NAI’s obligation for post-employment benefits was $32 and $30, respectively, with $18 and $15, respectively, included in Accrued vacation, compensation and benefits, and $14 and $15, respectively, included in Other long-term liabilities within the Combined Balance Sheets. Annual expenses were insignificant for fiscal years 2012, 2011, and 2010.
Health and Welfare Plan
NAI’s employees are eligible to participate in a Parent-sponsored health and welfare plan. This plan provides medical, dental, pharmacy, vision, and other ancillary benefits to active employees and retirees as determined by the trustees of the plan.
Total Parent allocated expense related to this plan is $199, $201, and $222 for fiscal years 2012, 2011, and 2010, respectively.
(11) Segments
NAI reports and manages its business under one reportable segment. The following table presents net sales by type of similar product:
| 2012 | 2011 | 2010 | ||||||||||
| Nonperishable(1) |
$ | 8,795 | 9,413 | 10,059 | ||||||||
| Perishable(2) |
6,451 | 6,902 | 7,224 | |||||||||
| Pharmacy |
1,830 | 1,883 | 1,938 | |||||||||
| Other(3) |
153 | 564 | 612 | |||||||||
|
|
|
|
|
|
|
|||||||
| $ | 17,229 | 18,762 | 19,833 | |||||||||
|
|
|
|
|
|
|
|||||||
| (1) | Consists primarily of general merchandise, grocery, and frozen foods. |
| (2) | Consists primarily of produce, dairy, meat, bakery, deli, floral, and seafood. |
| (3) | Consists primarily of fuel, lottery and various other commissions, and other miscellaneous income. |
(12) Related Parties and Allocations
NAI’s fiscal year ends on the Thursday before the last Saturday in February. Parent’s fiscal year ends on the last Saturday in February. Because of differences in the accounting calendars of NAI and Parent, the February 21, 2013 and February 23, 2012 Combined Balance Sheets include certain assets and liabilities allocated from Parent as of February 23, 2013 and February 25, 2012, respectively.
| F-187 | (Continued) |
Table of Contents
NEW ALBERTSON’S BUSINESS OF SUPERVALU INC.
AND SUBSIDIARIES
Notes to Combined Financial Statements
February 21, 2013 and February 23, 2012
(Dollars in millions)
Product Purchases and Allocation of General Corporate and Other Expenses
NAI purchases product from certain of Parent’s shared distribution centers for sale at certain of its retail grocery stores. Such purchases are generally recorded at cost.
The Combined Financial Statements also include expense allocations for certain support functions provided by Parent, including, but not limited to, amounts related to finance, legal, information technology, warehouse and distribution, human resources, communications, compliance, and employee benefits and incentives. These expenses have been allocated to NAI on the basis of direct usage when identifiable, with the remainder allocated on the basis of revenue, headcount or other measures. Expense allocations include expenses incurred by Parent’s distribution centers serving NAI, which include direct labor, utilities and depreciation and freight.
The expense allocations have been determined on a basis that both NAI and Parent consider to be a reasonable reflection of the utilization of services provided to or the benefit received by NAI during the periods presented. The allocations may not, however, reflect the expense NAI would have incurred as an independent business for the periods presented. Actual costs that may have been incurred if NAI had been a stand-alone business would depend on a number of factors, including the organization structure adopted, whether functions were outsourced or performed by employees and strategic decisions made in areas such as information technology and infrastructure.
All transactions with the Parent, including these expense allocations, are accounted for within the Parent company net investment balance, with changes in the Parent company net investment flowing through the financing section of the Combined Statements of Cash Flows.
During the years ended February 21, 2013, February 23, 2012 and February 24, 2011, NAI purchased product or was allocated the following general corporate and other expenses incurred by Parent, which are included in the Combined Statements of Operations and Comprehensive Income (Loss) as outlined below.
| 2012 | 2011 | 2010 | ||||||||||
| Cost of sales |
$ | 2,630 | 2,801 | 2,853 | ||||||||
| Sales and administrative expenses |
430 | 410 | 381 | |||||||||
|
|
|
|
|
|
|
|||||||
| $ | 3,060 | 3,211 | 3,234 | |||||||||
|
|
|
|
|
|
|
|||||||
Interest Expense and Amortization of Deferred Financing Costs, Net
Debt allocated from Parent represents NAI’s proportionate share of Parent’s long-term debt based on the relative portion of Parent debt utilized to fund the initial acquisition of NAI. NAI was also allocated the same relative proportion of Parent interest expense and amortization of deferred financing costs as summarized below:
| 2012 | 2011 | 2010 | ||||||||||
| Parent allocated interest expense and amortization of deferred financing costs, net |
$ | 165 | 165 | 147 | ||||||||
| F-188 | (Continued) |
Table of Contents
NEW ALBERTSON’S BUSINESS OF SUPERVALU INC.
AND SUBSIDIARIES
Notes to Combined Financial Statements
February 21, 2013 and February 23, 2012
(Dollars in millions)
The write off of deferred financing fees allocated to NAI related to Parent debt refinancing was $20, $0, and $0 for fiscal years 2012, 2011, and 2010, respectively.
(13) Commitments, Contingencies and Off-Balance Sheet Arrangements
(a) Guarantees
NAI has outstanding guarantees related to certain leases as of February 21, 2013. For each guarantee issued, if the assignee defaults on a payment, NAI would be required to make payments under its guarantee. As of February 21, 2013, the maximum amount of undiscounted guarantee payments NAI would be required to make in the event of default of all of these guarantees was $1. NAI believes the likelihood that it will be required to assume any of these obligations is remote. Accordingly, no amount has been recorded in the Combined Balance Sheets for these contingent obligations under NAI’s guarantee arrangements.
NAI is also contingently liable for leases that have been assigned to various third parties in connection with facility closings and dispositions. NAI could be required to satisfy the obligations under the leases if any of the assignees are unable to fulfill their lease obligations. Due to the wide distribution of NAI’s assignments among third parties, and various other remedies available, NAI believes the likelihood that it will be required to assume a material amount of these obligations is remote. Accordingly, no amount has been recorded in the accompanying Combined Balance Sheets for these contingent obligations.
In the ordinary course of business, Parent enters into various supply contracts to purchase products for resale as well as purchase and service contracts for fixed asset and information technology resources. These contracts typically include volume commitments or fixed expiration dates, termination provisions and other standard contractual considerations. As of February 21, 2013, NAI had approximately $67 of noncancelable future purchase obligations. These contracts primarily relate to Parent’s commercial contracts, operating leases and other real estate contracts, financial agreements, agreements to provide services to Parent’s subsidiaries and agreements to indemnify officers, directors and employees in the performance of their work. NAI is a party to these Parent contractual agreements under which NAI may be obligated to indemnify the other party for certain matters, which indemnities may be secured by operation of law or otherwise, in the ordinary course of business. While NAI’s aggregate indemnification obligation could result in a material liability, NAI is not aware of any matters that are expected to result in a material liability.
(b) Legal Proceedings
NAI is subject to various lawsuits, claims and other legal matters that arise in the ordinary course of conducting business. In the opinion of management, based upon currently available facts, it is remote that the ultimate outcome of any lawsuits, claims and other proceedings will have a material adverse effect on the overall results of NAI’s operations, its cash flows or its financial position.
On October 24, 2012, the Office of Self-Insurance Plans, a program within the director’s office of the California Department of Industrial Relations (the DIR), notified SUPERVALU that additional security was required to be posted in connection with SUPERVALU’s California self-insured workers’
| F-189 | (Continued) |
Table of Contents
NEW ALBERTSON’S BUSINESS OF SUPERVALU INC.
AND SUBSIDIARIES
Notes to Combined Financial Statements
February 21, 2013 and February 23, 2012
(Dollars in millions)
compensation obligations of NAI and certain other subsidiaries pursuant to applicable regulations. The notice from the DIR stated that the additional security was required as a result of an increase in estimated future liabilities, as determined by the DIR pursuant to a review of the self-insured California workers’ compensation claims with respect to the applicable businesses, and a decline in SUPERVALU net worth. A security deposit of $271 was demanded in addition to security of $427 provided through SUPERVALU’s participation in California’s Self-Insurer’s Security Fund. SUPERVALU appealed this demand. The California Self-Insurers’ Security Fund (the Fund) attempted to create a secured interest in certain assets of NAI for the total amount of the additional security deposit. The dispute with the Fund and the DIR was resolved through a settlement agreement as part of the NAI Banner Sale on March 21, 2013 and the primary obligation to the Fund and the DIR was retained by NAI following the NAI Banner Sale. Subsequent to the banner sale, NAI set up a fund of $75 to be used for the payment of future claims. In addition, NAI provided to the DIR a $225 letter of credit to secure any of the self-insurance workers’ compensation future obligations in excess of the $75 fund. The DIR also has filed a lien against the Jewel real estate assets.
Predicting the outcomes of claims and litigation and estimating related costs and exposures involves substantial uncertainties that could cause actual outcomes, costs and exposures to vary materially from current expectations. NAI regularly monitors its exposure to loss contingencies associated with these matters and may from time to time change its predictions with respect to outcomes and its estimates with respect to related costs and exposures. With respect to the pending matter discussed above, NAI believes the chance of a negative outcome is remote. It is possible, although management believes it is remote, that material differences in actual outcomes, costs and exposures relative to current predictions and estimates, or material changes in such predictions or estimates, could have a material adverse effect on NAI’s financial condition, results of operations or cash flows.
(14) Subsequent Events
During the fourth quarter of fiscal 2012, Parent entered into a stock purchase agreement to sell the operations of NAI, including the stores operating under the Acme, Albertsons, Jewel-Osco, Shaw’s, and Star Market banners and related Osco and Sav-On in-store pharmacies (collectively, the NAI Banners) to AB Acquisition LLC (ABA). ABA is an affiliate of a Cerberus Capital Management, L.P. (Cerberus)-led consortium which also includes Kimco Realty, Klaff Realty LP, Lubert-Adler Partners and Schottenstein Real Estate Group. Parent completed the sale of NAI for $203 in cash, including working capital adjustments, and the assumption by the buyer of certain debt and capital lease obligations of approximately $3,200.
NAI has evaluated subsequent events through April 24, 2013, which is the date that the consolidated financial statements of Parent were issued.
| F-190 | (Continued) |
Table of Contents
To the Board of Advisors
United Supermarkets, L.L.C.
Lubbock, Texas
Report on the Financial Statements
We have audited the accompanying financial statements of United Supermarkets, L.L.C. which comprise the balance sheets as of December 28, 2013 and January 26, 2013, and the related statements of comprehensive income, members’ equity and cash flows for the eleven-month period ended December 28, 2013 and the year ended January 26, 2013 and the related notes to the financial statements.
Management’s Responsibility for the Financial Statements
Management is responsible for the preparation and fair presentation of these financial statements in accordance with accounting principles generally accepted in the United States of America; this includes the design, implementation, and maintenance of internal control relevant to the preparation and fair presentation of financial statements that are free from material misstatement, whether due to fraud or error.
Auditor’s Responsibility
Our responsibility is to express an opinion on these financial statements based on our audits. We conducted our audits in accordance with auditing standards generally accepted in the United States of America. Those standards require that we plan and perform the audit to obtain reasonable assurance about whether the financial statements are free of material misstatement.
An audit involves performing procedures to obtain audit evidence about the amounts and disclosures in the financial statements. The procedures selected depend on the auditor’s judgment, including the assessment of the risks of material misstatement of the financial statements, whether due to fraud or error. In making those risk assessments, the auditor considers internal control relevant to the entity’s preparation and fair presentation of the financial statements in order to design audit procedures that are appropriate in the circumstances, but not for the purpose of expressing an opinion on the effectiveness of the entity’s internal control. Accordingly, we express no such opinion. An audit also includes evaluating the appropriateness of accounting policies used and the reasonableness of significant accounting estimates made by management, as well as evaluating the overall presentation of the financial statements.
We believe that the audit evidence we have obtained is sufficient and appropriate to provide a basis for our audit opinion.
Opinion
In our opinion, the financial statements referred to above present fairly, in all material respects, the financial position of United Supermarkets, L.L.C. as of December 28, 2013 and January 26, 2013, and the results of its operations and its cash flows for the eleven-month period ended December 28, 2013 and the year ended January 26, 2013 in accordance with accounting principles generally accepted in the United States of America.
/s/ RSM US LLP
Dallas, Texas
April 4, 2014
Member of the RSM International network of Independent accounting, tax and consulting firms.
F-191
Table of Contents
UNITED SUPERMARKETS, L.L.C.
(In thousands)
| December 28, 2013 |
January 26, 2013 |
|||||||
| Assets | ||||||||
| Current assets: |
||||||||
| Cash |
$ | 11,247 | $ | 10,595 | ||||
| Accounts receivable, net of allowance for doubtful accounts |
36,938 | 26,451 | ||||||
| Inventories |
90,589 | 88,608 | ||||||
| Prepaid expenses and other current assets |
3,700 | 3,213 | ||||||
| Deferred income taxes |
5,258 | 5,148 | ||||||
|
|
|
|
|
|||||
| Total current assets |
147,732 | 134,015 | ||||||
| Property and equipment, net |
209,648 | 184,732 | ||||||
| Other assets, net |
5,961 | 5,151 | ||||||
|
|
|
|
|
|||||
| Total assets |
$ | 363,341 | $ | 323,898 | ||||
|
|
|
|
|
|||||
| Liabilities and Members’ Equity | ||||||||
| Current liabilities: |
||||||||
| Current maturities of capital lease obligations |
$ | 2,477 | $ | 2,323 | ||||
| Current maturities of notes payable |
— | 1,755 | ||||||
| Accounts payable |
55,840 | 64,111 | ||||||
| Accrued payroll and team member benefits |
35,323 | 24,819 | ||||||
| Accrued expenses and other liabilities |
20,202 | 12,005 | ||||||
| Income taxes payable |
— | 6,540 | ||||||
|
|
|
|
|
|||||
| Total current liabilities |
113,842 | 111,553 | ||||||
| Capital lease obligations, net of current maturities |
4,785 | 7,055 | ||||||
| Notes payable, net of current maturities |
— | 88,183 | ||||||
| Deferred rent payable |
2,263 | 2,280 | ||||||
| Deferred income taxes |
17,611 | 15,194 | ||||||
| Other long-term liabilities |
7,016 | 13,810 | ||||||
|
|
|
|
|
|||||
| Total liabilities |
145,517 | 238,075 | ||||||
|
|
|
|
|
|||||
| Commitments and contingencies |
— | — | ||||||
| Members’ equity: |
||||||||
| Contributed capital |
127,988 | 223 | ||||||
| Accumulated other comprehensive loss |
(6,059 | ) | (11,436 | ) | ||||
| Undistributed earnings |
95,895 | 97,036 | ||||||
|
|
|
|
|
|||||
| Total members’ equity |
217,824 | 85,823 | ||||||
|
|
|
|
|
|||||
| Total liabilities and members’ equity |
$ | 363,341 | $ | 323,898 | ||||
|
|
|
|
|
|||||
See Notes to Financial Statements.
F-192
Table of Contents
Statements of Comprehensive Income
(In thousands)
| Eleven-Month Period Ended December 28, 2013 |
Year Ended January 26, 2013 |
|||||||
| Sales |
$ | 1,499,623 | $ | 1,572,653 | ||||
| Cost of merchandise sold: |
||||||||
| FIFO cost of merchandise |
1,126,603 | 1,189,767 | ||||||
| LIFO adjustment |
1,263 | 1,171 | ||||||
|
|
|
|
|
|||||
| Total cost of merchandise sold |
1,127,866 | 1,190,938 | ||||||
|
|
|
|
|
|||||
| Gross profit |
371,757 | 381,715 | ||||||
|
|
|
|
|
|||||
| Operating expenses: |
||||||||
| Compensation and team member benefits |
208,018 | 219,009 | ||||||
| Other operating and administrative |
89,813 | 91,231 | ||||||
| Transaction expense |
32,514 | — | ||||||
| Rent |
16,111 | 18,073 | ||||||
| Depreciation |
20,920 | 21,888 | ||||||
| Amortization of capital leases |
1,436 | 1,706 | ||||||
|
|
|
|
|
|||||
| Total operating expenses |
368,812 | 351,907 | ||||||
|
|
|
|
|
|||||
| Operating income |
2,945 | 29,808 | ||||||
| Interest expense, notes payable |
1,153 | 859 | ||||||
| Interest expense, capital leases |
683 | 929 | ||||||
|
|
|
|
|
|||||
| Income before provision for income taxes |
1,109 | 28,020 | ||||||
| Provision for income taxes |
1,661 | 10,055 | ||||||
|
|
|
|
|
|||||
| Net income (loss) |
(552 | ) | 17,965 | |||||
| Other comprehensive income (loss): |
||||||||
| Reduction (addition) of minimum pension liability, net of tax expense (benefit) of $2,895 and $(2,616), respectively |
5,377 | (4,859 | ) | |||||
|
|
|
|
|
|||||
| Comprehensive income |
$ | 4,825 | $ | 13,106 | ||||
|
|
|
|
|
|||||
See Notes to Financial Statements.
F-193
Table of Contents
Statements of Members’ Equity
(In thousands)
| Contributed Capital |
Accumulated Other Comprehensive Loss |
Undistributed Earnings |
Total | |||||||||||||
| Balance, January 28, 2012 |
$ | 223 | $ | (6,577 | ) | $ | 130,516 | $ | 124,162 | |||||||
| Net income |
— | — | 17,965 | 17,965 | ||||||||||||
| Addition of minimum pension liability |
— | (4,859 | ) | — | (4,859 | ) | ||||||||||
| Distributions |
— | — | (51,445 | ) | (51,445 | ) | ||||||||||
|
|
|
|
|
|
|
|
|
|||||||||
| Balance, January 26, 2013 |
223 | (11,436 | ) | 97,036 | 85,823 | |||||||||||
| Net loss |
— | — | (552 | ) | (552 | ) | ||||||||||
| Member contributions |
127,765 | — | — | 127,765 | ||||||||||||
| Reduction of minimum pension liability |
— | 5,377 | — | 5,377 | ||||||||||||
| Distributions |
— | — | (589 | ) | (589 | ) | ||||||||||
|
|
|
|
|
|
|
|
|
|||||||||
| Balance, December 28, 2013 |
$ | 127,988 | $ | (6,059 | ) | $ | 95,895 | $ | 217,824 | |||||||
|
|
|
|
|
|
|
|
|
|||||||||
See Notes to Financial Statements.
F-194
Table of Contents
Statements of Cash Flows
(In thousands)
| Eleven-Month Period Ended December 28, 2013 |
Year Ended January 26, 2013 |
|||||||
| Cash flows from operating activities: |
||||||||
| Net income (loss) |
$ | (552 | ) | $ | 17,965 | |||
| Adjustments to reconcile net income (loss) to net cash provided by operating activities: |
||||||||
| Depreciation and amortization |
26,365 | 27,480 | ||||||
| Gain on disposal of property and equipment |
(464 | ) | (296 | ) | ||||
| Deferred income taxes |
(588 | ) | (246 | ) | ||||
| Changes in assets and liabilities: |
||||||||
| Accounts receivable |
(10,487 | ) | (2,329 | ) | ||||
| Inventories |
(1,981 | ) | 126 | |||||
| Prepaid expenses and other current assets |
(487 | ) | 67 | |||||
| Other assets |
(909 | ) | (1,320 | ) | ||||
| Accounts payable |
(8,271 | ) | 8,162 | |||||
| Accrued payroll and team member benefits |
10,504 | 1,654 | ||||||
| Accrued expenses and other liabilities |
8,082 | (80 | ) | |||||
| Income taxes payable |
(6,540 | ) | 2,822 | |||||
| Deferred rent payable |
(17 | ) | (40 | ) | ||||
| Other long-term liabilities |
1,478 | 545 | ||||||
|
|
|
|
|
|||||
| Net cash provided by operating activities |
16,133 | 54,510 | ||||||
|
|
|
|
|
|||||
| Cash flows from investing activities: |
||||||||
| Purchases and/or construction of property and equipment |
(51,463 | ) | (38,291 | ) | ||||
| Proceeds from sales of property and equipment |
859 | 435 | ||||||
|
|
|
|
|
|||||
| Net cash used in investing activities |
(50,604 | ) | (37,856 | ) | ||||
|
|
|
|
|
|||||
| Cash flows from financing activities: |
||||||||
| Cash contributions from members |
127,765 | — | ||||||
| Cash distributions to members |
(589 | ) | (51,445 | ) | ||||
| Principal payments on capital lease obligations |
(2,116 | ) | (2,148 | ) | ||||
| Borrowings from notes payable |
2,259 | 52,626 | ||||||
| Payments on notes payable |
(74,696 | ) | (1,849 | ) | ||||
| Net payments on revolving line of credit |
(17,500 | ) | (14,200 | ) | ||||
|
|
|
|
|
|||||
| Net cash provided by (used in) financing activities |
35,123 | (17,016 | ) | |||||
|
|
|
|
|
|||||
| Net increase (decrease) in cash |
652 | (362 | ) | |||||
| Cash, beginning of year |
10,595 | 10,957 | ||||||
|
|
|
|
|
|||||
| Cash, end of year |
$ | 11,247 | $ | 10,595 | ||||
|
|
|
|
|
|||||
| Supplemental disclosures of cash flow information: |
||||||||
| Cash paid during the year for: |
||||||||
| Interest |
$ | 1,235 | $ | 1,151 | ||||
|
|
|
|
|
|||||
| Income taxes |
$ | 8,376 | $ | 7,380 | ||||
|
|
|
|
|
|||||
See Notes to Financial Statements.
F-195
Table of Contents
Notes to Financial Statements
(Dollars in thousands)
Note 1. Organization and Business
United Supermarkets, L.L.C. is a Texas limited liability company that operates a chain of 51 retail grocery stores and 26 fuel facilities that include 7 convenience stores and 19 convenience kiosks throughout Texas. United also operates two distribution centers, an ice manufacturing plant and a food manufacturing plant, all located in Lubbock, Texas, as well as a third distribution center located in Roanoke, Texas.
The Company was acquired by Albertson’s LLC on December 29, 2013. All of pre-existing notes payable were paid off. Expenses related to the transaction (primarily for employee compensation and advisory fees) for the eleven-month period ended December 28, 2013 were $32,514, which is recorded in the statement of comprehensive income.
These financial statements were prepared using the Company’s historical basis of accounting applicable to periods before the acquisition and therefore these financial statements do not reflect any change in accounting basis resulting from the acquisition.
Note 2. Summary of Significant Accounting Policies
Fiscal year: Prior to 2014, the Company’s fiscal year ended on the last Saturday of January. The eleven-month period ended December 28, 2013 consisted of 48 weeks and the fiscal year ended January 26, 2013 consisted of 52 weeks.
Accounts receivable: Accounts receivable are typically unsecured and are derived from revenues earned from the Company’s customers, third-party insurance carriers or vendors. The Company maintains an allowance for doubtful accounts based upon the expected collectability of all receivables. The allowance for doubtful accounts is based on management’s assessment of the collectability of specific customer accounts, the aging of the accounts receivable, historical experience, and other currently available evidence. The Company continually reviews its allowance for doubtful accounts. The allowance for doubtful accounts was $458 and $611 as of December 28, 2013 and January 26, 2013, respectively. Account balances are charged against the allowance after all collection efforts have been exhausted and the potential for recovery is considered remote.
Inventories: Inventories are valued at cost, which is not in excess of market, using the last-in, first-out (LIFO) method for grocery, dairy, frozen foods, pharmacy products, general merchandise, and health and beauty aids. The first-in, first-out (FIFO) method is used for other inventories, consisting primarily of meat, produce, and bakery products. The following is a summary of inventory at December 28, 2013 and January 26, 2013:
| December 28, 2013 |
January 26, 2013 |
|||||||
| Inventories recorded at LIFO |
$ | 59,820 | $ | 59,834 | ||||
| Inventories recorded at FIFO |
30,769 | 28,774 | ||||||
|
|
|
|
|
|||||
| Total inventories |
$ | 90,589 | $ | 88,608 | ||||
|
|
|
|
|
|||||
If inventories recorded at LIFO would have been valued on a FIFO basis, inventories would have been approximately $26,393 and $25,993 higher at December 28, 2013 and January 26, 2013, respectively.
| F-196 | (Continued) |
Table of Contents
UNITED SUPERMARKETS, L.L.C.
Notes to Financial Statements
(Dollars in thousands)
Property and equipment: Property and equipment are stated at cost. Depreciation is provided on a straight-line basis. Fixtures and equipment and transportation equipment are depreciated over lives ranging from 3 to 20 years. Capitalized leases (buildings and equipment) are amortized over the lives of the respective leases. Leasehold improvements are amortized over the lives of the respective leases or the service lives of the improvements, whichever is shorter. Buildings are depreciated over 20 or 30 years.
Maintenance, repairs and minor replacements are charged to expense as incurred; major replacements and betterments that extend asset lives are capitalized. The cost of assets sold, retired, or otherwise disposed of is removed from the accounts at the time of disposition, and any resulting gain or loss is reflected in income for the period. Total depreciation and amortization for the eleven-month period ended December 28, 2013 and for the year ended January 26, 2013, was approximately $26,365 and $27,480, including approximately $3,418 and $3,886, respectively, of depreciation allocated to cost of sales. Depreciation and amortization expense includes a portion related to capital leases, which was approximately $1,436 and $1,706 for the eleven-month period ended December 28, 2013 and for the year ended January 26, 2013, respectively. Property and equipment at December 28, 2013 and January 26, 2013 consisted of the following:
| December 28, 2013 |
January 26, 2013 |
|||||||
| Fixtures and equipment |
$ | 293,507 | $ | 273,829 | ||||
| Capitalized leases |
37,819 | 37,858 | ||||||
| Leasehold improvements |
70,420 | 63,128 | ||||||
| Land and buildings |
69,109 | 64,259 | ||||||
| Transportation equipment |
16,076 | 13,927 | ||||||
| Construction-in-progress |
16,966 | 4,170 | ||||||
|
|
|
|
|
|||||
| Total property and equipment |
503,897 | 457,171 | ||||||
| Less accumulated depreciation and amortization |
(294,249 | ) | (272,439 | ) | ||||
|
|
|
|
|
|||||
| Total property and equipment, net |
$ | 209,648 | $ | 184,732 | ||||
|
|
|
|
|
|||||
Long-lived assets: Long-lived assets held and used by the Company are reviewed for impairment whenever events or changes in circumstances indicate the carrying amount of an asset may not be recoverable from estimated future cash flows. Impairments, if any, are measured as the difference between the carrying value and the fair value of the related asset(s). Based on the Company’s analysis, there has been no impairment of long-lived assets as of December 28, 2013 and January 26, 2013.
Preopening store costs: Preopening store costs are expensed as incurred.
Company owned life insurance: The Company has purchased life insurance policies to fund possible retirement benefits for certain team members that have a nonqualified retirement plan with the Company. The cash surrender value of these policies is included in other assets in the Company’s balance sheets.
Income taxes: Deferred taxes are based on the estimated future tax effects of differences between the financial reporting and tax bases of assets and liabilities. For federal income tax purposes, the Company has elected to be taxed as a corporation.
| F-197 | (Continued) |
Table of Contents
UNITED SUPERMARKETS, L.L.C.
Notes to Financial Statements
(Dollars in thousands)
Revenue recognition: Revenue is recognized at the point of sale. Discounts provided to customers by the Company at the time of sale are recognized as a reduction in sales as the products are sold. Sales exclude sales taxes collected from customers.
Advertising costs: Advertising costs are expensed in the period that the related advertising services are provided. Advertising costs were $15,496 and $13,162 for the eleven-month period ended December 28, 2013 and for the year ended January 26, 2013, respectively, and are included in other operating and administrative expenses.
Comprehensive income: Comprehensive income is the change in equity of a business enterprise during a period from net income and other events, except activity resulting from investments by owners and distribution to owners. Other comprehensive income (loss) for the eleven-month period ended to December 28, 2013 and for the year ended January 26, 2013 resulted from pension activity, net of taxes.
Fair value of financial instruments: For certain of the Company’s financial instruments, including cash, accounts receivable, accounts payable, and accrued expenses, the carrying amounts approximate fair value due to their short maturities.
Concentration of credit risks: The Company maintains part of its cash in bank deposit accounts at financial institutions where balances, at times, may exceed the Federal Deposit Insurance Corporation (FDIC) insurance limitation. Historically, the Company has not experienced any losses due to such concentration of risk.
Use of estimates: The preparation of the financial statements requires management of the Company to make estimates and assumptions in conformity with U.S. generally accepted accounting principles relating to the reported amounts of assets and liabilities as of the date of the balance sheet and reported amounts of revenue and expenses during the reporting period. Actual results could differ from those estimates.
Subsequent events: Management evaluates events or transactions that occur after the balance sheet date for potential recognition or disclosure in the financial statements. Management has considered subsequent events through April 4, 2014.
| F-198 | (Continued) |
Table of Contents
UNITED SUPERMARKETS, L.L.C.
Notes to Financial Statements
(Dollars in thousands)
Note 3. Notes Payable
Notes payable consisted of the following:
| December 28, 2013 |
January 26, 2013 |
|||||||
| Note payable to a bank, $50,000, secured by all the assets of the Company and certain deposit accounts owned by Members; quarterly interest payments only; matures December 21, 2014; interest fixed at 1.75%, with a balloon payment of $50,000 at maturity. Paid in full on December 27, 2013. |
$ | — | $ | 50,000 | ||||
| Revolving line of credit with a bank, $50,000 available; secured by all assets of the Company; interest at 30-day London Interbank Offered Rate (“LIBOR”) plus 2.25%, (2.46% at January 26, 2013); due September 1, 2014. Paid in full on December 27, 2013. |
— | 17,500 | ||||||
| Note payable to a bank, secured by an airplane; monthly principal and interest payments at $80; matures November 15, 2015; interest at 3.69%. Paid in full on December 27, 2013. |
— | 2,581 | ||||||
| Note payable to a bank, secured by a property located in Roanoke, Texas; monthly principal and interest payment at $39; matures September 30, 2014; interest at 30-day LIBOR plus 1.0% (1.21% at January 26, 2013). Paid in full on December 27, 2013. |
— | 10,991 | ||||||
| Note payable to the McMillan Family Limited Company; secured by Post building; biannual principal and interest payments at $13; matures October 1, 2015; interest imputed at 6.25%. Paid in full on December 27, 2013. |
— | 125 | ||||||
| Note payable to a bank, $11,000, secured by land and building in Lubbock, Texas; interest only payments until April 15, 2013, then the commencement of the principal payments; matures on March 9, 2019; interest at 30-day LIBOR plus 2.0% (2.21% at January 26, 2013), with a balloon payment at maturity. Paid in full on December 27, 2013. |
— | 8,741 | ||||||
|
|
|
|
|
|||||
| — | 89,938 | |||||||
| Less current maturities |
— | (1,755 | ) | |||||
|
|
|
|
|
|||||
| $ | — | $ | 88,183 | |||||
|
|
|
|
|
|||||
Note 4. Lease Obligations
The Company leases certain of its operating facilities under terms ranging from five to twenty years, with renewal options ranging from five to twenty years. Most leases require the payment of fixed minimum rentals or a percentage of sales, whichever is greater.
| F-199 | (Continued) |
Table of Contents
UNITED SUPERMARKETS, L.L.C.
Notes to Financial Statements
(Dollars in thousands)
The following summarizes the future minimum lease payments under capital and operating lease obligations that have initial or remaining noncancelable lease terms in excess of one year at December 28, 2013:
| Capital Leases |
Operating Leases |
|||||||
| 2014 |
$ | 2,804 | $ | 21,503 | ||||
| 2015 |
2,264 | 20,824 | ||||||
| 2016 |
1,726 | 20,399 | ||||||
| 2017 |
445 | 20,056 | ||||||
| 2018 |
323 | 19,493 | ||||||
| Thereafter |
802 | 88,004 | ||||||
|
|
|
|
|
|||||
| Total minimum payments |
8,364 | $ | 190,279 | |||||
|
|
|
|||||||
| Less amount representing interest |
(1,102 | ) | ||||||
|
|
|
|||||||
| Present value of net minimum lease payments, including current portion of $2,477 |
$ | 7,262 | ||||||
|
|
|
|||||||
The components of rent expense were as follows:
| Eleven-Month Period Ended December 28, 2013 |
Year Ended January 26, 2013 |
|||||||
| Minimum rents |
$ | 15,387 | $ | 17,307 | ||||
| Contingent rents based on sales |
723 | 766 | ||||||
|
|
|
|
|
|||||
| $ | 16,110 | $ | 18,073 | |||||
|
|
|
|
|
|||||
Note 5. Related-Party Transactions
The Company leased three of its properties from HDS Properties, Inc. (the Related Company), a company affiliated with members of United, for the eleven-month period ended December 28, 2013 and for the year ended January 26, 2013. Rental payments to the Related Company for the eleven-month period ended December 28, 2013 and for the year ended January 26, 2013 were $278 and $304, respectively.
Certain assets of a distribution facility were purchased by the Company on July 29, 2007. The purchase price included a note payable to RC Taylor Distributing, Inc. (now Taylor Keeling, Inc.) of $4,200. Principal and interest payments to the related company for the year ended January 26, 2013 was $499. This note was paid off in the year ended January 26, 2013.
Note 6. Team Member Benefits
Defined benefit plan: Until November 2005, the Company sponsored a noncontributory defined benefit plan (the Plan) for all United team members who were at least 21 years of age and had completed 1,000 hours of service in any year of employment. In November 2005, the Board of Advisors amended the Plan to freeze benefit accruals effective March 31, 2006. Participants were
| F-200 | (Continued) |
Table of Contents
UNITED SUPERMARKETS, L.L.C.
Notes to Financial Statements
(Dollars in thousands)
credited for service after March 31, 2006, solely for vesting purposes pursuant to the terms of the Plan. The Company’s measurement date is December 31, 2013 and January 31, 2013, for the eleven-month period ended December 28, 2013 and for the year ended January 26, 2013, respectively. The Company is required to make annual contributions to the Plan equal to the amounts actuarially required to fund the prior service costs. The Company contributed $0 and $864 to the defined benefit plan for the eleven-month period ended December 28, 2013 and for the year ended January 26, 2013, respectively.
Net periodic pension costs included the following:
| Eleven-Month Period Ended December 28, 2013 |
Year Ended January 26, 2013 |
|||||||
| Interest expense on projected benefit obligations |
$ | 2,322 | $ | 2,570 | ||||
| Expected return on plan assets |
(2,755 | ) | (2,986 | ) | ||||
| Amortization of initial unrecognized net obligations |
987 | 450 | ||||||
|
|
|
|
|
|||||
| $ | 554 | $ | 34 | |||||
|
|
|
|
|
|||||
The amounts recorded in accumulated other comprehensive loss for the defined benefit plans consist of the following:
| Eleven-Month Period Ended December 28, 2013 |
Year Ended January 26, 2013 |
|||||||
| Net loss |
$ | 9,169 | $ | 17,441 | ||||
| Deferred income taxes |
(3,110 | ) | (6,005 | ) | ||||
|
|
|
|
|
|||||
| Accumulated other comprehensive loss |
$ | 6,059 | $ | 11,436 | ||||
|
|
|
|
|
|||||
The funded status of the Company’s defined benefit plan were as follows:
| Eleven-Month Period Ended December 28, 2013 |
Year Ended January 26, 2013 |
|||||||
| Funded status at the beginning of the year |
$ | (11,860 | ) | $ | (5,215 | ) | ||
| Interest cost |
(2,322 | ) | (2,570 | ) | ||||
| Actual return on assets |
2,755 | 1,644 | ||||||
| Actuarial gain (loss) |
7,285 | (6,583 | ) | |||||
| Employer contributions |
— | 864 | ||||||
|
|
|
|
|
|||||
| Funded status |
$ | (4,142 | ) | $ | (11,860 | ) | ||
|
|
|
|
|
|||||
Following is a summary of significant actuarial assumptions used:
| Eleven-Month Period Ended December 28, 2013 |
Year Ended January 26, 2013 |
|||||||
| Weighted-average discount rates |
5.00 | % | 5.25 | % | ||||
| Expected long-term rate of return on assets |
6.75 | % | 6.75 | % | ||||
| F-201 | (Continued) |
Table of Contents
UNITED SUPERMARKETS, L.L.C.
Notes to Financial Statements
(Dollars in thousands)
The Company expects net periodic pension income for 2014 to be approximately $580, using actuarial assumptions of a 5.00% discount rate and a 6.75% return on assets rate.
The accounting guidance for fair value measurements prioritizes the inputs used in measuring fair value into the following hierarchy:
| Level 1— | Quoted prices (unadjusted) in active markets for identical assets or liabilities. | |
| Level 2— | Inputs other than quoted prices included within Level 1 that are either directly or indirectly observable. | |
| Level 3— | Unobservable inputs in which little or no market activity exists, therefore requiring an entity to develop its own assumptions about the assumptions that market participants would use in pricing. | |
The following table sets forth, by level, the Plan’s assets at fair value:
| Level 1 | Level 2 | Level 3 | Total | |||||||||||||
| December 28, 2013: |
||||||||||||||||
| Cash and cash equivalents |
$ | 7,983 | $ | — | $ | — | $ | 7,983 | ||||||||
| U.S. government securities |
— | 8,591 | 8,591 | |||||||||||||
| Corporate bonds—investment grade |
— | 7,773 | — | 7,773 | ||||||||||||
| Corporate stocks—U.S. companies |
25,425 | — | — | 25,425 | ||||||||||||
|
|
|
|
|
|
|
|
|
|||||||||
| $ | 33,408 | $ | 16,364 | $ | — | $ | 49,772 | |||||||||
|
|
|
|
|
|
|
|
|
|||||||||
| January 26, 2013: |
||||||||||||||||
| Cash and cash equivalents |
$ | 6,312 | $ | — | $ | — | $ | 6,312 | ||||||||
| U.S. government securities |
— | 9,268 | — | 9,268 | ||||||||||||
| Corporate bonds—investment grade |
— | 7,467 | — | 7,467 | ||||||||||||
| Corporate stocks—U.S. companies |
22,643 | — | — | 22,643 | ||||||||||||
|
|
|
|
|
|
|
|
|
|||||||||
| $ | 28,955 | $ | 16,735 | $ | — | $ | 45,690 | |||||||||
|
|
|
|
|
|
|
|
|
|||||||||
The fair values of the Plan’s Level 1 assets are based on quoted market prices of the identical underlying security. The fair values of the Plan’s Level 2 assets are obtained from readily-available pricing sources for the identical underlying security that may not be actively traded. The Company utilizes a pricing service to assist in obtaining fair value pricing for the majority of the Plan assets. The Company conducts reviews on an annual basis to verify pricing, assess liquidity, and determine if significant inputs have changed that would impact the fair value hierarchy disclosure. During the eleven-month period ended December 28, 2013, the Plan did not make significant transfers between Level 1 and Level 2 assets. As of December 28, 2013 and January 26, 2013, the Plan did not have any significant Level 3 financial assets.
| F-202 | (Continued) |
Table of Contents
UNITED SUPERMARKETS, L.L.C.
Notes to Financial Statements
(Dollars in thousands)
The following table sets forth the Plan’s funded status and the amounts recognized in the Company’s balance sheets at:
| December 28, 2013 |
January 26, 2013 |
|||||||
| Accumulated benefit obligations |
$ | (53,914 | ) | $ | (57,550 | ) | ||
|
|
|
|
|
|||||
| Projected benefit obligations adjusted for services rendered to date |
$ | (53,914 | ) | $ | (57,550 | ) | ||
| Plan assets at fair value |
49,772 | 45,690 | ||||||
|
|
|
|
|
|||||
| Funded status |
$ | (4,142 | ) | $ | (11,860 | ) | ||
|
|
|
|
|
|||||
| Unrecognized actuarial loss |
$ | 9,169 | $ | 17,441 | ||||
|
|
|
|
|
|||||
The following table summarizes the targeted and actual asset allocation ranges of the Company’s plan, by asset category:
| Percentage of Pension Plan Assets as of |
||||||||
| December 28, 2013 |
January 26, 2013 |
|||||||
| Asset category: |
||||||||
| Equity securities |
51.08 | % | 49.56 | % | ||||
| Debt securities |
32.88 | % | 36.63 | % | ||||
| Other |
16.04 | % | 13.81 | % | ||||
|
|
|
|
|
|||||
| 100.00 | % | 100.00 | % | |||||
|
|
|
|
|
|||||
The Company considered several factors in developing the expected rate of return on plan assets based on input from external advisors. Individual asset class return forecasts were developed and tested for reasonableness based upon historical returns. The expected long-term rate of return is the weighted average of the target asset allocation of each asset class.
The pension plan assets are held in a pension trust and are managed by independent investment advisors with the objective of maximizing returns with a prudent level of risk. The target market value of equity securities is 50% of the plan assets. If the equity percentage exceeds 60% or drops below 40%, the asset allocation will be adjusted to the target.
The Plan paid benefits of $1,727 and $1,535 for the eleven-month period ended December 28, 2013 and for the year ended January 26, 2013, respectively.
Following is a summary of expected benefit payments during the calendar year ended:
| 2014 |
$ | 2,022 | ||
| 2015 |
2,040 | |||
| 2016 |
2,063 | |||
| 2017 |
2,178 | |||
| 2018 to 2023 |
16,017 | |||
|
|
|
|||
| $ | 24,320 | |||
|
|
|
| F-203 | (Continued) |
Table of Contents
UNITED SUPERMARKETS, L.L.C.
Notes to Financial Statements
(Dollars in thousands)
Defined contribution plan: The Company sponsors a defined contribution plan (the Contribution Plan) available to all eligible team members. On August 15, 2011, the Company amended certain terms of the Contribution Plan. Team members who are at least 21 years old, 20 1⁄2 years old (prior to August 15, 2011) and have one year (1,000 hours), six months (500 hours) (prior to August 15, 2011) of service as of the monthly enrollment dates are eligible to participate in the Contribution Plan. Each participant makes voluntary contributions to the Contribution Plan in amounts up to 80% (92% prior to August 15, 2011 and 5% for highly compensated employees as of January 1, 2012) of compensation or the dollar limit set by the IRS annually, whichever is less. For the Contribution Plan years ended December 31, 2012 and 2011, the Company contributed at the rate of 40%, as determined by the Board of Advisors, of the participants’ contributions up to 6% of compensation. The Company incurred expenses of approximately $1,564 and $1,446 for the eleven-month period ended December 28, 2013 and for the year ended January 26, 2013, respectively, for the purpose of funding the Company’s contribution.
In 2014 and 2013, the Board approved $4,000 and $4,800 in discretionary contributions, respectively, made to the Plan. For the eleven-month period ended December 28, 2013, a total of $3,700 of the total approved $4,000 had been expensed and recorded. Team members who are at least 21 years old (20 1⁄2 years old prior to August 15, 2012), have one year of service, worked at least 1,000 hours during the year and were employed at December 31, 2013 and 2012, respectively, shared in the discretionary contributions.
Nonqualified retirement plan: On June 1, 2011, the Company established a nonqualified retirement plan (the Supplemental Plan) for a selected group of management or highly compensated employees. The Supplemental Plan is a plan which provides benefits beyond the Internal Revenue Code limits for qualified defined contribution plans. The plan permits employees to elect contributions up to a maximum percentage at 80% of eligible compensation. The Company may make voluntary matching contributions, which are determined by the Board annually. Employee contributions and the related investment income vest immediately. Discretionary company contributions vest immediately. Company matching contributions, if applicable, are subject to vesting based on years of service. The vested portion of employees’ accounts in the Supplemental Plan will be distributed upon termination of employment in either a lump sum or in equal annual installments over a specified period of up to 5 years. Total expense recognized related to the Supplemental Plan was $890 and $730 for the eleven-month period ended December 28, 2013 and for the year ended January 26, 2013, respectively.
The Company elected to account for this cash balance plan based on the participant account balances, excluding actuarial considerations as permitted by the applicable authoritative guidance.
| F-204 | (Continued) |
Table of Contents
UNITED SUPERMARKETS, L.L.C.
Notes to Financial Statements
(Dollars in thousands)
The annual activity for the Company’s Supplemental Plan was as follows:
| Eleven-Month Period Ended December 28, 2013 |
Year Ended January 26, 2013 |
|||||||
| Balance, beginning of period |
$ | 1,641 | $ | 397 | ||||
| Contributions: |
||||||||
| Employee |
343 | 521 | ||||||
| Company |
538 | 584 | ||||||
| Investment income |
352 | 146 | ||||||
| Distribution |
— | (7 | ) | |||||
| Forfeitures |
— | — | ||||||
|
|
|
|
|
|||||
| Balance, end of period |
$ | 2,874 | $ | 1,641 | ||||
|
|
|
|
|
|||||
The above-mentioned balances for the eleven-month period ended December 28, 2013 and for the year ended January 26, 2013, are included in other long-term liabilities on the consolidated balance sheets.
Note 7. Income Taxes
The provision (benefit) for income taxes included the following:
| Eleven-Month Period Ended December 28, 2013 |
Year Ended January 26, 2013 |
|||||||
| Federal: |
||||||||
| Current |
$ | 1,252 | $ | 9,220 | ||||
| Deferred |
(588 | ) | (85 | ) | ||||
|
|
|
|
|
|||||
| Total provision for income taxes—federal |
664 | 9,135 | ||||||
| State: |
||||||||
| Current |
997 | 920 | ||||||
|
|
|
|
|
|||||
| Total provision for income taxes |
$ | 1,661 | $ | 10,055 | ||||
|
|
|
|
|
|||||
The provision for income taxes differs from amounts computed at the statutory rate as follows:
| Eleven-Month Period Ended December 28, 2013 |
Year Ended January 26, 2013 |
|||||||
| Federal income taxes at statutory federal income tax rate |
35.0 | % | 35.0 | % | ||||
| State income tax, net of federal income tax benefit |
58.4 | % | 2.1 | % | ||||
| Other |
56.4 | % | (1.2 | %) | ||||
|
|
|
|
|
|||||
| Effective tax rate |
149.8 | % | 35.9 | % | ||||
|
|
|
|
|
|||||
As of February 1, 2009, the Company adopted guidance related to the accounting for uncertainties in income taxes. This guidance addresses the determination of whether tax benefits
| F-205 | (Continued) |
Table of Contents
UNITED SUPERMARKETS, L.L.C.
Notes to Financial Statements
(Dollars in thousands)
claimed or expected to be claimed on a tax return should be recorded in the financial statements. The tax benefit from an uncertain tax position may be recognized only if it is more likely than not that the tax position will be sustained on examination by the taxing authorities. The determination is based on the technical merits of the position and presumes that each uncertain tax position will be examined by the relevant taxing authority that has full knowledge of all relevant information. Management evaluated the Company’s tax positions and concluded that the Company had taken no uncertain tax positions that require adjustment of the financial statements. The Company classifies interest, and, if applicable, penalties related to income tax liabilities as a component of income tax expense. During the eleven-month period ended December 28, 2013, the Company did not incur any interest and penalties. The Company is not subject to income tax examinations by the U.S. federal authorities for years prior to 2010 and state or local tax authorities for years prior to 2009.
The following is a summary of the significant components of the Company’s net deferred tax asset and liability:
| Eleven-Month Period Ended December 28, 2013 |
Year Ended January 26, 2013 |
|||||||
| Current deferred taxes: |
||||||||
| Assets (liabilities): |
||||||||
| Accrued vacation |
$ | 2,173 | $ | 2,178 | ||||
| Texas franchise tax |
342 | 941 | ||||||
| Workers’ injury and general liability insurance |
723 | 795 | ||||||
| Uniform capitalization adjustment |
585 | 672 | ||||||
| Nonqualified deferred compensation plans |
1,006 | 641 | ||||||
| Contribution carryover |
630 | 528 | ||||||
| Other |
770 | 315 | ||||||
| Volume discounts |
(971 | ) | (922 | ) | ||||
|
|
|
|
|
|||||
| Net current deferred tax asset |
5,258 | 5,148 | ||||||
|
|
|
|
|
|||||
| Noncurrent deferred taxes: |
||||||||
| Assets (liabilities): |
||||||||
| Capitalized leases |
509 | 790 | ||||||
| Postretirement benefit plan |
1,658 | 4,364 | ||||||
| Other |
(206 | ) | (275 | ) | ||||
| Property and equipment |
(19,572 | ) | (20,073 | ) | ||||
|
|
|
|
|
|||||
| Net noncurrent deferred tax liability |
(17,611 | ) | (15,194 | ) | ||||
|
|
|
|
|
|||||
| Total net deferred tax liability |
$ | (12,353 | ) | $ | (10,046 | ) | ||
|
|
|
|
|
|||||
Note 8. Commitments and Contingencies
The Company is a party to various legal proceedings and complaints arising in the ordinary course of business, some of which are covered by insurance. Management believes that claims or contingencies that are not covered by insurance are not material to the financial position or operations of the Company. Additionally, under the terms of its workers’ injury and general liability insurance policies, the Company is liable for certain retrospective losses. The Company’s liability for retrospective
| F-206 | (Continued) |
Table of Contents
UNITED SUPERMARKETS, L.L.C.
Notes to Financial Statements
(Dollars in thousands)
losses is limited to a maximum per claim and per policy year. The Company’s liability for workers’ injury and general liability claims was approximately $2,135 and $2,342 for the eleven-month period ended December 28, 2013 and for the year ended January 26, 2013, respectively. These liabilities were determined using historical data and are reflected in accrued payroll and team member benefits and accrued expenses and other liabilities in the accompanying balance sheets.
The Company is self-insured for medical, dental, and short-term disability claims. The Company’s liability for self-insured losses is limited to a maximum per claim and to an aggregate amount for total self-insured losses in each year through the use of third-party stop-loss insurance coverage. The Company’s liability for health insurance was approximately $754 and $796 for the eleven-month period ended December 28, 2013 and for the year ended January 26, 2013, respectively and was recorded in accrued payroll and team member benefits in the accompanying balance sheets.
| F-207 |
Table of Contents
Table of Contents
65,306,122 Shares
Albertsons Companies, Inc.
Common Stock
PRELIMINARY PROSPECTUS
| Goldman, Sachs & Co. | BofA Merrill Lynch | Citigroup | Morgan Stanley |
| Deutsche Bank Securities | Credit Suisse | Barclays |
| Lazard | Guggenheim Securities | Jefferies | RBC Capital Markets | Wells Fargo Securities |
| BMO Capital Markets | SunTrust Robinson Humphrey | |
| Telsey Advisory Group | Academy Securities | Ramirez & Co., Inc. | Blaylock Beal Van, LLC | |||
Until (25 days after the date of this prospectus), all dealers that buy, sell, or trade shares of our common stock, whether or not participating in our initial public offering, may be required to deliver a prospectus. This delivery requirement is in addition to the obligation of dealers to deliver a prospectus when acting as underwriters and with respect to their unsold allotments or subscriptions.
Table of Contents
PART II
INFORMATION NOT REQUIRED IN PROSPECTUS
Item 13. Other Expenses of Issuance and Distribution.
The following table shows the costs and expenses, other than underwriting discounts and commissions, payable in connection with the sale and distribution of the securities being registered. Except as otherwise noted, we will pay all of these amounts. All amounts except the SEC registration fee, the NYSE listing fee and the FINRA filing fee are estimated.
| SEC Registration Fee |
$ | 226,899 | ||
| NYSE Listing Fee |
250,000 | |||
| FINRA Filing Fee |
225,500 | |||
| Accounting Fees and Expenses |
3,500,000 | |||
| Legal Fees and Expenses |
5,250,000 | |||
| Printing Fees and Expenses |
950,000 | |||
| Blue Sky Fees and Expenses |
15,000 | |||
| Miscellaneous |
2,582,601 | |||
|
|
|
|||
| Total |
$ | 13,000,000 | ||
|
|
|
Item 14. Indemnification of Directors and Officers
Section 145 of the DGCL authorizes a court to award, or a corporation’s board of directors to grant, indemnity to directors and officers under certain circumstances and subject to certain limitations. The terms of Section 145 of the DGCL are sufficiently broad to permit indemnification under certain circumstances for liabilities, including reimbursement of expenses incurred, arising under the Securities Act.
As permitted by the DGCL, the Registrant’s certificate of incorporation that will be in effect at the closing of the offering contains provisions that eliminate the personal liability of its directors for monetary damages for any breach of fiduciary duties as a director.
As permitted by the DGCL, the Registrant’s bylaws that will be in effect at the closing of the offering provide that:
| • | the Registrant is required to indemnify its directors and executive officers to the fullest extent permitted by the DGCL, subject to very limited exceptions; |
| • | the Registrant may indemnify its other employees and agents as set forth in the DGCL; |
| • | the Registrant is required to advance expenses, as incurred, to its directors and executive officers in connection with a legal proceeding to the fullest extent permitted by the DGCL, subject to very limited exceptions; and |
| • | the rights conferred in the bylaws are not exclusive. |
The Registrant has entered, and intends to continue to enter, into separate indemnification agreements with its directors and executive officers to provide these directors and executive officers additional contractual assurances regarding the scope of the indemnification set forth in the Registrant’s certificate of incorporation and bylaws and to provide additional procedural protections. At present, there is no pending litigation or proceeding involving a director or executive officer of the
II-1
Table of Contents
Registrant regarding which indemnification is sought. Reference is also made to the underwriting agreement to be filed as Exhibit 1.1 to this registration statement, which provides for the indemnification of executive officers, directors and controlling persons of the Registrant against certain liabilities. The indemnification provisions in the Registrant’s certificate of incorporation, bylaws and the indemnification agreements entered into or to be entered into between the Registrant and each of its directors and executive officers may be sufficiently broad to permit indemnification of the Registrant’s directors and executive officers for liabilities arising under the Securities Act. The Registrant currently carries liability insurance for its directors and officers.
Item 15. Recent Sales of Unregistered Securities.
Set forth below is information regarding all unregistered securities sold, issued or granted by us within the past three years.
In connection with our acquisition of NAI on March 21, 2013:
(1) We effected a unit split pursuant to which each Class A Unit outstanding was reclassified into 1 Class A ABS Unit and 1 Class A NAI Unit.
(2) We effected a unit split pursuant to which each Class B Unit outstanding was reclassified into 1 Class B ABS Unit and 1 Class B NAI Unit.
(3) We issued and sold Class A ABS Units for an aggregate purchase price of $150,000,000 as follows: 314.293 Class A ABS Units to Cerberus Iceberg LLC, 122.324 Class A ABS Units to KRS AB Acquisition, LLC, 122.324 Class A ABS Units to Jubilee Symphony ABS LLC, 122.324 Class A ABS Units to A-S Klaff Equity, LLC, 59.838 Class A ABS Units to ALB2 VI, LLC, 16.967 Class A ABS Units to ALB2 VI-A, LLC, 45.520 Class A ABS Units to ALB2 VI-B, LLC and a total of 18.076 Class A ABS Units to members of our management team and other officers and employees.
(4) We issued and sold 1701.666 Class A NAI Units to NAI Group Holdings Inc. for a purchase price of $100,000,000.
(5) We granted an aggregate of 103.186 Class C Units to certain of our executives under our Class C Plan. Class C Units were granted as profits interests which participate in distributions once a specified amount of distributions have been made to our equityholders.
In connection with our acquisition of Safeway Inc. and its subsidiaries on January 30, 2015:
(1) We effected a unit split pursuant to which 1701.666 Class A ABS Units and 106 Class B ABS Units were reclassified into an aggregate of 127,799,410 ABS Units.
(2) We effected a unit split pursuant to which 1701.666 Class A NAI Units and 106 Class B NAI Units were reclassified into an aggregate of 127,799,410 NAI Units.
(3) We effected a unit split pursuant to which 103.186 Class C Units were reclassified into an aggregate of 2,641,428 ABS Units and 2,641,428 NAI Units.
(4) We issued and sold 169,559,162 ABS Units, 169,559,162 NAI Units and 300,000,000 SWY Units for an aggregate purchase price of $1,304,796,135 plus the contribution to the company of NAI Units by certain equityholders as follows: 63,531,450 ABS Units to Cerberus Iceberg LLC, 24,726,729 ABS Units to Jubilee ABS Holding LLC, 24,726,729 ABS Units to Klaff Markets Holdings LLC, 24,726,729 ABS Units to Lubert-Adler SAN Aggregator, L.P., 24,726,729 ABS Units to ABS TRS Corp., 162,720,981 NAI Units to NAI Group Holdings Inc., 282,879,747 SWY Units to Safeway Group Holdings Inc. and a total of 7,120,883 ABS Units, 17,120,253 SWY Units and 1,244,486 NAI Units to members of our management team.
II-2
Table of Contents
(5) We granted 3,350,083 Series 1 Incentive Units to Robert Edwards, our former president and chief executive officer, under our Incentive Unit Plan. Series 1 Incentive Units were granted as profits interests which participate in distributions once a specified amount of distributions have been made to our equityholders. On April 9, 2015, Mr. Edward’s grant was reduced by mutual agreement to 1,675,041.5 Series 1 Incentive Units.
(6) We granted an aggregate of 14,907,871 Investor Incentive Units as follows: 10,050,251 Investor Incentive Units to Cerberus AB Incentive LLC, 376,884 Investor Incentive Units to ABS TRS Corp., 376,884 Investor Incentive Units to Jubilee ABS Holding LLC, 376,884 Investor Incentive Units to Klaff W LLC, 376,884 Investor Incentive Units to L-A Asset Management Services, LLC and 3,350,084 Investor Incentive Units to Robert G. Miller. Investor Incentive Units were granted as profits interests which participate in distributions once a specified amount of distributions have been made to our equityholders.
On March 5, 2015, May 15, 2015, June 16, 2015, and August 12, 2015, we granted 14,440,000, 150,000, 125,000, and 100,000 Phantom Units, respectively, to certain of our officers, executives, directors and consultants under our Phantom Unit Plan. Each Phantom Unit is generally subject to time- and performance-based vesting, and upon vesting, each Phantom Unit converts into one Series 1 Incentive Unit.
In connection with the IPO-Related Transactions, and immediately prior to the effectiveness of this registration statement, we issued 349,832,761 shares of common stock to Albertsons Investor, 3,570,701 shares of common stock to Management Holdco and 56,429,497 shares of common stock to Kimco. For a description of the transactions pursuant to which the shares were issued, see the information under the heading “IPO-Related Transactions and Organizational Structure.”
Unless otherwise stated, the sales and/or granting of the above securities were deemed to be exempt from registration under the Securities Act in reliance upon Section 4(a)(2) of the Securities Act (or Regulation D promulgated thereunder), or Rule 701 promulgated under Section 3(b) of the Securities Act as transactions by an issuer not involving any public offering or pursuant to benefit plans and contracts relating to compensation as provided under Rule 701. We did not pay or give, directly or indirectly, any commission or other remuneration, including underwriting discounts or commissions, in connection with any of the issuances of securities listed above. The recipients of the securities in each of these transactions represented their intentions to acquire the securities for investment only and not with a view to or for sale in connection with any distribution thereof. All recipients had adequate access, through their employment or other relationship with us or through other access to information provided by us, to information about us. The sales of these securities were made without any general solicitation or advertising.
II-3
Table of Contents
Item 16. Exhibits and Financial Statement Schedules
| Exhibit No. |
Exhibit Description | |
| 1.1**** | Form of Underwriting Agreement among Albertsons Companies, Inc. and the Underwriters | |
| 3.1*** | Certificate of Incorporation of Albertsons Companies, Inc., including Amendment of Certificate of Incorporation, dated September 21, 2015 | |
| 3.2** | Form of Bylaws of Albertsons Companies, Inc. | |
| 4.1*** | Form of Stockholders Agreement by and among Albertsons Companies, Inc., Albertsons Investor Holdings LLC, KRS AB Acquisition, LLC, KRS ABS, LLC and Albertsons Management Holdco, LLC | |
| 4.2* | Indenture, dated September 10, 1997, between Safeway Inc., and the Bank of New York, as trustee | |
| 4.3* | Forms of Officers’ Certificates establishing the terms of Safeway Inc.’s 3.40% Notes due 2016 and 4.75% Notes due 2021, including the forms of Notes | |
| 4.4* | Form of Officers’ Certificate establishing the terms of Safeway Inc.’s 6.35% Notes due 2017, including the form of Notes | |
| 4.5* | Form of Officers’ Certificate establishing the terms of Safeway Inc.’s 5.00% Notes due 2019, including the form of Notes | |
| 4.6* | Form of Officers’ Certificate establishing the terms of Safeway Inc.’s 3.95% Notes due 2020, including the form of Notes | |
| 4.7* | Form of Officers’ Certificate establishing the terms of Safeway Inc.’s 7.45% Senior Debentures due 2027, including the form of Notes | |
| 4.8* | Form of Officers’ Certificate establishing the terms of Safeway Inc.’s 7.25% Debentures due 2031, including the form of Notes | |
| 4.9* | Supplemental Indenture dated as of October 6, 2014, between Safeway Inc. and The Bank of New York Mellon Trust Company, National Association, as trustee, under the Indenture, dated as of September 10, 1997, as amended, and supplemented, with respect to Safeway Inc.’s 3.40% Notes due 2016 | |
| 4.10* | Supplemental Indenture dated as of October 8, 2014, between Safeway Inc. and The Bank of New York Mellon Trust Company, National Association, as trustee, under the Indenture, dated as of September 10, 1997, as amended, and supplemented, with respect to Safeway Inc.’s 6.35% Notes due 2017 | |
| 4.11* | Indenture, dated October 23, 2014, by and among Albertson’s Holdings LLC and Safeway Inc. (as successor by merger to Saturn Acquisition Merger Sub, Inc.) (collectively, the “Issuers”), certain subsidiaries of the Issuers, as guarantors and Wilmington Trust, National Association, as trustee and collateral agent | |
| 4.12* | Indenture, dated May 1, 1992, between New Albertson’s, Inc. (as successor to Albertson’s, Inc.) and U.S. Bank Trust National Association (as successor to Morgan Guaranty Trust Company of New York), as trustee (as supplemented by Supplemental Indenture No. 1, dated as of May 7, 2004; Supplemental Indenture No. 2, dated as of June 1, 2006; and Supplemental Indenture No. 3, dated as of December 29, 2008) | |
| 4.13* | Indenture, dated May 1, 1995, between American Stores Company, LLC and Wells Fargo Bank, National Association (as successor to The First National bank of Chicago), as trustee (as further supplemented) | |
| 5.1**** | Opinion of Schulte Roth & Zabel LLP | |
II-4
Table of Contents
| Exhibit No. |
Exhibit Description | |
| 10.1* | Second Amended and Restated Term Loan Agreement, dated August 25, 2014 and effective January 30, 2015, by and among Albertson’s LLC, Safeway Inc. (as successor by merger to Saturn Acquisition Merger Sub, Inc.) and the other co-borrowers, as borrowers, Albertsons’s Holdings LLC and the other guarantors from time to time thereto, as guarantors, the lenders from time to time thereto, and Credit Suisse AG, Cayman Islands Branch, as administrative and collateral agent | |
| 10.2* | Amended and Restated Asset-Based Revolving Credit Agreement, dated January 30, 2015, by and among Albertson’s LLC, Safeway Inc. (as successor by Merger to Saturn Acquisition Merger Sub, Inc.) and the other co-borrowers, as borrowers, Albertson’s Holdings LLC and the other guarantors from time to time party thereto, as guarantors, the lenders from time to time party thereto and Bank of America N.A., as administrative and collateral agent | |
| 10.3* | Term Loan Agreement, dated June 27, 2014, by and among New Albertson’s, Inc., NAI Holdings LLC, and the other guarantors from time to time party thereto, the lenders from time to time party thereto, and Citibank, N.A., as administrative and collateral agent | |
| 10.4* | Amendment No. 2 to the Asset-Based Revolving Credit Agreement, dated January 24, 2014, by and among New Albertson’s, Inc., NAI Holdings LLC, the other borrowers from time to time, the guarantors from time to time party thereto, the lenders from time to time party thereto and Bank of America, N.A., as administrative and collateral agent | |
| 10.5* | Amended and Restated Letter of Credit Facility Agreement, dated as of January 24, 2014, by and among New Albertson’s, Inc. and Bank of America, N.A. | |
| 10.6* | Casa Ley Contingent Value Rights Agreement, dated January 30, 2015, by and among AB Acquisition LLC, Safeway Inc., the Shareholder Representative, as defined therein, and Computershare Inc. and Computershare Trust Company, N.A., as Rights Agent | |
| 10.7*† | Transition Services Agreement, dated March 21, 2013 between SuperValu Inc. and Albertson’s LLC | |
| 10.8*† | Transition Services Agreement, dated March 21, 2013 between SuperValu Inc. and New Albertson’s, Inc. | |
| 10.9* | Letter Agreement, dated April 16, 2015, to each of the Transition Services Agreements between SUPERVALU INC. and New Albertson’s, Inc. dated March 21, 2013, and the Transition Services Agreement between SUPERVALU INC. and Albertson’s LLC dated March 21, 2013 | |
| 10.10* | Decision and Order, dated January 27, 2015, between the Federal Trade Commission, Cerberus Institutional Partners V, L.P., AB Acquisition LLC and Safeway Inc. | |
| 10.11*** | Form of Albertsons Companies, Inc. 2015 Equity and Incentive Award Plan | |
| 10.12*** | Form of Albertsons Companies, Inc. Executive Incentive Bonus Plan | |
| 10.13*** | Albertsons Companies, Inc. Restricted Stock Unit Plan | |
| 10.14*** | Form of Restricted Stock Unit Award Agreement under the Albertsons Companies, Inc. Restricted Stock Unit Plan | |
| 10.15*** | Form of Indemnification Agreement | |
| 10.16*** | Employment Agreement, dated September 21, 2015, among Albertsons Companies, Inc., Robert Miller and, solely for purpose of the third paragraph thereof, AB Acquisition LLC | |
| 10.17*** | Employment Agreement, dated September 21, 2015, among Albertsons Companies, Inc., Robert Dimond and, solely for purpose of Section 9.8 thereof, AB Management Services Corp. | |
II-5
Table of Contents
| Exhibit No. |
Exhibit Description | |
| 10.18*** | Employment Agreement, dated September 21, 2015, among Albertsons Companies, Inc., Justin Dye and, solely for the purpose of Section 9.8 thereof, New Albertson’s, Inc. | |
| 10.19*** | Letter Agreement, dated September 18, 2015, between Albertsons Companies, Inc. and Shane Sampson | |
| 10.20*** | Letter Agreement dated September 18, 2015, between Albertsons Companies, Inc. and Wayne A. Denningham | |
| 10.21*** | Letter Agreement, dated September 21, 2015, between Albertsons Companies, Inc. and Sharon Allen | |
| 10.22*** | Letter Agreement, dated September 21, 2015, between Albertsons Companies, Inc. and Steven A. Davis | |
| 10.23** | Form of Limited Liability Company Agreement of Albertsons Investor Holdings LLC, by and among Cerberus Iceberg LLC, Cerberus Capital Management, L.P., Jubilee ABS Holding LLC, Klaff Markets Holdings LLC, Klaff-W LLC, Lubert-Adler SAN Aggregator, L.P., L-A Asset Management Services, LLC, Robert G. Miller, Robert Edwards, and the Persons listed on Schedule A thereto. | |
| 21.1** | Schedule of Subsidiaries of Albertsons Companies, Inc. | |
| 23.1**** | Consent of Schulte Roth & Zabel LLP (included in Exhibit 5.1) | |
| 23.2***** | Consent of Deloitte & Touche LLP, Independent Registered Public Accounting Firm | |
| 23.3***** | Consent of Deloitte & Touche LLP, Independent Registered Public Accounting Firm | |
| 23.4***** | Consent of Deloitte & Touche LLP, Independent Registered Public Accounting Firm | |
| 23.5***** | Consent of KPMG LLP, Independent Public Accounting Firm | |
| 23.6***** | Consent of RSM US LLP, Independent Auditor | |
| 23.7***** | Consent of Cushman & Wakefield, Inc. | |
| 24.1* | Powers of Attorney (included on signature pages of this Registration Statement) | |
| * | Previously filed on July 8, 2015 |
| ** | Previously filed on August 26, 2015 |
| *** | Previously filed on September 24, 2015 |
| **** | Previously filed on October 2, 2015 |
| ***** | Filed herewith |
| † | Confidential treatment has been requested for certain information contained in this exhibit. Such information has been omitted and filed separately with the SEC. |
Item 17. Undertakings
The undersigned registrant hereby undertakes to provide to the underwriter at the closing specified in the underwriting agreements, certificates in such denominations and registered in such names as required by the underwriter to permit prompt delivery to each purchaser.
Insofar as indemnification for liabilities arising under the Securities Act of 1933 may be permitted to directors, officers and controlling persons of the registrant pursuant to the foregoing provisions, or otherwise, the registrant has been advised that in the opinion of the Securities and Exchange Commission such indemnification is against public policy as expressed in the Securities Act and is, therefore, unenforceable. In the event that a claim for indemnification against such liabilities (other than the payment by the registrant of expenses incurred or paid by a director, officer or controlling person of the registrant in the successful defense of any action, suit or proceeding) is asserted by such director,
II-6
Table of Contents
officer or controlling person in connection with the securities being registered, the registrant will, unless in the opinion of its counsel the matter has been settled by controlling precedent, submit to a court of appropriate jurisdiction the question whether such indemnification by it is against public policy as expressed in the Securities Act and will be governed by the final adjudication of such issue.
The undersigned registrant hereby undertakes that:
(1) For purposes of determining any liability under the Securities Act of 1933, the information omitted from the form of prospectus filed as part of this registration statement in reliance upon Rule 430A and contained in a form of prospectus filed by the registrant pursuant to Rule 424(b)(1) or (4) or 497(h) under the Securities Act shall be deemed to be part of this registration statement as of the time it was declared effective.
(2) For the purpose of determining any liability under the Securities Act of 1933, each post-effective amendment that contains a form of prospectus shall be deemed to be a new registration statement relating to the securities offered therein, and the offering of such securities at that time shall be deemed to be the initial bona fide offering thereof.
Pursuant to the requirements of the Securities Act of 1933, the registrant has duly caused this registration statement to be signed on its behalf by the undersigned, thereunto duly authorized, in the City of New York, State of New York, on November 23, 2015.
| Albertsons Companies, Inc. | ||
| By: | /s/ Robert G. Miller | |
| Name: | Robert G. Miller | |
| Title: | Chairman of the Board of Directors and Chief Executive Officer (Principal Executive Officer) | |
Pursuant to the requirements of the Securities Act of 1933, this registration statement has been signed by the following persons in the capacities and on the dates indicated.
| Signature |
Title |
Date | ||
| /s/ Robert G. Miller Robert G. Miller |
Chairman of the Board of Directors and Chief Executive Officer (Principal Executive Officer) | November 23, 2015 | ||
| /s/ Robert B. Dimond Robert B. Dimond |
Executive Vice President and Chief Financial Officer (Principal Financial Officer) | November 23, 2015 | ||
| /s/ Robert B. Larson Robert B. Larson |
Senior Vice President, Chief Accounting Officer (Principal Accounting Officer) | November 23, 2015 | ||
| /s/ * Dean S. Adler |
Director | November 23, 2015 | ||
| /s/ * Sharon L. Allen |
Director | November 23, 2015 | ||
| /s/ * Steven A. Davis |
Director | November 23, 2015 | ||
II-7
Table of Contents
| Signature |
Title |
Date | ||
| /s/ * Kim Fennebresque |
Director | November 23, 2015 | ||
| /s/ * Lisa A. Gray |
Director | November 23, 2015 | ||
| /s/ * Hersch Klaff |
Director | November 23, 2015 | ||
| /s/ * Ronald Kravit |
Director |
November 23, 2015 | ||
| /s/ * Alan Schumacher |
Director |
November 23, 2015 | ||
| /s/ * Jay L. Schottenstein |
Director |
November 23, 2015 | ||
| /s/ * Lenard B. Tessler |
Director |
November 23, 2015 | ||
| /s/ * Scott Wille |
Director |
November 23, 2015 | ||
| * By | /s/ Robert B. Dimond |
|||||
| Attorney-in-Fact |
II-8
Table of Contents
| Exhibit No. |
Exhibit Description | |
| 1.1**** | Form of Underwriting Agreement among Albertsons Companies, Inc. and the Underwriters | |
| 3.1*** | Certificate of Incorporation of Albertsons Companies, Inc., including Amendment of Certificate of Incorporation, dated September 21, 2015 | |
| 3.2** | Form of Bylaws of Albertsons Companies, Inc. | |
| 4.1*** | Form of Stockholders Agreement by and among Albertsons Companies, Inc., Albertsons Investor Holdings LLC, KRS AB Acquisition, LLC, KRS ABS, LLC and Albertsons Management Holdco, LLC | |
| 4.2* | Indenture, dated September 10, 1997, between Safeway Inc., and the Bank of New York, as trustee | |
| 4.3* | Forms of Officers’ Certificates establishing the terms of Safeway Inc.’s 3.40% Notes due 2016 and 4.75% Notes due 2021, including the forms of Notes | |
| 4.4* | Form of Officers’ Certificate establishing the terms of Safeway Inc.’s 6.35% Notes due 2017, including the form of Notes | |
| 4.5* | Form of Officers’ Certificate establishing the terms of Safeway Inc.’s 5.00% Notes due 2019, including the form of Notes | |
| 4.6* | Form of Officers’ Certificate establishing the terms of Safeway Inc.’s 3.95% Notes due 2020, including the form of Notes | |
| 4.7* | Form of Officers’ Certificate establishing the terms of Safeway Inc.’s 7.45% Senior Debentures due 2027, including the form of Notes | |
| 4.8* | Form of Officers’ Certificate establishing the terms of Safeway Inc.’s 7.25% Debentures due 2031, including the form of Notes | |
| 4.9* | Supplemental Indenture dated as of October 6, 2014, between Safeway Inc. and The Bank of New York Mellon Trust Company, National Association, as trustee, under the Indenture, dated as of September 10, 1997, as amended, and supplemented, with respect to Safeway Inc.’s 3.40% Notes due 2016 | |
| 4.10* | Supplemental Indenture dated as of October 8, 2014, between Safeway Inc. and The Bank of New York Mellon Trust Company, National Association, as trustee, under the Indenture, dated as of September 10, 1997, as amended, and supplemented, with respect to Safeway Inc.’s 6.35% Notes due 2017 | |
| 4.11* | Indenture, dated October 23, 2014, by and among Albertson’s Holdings LLC and Safeway Inc. (as successor by merger to Saturn Acquisition Merger Sub, Inc.) (collectively, the “Issuers”), certain subsidiaries of the Issuers, as guarantors and Wilmington Trust, National Association, as trustee and collateral agent | |
| 4.12* | Indenture, dated May 1, 1992, between New Albertson’s, Inc. (as successor to Albertson’s, Inc.) and U.S. Bank Trust National Association (as successor to Morgan Guaranty Trust Company of New York), as trustee (as supplemented by Supplemental Indenture No. 1, dated as of May 7, 2004; Supplemental Indenture No. 2, dated as of June 1, 2006; and Supplemental Indenture No. 3, dated as of December 29, 2008) | |
| 4.13* | Indenture, dated May 1, 1995, between American Stores Company, LLC and Wells Fargo Bank, National Association (as successor to The First National bank of Chicago), as trustee (as further supplemented) | |
| 5.1**** | Opinion of Schulte Roth & Zabel LLP | |
II-9
Table of Contents
| Exhibit No. |
Exhibit Description | |
| 10.1* | Second Amended and Restated Term Loan Agreement, dated August 25, 2014 and effective January 30, 2015, by and among Albertson’s LLC, Safeway Inc. (as successor by merger to Saturn Acquisition Merger Sub, Inc.) and the other co-borrowers, as borrowers, Albertsons’s Holdings LLC and the other guarantors from time to time thereto, as guarantors, the lenders from time to time thereto, and Credit Suisse AG, Cayman Islands Branch, as administrative and collateral agent | |
| 10.2* | Amended and Restated Asset-Based Revolving Credit Agreement, dated January 30, 2015, by and among Albertson’s LLC, Safeway Inc. (as successor by Merger to Saturn Acquisition Merger Sub, Inc.) and the other co-borrowers, as borrowers, Albertson’s Holdings LLC and the other guarantors from time to time party thereto, as guarantors, the lenders from time to time party thereto and Bank of America N.A., as administrative and collateral agent | |
| 10.3* | Term Loan Agreement, dated June 27, 2014, by and among New Albertson’s, Inc., NAI Holdings LLC, and the other guarantors from time to time party thereto, the lenders from time to time party thereto, and Citibank, N.A., as administrative and collateral agent | |
| 10.4* | Amendment No. 2 to the Asset-Based Revolving Credit Agreement, dated January 24, 2014, by and among New Albertson’s, Inc., NAI Holdings LLC, the other borrowers from time to time, the guarantors from time to time party thereto, the lenders from time to time party thereto and Bank of America, N.A., as administrative and collateral agent | |
| 10.5* | Amended and Restated Letter of Credit Facility Agreement, dated as of January 24, 2014, by and among New Albertson’s, Inc. and Bank of America, N.A. | |
| 10.6* | Casa Ley Contingent Value Rights Agreement, dated January 30, 2015, by and among AB Acquisition LLC, Safeway Inc., the Shareholder Representative, as defined therein, and Computershare Inc. and Computershare Trust Company, N.A., as Rights Agent | |
| 10.7*† | Transition Services Agreement, dated March 21, 2013 between SuperValu Inc. and Albertson’s LLC | |
| 10.8*† | Transition Services Agreement, dated March 21, 2013 between SuperValu Inc. and New Albertson’s, Inc. | |
| 10.9* | Letter Agreement, dated April 16, 2015, to each of the Transition Services Agreements between SUPERVALU INC. and New Albertson’s, Inc. dated March 21, 2013, and the Transition Services Agreement between SUPERVALU INC. and Albertson’s LLC dated March 21, 2013 | |
| 10.10* | Decision and Order, dated January 27, 2015, between the Federal Trade Commission, Cerberus Institutional Partners V, L.P., AB Acquisition LLC and Safeway Inc. | |
| 10.11*** | Form of Albertsons Companies, Inc. 2015 Equity and Incentive Award Plan | |
| 10.12*** | Form of Albertsons Companies, Inc. Executive Incentive Bonus Plan | |
| 10.13*** | Albertsons Companies, Inc. Restricted Stock Unit Plan | |
| 10.14*** | Form of Restricted Stock Unit Award Agreement under the Albertsons Companies, Inc. Restricted Stock Unit Plan | |
| 10.15*** | Form of Indemnification Agreement | |
| 10.16*** | Employment Agreement, dated September 21, 2015, among Albertsons Companies, Inc., Robert Miller and, solely for purpose of the third paragraph thereof, AB Acquisition LLC | |
II-10
Table of Contents
| Exhibit No. |
Exhibit Description | |
| 10.17*** | Employment Agreement, dated September 21, 2015, among Albertsons Companies, Inc. Robert Dimond, and, solely for purpose of Section 9.8 thereof, AB Management Services Corp. | |
| 10.18*** | Employment Agreement, dated September 21, 2015, among Albertsons Companies, Inc., Justin Dye and, solely for purpose of Section 9.8 thereof, New Albertson’s, Inc. | |
| 10.19*** | Letter Agreement, dated September 18, 2015, between Albertsons Companies, Inc. and Shane Sampson | |
| 10.20*** | Letter Agreement dated September 18, 2015, between Albertsons Companies, Inc. and Wayne A. Denningham | |
| 10.21*** | Letter Agreement, dated September 21, 2015, between Albertsons Companies, Inc. and Sharon Allen | |
| 10.22*** | Letter Agreement, dated September 21, 2015, between Albertsons Companies, Inc. and Steven A. Davis | |
| 10.23** | Form of Limited Liability Company Agreement of Albertsons Investor Holdings LLC, by and among Cerberus Iceberg LLC, Cerberus Capital Management, L.P., Jubilee ABS Holding LLC, Klaff Markets Holdings LLC, Klaff-W LLC, Lubert-Adler SAN Aggregator, L.P., L-A Asset Management Services, LLC, Robert G. Miller, Robert Edwards, and the Persons listed on Schedule A thereto. | |
| 21.1** | Schedule of Subsidiaries of Albertsons Companies, Inc. | |
| 23.1**** | Consent of Schulte Roth & Zabel LLP (included in Exhibit 5.1) | |
| 23.2***** | Consent of Deloitte & Touche LLP, Independent Registered Public Accounting Firm | |
| 23.3***** | Consent of Deloitte & Touche LLP, Independent Registered Public Accounting Firm | |
| 23.4***** | Consent of Deloitte & Touche LLP, Independent Registered Public Accounting Firm | |
| 23.5***** | Consent of KPMG LLP, Independent Public Accounting Firm | |
| 23.6***** | Consent of RSM US LLP, Independent Auditor | |
| 23.7***** | Consent of Cushman & Wakefield, Inc. | |
| 24.1* | Powers of Attorney (included on signature pages of this Registration Statement) | |
| * | Previously filed on July 8, 2015 |
| ** | Previously filed on August 26, 2015 |
| *** | Previously filed on September 24, 2015 |
| **** | Previously filed on October 2, 2015 |
| ***** | Filed herewith |
| † | Confidential treatment has been requested for certain information contained in this exhibit. Such information has been omitted and filed separately with the SEC. |
II-11