Attached files
| file | filename |
|---|---|
| EX-99.1 - EX-99.1 - Wesco Aircraft Holdings, Inc | a15-23636_1ex99d1.htm |
| 8-K - 8-K - Wesco Aircraft Holdings, Inc | a15-23636_18k.htm |
Exhibit 99.2
Fiscal 2015 Fourth Quarter Earnings Conference Call and Webcast November 19, 2015 Jeff Misakian VP Investor Relations 661-362-6847 Jeff.Misakian@wescoair.com
Wesco Aircraft Private & Proprietary Visit www.wescoair.com Agenda Introduction Company Overview & Business Highlights Financial Overview Q&A Session Jeff Misakian Vice President, Investor Relations Dave Castagnola President and Chief Executive Officer Rick Weller Executive Vice President, Chief Financial Officer 2 Wesco Aircraft - Investor Relations All Closing Remarks Dave Castagnola President and Chief Executive Officer
Wesco Aircraft Private & Proprietary Visit www.wescoair.com Disclaimer This presentation contains forward-looking statements (including within the meaning of the Private Securities Litigation Reform Act of 1995) concerning Wesco Aircraft Holdings, Inc. (“Wesco Aircraft “ or the “Company”) and other matters. These statements may discuss goals, intentions and expectations as to future plans, trends, events, results of operations or financial condition, or otherwise, based on current beliefs of management, as well as assumptions made by, and information currently available to, such management. Forward-looking statements may be accompanied by words such as “aim,” “anticipate,” “believe,” “could,” “drive,” “estimate,” “expect,” “forecast,” “future,” “outlook,” “target,” “will,” “guidance,” “intend,” “plan,” “possible,” “potential,” “predict,” “project,” “should,” “would” or similar words, phrases or expressions. These forward-looking statements are subject to various risks and uncertainties, many of which are outside the Company’s control. Therefore, you should not place undue reliance on such statements. Factors that could cause actual results to differ materially from those in the forward-looking statements include: general economic and industry conditions; conditions in the credit markets; changes in military spending; risks unique to suppliers of equipment and services to the U.S. government; risks associated with the Company’s long-term, fixed-price agreements that have no guarantee of future sales volumes; risks associated with the loss of significant customers, a material reduction in purchase orders by significant customers or the delay, scaling back or elimination of significant programs on which the Company relies; the Company’s ability to effectively compete in its industry; the Company’s ability to effectively manage its inventory; the Company’s ability to fully integrate the acquired business of Haas and realize anticipated benefits of the combined operations; risks relating to unanticipated costs of integration; the Company’s suppliers’ ability to provide it with the products the Company sells in a timely manner, in adequate quantities and/or at a reasonable cost; the Company’s ability to maintain effective information technology systems; the Company’s ability to retain key personnel; risks associated with the Company’s international operations, including exposure to foreign currency movements; risks associated with assumptions the Company makes in connection with its critical accounting estimates (including goodwill) and legal proceedings; the Company’s dependence on third-party package delivery companies; fuel price risks; the Company’s ability to establish and maintain effective internal control over financial reporting; fluctuations in the Company’s financial results from period-to-period; environmental risks; risks related to the handling, transportation and storage of chemical products; risks related to the aerospace industry and the regulation thereof; risks related to the Company’s indebtedness; and other risks and uncertainties. The foregoing list of factors is not exhaustive. You should carefully consider the foregoing factors and the other risks and uncertainties that affect the Company’s business, including those described in the Company’s Annual Report on Form 10-K, Quarterly Reports on Form 10-Q, Current Reports on Form 8-K and other documents filed from time to time with the Securities and Exchange Commission. All forward-looking statements included in this presentation (including information included or incorporated by reference herein) are based upon information available to the Company as of the date hereof, and the Company undertakes no obligation to update or revise publicly any forward-looking statements, whether as a result of new information, future events or otherwise. The Company utilizes and discusses Adjusted Cost of Sales, Adjusted Gross Profit, Adjusted Selling, General and Administrative Expenses, Adjusted Income from Operations, Adjusted Net Income, Adjusted EBITDA, Adjusted Basic EPS, Adjusted Diluted EPS, Organic Sales and Free Cash Flow, which are non-GAAP measures its management uses to evaluate its business, because the Company believes they assist investors and analysts in comparing its performance across reporting periods on a consistent basis by excluding items that the Company does not believe are indicative of its core operating performance. The Company believes these metrics are used in the financial community, and the Company presents these metrics to enhance investors’ understanding of its operating performance. You should not consider Adjusted EBITDA and Adjusted Net Income as an alternative to Net Income, determined in accordance with GAAP, as an indicator of operating performance. Adjusted Cost of Sales, Adjusted Gross Profit, Adjusted Selling, General and Administrative Expenses, Adjusted Income from Operations, Adjusted Net Income, Adjusted EBITDA, Adjusted Basic EPS, Adjusted Diluted EPS, Organic Sales and Free Cash Flow are not measurements of financial performance under GAAP, and these metrics may not be comparable to similarly titled measures of other companies. See the Appendix for a reconciliation of Adjusted Cost of Sales, Adjusted Gross Profit, Adjusted Selling, General and Administrative Expenses, Adjusted Income from Operations, Adjusted Net Income, Adjusted EBITDA, Adjusted Basic EPS, Adjusted Diluted EPS and Organic Sales to the most directly comparable financial measures calculated and presented in accordance with GAAP. 3 Wesco Aircraft - Investor Relations
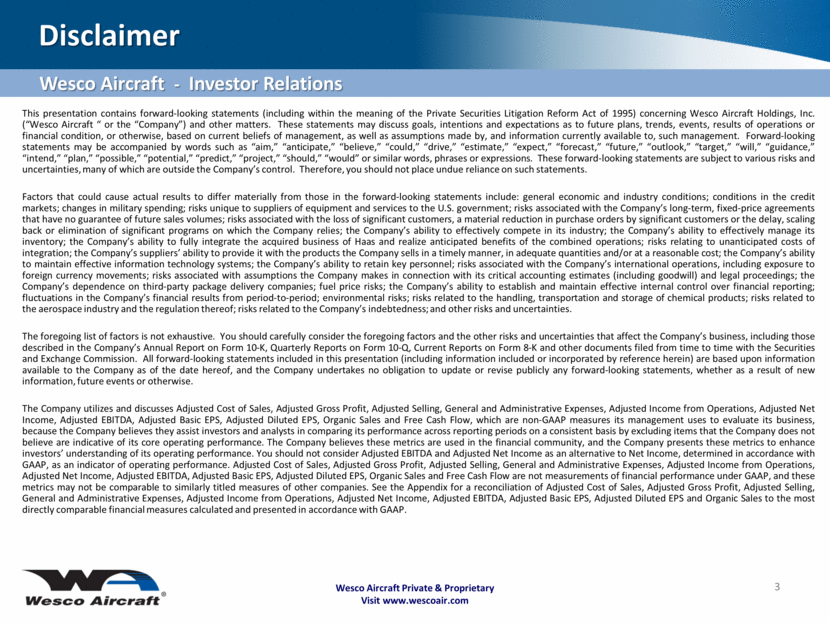
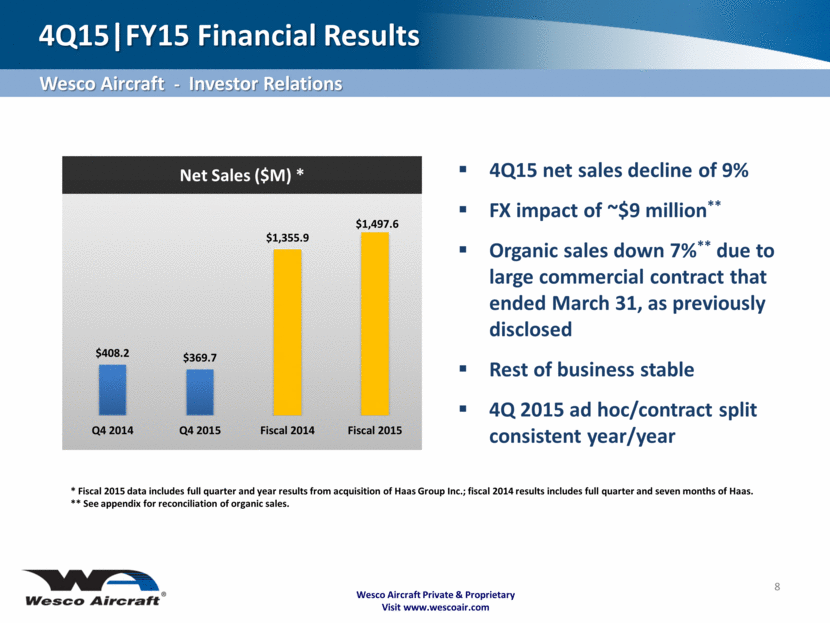
Wesco Aircraft Private & Proprietary Visit www.wescoair.com 4Q15 Summary 4 Financial Highlights 4Q15 4Q14 Fiscal 2015 Fiscal 2014 Net sales $369.7 $408.2 $1,497.6 $1,355.9 Adjusted EBITDA 46.0 58.0 192.2 220.2 Adjusted net income 26.5 29.7 100.6 120.7 Adjusted diluted EPS 0.27 0.30 1.04 1.24 In millions (except per share data) Wesco Aircraft - Investor Relations Q4 2015 reflects end of transition period Large addressable market; strong competitive position Aligned organization for more efficient growth Significant actions taken to improve performance Generated robust cash flow; paid down debt
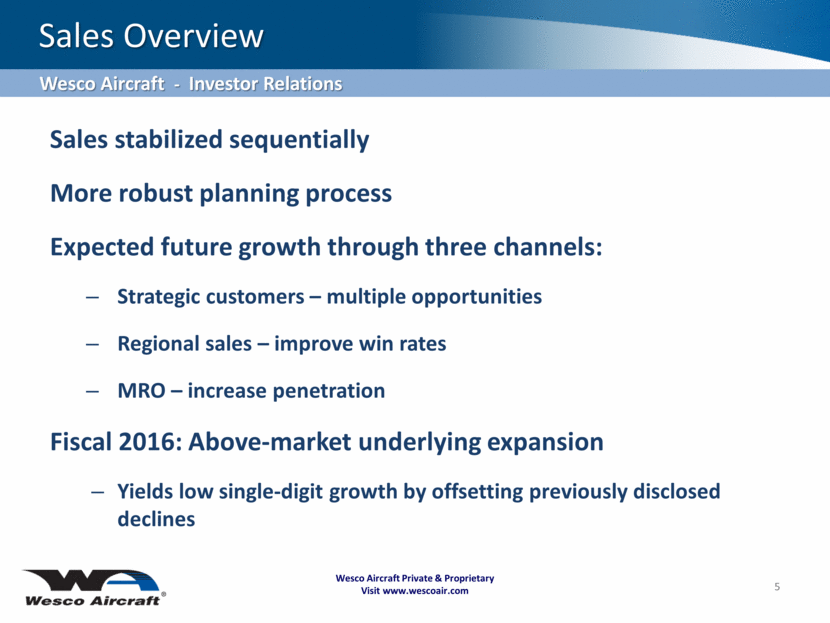
Sales stabilized sequentially More robust planning process Expected future growth through three channels: Strategic customers – multiple opportunities Regional sales – improve win rates MRO – increase penetration Fiscal 2016: Above-market underlying expansion Yields low single-digit growth by offsetting previously disclosed declines 5 Sales Overview Wesco Aircraft - Investor Relations Wesco Aircraft Private & Proprietary Visit www.wescoair.com
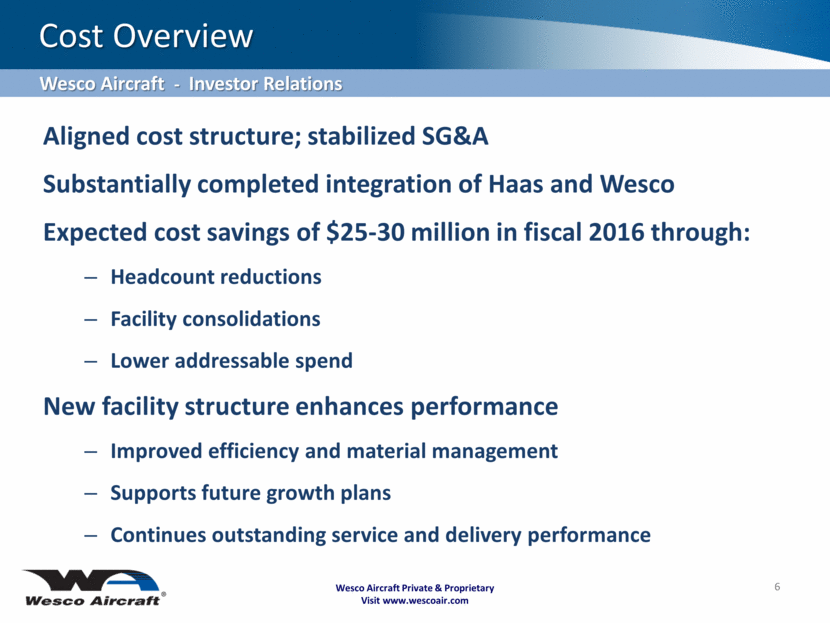
Aligned cost structure; stabilized SG&A Substantially completed integration of Haas and Wesco Expected cost savings of $25-30 million in fiscal 2016 through: Headcount reductions Facility consolidations Lower addressable spend New facility structure enhances performance Improved efficiency and material management Supports future growth plans Continues outstanding service and delivery performance 6 Cost Overview Wesco Aircraft - Investor Relations Wesco Aircraft Private & Proprietary Visit www.wescoair.com
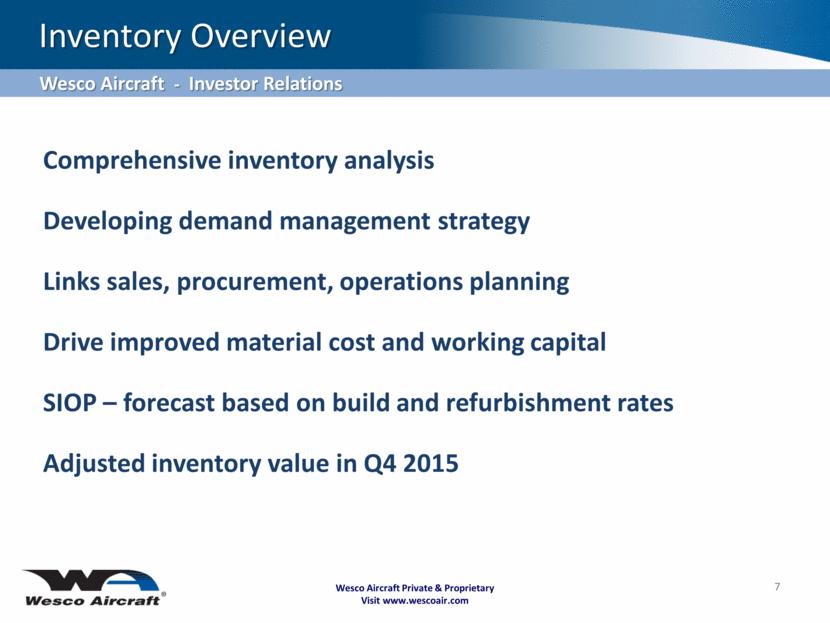
Comprehensive inventory analysis Developing demand management strategy Links sales, procurement, operations planning Drive improved material cost and working capital SIOP – forecast based on build and refurbishment rates Adjusted inventory value in Q4 2015 7 Inventory Overview Wesco Aircraft - Investor Relations Wesco Aircraft Private & Proprietary Visit www.wescoair.com
4Q15 net sales decline of 9% FX impact of ~$9 million** Organic sales down 7%** due to large commercial contract that ended March 31, as previously disclosed Rest of business stable 4Q 2015 ad hoc/contract split consistent year/year Wesco Aircraft Private & Proprietary Visit www.wescoair.com 4Q15 FY15 Financial Results 8 * Fiscal 2015 data includes full quarter and year results from acquisition of Haas Group Inc.; fiscal 2014 results includes full quarter and seven months of Haas. ** See appendix for reconciliation of organic sales. Wesco Aircraft - Investor Relations Net Sales ($M) * $408.2 $369.7 $1,355.9 $1,497.6 Q4 2014 Q4 2015 Fiscal 2014 Fiscal 2015
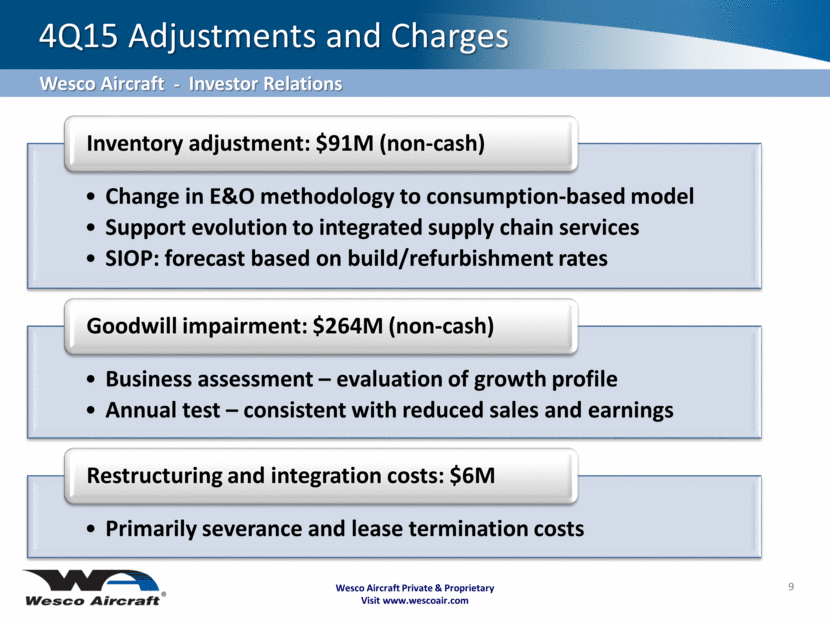
9 4Q15 Adjustments and Charges Wesco Aircraft - Investor Relations Wesco Aircraft Private & Proprietary Visit www.wescoair.com Change in E&O methodology to consumption-based model Support evolution to integrated supply chain services SIOP: forecast based on build/refurbishment rates Inventory adjustment: $91M (non-cash) Business assessment – evaluation of growth profile Annual test – consistent with reduced sales and earnings Goodwill impairment: $264M (non-cash) Primarily severance and lease termination costs Restructuring and integration costs: $6M
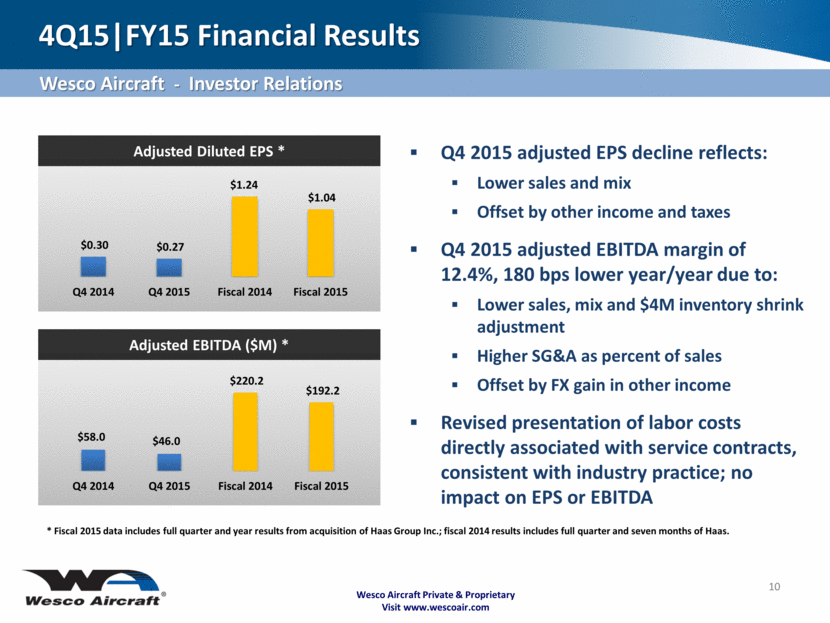
Wesco Aircraft Private & Proprietary Visit www.wescoair.com 4Q15 FY15 Financial Results Q4 2015 adjusted EPS decline reflects: Lower sales and mix Offset by other income and taxes Q4 2015 adjusted EBITDA margin of 12.4%, 180 bps lower year/year due to: Lower sales, mix and $4M inventory shrink adjustment Higher SG&A as percent of sales Offset by FX gain in other income Revised presentation of labor costs directly associated with service contracts, consistent with industry practice; no impact on EPS or EBITDA 10 * Fiscal 2015 data includes full quarter and year results from acquisition of Haas Group Inc.; fiscal 2014 results includes full quarter and seven months of Haas. Wesco Aircraft - Investor Relations Adjusted Diluted EPS * Adjusted EBITDA ($M) *
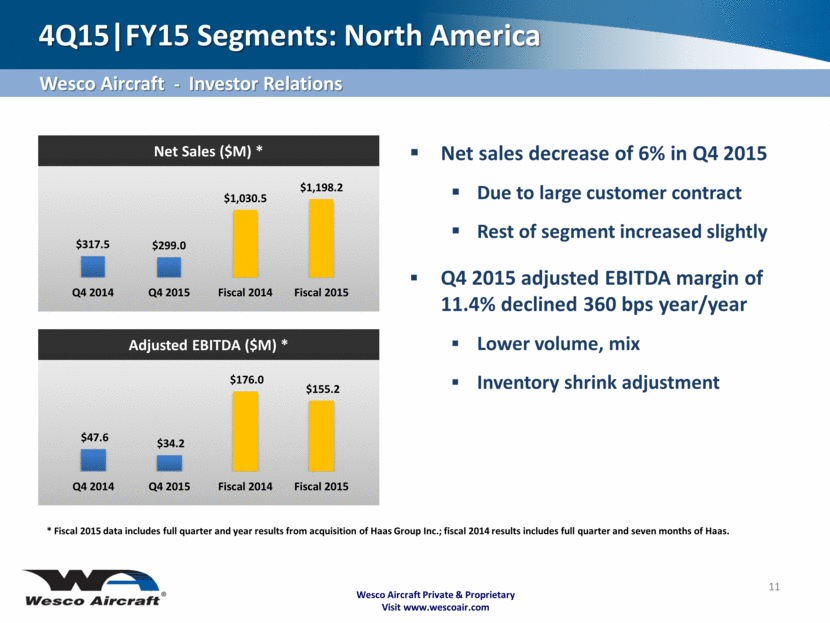
Adjusted EBITDA ($M) * Net Sales ($M) * Wesco Aircraft Private & Proprietary Visit www.wescoair.com 4Q15 FY15 Segments: North America 11 Net sales decrease of 6% in Q4 2015 Due to large customer contract Rest of segment increased slightly Q4 2015 adjusted EBITDA margin of 11.4% declined 360 bps year/year Lower volume, mix Inventory shrink adjustment Wesco Aircraft - Investor Relations * Fiscal 2015 data includes full quarter and year results from acquisition of Haas Group Inc.; fiscal 2014 results includes full quarter and seven months of Haas. $47.6 $34.2 $176.0 $155.2 Q4 2014 Q4 2015 Fiscal 2014 Fiscal 2015 $317.5 $299.0 $1,030.5 $1,198.2 Q4 2014 Q4 2015 Fiscal 2014 Fiscal 2015
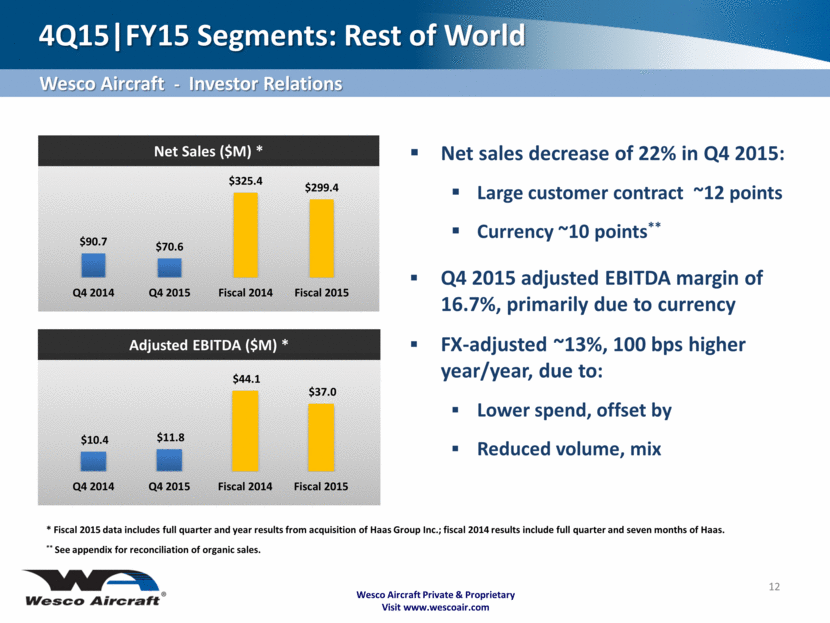
Net Sales ($M) * Adjusted EBITDA ($M) * Wesco Aircraft Private & Proprietary Visit www.wescoair.com 4Q15 FY15 Segments: Rest of World 12 Net sales decrease of 22% in Q4 2015: Large customer contract ~12 points Currency ~10 points** Q4 2015 adjusted EBITDA margin of 16.7%, primarily due to currency FX-adjusted ~13%, 100 bps higher year/year, due to: Lower spend, offset by Reduced volume, mix * Fiscal 2015 data includes full quarter and year results from acquisition of Haas Group Inc.; fiscal 2014 results include full quarter and seven months of Haas. ** See appendix for reconciliation of organic sales. Wesco Aircraft - Investor Relations $90.7 $70.6 $325.4 $299.4 Q4 2014 Q4 2015 Fiscal 2014 Fiscal 2015 $10.4 $11.8 $44.1 $37.0 Q4 2014 Q4 2015 Fiscal 2014 Fiscal 2015
Wesco Aircraft Private & Proprietary Visit www.wescoair.com Financial Summary 13 * Cash provided by operating activities less purchases of property & equipment Wesco Aircraft - Investor Relations (Dollars in Millions) Sept 30, 2015 June 30, 2015 Sept 30, 2014 At period end: Cash and cash equivalents $82.9 $82.1 $104.8 Net inventory 701.5 802.0 754.4 Total debt 952.9 1,002.9 1,102.7 Total stockholders’ equity 817.6 1,048.2 992.3 Quarter ended: Free cash flow* 52.4 32.6 48.6 Adjusted net income 26.5 21.3 29.7 Cash flow conversion 198% 154% 163%
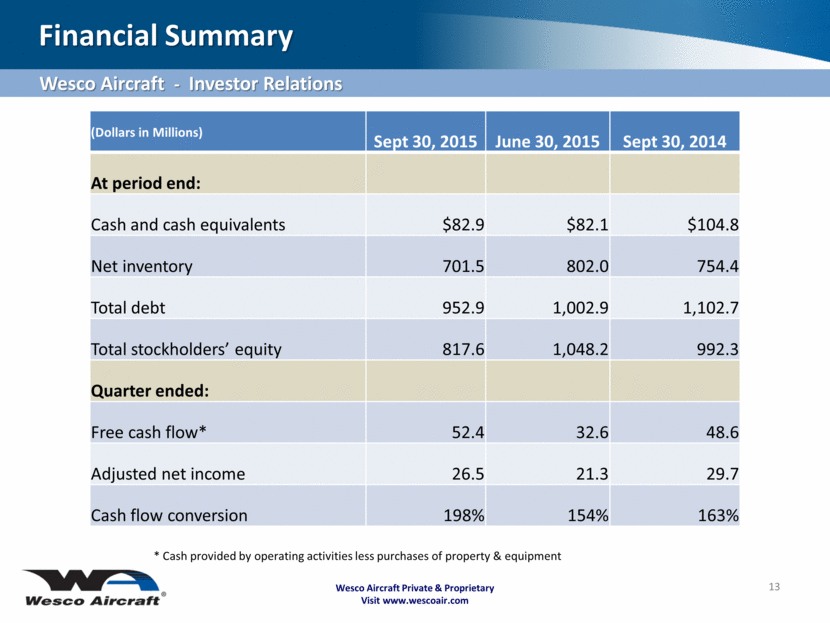
Fiscal 2016 Target Commentary Low single-digit growth Underlying growth ahead of market; stronger 2H $25-30M savings Reductions in headcount, sites and spend ~100 basis point improvement Primarily SG&A reductions Exceed 100% Primary usage to pay down debt Interest expense $35-40M; cap-ex $10-15M ~$10M of SG&A savings from non-recurring items 14 Fiscal 2016 Outlook Net Sales Growth SG&A Reduction EBITDA Margin FCF Conversion Wesco Aircraft - Investor Relations Other Assumptions Wesco Aircraft Private & Proprietary Visit www.wescoair.com
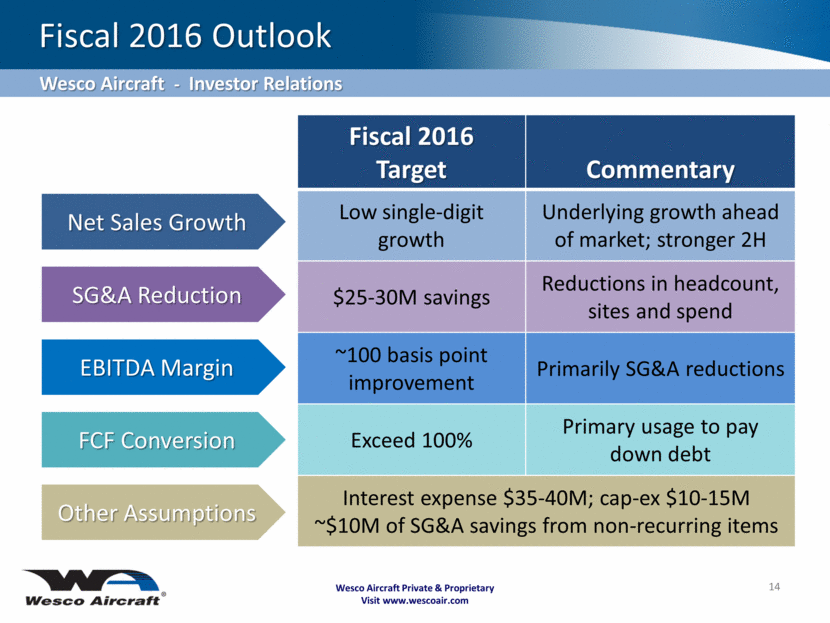
Transforming Wesco Built a strong foundation Developing a more performance-based culture Greater accountability Deliver results Concluding Remarks 15 Wesco Aircraft Private & Proprietary Visit www.wescoair.com
Wesco Aircraft Private & Proprietary Visit www.wescoair.com APPENDIX 16
Wesco Aircraft Private & Proprietary Visit www.wescoair.com Non-GAAP Financial Information “Adjusted Cost of Sales” represents Cost of Sales less the $91.3 million non-cash inventory adjustment we took during the quarter ended September 30, 2015 (the “Q4 2015 Inventory Adjustment”). “Adjusted Gross Profit” represents Gross Profit plus the Q4 2015 Inventory Adjustment. “Adjusted Selling, General and Administrative Expenses” represents Selling, General and Administrative Expenses less (i) restructuring and other costs and (ii) amortization of intangible assets. “Adjusted Income from Operations” represents Income from Operations plus (i) the $263.8 million goodwill impairment we took during the quarter ended September 30, 2015, (ii) the Q4 2015 Inventory Adjustment, (iii) restructuring and other costs and (iv) amortization of intangible assets. ‘‘Adjusted EBITDA’’ represents Net Income before: (i) income tax provision, (ii) net interest expense, (iii) depreciation and amortization, and (iv) unusual or non-recurring items. ‘‘Adjusted Net Income’’ represents Net Income before: (i) amortization of intangible assets, (ii) amortization or write-off of deferred financing costs and original issue discount, (iii) unusual or non-recurring items and (iv) the tax effect of items (i) through (iii) above calculated using an assumed effective tax rate. “Adjusted Basic EPS” represents Basic EPS calculated using Adjusted Net Income as opposed to Net Income. “Adjusted Diluted EPS” represents Diluted EPS calculated using Adjusted Net Income as opposed to Net Income. “Organic Sales” represent total net sales less net sales attributable to Haas Group, which was acquired in February 2014. “Free Cash Flow” represents cash from operations less purchases of property and equipment. Wesco Aircraft utilizes and discusses Adjusted Cost of Sales, Adjusted Gross Profit, Adjusted Selling, General and Administrative Expenses, Adjusted Income from Operations, Adjusted Net Income, Adjusted EBITDA, Adjusted Basic EPS, Adjusted Diluted EPS, Organic Sales and Free Cash Flow, which are non-GAAP measures our management uses to evaluate our business, because we believe they assist investors and analysts in comparing our performance across reporting periods on a consistent basis by excluding items that we do not believe are indicative of our core operating performance. We believe these metrics are used in the financial community, and we present these metrics to enhance investors’ understanding of our operating performance. You should not consider Adjusted EBITDA and Adjusted Net Income as an alternative to Net Income, determined in accordance with GAAP, as an indicator of operating performance. Adjusted Cost of Sales, Adjusted Gross Profit, Adjusted Selling, General and Administrative Expenses, Adjusted Income from Operations, Adjusted Net Income, Adjusted EBITDA, Adjusted Basic EPS, Adjusted Diluted EPS, Organic Sales and Free Cash Flow are not measurements of financial performance under GAAP, and these metrics may not be comparable to similarly titled measures of other companies. See following slides for a reconciliation of Adjusted Cost of Sales, Adjusted Gross Profit, Adjusted Selling, General and Administrative Expenses, Adjusted Income from Operations, Adjusted Net Income, Adjusted EBITDA, Adjusted Basic EPS, Adjusted Diluted EPS, and Organic Sales to the most directly comparable financial measures calculated and presented in accordance with GAAP. 17 Wesco Aircraft - Investor Relations
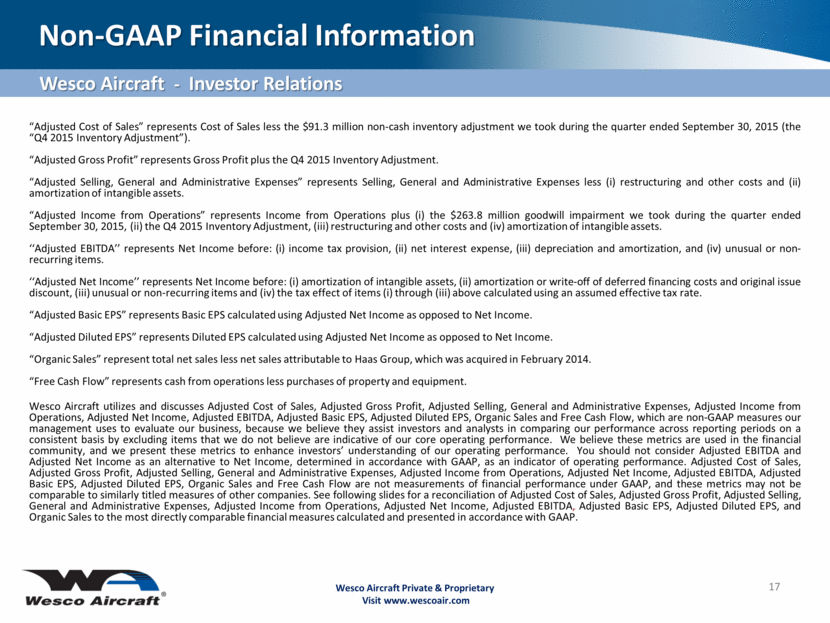
Non-GAAP Financial Information 18 Wesco Aircraft - Investor Relations Wesco Aircraft Private & Proprietary Visit www.wescoair.com September 30, 2015 September 30, 2014 September 30, 2015 September 30, 2014 Adjusted Cost of Sales As reported $363,523 $294,529 $1,173,120 $952,877 Inventory adjustment (91,280) - (91,280) - As adjusted $272,243 $294,529 $1,081,840 $952,877 Adjusted Gross Profit As reported $6,131 $113,638 $324,495 $403,000 Inventory adjustment 91,280 - 91,280 - As adjusted $97,411 $113,638 $415,775 $403,000 Adjusted Selling, General and Administrative Expenses As reported $68,510 $65,522 $267,089 $219,066 Restructuring and other costs (5,998) (2,862) (13,923) (12,645) Amortization of intangible assets (3,961) (4,537) (15,948) (12,636) As adjusted $58,551 $58,123 $237,218 $193,785 Adjusted Income from Operations As reported ($326,150) $48,116 ($206,365) $183,934 Goodwill impairment 263,771 - 263,771 - Inventory adjustment 91,280 - 91,280 - Amortization of intangible assets 3,961 4,537 15,948 12,636 Restructuring and other costs 5,998 2,862 13,923 12,645 As adjusted $38,860 $55,515 $178,557 $209,215 Three Months Ended Fiscal Year Ended Wesco Aircraft Holdings, Inc. (In thousands, except for per share data) Non-GAAP Financial Information (UNAUDITED)
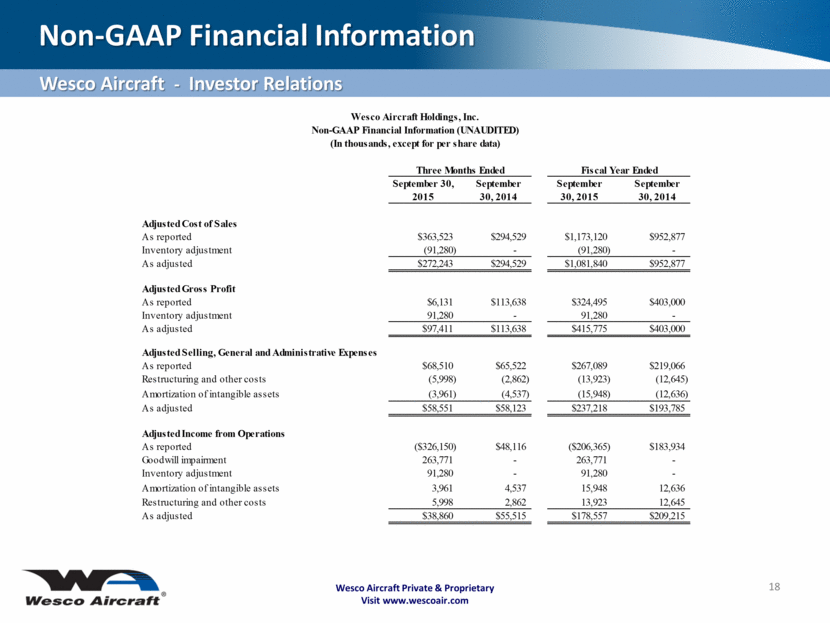
Non-GAAP Financial Information 19 Wesco Aircraft - Investor Relations Wesco Aircraft Private & Proprietary Visit www.wescoair.com Adjusted Net Income Net (loss) income ($213,998) $24,647 ($154,744) $102,102 Goodwill impairment 263,771 - 263,771 - Inventory adjustment 91,280 - 91,280 - Amortization of intangible assets 3,961 4,537 15,948 12,636 Amortization of deferred financing costs 1,092 1,242 4,354 3,299 Restructuring and other costs 5,998 2,862 13,923 12,645 Adjustments for tax effect (125,639) (3,546) (133,961) (10,005) Adjusted Net Income $26,465 $29,742 $100,571 $120,677 Adjusted Basic Earnings Per Share Weighted-average number of basic shares outstanding 97,042 96,770 96,955 95,951 Adjusted Net Income Per Basic Shares $0.27 $0.31 $1.04 $1.26 Adjusted Diluted Earnings Per Share Weighted-average number of diluted shares outstanding 97,042 97,884 96,955 97,606 Adjusted Net Income Per Diluted Shares $0.27 $0.30 $1.04 $1.24 EBITDA and Adjusted EBITDA Net (loss) income ($213,998) $24,647 ($154,744) $102,102 (Benefit) provision for income taxes (117,985) 13,507 (86,872) 54,806 Interest and other, net 9,037 9,816 37,092 29,225 Depreciation and amortization 7,911 7,209 27,726 21,402 EBITDA (315,035) 55,179 (176,798) 207,535 Goodwill impairment 263,771 - 263,771 - Inventory adjustment 91,280 - 91,280 - Restructuring and other costs 5,998 2,862 13,923 12,645 Adjusted EBITDA $46,014 $58,041 $192,176 $220,180 September 30, 2015 September 30, 2014 September 30, 2015 September 30, 2014 Three Months Ended Fiscal Year Ended Wesco Aircraft Holdings, Inc. (In thousands, except for per share data) Non-GAAP Financial Information (UNAUDITED)
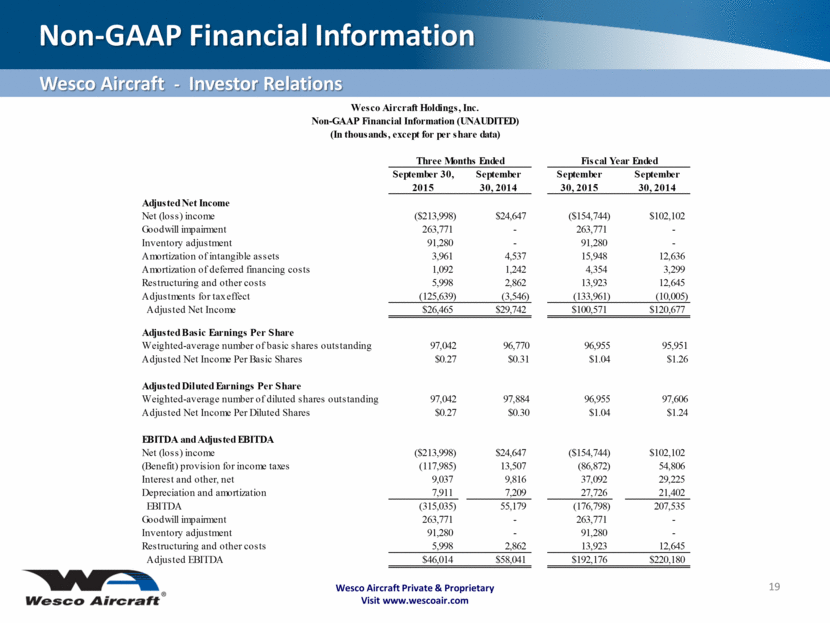
Non-GAAP Financial Information 20 Wesco Aircraft - Investor Relations Wesco Aircraft Private & Proprietary Visit www.wescoair.com September 30, 2015 September 30, 2014 Increase / (Decrease) Percent Change September 30, 2015 September 30, 2014 Increase / (Decrease) Percent Change Consolidated Consolidated net sales $369,654 $408,167 ($38,513) -9.4% $1,497,615 $1,355,877 $141,738 10.5% Haas net sales - - - 242,661 - 242,661 Consolidated organic sales 369,654 408,167 (38,513) -9.4% 1,254,954 1,355,877 (100,923) -7.4% One-time demand pull forward - - - - (26,440) 26,440 Contract settlement - - - - (5,890) 5,890 Currency effects 8,883 - 8,883 25,359 - 25,359 Adjusted organic sales $378,537 $408,167 ($29,630) -7.3% $1,280,313 $1,323,547 ($43,234) -3.3% North America North America net sales $299,008 $317,506 ($18,498) -5.8% $1,198,201 $1,030,511 $167,690 16.3% Haas North America net sales - - - 184,590 - 184,590 North America organic sales 299,008 317,506 (18,498) -5.8% 1,013,611 1,030,511 (16,900) -1.6% Contract settlement - - - - (5,890) 5,890 Contract Transition from Rest of World 9 - 9 (27,916) - (27,916) Adjusted North America organic sales $299,017 $317,506 ($18,489) -5.8% $985,695 $1,024,621 ($38,926) -3.8% Rest of World Rest of World net sales $70,645 $90,661 ($20,016) -22.1% $299,414 $325,366 ($25,952) -8.0% Haas Rest of World net sales - - - 58,071 - 58,071 Rest of World organic sales 70,645 90,661 (20,016) -22.1% 241,343 325,366 (84,023) -25.8% One-time demand pull forward - - - - (26,440) 26,440 Contract Transition to North America (9) - (9) 27,916 - 27,916 Currency effects 8,883 - 8,883 25,359 - 25,359 Adjusted Rest of World organic sales $79,519 $90,661 ($11,142) -12.3% $294,618 $298,926 ($4,308) -1.4% Three Months Ended Fiscal Year Ended Wesco Aircraft Holdings, Inc. Non-GAAP Financial Information (UNAUDITED) (In thousands)
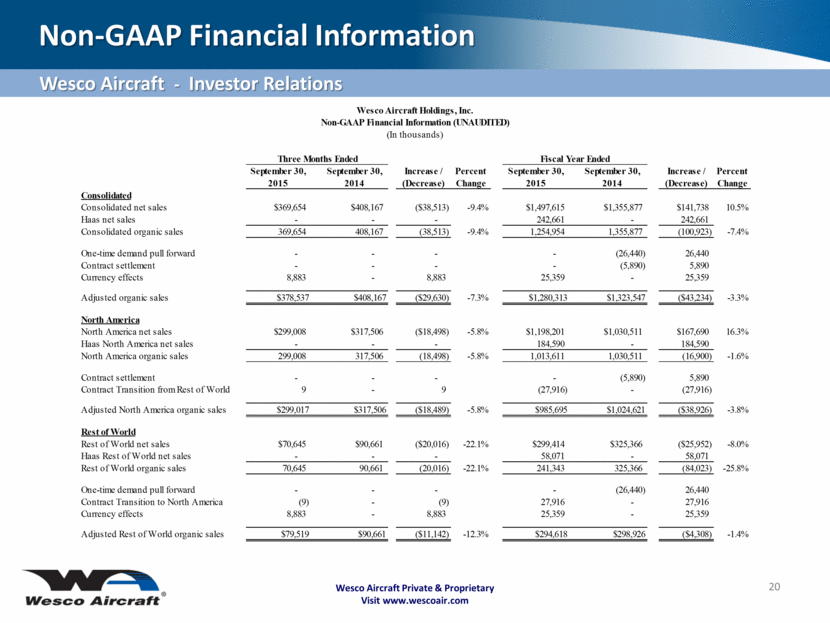
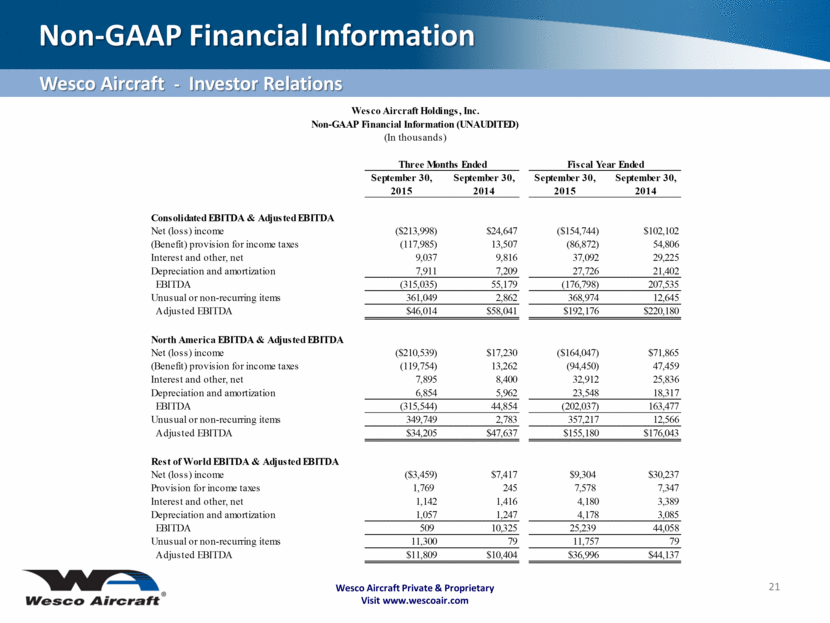
Non-GAAP Financial Information 21 Wesco Aircraft - Investor Relations Wesco Aircraft Private & Proprietary Visit www.wescoair.com September 30, 2015 September 30, 2014 September 30, 2015 September 30, 2014 Consolidated EBITDA & Adjusted EBITDA Net (loss) income ($213,998) $24,647 ($154,744) $102,102 (Benefit) provision for income taxes (117,985) 13,507 (86,872) 54,806 Interest and other, net 9,037 9,816 37,092 29,225 Depreciation and amortization 7,911 7,209 27,726 21,402 EBITDA (315,035) 55,179 (176,798) 207,535 Unusual or non-recurring items 361,049 2,862 368,974 12,645 Adjusted EBITDA $46,014 $58,041 $192,176 $220,180 North America EBITDA & Adjusted EBITDA Net (loss) income ($210,539) $17,230 ($164,047) $71,865 (Benefit) provision for income taxes (119,754) 13,262 (94,450) 47,459 Interest and other, net 7,895 8,400 32,912 25,836 Depreciation and amortization 6,854 5,962 23,548 18,317 EBITDA (315,544) 44,854 (202,037) 163,477 Unusual or non-recurring items 349,749 2,783 357,217 12,566 Adjusted EBITDA $34,205 $47,637 $155,180 $176,043 Rest of World EBITDA & Adjusted EBITDA Net (loss) income ($3,459) $7,417 $9,304 $30,237 Provision for income taxes 1,769 245 7,578 7,347 Interest and other, net 1,142 1,416 4,180 3,389 Depreciation and amortization 1,057 1,247 4,178 3,085 EBITDA 509 10,325 25,239 44,058 Unusual or non-recurring items 11,300 79 11,757 79 Adjusted EBITDA $11,809 $10,404 $36,996 $44,137 Wesco Aircraft Holdings, Inc. Non-GAAP Financial Information (UNAUDITED) (In thousands) Three Months Ended Fiscal Year Ended
22 Wesco Aircraft Private & Proprietary Visit www.wescoair.com

