Attached files
| file | filename |
|---|---|
| 8-K - FORM 8-K - Nimble Storage Inc | d19627d8k.htm |
| EX-99.2 - EX-99.2 - Nimble Storage Inc | d19627dex992.htm |
Exhibit 99.1
Nimble Storage, Inc. Q3FY16 Shareholder Letter
Executive Summary
Although our Q3FY16 revenue grew at 37% compared to Q3FY15, our Q3FY16 financial results fell short of our expectations. Revenue of $80.7 million came in below our guidance of $86 to $88 million, resulting in non-GAAP operating loss of $10.8 million, which was greater than our guidance for operating loss of $5 to $6 million.
We believe there were two developments during the quarter that impacted our performance.
| 1. | Our enterprise investments are taking longer to achieve full productivity. Over the last several quarters, we have made significant investments aimed at accelerating large global enterprise customer growth. While those investments have helped us to acquire large enterprises at a strong pace and grow our enterprise business, the competitive intensity in the market is causing our enterprise investments to take longer than expected to achieve full productivity. |
| 2. | The shift in investment from our commercial business to enterprise business impacted our growth. We have been managing our total sales and marketing investments in light of our goal of achieving non-GAAP breakeven operating income in Q4FY16. Within this overall investment envelope, we increased our investments in the large enterprise business at the expense of investments in our commercial business. At the time when the storage market remains very competitive, this led to lower growth in our commercial business than we believe we could have achieved by maintaining our prior pace of investment in that segment of the market. |
Despite our Q3 results, we believe our business foundation remains extremely strong. Our Adaptive Flash platform offers the broadest approach to leveraging flash storage in the modern data center, while our InfoSight cloud-based management provides infrastructure visibility, resiliency and operational simplicity. We also believe our market opportunity remains large as the $40B storage market goes through a major disruption with disk-centric architectures transitioning to flash-centric architectures. Highlights during Q3 include the following:
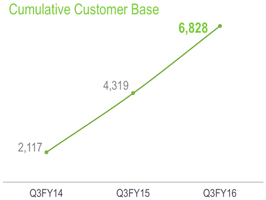
| • | Continued steady expansion of our customer base, leveraging our proven go-to-market engine. We have built a strong go-to-market engine that resulted in 617 new customers during Q3 as our installed base grew to 6,828 customers. Our channel ecosystem continues to pay dividends as the portion of bookings initiated by channel partners was at the highest level in over six quarters. |
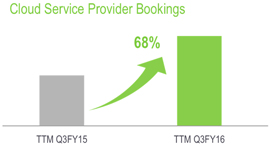
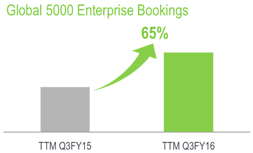
| • | Continued strong growth in large enterprises and cloud service providers, with over 400 global enterprises and over 600 cloud service providers as part of our installed base. |
| • | Strong international growth, as international revenue during Q3 grew to a record 22% of total revenue. |
| • | Growing transaction size. Across mid-sized and large enterprises, larger deployments resulted in new customer transaction value reaching record levels. A key enabler has been the growth in the mix of Fibre Channel bookings (as a percentage of Fibre Channel + iSCSI), which grew to 23.5% from 17.4% during Q2FY16. |
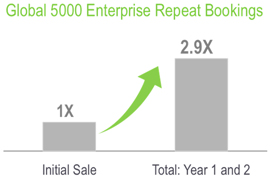
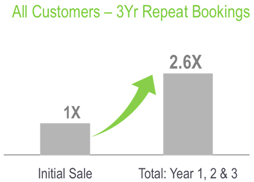
| • | Land and expand business model. High customer satisfaction translates into a predictable pattern of repeat purchases by our customers, with repeat bookings accounting for 47% of total bookings in the last 12 months. |
| • | Gartner recognition. Gartner named us as a Leader in the Gartner magic quadrant for general-purpose storage arrays – the only company built in the last two decades to be in the Leader Quadrant. |
Leveraging our strengths, we plan to reaccelerate growth over the next few quarters by focusing on the following:
| 1. | Increased sales and marketing investments in our core commercial segment in order to aggressively capture the large market opportunity ahead of us. Our commercial go-to-market engine is a core competence for the company, and we believe that investments in our commercial business will drive future growth. |
| 2. | Sustained investments in continuing to grow our large enterprise business, both in terms of go-to-market investments as well as R&D investments aimed at further broadening our Adaptive Flash platform to address the broadest spectrum of workloads within large enterprises. |
1
Factors that impacted our growth during Q3FY16
We have been executing a strategy of augmenting our traditional base of mid-sized enterprises by focusing on the large enterprise segment. At the same time, we have also been focused on achieving non-GAAP breakeven operating income in Q4FY16 by balancing top-line growth versus investments in the business. We now believe this strategy of diversifying our customer base within a constrained investment envelope, at a time when the storage market is extremely competitive, may have impacted our growth.
Our Enterprise business is taking longer to achieve full productivity
Over the last several quarters we made significant investments to grow our enterprise business. These investments include quota carrying enterprise sales teams, marketing programs, channel incentives and programs, and other sales enablement investments. These investments have helped to grow our enterprise business and we now have over 400 large, global enterprises within our customer base. However, the productivity of these investments is slower to develop than we anticipated because of the intensifying competition in the storage market.
Investment shift away from our commercial business impacted growth in our commercial business
Our goal of achieving non-GAAP breakeven operating income in Q4FY16 defined our overall sales and marketing investments. Within this overall envelope, the investments we made in our enterprise business have constrained the investment in our commercial business. This decreased investment has led to a slower pace of addition of commercial sales teams, and lower investments in marketing programs and channel programs directed at acquiring new mid-sized enterprise customers. At a time when the storage market remains very competitive, we believe the shift in investment towards enterprise business led to slower growth.
We have a strong foundation in the breadth and differentiation of our Adaptive Flash Platform
| We believe that the Nimble Storage Adaptive Flash platform offers the broadest approach to leveraging flash storage in the modern data center. As Hybrid-Flash arrays and All-Flash arrays displace disk-only storage arrays over the next several years, we believe that we are uniquely positioned to address the broadest spectrum of workloads within the data center.
Some large-scale wins at major enterprises during Q3 that illustrate the value proposition of our platform include the following:
• A major global reinsurance company selected us as their storage standard to replace a leading incumbent vendor after evaluating several flash vendors, for a deployment of over 1PB of storage hosting databases, file servers, Exchange and their virtual server environment
• A major healthcare information and data analytics firm selected us as a high performance storage solution to replace their legacy storage infrastructure in an environment that includes large-scale Oracle databases and petabytes of unstructured data |
CareCentrix uses SmartStack for 8X storage consolidation from VMAX to Nimble
CareCentrix is a national home healthcare services network serving more than 23 million patients across the US. CareCentrix works with Payers and over 8,000 qualified Providers to create programs that improve quality and lower the cost of delivering patient care to the home. The IT organization faced an aging storage infrastructure that included VMAX, Data Domain, and an all-flash XtremIO array from EMC. In addition to the complexity of managing three different platforms, the legacy storage infrastructure didn’t provide the space reduction tools or ease of management CareCentrix required. With a requirement to eliminate storage silos and consolidate applications and workloads, CareCentrix selected the Nimble Storage Adaptive Flash platform combined with Veeam for data protection and immediately discovered increased system performance and overall flexibility. The combined Cisco UCS and Nimble arrays and Veeam Enterprise Suite, work seamlessly to deliver annual storage maintenance and power reduction costs of over 8X compared to the silos across their legacy storage environment. In addition, CareCentrix reduced its storage footprint 8X moving from 252RU’s of VMAX to just 30RU’s with Nimble. The ongoing dollar and time savings from the consolidation is being focused on driving strategic IT projects used to streamline and enhance the Payer, Provider and especially the CareCentrix Patient experience.
|
2
| • We partnered with a major systems integration firm to deliver hosted Exchange services to a large US Federal agency that was considering Office 365 or extending their current legacy storage solution as alternatives
• A major law firm selected us as their consolidation platform after evaluating a traditional tier 1 storage array as well as an all-flash array, based on the performance benefits, the simplicity of our data management and our ability to deliver resiliency through InfoSight
Underscoring the differentiation of our Adaptive Flash platform, we were named a Leader in the 2015 Gartner Magic Quadrant for General-Purpose Disk arrays – the only storage vendor built in the last two decades to be in the Leader Quadrant. This is an important validation for us as a company, and key to our success within large enterprises that seek validation in choosing Nimble as their storage vendor.
As customers seek to simplify the deployment of infrastructure, we have partnered with industry leaders to create SmartStack converged infrastructure solutions that are experiencing rapid adoption. Since 2012, Cisco and Nimble Storage have partnered with software partners to develop nine SmartStack reference architecture-based solutions that have been deployed by over 750 enterprises.
We have a proven go-to-market engine for driving growth
Our strategy for driving growth is to acquire customers rapidly, spanning mid-sized enterprises, large global enterprises and cloud service enterprises, across the globe. Even as we acquire new customers rapidly, our storage systems are being deployed in larger and more mission-critical environments, which in turn drives larger transaction sizes. As important as new customer acquisition is, a steady and predictable pattern of repeat purchases by our installed-base customers driven by high levels of customer satisfaction is an even more critical driver of long-term growth. We executed well on several of our key growth drivers during Q3FY16:
• Building a large customer base. During Q3, we acquired 617 new customers to end with an installed base of 6,828. A key driver of our rapid pace of customer acquisition has been the strength of our channel ecosystem as channel initiated bookings accounted for almost half of our total bookings during the quarter, the highest level in over six quarters. We now have over 4,000 accredited system engineers within our channel partner community – a key source of leverage in growing our customer base.
• Rapid growth in large enterprises and cloud service providers. We now have over 400 global enterprises within our customer base, including 78 of the Global 500. Bookings from our global 5000 customers during the last 12 months grew at 65% compared to the previous 12-month period. Our bookings from cloud service providers also grew rapidly, as bookings over the last 12 months grew at 68% compared to the previous 12-month period
• Increasing deployment size. Across our commercial and enterprise customer base, we are seeing ever-larger deployment sizes. Bookings from deals over $100K accounted for 45% of our total bookings, while bookings from deals over $250K were at record levels. A key driver of |
|

3
| being deployed in larger and more mission-critical environments is the continued progress we are seeing with Fibre Channel, as the mix of Fibre Channel grew from 17.4% in Q2FY16 to 23.5% in Q3FY16.
• Growing international contribution. During Q3FY16, we achieved strong growth in EMEA as international revenues grew at 49% compared to Q3FY15, while year-over-year growth would have been 66% on a constant currency basis. |
| |
|
• Land and expand model. One of our key differentiators is the level of resiliency and availability our customers experience with us, the level of visibility that we have into our customers’ environments with InfoSight, and the consequent high level of proactive support we are able to deliver. InfoSight identifies over 90% of support cases proactively before customers call us, and we continue to experience availability well ahead of five 9s across our rapidly expanding installed base. These differentiators translate into a steady pattern of repeat purchases. | ||
|
We plan to make some key investments to drive growth that will constrain short-term profitability
| ||
| Our first priority is to increase the investment in our core commercial business. In addressing this priority, we are leveraging some of our core strengths that have under-pinned our execution from the beginning. Specifically, we have a strong track record of leveraging marketing-led demand generation and our channel partner ecosystem to drive growth and productivity through our territory based sales teams. Over the next few quarters, our plan is to increase investments in ramping our territory based sales teams, and to drive increased pipeline through investments in demand generation and channel programs.
We believe the increased investment in our commercial business is the right business decision given that our mature commercial sales teams, on average, operate at productivity levels that are well above breakeven productivity levels. Therefore, while the incremental investments will constrain our operating leverage over the next few quarters, we believe that these investments will drive growth as well as operating leverage improvements over time. |
Dreamscape Networks delivers web and e-commerce platform for 1,000,000 customers with Nimble
Dreamscape Networks is headquartered in the heart of Dubai Internet City and offers its customers a broad range of Internet services from registering global domain names to hosting services, web and e-commerce, search engine marketing and online tools. Hosting more than 300,000 websites for more than 1,000,000 customers requires a robust IT infrastructure that can scale in line with the increasing demands of the business and expectations of its customers. Running at near peak capacity data recovery was becoming an increasing challenge for the IT team to manage. Rather than continue to scale their legacy EMC infrastructure, they looked toward new and innovative technologies engineered to scale seamlessly and in alignment with escalating customer requirements. Dreamscape Networks selected Nimble arrays following an analysis of different vendor offerings and based on the superior performance characteristics and management simplicity of the Adaptive Flash platform. The customer has deployed additional Nimble arrays for replication and extra redundancy of storage capacity to support more than 800TB of data across its Australia and Europe installations. Dreamscape Networks has gained the advantages of simplified management, increased performance and integrated data protection curing the headaches associated with dedicated silos of backup storage.
| |||
|
Enterprise cloud hosting provider builds industry-leading DRaaS offering with Nimble
The Cloud Services organization at iland, a leading enterprise cloud hosting provider, was seeking an advanced encryption solution to more effectively address the storage and security requirements for its existing clients and accelerate its expansion into new markets. The Nimble Adaptive Flash platform with Federal Information Processing Standard (FIPS) certified software-based encryption proved ideally suited to iland’s requirements. By selecting Nimble as the storage foundation for their Advanced Security Suite – one of their most popular hosted services combined with industry leading back-up software from Veeam and Zerto and security offerings from Nessus, TrendMicro and Hytrust iland can now fully address the performance, capacity, data protection and security requirements that their clients demand. The Nimble Adaptive Flash platform enables iland to deliver access to Oracle, Posgres, Casandra and other workloads with high-performance and consistently low latency. The Cloud Services organization is also realizing higher levels of efficiency from the compact footprint of the Adaptive Flash platform including lower power and cooling costs. iland is now well positioned to meet the advanced requirements of their current clients and scale their offerings in line with the expansion of their business.
|
4
Our second priority is to sustain investment in our large enterprise business. Over the last two years, we have innovated at a rapid pace and have dramatically enhanced our platform value proposition to large, global enterprises. We are continuing to make R&D investments that will broaden the Adaptive Flash platform to address the broadest spectrum of workloads in the enterprise. In parallel, over the last year, we have made investments in enterprise focused sales teams, marketing and channel programs to drive growth. While the time to productivity of these investments is longer given competitive intensity, we believe that these investments will drive sustained growth.
Financial Performance: Q3FY16 Financial Results
As a reminder, all results presented in this letter are on a non-GAAP basis except for revenue and the balance sheet. Non-GAAP results exclude the impact of stock-based compensation.
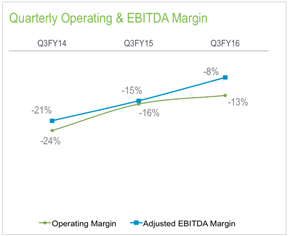
| • | Non-GAAP Operating Loss increased to $10.8 million compared to $9.7 million in Q3FY15. Non-GAAP Operating Margin improved by 300 bps to negative 13% of revenue from negative 16% of revenue in Q3FY15. |
| • | Adjusted EBITDA improved to negative $6.8 million compared to negative $8.6 million in Q3FY15. Adjusted EBITDA Margin improved by 700 bps to negative 8% of revenue from negative 15% of revenue in Q3FY15. |
| • | Non-GAAP EPS was a loss of $0.14 per share compared to a loss of $0.15 per share in Q3FY15. |
| • | Total Cash ended Q3FY16 at $209.7 million, a decrease of $3.8 million during the quarter, and an increase of $1.3 million fiscal year to date. |
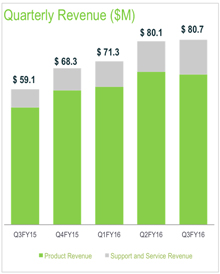
Our financial performance during Q3FY16 was below our expectations. We achieved revenue of $80.7 million, approximately 7% below the mid-point of our guidance of $86 million to $88 million. Our gross margin was 66.9%, a decrease of 20 bps vs. Q3FY15. Our operating loss was $10.8 million, higher than our projected operating loss of $5.0 million to $6.0 million, due to lower than expected revenue and gross margin. Q3 non-GAAP EPS was a loss of $0.14 per share, higher than our guidance of $0.08 to $0.09 loss per share. Our Cash balance decreased by $3.8 million during Q3 due to higher operating losses and capital expenditures.
| Revenue and Non-GAAP Gross Margin
Product revenue for Q3FY16 was $65.6 million, representing 81% of total revenue and an increase of 28% from Q3FY15. The split of product revenue between new and existing customers in Q3FY16 remained consistent over the past four quarters with approximately 45% of total product revenue obtained from our existing installed base of customers. Support and service revenue for Q3FY16, which includes our maintenance and InfoSight service, was $15.1 million, representing 19% of total revenue and an increase of 90% from Q3FY15. Our international business contributed 22% of total revenue during Q3FY16 and grew by 49% from Q3FY15. Within International, revenue from our EMEA operations increased by 54% from a year ago, and revenue from APJ increased by 38% from a year ago. Excluding fluctuations in foreign currency, international revenues would have been 23% of total revenue, with growth of 66% compared to Q3FY15. |
|
5
| At the end of Q3FY16, our total deferred revenue was $105.4 million, an increase of $44.9 million or 74% from Q3FY15. Our deferred revenue consists primarily of payments received for support and service agreements including InfoSight, which have an average life of approximately three years. |
| |
|
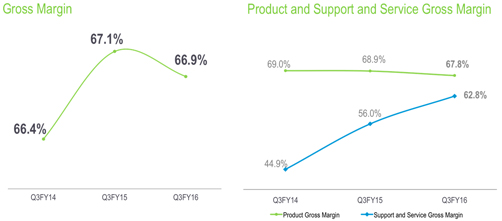
Gross margin was 66.9% in Q3FY16 as a decrease in Product gross margin was partially offset by an increase in Support and Service gross margin. Our reported Gross margin would have been 100 bps higher or 67.9% had exchange rates remained at year ago levels. Our industry leading Gross margin remains above our long term target model of 63% to 65% and continues to reflect the efficiencies of our Adaptive Flash platform.
| ||
| Product gross margin in Q3FY16 was 67.8%, 110 bps lower than the 68.9% achieved in Q3FY15. Our reported Product gross margin would have been 68.9% or flat to prior year had exchange rates remained at year ago levels. However, our Product gross margin decreased by 150 bps from Q2FY16 due to higher discounts, adverse effects of product mix and exchange rate movements, and lower product revenue.
| ||
| Support and service gross margin in Q3FY16 was at a record high of 62.8%, up by 680 bps from 56% in Q3FY15. The expansion in support and service gross margin was driven by increased revenue from our larger base of customers and economies of scale from our support organization, enabled by the automation capabilities of InfoSight.
| ||
| Non-GAAP Operating Expenses and Margin
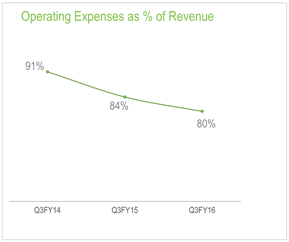
Q3FY16 total operating expenses were $64.8 million or 80% of revenue compared to Q3 last year operating expenses of $49.4 million or 84% of revenue. Our operating expenses increased by 31% vs. last year, compared to our gross profit increase of 36% and our revenue increase of 37%. We ended Q3FY16 with 1,049 employees on board, an increase of 74 during the quarter. Our operating leverage improved by 400 bps mainly driven by R&D and G&A.
• Research and development (R&D) spending in Q3FY16 was $18.0 million or 22% of revenue. Leverage improved by 320 bps compared to Q3FY15 when spending was $15.1 million or 26% of total revenue. Our long-term target for R&D spending is 11% to 13% of total revenue.
• Sales and marketing (S&M) spending in Q3FY16 was $40.7 million or 50% of revenue. Leverage was flat compared to Q3FY15 spending of $29.4 million or 50% of revenue. Our long-term target for S&M spending is 28% to 31% of total revenue.
• General and administrative (G&A) spending in Q3FY16 was $6.0 million or 7% of revenue. Leverage improved by 80 bps compared to Q3FY15 spending of $4.9 million or 8% of revenue. Our long-term target for G&A spending is 5% to 6% of total revenue. |
|
6
Our Q3FY16 operating loss was $10.8 million, $1.1 million above our operating loss of $9.7 million in Q3FY15. Q3FY16 operating margin improved to negative 13% compared to negative 16% in Q3FY15. Our operating margin improvement was due to operating expense leverage offset by slightly lower gross margin compared to Q3FY15. Our Adjusted EBITDA was negative $6.8 million or negative 8% of revenue in Q3FY16 compared to negative $8.6 million or negative 15% of revenue in Q3FY15, an improvement of 700 bps.
Q3FY16 non-GAAP EPS was a loss of $0.14 per share on approximately 79.7 million weighted average basic and diluted shares outstanding compared to a loss of $0.15 per share in Q3FY15. This was weaker than our guidance for a loss of $0.08 to $0.09 per share.
| Balance Sheet and Cash Flow
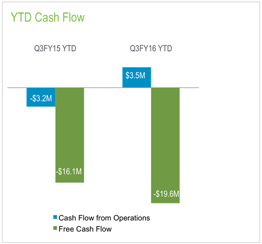
We ended Q3FY16 with cash and cash equivalents of $209.7 million, a decrease of $3.8 million during the quarter. Cash Flow from Operations during Q3FY16 was negative $3.1 million or negative 4% of revenue compared to negative $6.5 million or negative 11% of revenue in Q3FY15. Free Cash Flow during Q3FY16 was negative $12.2 million or negative 15% of revenue compared to negative $11.5 million or negative 19% of revenue in Q3FY15.
In Q3FY16, we achieved a cash conversion cycle of 12 days, in line with the last two quarters and ahead of our target of 20 days. We ended Q3 with accounts receivables of $44.5 million, an increase of $1.4 million from Q2FY16. Days sales outstanding (DSO) were 46 days, an increase of 2 days from Q2FY16 due to less linearity of billings during the quarter. We ended Q3 with inventory of $14.7 million, an increase of $1.0 million from Q2FY16. Days sales in inventory (DSI) were 49 days in Q3FY16, consistent with the last few quarters. |
|
Capex spend during Q3FY16 was $9.1 million, or 11% of revenue as we invested in R&D projects and leasehold improvements.
Q4FY16 Financial Outlook
We are making some key changes that we believe will drive higher growth. However, we also believe that it will take a few quarters to realize their impact. Weighing the factors that caused a slowing of growth during Q3 affects expectations for Q4FY16, our financial guidance for Q4FY16 is as follows:
| • | Total revenue of $87.0 million to $90.0 million |
| • | Non-GAAP operating loss of $8.0 million to $10.0 million |
| • | Non-GAAP net loss of $0.11 to $0.13 per share, based on weighted average basic shares outstanding of approximately 81 million |
We remain committed to achieving our long-term target operating model as we continually assess the appropriate balance of revenue growth, market share expansion, and profitability.
We were founded with a belief that the $40B storage market is going through unprecedented change, and that disk-centric architectures will give way to flash-centric architectures. We believe that our Adaptive Flash platform offers the broadest approach to leveraging flash in the data center. For the last seven quarters of operating as a public company until Q2FY16, this differentiation coupled with strong operational execution translated into strong and consistent financial performance. Although we are disappointed with our financial results during Q3FY16, we fundamentally believe that the foundation we have built as a company is as strong as ever. We also believe that we understand the core drivers of our growth shortfall during Q3, and are taking concrete steps to address those drivers.
As always, we thank our partners and customers for embracing us, and our employees for their dedication to the cause. We also want to thank our investors for their support as we build a business that is a long-term leader in the industry.
7

|

| |||
| Suresh Vasudevan, CEO | Anup Singh, CFO | |||
Conference Call Information:
As previously announced, Nimble Storage will host a live question & answer conference call and webcast today at 5:00 p.m. ET (2:00 p.m. PT) to discuss its financial results for the fiscal third quarter 2016. Interested parties may access the call by dialing (877) 548-7914 in the U.S. or (719) 325-4751 from international locations. In addition, a live audio webcast of the conference call will be available on the Nimble Storage Investor Relations website at http://investors.nimblestorage.com. The live webcast will be archived and available on this site for 45 days. A replay of the conference call will be available for 45 days. To access the replay, please dial 888-203-1112 and enter pass code 940728. Callers outside the U.S. and Canada should dial 719-457-0820 and enter pass code 940728.
Non-GAAP Financial Measures
To provide investors with additional information regarding our financial results, Nimble Storage has disclosed in this release non-GAAP financial measures that are not calculated in accordance with generally accepted accounting principles in the United States, or GAAP. The Company provides non-GAAP gross margin, non-GAAP operating margin, non-GAAP net loss, non-GAAP net loss per basic and diluted share, free cash flow and adjusted EBITDA. In computing many of these non-GAAP financial measures, the Company excludes the effects of stock-based compensation, which is a recurring expense for the Company. The Company has provided reconciliation below of non-GAAP financial measures to the most directly comparable GAAP financial measures.
The Company discloses these non-GAAP financial measures because they are key measures used by the Company’s management and board of directors to understand and evaluate operating performance and trends, to prepare and approve the annual budget and to develop short-term and long-term operational and compensation plans. In particular, the exclusion of certain expenses in calculating non-GAAP financial measures can provide a useful measure for period-to-period comparisons of the Company’s business. Accordingly, the Company believes that these non-GAAP financial measures provide useful information to investors and others in understanding and evaluating the Company’s operating results in the same manner as the Company’s management and board of directors.
Non-GAAP financial measures have limitations as analytical tools and, as such, should not be considered in isolation or as substitutes for analysis of the Company’s results as reported under GAAP. Some of these limitations are:
| • | Non-GAAP financial measures do not consider the potentially dilutive impact of equity-based compensation, which is an ongoing expense for the Company; and |
| • | Other companies, including companies in our industry, may calculate non-GAAP financial measures differently, which reduces their usefulness as comparative measures. |
8
Nimble Storage, Inc.
Reconciliation of GAAP to Non-GAAP Financial Measures
(In thousands, except per share amounts)
(Unaudited)
| Three Months Ended | Nine Months Ended | |||||||||||||||
| October 31, | October 31, | |||||||||||||||
| 2015 | 2014 | 2015 | 2014 | |||||||||||||
| GAAP gross margin |
$ | 52,690 | $ | 38,432 | $ | 151,530 | $ | 103,889 | ||||||||
| Stock-based compensation |
1,291 | 1,235 | 4,957 | 2,826 | ||||||||||||
|
|
|
|
|
|
|
|
|
|||||||||
| Non-GAAP gross margin |
$ | 53,981 | $ | 39,667 | $ | 156,487 | $ | 106,715 | ||||||||
|
|
|
|
|
|
|
|
|
|||||||||
| GAAP operating margin |
$ | (28,348 | ) | $ | (27,128 | ) | $ | (86,769 | ) | $ | (72,684 | ) | ||||
| Stock-based compensation |
17,530 | 17,406 | 60,836 | 42,132 | ||||||||||||
|
|
|
|
|
|
|
|
|
|||||||||
| Non-GAAP operating margin |
$ | (10,818 | ) | $ | (9,722 | ) | $ | (25,933 | ) | $ | (30,552 | ) | ||||
|
|
|
|
|
|
|
|
|
|||||||||
| GAAP net loss |
$ | (28,574 | ) | $ | (28,389 | ) | $ | (87,669 | ) | $ | (74,101 | ) | ||||
| Stock-based compensation |
17,530 | 17,406 | 60,836 | 42,132 | ||||||||||||
|
|
|
|
|
|
|
|
|
|||||||||
| Non-GAAP net loss |
$ | (11,044 | ) | $ | (10,983 | ) | $ | (26,833 | ) | $ | (31,969 | ) | ||||
|
|
|
|
|
|
|
|
|
|||||||||
| Interest income, net |
(66 | ) | (71 | ) | (195 | ) | (89 | ) | ||||||||
| Provision for income taxes |
251 | 219 | 751 | 537 | ||||||||||||
| Depreciation |
4,047 | 2,213 | 10,985 | 6,041 | ||||||||||||
|
|
|
|
|
|
|
|
|
|||||||||
| Adjusted EBITDA |
$ | (6,812 | ) | $ | (8,622 | ) | $ | (15,292 | ) | $ | (25,480 | ) | ||||
|
|
|
|
|
|
|
|
|
|||||||||
| GAAP net loss per share, basic and diluted |
$ | (0.36 | ) | $ | (0.39 | ) | $ | (1.12 | ) | $ | (1.04 | ) | ||||
| Stock-based compensation |
0.22 | 0.24 | 0.78 | 0.59 | ||||||||||||
|
|
|
|
|
|
|
|
|
|||||||||
| Non-GAAP net loss per share |
$ | (0.14 | ) | $ | (0.15 | ) | $ | (0.34 | ) | $ | (0.45 | ) | ||||
|
|
|
|
|
|
|
|
|
|||||||||
| Shares used to compute GAAP net loss per share, basic and diluted |
79,736 | 72,960 | 78,137 | 71,561 | ||||||||||||
|
|
|
|
|
|
|
|
|
|||||||||
| Shares used to compute Non-GAAP net loss per share |
79,736 | 72,960 | 78,137 | 71,561 | ||||||||||||
|
|
|
|
|
|
|
|
|
|||||||||
| GAAP net cash provided by (used in) operating activities |
$ | (3,104 | ) | $ | (6,522 | ) | $ | 3,465 | $ | (3,233 | ) | |||||
| Purchase of property and equipment |
(9,073 | ) | (4,933 | ) | (23,031 | ) | (12,840 | ) | ||||||||
|
|
|
|
|
|
|
|
|
|||||||||
| Free cash flow |
$ | (12,177 | ) | $ | (11,455 | ) | $ | (19,566 | ) | $ | (16,073 | ) | ||||
|
|
|
|
|
|
|
|
|
|||||||||
Forward-Looking Statements
This press release contains “forward-looking” statements that are based on our management’s beliefs and assumptions and on information currently available to management. We intend for such forward-looking statements to be covered by the safe harbor provisions for forward-looking statements contained in the U.S. Private Securities Litigation Reform Act of 1995. Forward-looking statements include all statements other than statements of historical fact contained in this letter, including our current beliefs and expectations concerning our future financial results, product benefits, business plans, strategy and objectives, potential growth drivers and opportunities, competitive position, industry trends and environment and potential market opportunities.
Forward-looking statements are subject to known and unknown risks, uncertainties, assumptions and other factors including, but not limited to, those related to our future financial performance, which is inherently uncertain, unforeseen delays in product development or introduction, uncertainty around market acceptance of our solutions, our ability to increase sales of our solutions, our ability to attract and retain customers and to selling additional solutions to our existing customers, our ability to develop new solutions and bring them to market in a timely manner, pricing pressure (as a result of competition or otherwise), introduction of new technologies and products by other companies, our ability to maintain, protect and enhance our brand and intellectual property, the effectiveness of our channel partners and sales team, our ability to recruit new or keep our existing key talent, global economic conditions and fluctuations in foreign currency rates, and our ability to continue to expand our business and manage our growth. Moreover, we operate in very competitive and rapidly changing environments, and new risks may emerge from time to time. It is not possible for our management to
9
predict all risks, nor can we assess the impact of all factors on our business or the extent to which any factor, or combination of factors, may cause actual results to differ materially from those contained in any forward-looking statements we may make. Further information on these and other factors that could affect our financial results are included in our filings with the Securities and Exchange Commission, and may cause our actual results, performance or achievements to differ materially and adversely from those anticipated or implied by our forward-looking statements.
You should not rely upon forward-looking statements as predictions of future events. Although our management believes that the expectations reflected in our forward-looking statements are reasonable, we cannot guarantee that the future results, levels of activity, performance or events and circumstances described in the forward-looking statements will be achieved or occur. Moreover, neither the Company, nor any other person, assumes responsibility for the accuracy and completeness of the forward-looking statements. We undertake no obligation to publicly update any forward-looking statements for any reason after the date of this presentation to conform these statements to actual results or to changes in our expectations, except as required by law.
Any unreleased services, features or functions whether referenced in this document, Nimble Storage’s website or other press releases or public statements that are not currently available are subject to change at Nimble Storage’s discretion and may not be delivered as planned or at all. Customers who purchase Nimble Storage’s products and services should make their purchase decisions based upon services, features and functions that are currently available.
“Customer” or “Customers” referenced above are Nimble Storage’s end customers. It is Nimble Storage’s practice to identify an end-customer from our channel partners prior to shipment and before any support and services are provided. Products are typically shipped directly to the end-customers of our channel partners. Assuming all other revenue recognition criteria have been met, Nimble Storage generally recognizes product revenue on sales upon shipment, as title and risk of loss are transferred at that time. Nimble Storage recognizes revenue from support and service contracts over the contractual service period.
Nimble Storage, the Nimble Storage logo, CASL, InfoSight, SmartStack, and NimbleConnect are trademarks or registered trademarks of Nimble Storage. Other trade names or words used in this document are the properties of their respective owners.
Press Contact:
Kristalle Cooks
408-514-3313
kristalle@nimblestorage.com
Investor Relations Contact:
Edelita Tichepco
408-514-3379
IR@nimblestorage.com
10