Attached files
| file | filename |
|---|---|
| 8-K - FORM 8-K - Walmart Inc. | form8-kx10312015.htm |

Walmart reports Q3 FY 16 EPS of $1.03,
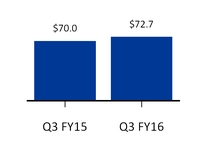
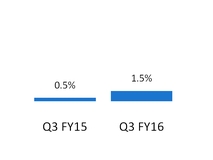
Walmart U.S. added $2.7 billion in sales, comp sales of 1.5%
 | Q3 diluted EPS from continuing operations was $1.03, benefited by approximately $0.04 from an adjustment for certain leases. Currency negatively impacted EPS by $0.04. | "We are pleased with the continued sales growth in Walmart U.S. and in our international business. Strong traffic and our fifth consecutive quarter of positive comps in Walmart U.S. stores show we are taking the right steps to win with customers. Although we still have work to do, we are positioning for sustainable growth through investments in people and technology to deliver a seamless shopping experience at scale." | |||
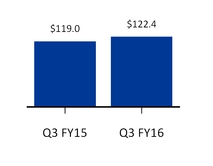
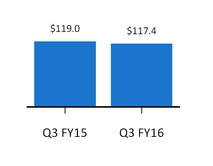
| Total revenue was $117.4 billion. On a constant currency basis1, total revenue was $122.4 billion, an increase of 2.8%. | ||||
| Comp sales at Walmart U.S. were positive for the fifth consecutive quarter, up 1.5%. Traffic increased 1.7%. Customer experience scores continued to strengthen. Neighborhood Market comps increased approximately 8%, with strong growth from newer stores. | ||||
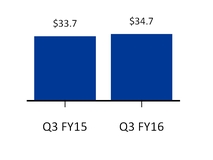
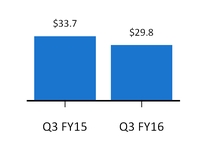
| Walmart International net sales were $29.8 billion. On a constant currency basis1, sales reached $34.7 billion, led by Mexico and Canada. Operating income decreased 6.4%. On a constant currency basis1, operating income increased 8.5%. | ||||
| E-commerce sales and GMV globally increased approximately 10% on a constant currency basis1. Growth was pressured by challenges in key international markets. | ||||
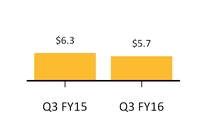
| Investments in people and technology continued. Consolidated operating income declined 8.8%. On a constant currency basis1, consolidated operating income declined 5.4%. | Doug McMillon, President and CEO, Wal-Mart Stores, Inc. | |||
(Amounts in billions, except as noted) | |||||
 | (Consolidated) |
Revenue ex. fx1 | Revenue | Operating income | ||
+2.8% | -1.3% | -8.8% | ||
fx impact ~-$5.0 billion | -5.4 | % | ex. fx 1 | |
The company paid $1.6 billion in dividends and repurchased approximately 6 million shares for $437 million.
Return on investment1 (ROI) for the trailing 12-months ended October 31, 2015 was 15.9%, compared to 16.4% for the prior comparable period. The decline in ROI was primarily due to our decrease in operating income, as well as continued capital investments.
Free cash flow1 was $6.8 billion for the nine months ended October 31, 2015, compared to $7.2 billion in the prior year. The decrease in free cash flow was primarily due to lower income from continuing operations offset by the timing of payments.
1 See additional information at the end of this release regarding non-GAAP financial measures.
NYSE: WMT | November 17, 2015 | stock.walmart.com |
2
 | (U.S.) |
Net sales | Comp sales1 | Operating income | |
+3.8% | Traffic: -0.7% | Traffic: +1.7% | -8.6% |
Ticket: +1.2% | Ticket: -0.2% | ||
E-commerce 20 bps | E-commerce 15 bps | ||
 |
Net sales ex. fx2 | Net sales | Operating income | ||
+3.2% | -11.4% | -6.4% | ||
+8.5 | % | ex. fx 2 | ||
 |
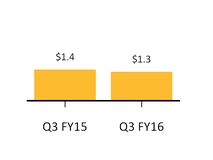
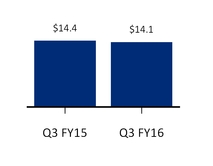
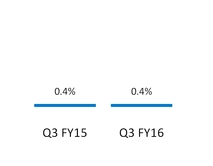
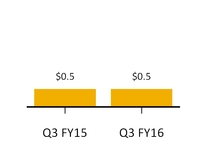
Net sales | Comp sales w/o fuel1,2 | Operating income | |||
-2.2% | Traffic: +0.2% | Traffic: -0.3% | +9.3% | ||
+1.6% ex. fuel 2 | Ticket: +0.2% | Ticket: +0.7% | +8.4 | % | ex. fuel 2 |
E-commerce 20 bps | E-commerce 60 bps | ||||
1 13-week period ended Oct. 30, 2015, compared to 13-week period ended Oct. 31, 2014.
2 See additional information at the end of this release regarding non-GAAP financial measures.
NYSE: WMT | November 17, 2015 | stock.walmart.com |
3
 | "We delivered solid earnings per share that was well within our guidance. Looking ahead, we are narrowing our full-year earnings per share guidance to range between $4.50 and $4.65, including a range of $1.40 to $1.55 for the fourth quarter. This includes ongoing headwinds from currency, which we now expect will impact earnings per share by $0.16, compared to $0.15 from last quarter's guidance. We continue to expect relatively flat total sales growth for the year. Without the currency impact, our full-year total net sales growth would be around 3 percent." Charles Holley, Executive Vice President and CFO, Wal-Mart Stores, Inc. | |||||
EPS Q4 FY16 | EPS FY16 | Walmart U.S. comp2 | Sam’s Club comp w/o fuel1,2 | |||
$1.40 to $1.55 LY: $1.53 | $4.50 to $4.65 LY: $4.99 | around +1% LY: +1.5% | flat to +1% LY: +2.0% | |||
Accounting for certain leases
As we disclosed in the second quarter, we conducted a global review of leases, which included a focus on leases where our payment of certain structural component costs during a lessor's construction of the leased store causes us to be deemed the owner of the property for accounting purposes. In the third quarter, we finalized this review and recorded an immaterial cumulative adjustment. On a consolidated basis, total assets increased by approximately $1.7 billion, primarily representing property under capital lease and financing obligations, total liabilities increased by approximately $1.6 billion, primarily representing additional current and long-term capital lease and financing obligations, and net income increased by approximately $100 million, positively impacting earnings per share by approximately $0.04.
Wal-Mart Stores, Inc. (NYSE: WMT) helps people around the world save money and live better - anytime and anywhere - in retail stores, online, and through their mobile devices. Each week, nearly 260 million customers and members visit our 11,554 stores under 72 banners in 28 countries and e-commerce websites in 11 countries. With fiscal year 2015 revenue of $485.7 billion, Walmart employs approximately 2.2 million associates worldwide. Walmart continues to be a leader in sustainability, corporate philanthropy and employment opportunity. Additional information about Walmart can be found by visiting http://corporate.walmart.com on Facebook at http://facebook.com/walmart and on Twitter at http://twitter.com/walmart.
Investor Relations contact
Pauline Mohler (479) 277-0218
Media Relations contact
Randy Hargrove (800) 331-0085
1 See additional information at the end of this release regarding non-GAAP financial measures.
2 13-week period ending Jan. 29, 2016, compared to 13-week period ended Jan. 30, 2015.
NYSE: WMT | November 17, 2015 | stock.walmart.com |
4
Along with this press release, Walmart makes available a recorded call with executive leaders to review the business results, to provide strategic updates and to comment on expectations for the future. We provide that call in both audio form and in a written transcript. Details on accessing the call are as follows:
• | 877-523-5612 (U.S. and Canada) |
• | 201-689-8483 (other countries) |
• | Passcode: 9256278 (Walmart) |
• | MP3 @ stock.walmart.com |
The call is archived at stock.walmart.com
###
NYSE: WMT | November 17, 2015 | stock.walmart.com |
5
Forward Looking Statements |
This release contains statements as to Walmart management's guidance regarding the diluted earnings per share from continuing operations attributable to Walmart for the three months and the year ending Jan. 31, 2016, Walmart's total sales growth in fiscal 2016, calculated both in accordance with GAAP and on a constant currency basis, and Walmart U.S.'s comparable store sales and Sam's Club's comparable club sales, excluding fuel, for the 13 weeks ending Jan. 29, 2016 and management's expectation for the impact of currency exchange rate fluctuations on Walmart's earnings per share for fiscal 2016. Walmart believes such statements are "forward-looking statements" as defined in, and they are intended to enjoy the protection of the safe harbor for forward-looking statements provided by, the Private Securities Litigation Reform Act of 1995, as amended. Walmart's actual results may differ materially from the guidance provided and the underlying assumptions and management's expectations noted above as a result of changes in circumstances, assumptions not being realized or other risks, uncertainties and factors including:
• | economic, geo-political, capital markets and business conditions, trends and events around the world and in the markets in which Walmart operates; |
• | currency exchange rate fluctuations, changes in market interest rates and commodity prices; |
• | unemployment levels; |
• | competitive pressures; |
• | inflation or deflation, generally and in particular product categories; |
• | consumer confidence, disposable income, credit availability, spending levels, shopping patterns, debt levels and demand for certain merchandise; |
• | consumer enrollment in health and drug insurance programs and such programs' reimbursement rates; |
• | the amount of Walmart's net sales denominated in the U.S. dollar and various foreign currencies; |
• | the financial performance of Walmart and each of its segments; |
• | factors affecting Walmart's effective tax rate, including assessments of certain tax contingencies, valuation allowances, changes in law, administrative audit outcomes, impact of discrete items and the mix of earnings between the U.S. and Walmart's international operations; |
• | customer traffic and average ticket in Walmart's stores and clubs and on its e-commerce websites; |
• | the mix of merchandise Walmart sells, the cost of goods it sells and the shrinkage it experiences; |
• | the amount of Walmart's total sales and operating expenses in the various markets in which Walmart operates; |
• | transportation, energy and utility costs and the selling prices of gasoline and diesel fuel; |
• | supply chain disruptions and disruptions in seasonal buying patterns; |
• | consumer acceptance of and response to Walmart's stores, clubs, e-commerce websites, mobile apps, initiatives, programs and merchandise offerings; |
• | the availability of attractive e-commerce acquisition opportunities; |
• | cyber security events affecting Walmart and related costs; |
• | developments in, outcomes of, and costs incurred in legal proceedings to which Walmart is a party; |
• | casualty and accident-related costs and insurance costs; |
• | the turnover in Walmart's workforce and labor costs, including healthcare and other benefit costs; |
• | changes in accounting estimates or judgments; |
• | changes in existing tax, labor and other laws and changes in tax rates, trade restrictions and tariff rates; |
• | the level of public assistance payments; and |
• | natural disasters, public health emergencies, civil disturbances, and terrorist attacks. |
6
Such risks, uncertainties and factors also include the risks relating to Walmart's operations and financial performance discussed in Walmart's most recent annual report on Form 10-K filed with the SEC. You should read this release in conjunction with that annual report on Form 10-K and Walmart's quarterly reports on Form 10-Q and current reports on Form 8-K subsequently filed with the SEC. You should consider all of the risks, uncertainties and other factors identified above and in those SEC reports carefully when evaluating the forward-looking statements in this release. Walmart cannot assure you that the future results reflected in or implied by any such forward-looking statement will be realized or, even if substantially realized, will have the forecast or expected consequences and effects for or on Walmart's operations or financial performance. Such forward-looking statements are made as of the date of this release, and Walmart undertakes no obligation to update such statements to reflect subsequent events or circumstances.
7
Wal-Mart Stores, Inc.
Condensed Consolidated Statements of Income
(Unaudited)
Three Months Ended | Nine months ended | |||||||||||||||||||||
October 31, | October 31, | |||||||||||||||||||||
(Dollars in millions, except per share data) | 2015 | 2014 | Percent Change | 2015 | 2014 | Percent Change | ||||||||||||||||
Revenues: | ||||||||||||||||||||||
Net sales | $ | 116,598 | $ | 118,076 | (1.3 | )% | $ | 349,930 | $ | 351,579 | (0.5 | )% | ||||||||||
Membership and other income | 810 | 925 | (12.4 | )% | 2,533 | 2,507 | 1.0 | % | ||||||||||||||
Total revenues | 117,408 | 119,001 | (1.3 | )% | 352,463 | 354,086 | (0.5 | )% | ||||||||||||||
Costs and expenses: | ||||||||||||||||||||||
Cost of sales | 87,446 | 89,247 | (2.0 | )% | 263,985 | 265,971 | (0.7 | )% | ||||||||||||||
Operating, selling, general and administrative expenses | 24,248 | 23,489 | 3.2 | % | 71,015 | 68,917 | 3.0 | % | ||||||||||||||
Operating income | 5,714 | 6,265 | (8.8 | )% | 17,463 | 19,198 | (9.0 | )% | ||||||||||||||
Interest: | ||||||||||||||||||||||
Debt | 509 | 561 | (9.3 | )% | 1,555 | 1,601 | (2.9 | )% | ||||||||||||||
Capital lease and financing obligations | 64 | 115 | (44.3 | )% | 428 | 237 | 80.6 | % | ||||||||||||||
Interest income | (21 | ) | (20 | ) | 5.0 | % | (64 | ) | (76 | ) | (15.8 | )% | ||||||||||
Interest, net | 552 | 656 | (15.9 | )% | 1,919 | 1,762 | 8.9 | % | ||||||||||||||
Income from continuing operations before income taxes | 5,162 | 5,609 | (8.0 | )% | 15,544 | 17,436 | (10.9 | )% | ||||||||||||||
Provision for income taxes | 1,748 | 1,783 | (2.0 | )% | 5,212 | 5,810 | (10.3 | )% | ||||||||||||||
Income from continuing operations | 3,414 | 3,826 | (10.8 | )% | 10,332 | 11,626 | (11.1 | )% | ||||||||||||||
Income from discontinued operations, net of income taxes | — | — | 0.0 | % | — | 285 | (100.0 | )% | ||||||||||||||
Consolidated net income | 3,414 | 3,826 | (10.8 | )% | 10,332 | 11,911 | (13.3 | )% | ||||||||||||||
Consolidated net income attributable to noncontrolling interest | (110 | ) | (115 | ) | (4.3 | )% | (212 | ) | (514 | ) | (58.8 | )% | ||||||||||
Consolidated net income attributable to Walmart | $ | 3,304 | $ | 3,711 | (11.0 | )% | $ | 10,120 | $ | 11,397 | (11.2 | )% | ||||||||||
Income from continuing operations attributable to Walmart: | ||||||||||||||||||||||
Income from continuing operations | $ | 3,414 | $ | 3,826 | (10.8 | )% | $ | 10,332 | $ | 11,626 | (11.1 | )% | ||||||||||
Income from continuing operations attributable to noncontrolling interest | (110 | ) | (115 | ) | (4.3 | )% | (212 | ) | (410 | ) | (48.3 | )% | ||||||||||
Income from continuing operations attributable to Walmart | $ | 3,304 | $ | 3,711 | (11.0 | )% | $ | 10,120 | $ | 11,216 | (9.8 | )% | ||||||||||
Basic net income per common share: | ||||||||||||||||||||||
Basic income per common share from continuing operations attributable to Walmart | $ | 1.03 | $ | 1.15 | (10.4 | )% | $ | 3.14 | $ | 3.47 | (9.5 | )% | ||||||||||
Basic income per common share from discontinued operations attributable to Walmart | — | — | 0.0 | % | — | 0.06 | (100.0 | )% | ||||||||||||||
Basic net income per common share attributable to Walmart | $ | 1.03 | $ | 1.15 | (10.4 | )% | $ | 3.14 | $ | 3.53 | (11.0 | )% | ||||||||||
Diluted net income per common share: | ||||||||||||||||||||||
Diluted income per common share from continuing operations attributable to Walmart | $ | 1.03 | $ | 1.15 | (10.4 | )% | $ | 3.13 | $ | 3.46 | (9.5 | )% | ||||||||||
Diluted income per common share from discontinued operations attributable to Walmart | — | — | 0.0 | % | — | 0.05 | (100.0 | )% | ||||||||||||||
Diluted net income per common share attributable to Walmart | $ | 1.03 | $ | 1.15 | (10.4 | )% | $ | 3.13 | $ | 3.51 | (10.8 | )% | ||||||||||
Weighted-average common shares outstanding: | ||||||||||||||||||||||
Basic | 3,210 | 3,229 | 3,221 | 3,231 | ||||||||||||||||||
Diluted | 3,219 | 3,240 | 3,231 | 3,243 | ||||||||||||||||||
Dividends declared per common share | $ | — | $ | — | $ | 1.96 | $ | 1.92 | ||||||||||||||
8
Wal-Mart Stores, Inc.
Condensed Consolidated Balance Sheets
(Unaudited)
(Dollars in millions) | October 31, | January 31, | October 31, | |||||||||
ASSETS | 2015 | 2015 | 2014 | |||||||||
Current assets: | ||||||||||||
Cash and cash equivalents | $ | 6,990 | $ | 9,135 | $ | 6,718 | ||||||
Receivables, net | 5,012 | 6,778 | 6,091 | |||||||||
Inventories | 50,706 | 45,141 | 51,501 | |||||||||
Prepaid expenses and other | 2,404 | 2,224 | 1,531 | |||||||||
Total current assets | 65,112 | 63,278 | 65,841 | |||||||||
Property and equipment: | ||||||||||||
Property and equipment | 176,660 | 177,395 | 177,494 | |||||||||
Less accumulated depreciation | (65,825 | ) | (63,115 | ) | (62,519 | ) | ||||||
Property and equipment, net | 110,835 | 114,280 | 114,975 | |||||||||
Property under capital lease and financing obligations: | ||||||||||||
Property under capital lease and financing obligations | 10,948 | 5,239 | 5,632 | |||||||||
Less accumulated amortization | (4,827 | ) | (2,864 | ) | (3,115 | ) | ||||||
Property under capital lease and financing obligations, net | 6,121 | 2,375 | 2,517 | |||||||||
Goodwill | 17,051 | 18,102 | 18,888 | |||||||||
Other assets and deferred charges | 6,025 | 5,455 | 5,447 | |||||||||
Total assets | $ | 205,144 | $ | 203,490 | $ | 207,668 | ||||||
LIABILITIES AND EQUITY | ||||||||||||
Current liabilities: | ||||||||||||
Short-term borrowings | $ | 4,960 | $ | 1,592 | $ | 6,019 | ||||||
Accounts payable | 40,553 | 38,410 | 39,656 | |||||||||
Dividends payable | 1,589 | — | 1,553 | |||||||||
Accrued liabilities | 19,499 | 19,152 | 18,773 | |||||||||
Accrued income taxes | 587 | 1,021 | 383 | |||||||||
Long-term debt due within one year | 2,746 | 4,791 | 4,854 | |||||||||
Capital lease and financing obligations due within one year | 558 | 287 | 302 | |||||||||
Total current liabilities | 70,492 | 65,253 | 71,540 | |||||||||
Long-term debt | 38,617 | 40,889 | 41,519 | |||||||||
Long-term capital lease and financing obligations | 5,581 | 2,606 | 2,767 | |||||||||
Deferred income taxes and other | 7,824 | 8,805 | 7,789 | |||||||||
Commitments and contingencies | ||||||||||||
Equity: | ||||||||||||
Common stock | 321 | 323 | 323 | |||||||||
Capital in excess of par value | 2,006 | 2,462 | 2,223 | |||||||||
Retained earnings | 87,903 | 85,777 | 80,814 | |||||||||
Accumulated other comprehensive income (loss) | (10,659 | ) | (7,168 | ) | (4,251 | ) | ||||||
Total Walmart shareholders’ equity | 79,571 | 81,394 | 79,109 | |||||||||
Nonredeemable noncontrolling interest | 3,059 | 4,543 | 4,944 | |||||||||
Total equity | 82,630 | 85,937 | 84,053 | |||||||||
Total liabilities and equity | $ | 205,144 | $ | 203,490 | $ | 207,668 | ||||||
9
Wal-Mart Stores, Inc.
Condensed Consolidated Statements of Cash Flows
(Unaudited)
Nine months ended | ||||||||
October 31, | ||||||||
(Dollars in millions) | 2015 | 2014 | ||||||
Cash flows from operating activities: | ||||||||
Consolidated net income | $ | 10,332 | $ | 11,911 | ||||
(Income) loss from discontinued operations, net of income taxes | — | (285 | ) | |||||
Income from continuing operations | 10,332 | 11,626 | ||||||
Adjustments to reconcile consolidated net income to net cash provided by operating activities: | ||||||||
Depreciation and amortization | 7,023 | 6,881 | ||||||
Deferred income taxes | (987 | ) | (233 | ) | ||||
Other operating activities | 644 | 592 | ||||||
Changes in certain assets and liabilities: | ||||||||
Receivables, net | 783 | 459 | ||||||
Inventories | (6,637 | ) | (6,929 | ) | ||||
Accounts payable | 3,603 | 3,068 | ||||||
Accrued liabilities | 662 | 583 | ||||||
Accrued income taxes | (418 | ) | (577 | ) | ||||
Net cash provided by operating activities | 15,005 | 15,470 | ||||||
Cash flows from investing activities: | ||||||||
Payments for property and equipment | (8,223 | ) | (8,243 | ) | ||||
Proceeds from the disposal of property and equipment | 362 | 459 | ||||||
Proceeds from disposal of certain operations | 246 | 671 | ||||||
Other investing activities | 48 | (44 | ) | |||||
Net cash used in investing activities | (7,567 | ) | (7,157 | ) | ||||
Cash flows from financing activities: | ||||||||
Net change in short-term borrowings | 3,537 | (1,843 | ) | |||||
Proceeds from issuance of long-term debt | 41 | 5,120 | ||||||
Payments of long-term debt | (4,422 | ) | (3,883 | ) | ||||
Dividends paid | (4,728 | ) | (4,639 | ) | ||||
Purchase of Company stock | (1,720 | ) | (1,015 | ) | ||||
Dividends paid to noncontrolling interest | (609 | ) | (401 | ) | ||||
Purchase of noncontrolling interest | (890 | ) | (1,804 | ) | ||||
Other financing activities | (468 | ) | (393 | ) | ||||
Net cash used in financing activities | (9,259 | ) | (8,858 | ) | ||||
Effect of exchange rates on cash and cash equivalents | (324 | ) | (18 | ) | ||||
Net increase (decrease) in cash and cash equivalents | (2,145 | ) | (563 | ) | ||||
Cash and cash equivalents at beginning of year | 9,135 | 7,281 | ||||||
Cash and cash equivalents at end of period | $ | 6,990 | $ | 6,718 | ||||
10
Wal-Mart Stores, Inc.
Supplemental Financial Information
(Unaudited)
Net sales and operating income
Net Sales | Operating Income | ||||||||||||||||
Three Months Ended | Three Months Ended | ||||||||||||||||
October 31, | October 31, | ||||||||||||||||
(dollars in millions) | 2015 | 2014 | Percent Change | 2015 | 2014 | Percent Change | |||||||||||
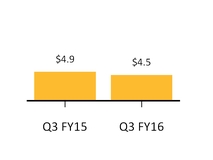
Walmart U.S. | $ | 72,712 | $ | 70,025 | 3.8 | % | $ | 4,506 | $ | 4,932 | -8.6 | % | |||||
Walmart International | 29,811 | 33,659 | -11.4 | % | 1,338 | 1,430 | -6.4 | % | |||||||||
Sam's Club | 14,075 | 14,392 | -2.2 | % | 539 | 493 | 9.3 | % | |||||||||
Corporate and support | — | — | 0.0 | % | -669 | -590 | -13.4 | % | |||||||||
Consolidated | $ | 116,598 | $ | 118,076 | -1.3 | % | $ | 5,714 | $ | 6,265 | -8.8 | % | |||||
U.S. comparable store sales results
Without Fuel | With Fuel | Fuel Impact | ||||||||||
13 Weeks Ended | 13 Weeks Ended | 13 Weeks Ended | ||||||||||
10/30/2015 | 10/31/2014 | 10/30/2015 | 10/31/2014 | 10/30/2015 | 10/31/2014 | |||||||
Walmart U.S. | 1.5% | 0.5% | 1.5% | 0.5% | 0.0% | 0.0% | ||||||
Sam's Club1 | 0.4% | 0.4% | -3.3% | 0.3% | -3.7% | -0.1% | ||||||
Total U.S. | 1.4% | 0.5% | 0.7% | 0.5% | -0.7% | 0.0% | ||||||
1 See additional information at the end of this release regarding non-GAAP financial measures.
11
Wal-Mart Stores, Inc.
Reconciliations of and Other Information Regarding Non-GAAP Financial Measures
(Unaudited)
The following information provides reconciliations of certain non-GAAP financial measures presented in the press release to which this reconciliation is attached to the most directly comparable financial measures calculated and presented in accordance with generally accepted accounting principles (GAAP). The company has provided the non-GAAP financial information presented in the press release, which is not calculated or presented in accordance with GAAP, as information supplemental and in addition to the financial measures presented in the press release that are calculated and presented in accordance with GAAP. Such non-GAAP financial measures should not be considered superior to, as a substitute for or alternative to, and should be considered in conjunction with, the GAAP financial measures presented in the press release. The non-GAAP financial measures in the press release may differ from similar measures used by other companies.
Calculation of Return on Investment and Return on Assets
Management believes return on investment (ROI) is a meaningful metric to share with investors because it helps investors assess how effectively Walmart is deploying its assets. Trends in ROI can fluctuate over time as management balances long-term potential strategic initiatives with possible short-term impacts.
ROI was 15.9 percent and 16.4 percent for the trailing 12 months ended October 31, 2015 and 2014, respectively. The decline in ROI was primarily due to our decrease in operating income, as well as continued capital investments.
We define ROI as adjusted operating income (operating income plus interest income, depreciation and amortization, and rent expense) for the trailing 12 months divided by average invested capital during that period. We consider average invested capital to be the average of our beginning and ending total assets, plus average accumulated depreciation and average amortization, less average accounts payable and average accrued liabilities for that period, plus a rent factor equal to the rent for the fiscal year or trailing 12 months multiplied by a factor of 8. When we have discontinued operations, we exclude the impact of the discontinued operations.
Our calculation of ROI is considered a non-GAAP financial measure because we calculate ROI using financial measures that exclude and include amounts that are included and excluded in the most directly comparable GAAP financial measure. For example, we exclude the impact of depreciation and amortization from our reported operating income in calculating the numerator of our calculation of ROI. In addition, we include a factor of 8 for rent expense that estimates the hypothetical capitalization of our operating leases. We consider return on assets (ROA) to be the financial measure computed in accordance with generally accepted accounting principles (GAAP) that is the most directly comparable financial measure to our calculation of ROI. ROI differs from ROA (which is consolidated income from continuing operations for the period divided by average total assets of continuing operations for the period) because ROI: adjusts operating income to exclude certain expense items and adds interest income; adjusts total assets of continuing operations for the impact of accumulated depreciation and amortization, accounts payable and accrued liabilities; and incorporates a factor of rent to arrive at total invested capital.
Although ROI is a standard financial metric, numerous methods exist for calculating a company's ROI. As a result, the method used by management to calculate our ROI may differ from the methods used by other companies to calculate their ROI. We urge you to understand the methods used by other companies to calculate their ROI before comparing our ROI to that of such other companies.
12
The calculation of ROI, along with a reconciliation to the calculation of ROA, the most comparable GAAP financial measure, is as follows:
Wal-Mart Stores, Inc. | ||||||||||||
Return on Investment and Return on Assets | ||||||||||||
Trailing Twelve Months Ended | ||||||||||||
October 31, | ||||||||||||
(Dollars in millions) | 2015 | 2014 | ||||||||||
CALCULATION OF RETURN ON INVESTMENT | ||||||||||||
Numerator | ||||||||||||
Operating income | $ | 25,412 | $ | 26,545 | ||||||||
+ Interest income | 101 | 103 | ||||||||||
+ Depreciation and amortization | 9,315 | 9,151 | ||||||||||
+ Rent | 2,579 | 2,898 | ||||||||||
Adjusted operating income | $ | 37,407 | $ | 38,697 | ||||||||
Denominator | ||||||||||||
Average total assets of continuing operations1 | $ | 206,406 | $ | 208,481 | ||||||||
+ Average accumulated depreciation and amortization1 | 68,143 | 62,521 | ||||||||||
- Average accounts payable1 | 40,105 | 39,439 | ||||||||||
- Average accrued liabilities1 | 19,136 | 18,690 | ||||||||||
+ Rent x 8 | 20,632 | 23,184 | ||||||||||
Average invested capital | $ | 235,940 | $ | 236,057 | ||||||||
Return on investment (ROI) | 15.9 | % | 16.4 | % | ||||||||
CALCULATION OF RETURN ON ASSETS | ||||||||||||
Numerator | ||||||||||||
Income from continuing operations | $ | 15,520 | $ | 16,170 | ||||||||
Denominator | ||||||||||||
Average total assets of continuing operations1 | $ | 206,406 | $ | 208,481 | ||||||||
Return on assets (ROA) | 7.5 | % | 7.8 | % | ||||||||
As of October 31, | ||||||||||||
Certain Balance Sheet Data | 2015 | 2014 | 2013 | |||||||||
Total assets of continuing operations | $ | 205,144 | $ | 207,668 | $ | 209,295 | ||||||
Accumulated depreciation and amortization | 70,652 | 65,634 | 59,408 | |||||||||
Accounts payable | 40,553 | 39,656 | 39,221 | |||||||||
Accrued liabilities | 19,499 | 18,773 | 18,606 | |||||||||
1 The average is based on the addition of the account balance at the end of the current period to the account balance at the end of the prior period and dividing by 2.
13
Free Cash Flow
We define free cash flow as net cash provided by operating activities in a period minus payments for property and equipment made in that period. Free cash flow was $6.8 billion and $7.2 billion for the nine months ended October 31, 2015 and 2014, respectively. The decrease in free cash flow was due to lower income from continuing operations offset by the timing of payments.
Free cash flow is considered a non-GAAP financial measure. Management believes, however, that free cash flow, which measures our ability to generate additional cash from our business operations, is an important financial measure for use in evaluating the company's financial performance. Free cash flow should be considered in addition to, rather than as a substitute for, consolidated income from continuing operations as a measure of our performance and net cash provided by operating activities as a measure of our liquidity.
Additionally, Walmart's definition of free cash flow is limited, in that it does not represent residual cash flows available for discretionary expenditures, due to the fact that the measure does not deduct the payments required for debt service and other contractual obligations or payments made for business acquisitions. Therefore, we believe it is important to view free cash flow as a measure that provides supplemental information to our Consolidated Statements of Cash Flows.
Although other companies report their free cash flow, numerous methods may exist for calculating a company's free cash flow. As a result, the method used by Walmart's management to calculate our free cash flow may differ from the methods used by other companies to calculate their free cash flow. We urge you to understand the methods used by other companies to calculate their free cash flow before comparing our free cash flow to that of such other companies.
The following table sets forth a reconciliation of free cash flow, a non-GAAP financial measure, to net cash provided by operating activities, which we believe to be the GAAP financial measure most directly comparable to free cash flow, as well as information regarding net cash used in investing activities and net cash used in financing activities.
Nine months ended | ||||||||
October 31, | ||||||||
(Dollars in millions) | 2015 | 2014 | ||||||
Net cash provided by operating activities | $ | 15,005 | $ | 15,470 | ||||
Payments for property and equipment | (8,223 | ) | (8,243 | ) | ||||
Free cash flow | $ | 6,782 | $ | 7,227 | ||||
Net cash used in investing activities1 | $ | (7,567 | ) | $ | (7,157 | ) | ||
Net cash used in financing activities | $ | (9,259 | ) | $ | (8,858 | ) | ||
1 "Net cash used in investing activities" includes payments for property and equipment, which is also included in our computation of free cash flow.
14
Constant Currency
In discussing our operating results, the term currency exchange rates refers to the currency exchange rates we use to convert the operating results for all countries where the functional currency is not the U.S. dollar. We calculate the effect of changes in currency exchange rates as the difference between current period activity translated using the current period's currency exchange rates, and the comparable prior year period's currency exchange rates. Throughout our discussion, we refer to the results of this calculation as the impact of currency exchange rate fluctuations. When we refer to constant currency operating results, this means operating results without the impact of the currency exchange rate fluctuations and without the impact of acquisitions, if any, until the acquisitions are included in both comparable periods. The disclosure of constant currency amounts or results permits investors to understand better Walmart's underlying performance without the effects of currency exchange rate fluctuations or acquisitions.
The table below reflects the calculation of constant currency for total revenues, net sales and operating income for the three and nine months ended ended Oct. 31, 2015.
Three Months Ended October 31, | Nine Months Ended October 31, | ||||||||||||||||||||||
Walmart International | Consolidated | Walmart International | Consolidated | ||||||||||||||||||||
(Dollars in millions) | 2015 | Percent Change | 2015 | Percent Change | 2015 | Percent Change | 2015 | Percent Change | |||||||||||||||
Total revenues: | |||||||||||||||||||||||
As reported | $ | 30,067 | (11.7 | )% | $ | 117,408 | (1.3 | )% | $ | 91,535 | (9.3 | )% | $ | 352,463 | (0.5 | )% | |||||||
Currency exchange rate fluctuations1 | 4,948 | 4,948 | 12,450 | 12,450 | |||||||||||||||||||
Constant currency total revenues | $ | 35,015 | 2.8 | % | $ | 122,356 | 2.8 | % | $ | 103,985 | 3.1 | % | $ | 364,913 | 3.1 | % | |||||||
Net sales: | |||||||||||||||||||||||
As reported | $ | 29,811 | (11.4 | )% | $ | 116,598 | (1.3 | )% | $ | 90,726 | (9.2 | )% | $ | 349,930 | (0.5 | )% | |||||||
Currency exchange rate fluctuations1 | 4,920 | 4,920 | 12,349 | 12,349 | |||||||||||||||||||
Constant currency net sales | $ | 34,731 | 3.2 | % | $ | 121,518 | 2.9 | % | $ | 103,075 | 3.1 | % | $ | 362,279 | 3.0 | % | |||||||
Operating income: | |||||||||||||||||||||||
As reported | $ | 1,338 | (6.4 | )% | $ | 5,714 | (8.8 | )% | $ | 3,685 | (10.6 | )% | $ | 17,463 | (9.0 | )% | |||||||
Currency exchange rate fluctuations1 | 214 | 214 | 536 | 536 | |||||||||||||||||||
Constant currency operating income | $ | 1,552 | 8.5 | % | $ | 5,928 | (5.4 | )% | $ | 4,221 | 2.4 | % | $ | 17,999 | (6.2 | )% | |||||||
1 Excludes currency exchange rate fluctuations related to acquisitions until the acquisitions are included in both comparable periods.
15
Comparable Sales Measures and Sam's Club Measures
The following financial measures presented in the press release to which this reconciliation is attached are non-GAAP financial measures as defined by the SEC's rules:
• | the comparable club sales of the company's Sam's Club operating segment ("Sam's Club") for the 13-week period ended Oct. 30, 2015 and Oct. 31, 2014, the projected comparable club sales of Sam's Club for the 13 weeks ending Jan. 29, 2016 and the comparable club sales of Sam's Club for the 13 weeks ended Jan. 30, 2015, in each case calculated by excluding Sam's Club's fuel sales for such periods (the "Sam's Club Comparable Sales Measures"); |
• | the percentage increase in the net sales of Sam's Club for the three months ended Oct. 31, 2015 over the net sales of Sam's Club for the three months ended Oct. 31, 2014, in each case calculated by excluding Sam's Club's fuel sales for the relevant period; and |
• | the percentage increase in the segment operating income of Sam's Club for the three months ended Oct. 31, 2015 over the segment operating income of Sam's Club for the three months ended Oct. 31, 2014, in each case calculated by excluding Sam's Club's fuel sales for the relevant period (collectively with the financial measures described in the immediately preceding bullet point, the "Sam's Club Measures"). |
We believe the Sam's Club comparable club sales for the historical periods for which the corresponding Sam's Club Comparable Sales Measures are presented calculated by including fuel sales are the financial measures computed in accordance with GAAP most directly comparable to the respective Sam’s Club Comparable Sales Measures. We believe Sam's Club's projected comparable club sales for the 13-week period ending Jan. 29, 2016 calculated by including fuel sales is the financial measure computed in accordance with GAAP most directly comparable to the projected comparable club sales of Sam's Club for the 13-week period ending Jan. 29, 2016 calculated by excluding fuel sales. We believe the percentage decrease in Sam's Club's reported net sales and percentage increase in Sam's Club's reported segment operating income for the periods for which the corresponding Sam's Club Measures are presented are the most directly comparable financial measures computed in accordance with GAAP to the respective Sam’s Club Measures.
We believe that the presentation of the Sam's Club Comparable Sales Measures and the Sam's Club Measures provides useful information to investors regarding the company's financial condition and results of operations because that information permits investors to understand the effect of the fuel sales of Sam's Club, which are affected by the volatility of fuel prices, on Sam's Club's comparable club sales and on Sam's Club's net sales and operating income for the periods presented.
###