Attached files
| file | filename |
|---|---|
| 8-K - 8-K - VORNADO REALTY TRUST | a15-23534_18k.htm |
Exhibit 99.1
|
|
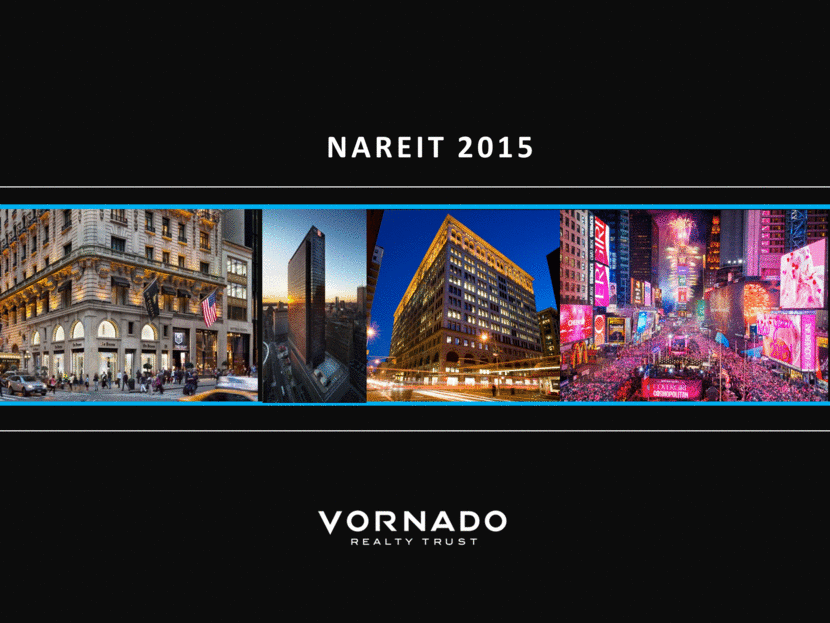
NAREIT 2015 |
|
|
This investor presentation contains certain statements that constitute forward-looking statements as such term is defined in Section 27A of the Securities Act of 1933, as amended, and Section 21E of the Securities Exchange Act of 1934, as amended. Forward-looking statements are not guarantees of future performance. They represent our intentions, plans, expectations and beliefs and are subject to numerous assumptions, risks and uncertainties. Our future results, financial condition and business may differ materially from those expressed in these forward-looking statements. You can find many of these statements by looking for words such as “approximates,” “believes,” “expects,” “anticipates,” “estimates,” “intends,” “plans,” “would,” “may” or other similar expressions in this presentation. Many of the factors that will determine the outcome of our forward-looking statements are beyond our ability to control or predict. For further discussion of factors that could materially affect the outcome of our forward-looking statements, see “Item 1A. Risk Factors” in our Annual Report on Form 10-K for the year ended December 31, 2014. For these statements, we claim the protection of the safe harbor for forward-looking statements contained in the Private Securities Litigation Reform Act of 1995. You are cautioned not to place undue reliance on our forward-looking statements, which speak only as of November 17, 2015. We undertake no duty, and expressly disclaim any obligation, except as may be required by law, to update or revise these forward-looking statements to reflect any new information, future events, developments or otherwise. In this presentation, we provide estimated property values based on capitalization rates. We make no representation or warranty that these amounts represent the value at which the properties could be sold. FORWARD LOOKING STATEMENTS 2 |
|
|
Focused Strategy We have a focused strategy of owning and operating premier assets in Manhattan office, Manhattan street retail and Washington, DC office Premier Assets We own the best quality assets in the key locations in two of the best markets, Manhattan and Washington, DC, that are highly sought after by institutional capital We own the franchise assets in San Francisco and Chicago Large Scale $32 billion market value balance sheet Significant Liquidity We have significant liquidity to take advantage of opportunities – $3.7 billion, comprised of $1.2 billion of cash, restricted cash and marketable securities and $2.5 billion undrawn on our $2.5 billion revolving credit facilities Strong Balance Sheet Low Leverage (excludes debt associated with 220 CPS which is self-liquidating) - Consolidated debt-to-enterprise value ratio of 36.0% / Consolidated debt-to-EBITDA of 7.3x Investment Grade Debt Rating Deep, Experienced Management Team Company snapshot 3 |
|
|
Exited multiple business lines and non-core investments - $8.6 billion of transactions Sold $4.6 billion of real estate assets in 60 transactions with a net gain of $1.3 billion Spun off strip shopping centers into Urban Edge Properties, a $3.6 billion transaction Sold down the Mart business, retaining the 3.6 million square foot Chicago Mart building: Exited the Mall business: Sold non-core investments: Upgraded portfolio through prudent asset recycling Company now focused on premier office and retail in two of the best U.S. markets - New York City and Washington, DC simplification 4 Washington Design Center Boston Design Center Springfield Town Center Monmouth Mall Downtown Crossing Harlem Park JC Penney LNR High Point 350 West Mart Center LA Mart Kings Plaza Green Acres Broadway Mall |
|
|
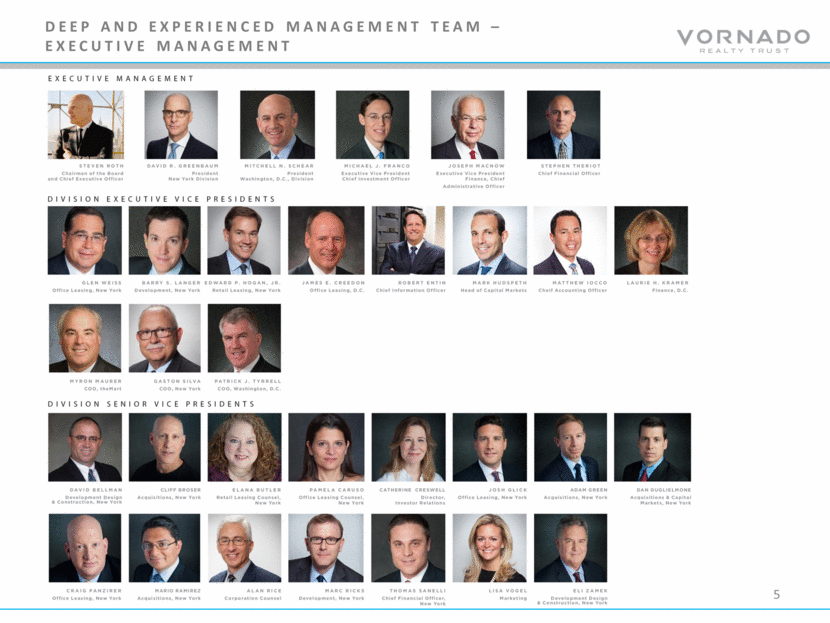
Deep and experienced management team – executive management 5 |
|
|
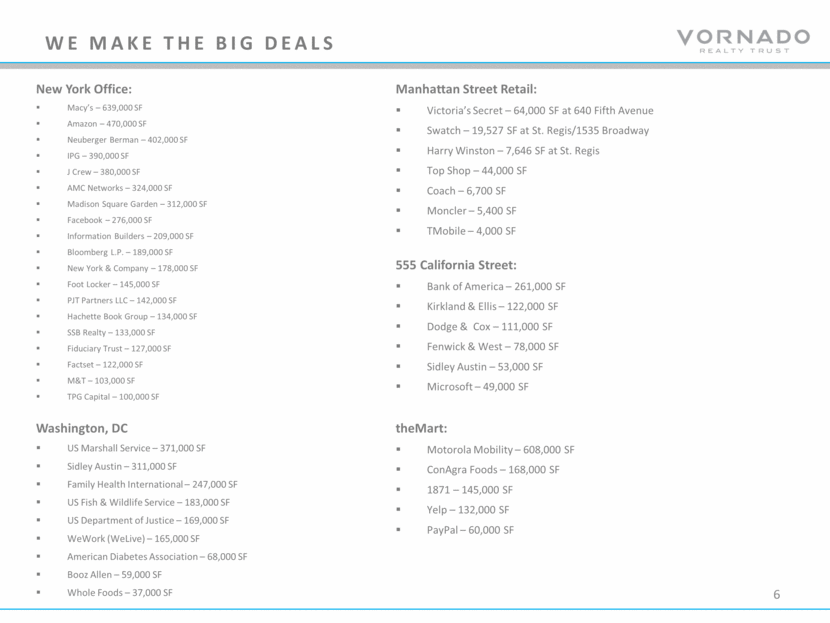
New York Office: Macy’s – 639,000 SF Amazon – 470,000 SF Neuberger Berman – 402,000 SF IPG – 390,000 SF J Crew – 380,000 SF AMC Networks – 324,000 SF Madison Square Garden – 312,000 SF Facebook – 276,000 SF Information Builders – 209,000 SF Bloomberg L.P. – 189,000 SF New York & Company – 178,000 SF Foot Locker – 145,000 SF PJT Partners LLC – 142,000 SF Hachette Book Group – 134,000 SF SSB Realty – 133,000 SF Fiduciary Trust – 127,000 SF Factset – 122,000 SF M&T – 103,000 SF TPG Capital – 100,000 SF We make the big deals Manhattan Street Retail: Victoria’s Secret – 64,000 SF at 640 Fifth Avenue Swatch – 19,527 SF at St. Regis/1535 Broadway Harry Winston – 7,646 SF at St. Regis Top Shop – 44,000 SF Coach – 6,700 SF Moncler – 5,400 SF TMobile – 4,000 SF Washington, DC US Marshall Service – 371,000 SF Sidley Austin – 311,000 SF Family Health International – 247,000 SF US Fish & Wildlife Service – 183,000 SF US Department of Justice – 169,000 SF WeWork (WeLive) – 165,000 SF American Diabetes Association – 68,000 SF Booz Allen – 59,000 SF Whole Foods – 37,000 SF theMart: Motorola Mobility – 608,000 SF ConAgra Foods – 168,000 SF 1871 – 145,000 SF Yelp – 132,000 SF PayPal – 60,000 SF 555 California Street: Bank of America – 261,000 SF Kirkland & Ellis – 122,000 SF Dodge & Cox – 111,000 SF Fenwick & West – 78,000 SF Sidley Austin – 53,000 SF Microsoft – 49,000 SF 6 |
|
|
Asset 666 Fifth Avenue Retail 707.0 St. Regis Retail condo (75%) 525.0 Independence Plaza (50.1%) 423.3 150 West 34th Street (Old Navy) 355.0 655 Fifth Avenue (92.5%) (Ferragamo) 278.0 650 Madison Avenue (20.1%) 260.0 Marriott Times Square Retail & Signage 240.0 260 Eleventh Avenue 190.0 Center Building, Long Island City 142.0 Acquisitions/growth ($ amounts in millions) 7 |

|
|
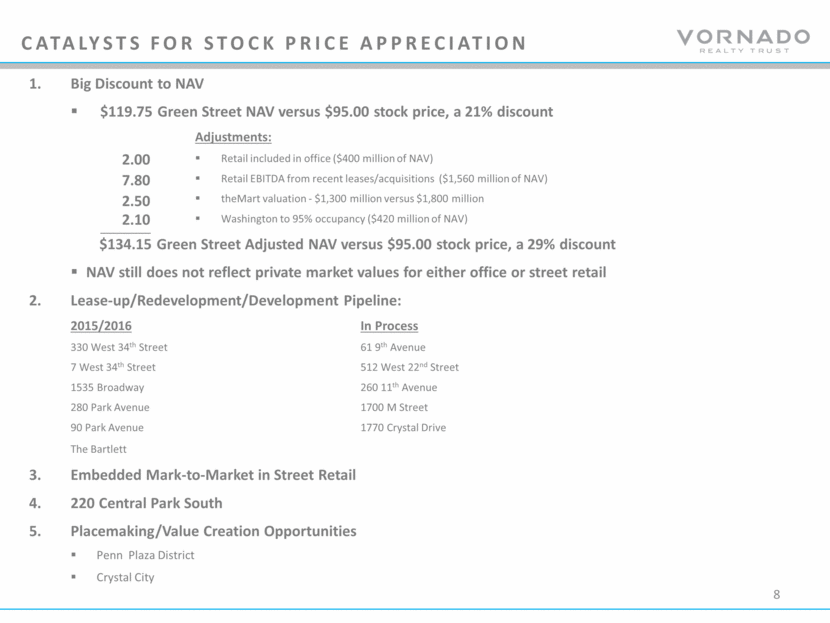
Big Discount to NAV $119.75 Green Street NAV versus $95.00 stock price, a 21% discount Adjustments: Retail included in office ($400 million of NAV) Retail EBITDA from recent leases/acquisitions ($1,560 million of NAV) theMart valuation - $1,300 million versus $1,800 million Washington to 95% occupancy ($420 million of NAV) $134.15 Green Street Adjusted NAV versus $95.00 stock price, a 29% discount NAV still does not reflect private market values for either office or street retail Lease-up/Redevelopment/Development Pipeline: 2015/2016 In Process 330 West 34th Street 61 9th Avenue 7 West 34th Street 512 West 22nd Street 1535 Broadway 260 11th Avenue 280 Park Avenue 1700 M Street 90 Park Avenue 1770 Crystal Drive The Bartlett Embedded Mark-to-Market in Street Retail 220 Central Park South Placemaking/Value Creation Opportunities Penn Plaza District Crystal City Catalysts for stock price appreciation 2.00 7.80 2.50 8 2.10 |
|
|
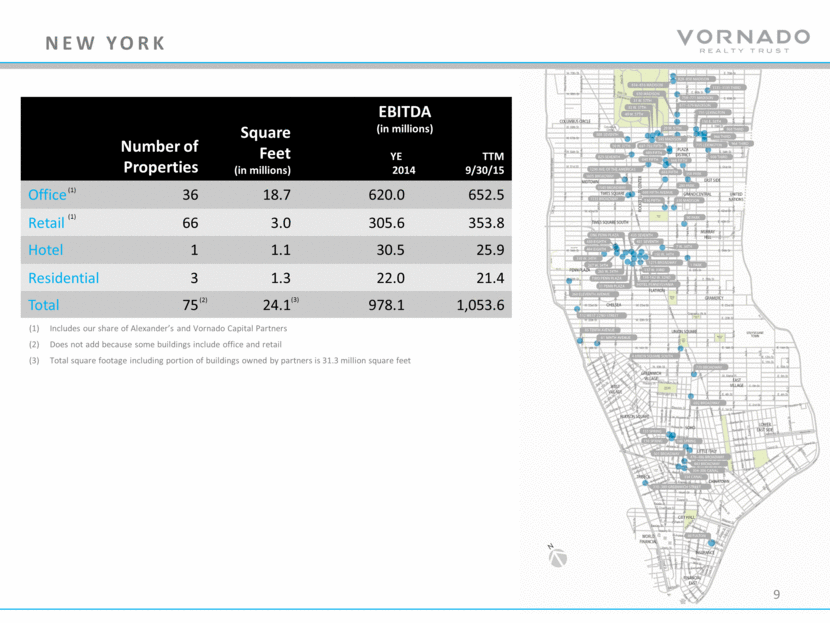
Number of Properties Square Feet (in millions) EBITDA (in millions) YE TTM 2014 9/30/15 Office 36 18.7 620.0 652.5 Retail 66 3.0 305.6 353.8 Hotel 1 1.1 30.5 25.9 Residential 3 1.3 22.0 21.4 Total 75 24.1 978.1 1,053.6 Includes our share of Alexander’s and Vornado Capital Partners Does not add because some buildings include office and retail Total square footage including portion of buildings owned by partners is 31.3 million square feet (2) (3) NEW york (1) (1) 9 |
|
|
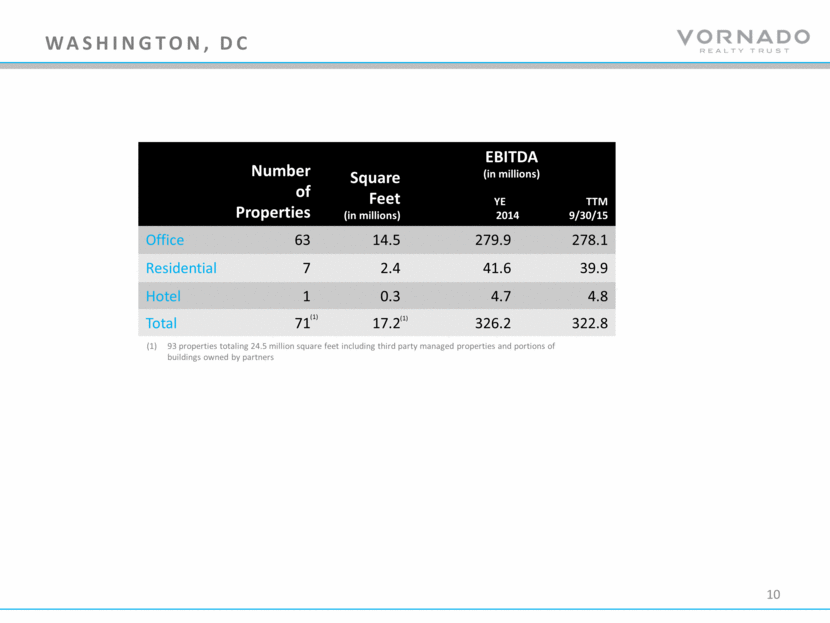
Total 17.2 M SF 1.0 M SF 13.4 M SF 2.8 M SF Number of Properties Square Feet (in millions) EBITDA (in millions) YE TTM 2014 9/30/15 Office 63 14.5 279.9 278.1 Residential 7 2.4 41.6 39.9 Hotel 1 0.3 4.7 4.8 Total 71 17.2 326.2 322.8 93 properties totaling 24.5 million square feet including third party managed properties and portions of buildings owned by partners (1) Washington, dc (1) 10 |
|
|
This investor package and the related discussion contain certain non-GAAP financial measures, including Earnings Before Interest, Taxes, Depreciation, and Amortization (“EBITDA”). EBITDA is presented before noncontrolling interests, discontinued operations, gains on sale of real estate and non-recurring items. A description of these measures and a reconciliation of them to the most directly comparable GAAP measures is provided on the following page. appendix 11 |
|
|
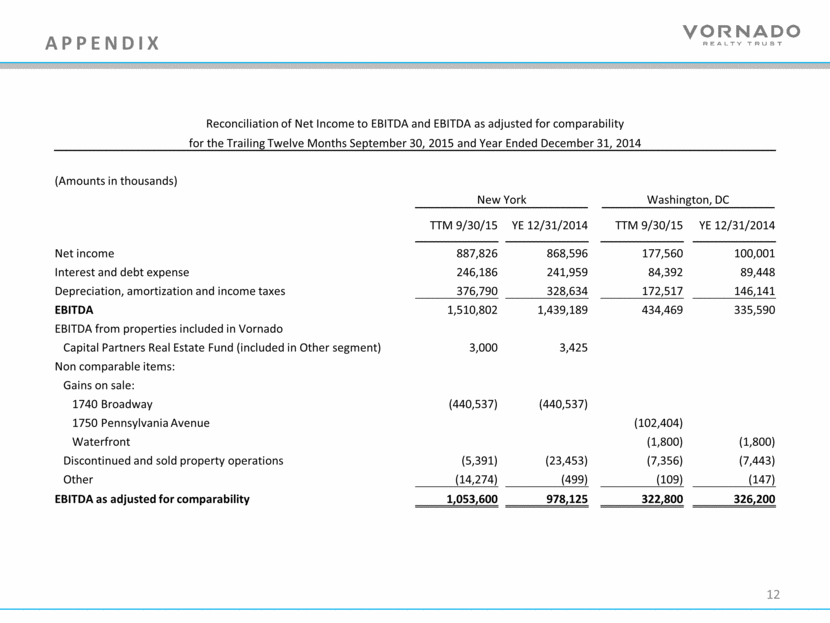
appendix 12 Reconciliation of Net Income to EBITDA and EBITDA as adjusted for comparability for the Trailing Twelve Months September 30, 2015 and Year Ended December 31, 2014 (Amounts in thousands) New York Washington, DC TTM 9/30/15 YE 12/31/2014 TTM 9/30/15 YE 12/31/2014 Net income 887,826 868,596 177,560 100,001 Interest and debt expense 246,186 241,959 84,392 89,448 Depreciation, amortization and income taxes 376,790 328,634 172,517 146,141 EBITDA 1,510,802 1,439,189 434,469 335,590 EBITDA from properties included in Vornado Capital Partners Real Estate Fund (included in Other segment) 3,000 3,425 Non comparable items: Gains on sale: 1740 Broadway (440,537) (440,537) 1750 Pennsylvania Avenue (102,404) Waterfront (1,800) (1,800) Discontinued and sold property operations (5,391) (23,453) (7,356) (7,443) Other (14,274) (499) (109) (147) EBITDA as adjusted for comparability 1,053,600 978,125 322,800 326,200 |
|
|
[LOGO] |