Attached files
| file | filename |
|---|---|
| EX-99.2 - EXHIBIT 99.2 - Sino Agro Food, Inc. | v425006_ex99-2.htm |
| EX-99.1 - EXHIBIT 99.1 - Sino Agro Food, Inc. | v425006_ex99-1.htm |
| 8-K - FORM 8-K - Sino Agro Food, Inc. | v425006_8k.htm |
Exhibit 99.3

Interim Report Third Quarter 2015
Revenue Increases 16% to USD 124.7M with EPS of USD 1.14
Return to Growth in Sale of Goods and Project development
July – September 2015
| · | Revenue for the period: USD 124.7M (107.2) |
| · | Gross profit for the period: USD 32.3M (34.5) |
| · | Gross profit margin: 25.9% (32.2%) |
| · | Net Income attributable to SIAF for the period: USD 21.5M (24.5) |
| · | Diluted earnings per share: USD 1.14 (1.43) |
Key figures
| (USD M, except per share data) | Q3 '15 | Q3 '14 | % | 9M '15 | 9M '14 | % | ||||||||||||||||||
| Revenue | 124.7 | 107.2 | 16 | % | 331.0 | 295.2 | 12 | % | ||||||||||||||||
| Gross profit | 32.3 | 34.5 | -7 | % | 89.8 | 95.4 | -6 | % | ||||||||||||||||
| Gross profit margin | 25.9 | % | 32.2 | % | 27.1 | % | 32.3 | % | ||||||||||||||||
| EBITDA | 29.3 | 32.1 | -9 | % | 79.5 | 90.2 | -12 | % | ||||||||||||||||
| EBITDA margin | 23 | % | 30 | % | 24 | % | 31 | % | ||||||||||||||||
| Net income | 27.7 | 30.9 | -10 | % | 73.5 | 86.1 | -15 | % | ||||||||||||||||
| Net income attributable to SIAF | 21.5 | 24.5 | -12 | % | 54.6 | 68.4 | -20 | % | ||||||||||||||||
| Earnings per share (USD) - fully diluted | 1.14 | 1.43 | -20 | % | 3.0 | 4.3 | -29 | % | ||||||||||||||||
| Diluted weighted average number of shares (millions) | 18.8 | 17.2 | 10 | % | 18.1 | 16.2 | 12 | % | ||||||||||||||||
|
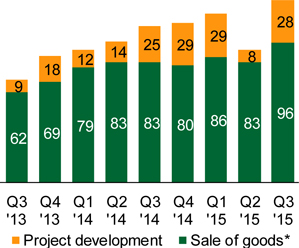
Quarterly revenue (USD M)
|
Quarterly gross profit (USD M)
|

*Including commission and management fees
| Sino Agro Food, Inc. Interim report third quarter 2015 | Page 1 |
Summary of operations
Record setting revenue for the third quarter of 2015 increased by 16 percent to USD 124.7M (107.2). Compared to the second quarter of 2015, revenue growth amounted to USD 33.8M or 37 percent, mainly due to external factors that affected the previous quarter. Revenue from sales of goods increased by 17 percent to USD 96.3M (82.6) primarily due to increased deboning of imported beef at Integrated Cattle Farm (SJAP) and secondarily due to higher seafood production.
| · | Aquaculture sale of goods increased by 24 percent to USD 28.8M (23.2). The increase is mainly due to increased volumes of mixed seafood and prawns. Demonstrating the dynamic nature of RAS, several new, higher profit margin species of fish were sold during the quarter, offsetting the USD 5.5M decrease in eel sales |
| · | Integrated Cattle Farm sale of goods increased by 27 percent to USD 35.5M (27.9) mainly due to increased deboning of imported beef quadrupling production compared to Q3 2014. The increase in deboning volumes substantially offset the effect of lower prices of live cattle |
| · | Revenue from Project development increased by 15 percent to USD 28.4M (24.6) at a rate exceeding three times the previous quarter. Weather improved in August, and the Company completed roof build out to allow interior construction to continue independent of weather conditions. The Zhongshan New Prawn Project (“ZSNPP”) accounted for USD 19.4M or 68% of Product Development revenue |
| Revenue (USD M) | Q3 '15 | Q3 '14 | % | 9M '15 | 9M '14 | |||||||||||||||
| Aquaculture* | 28.8 | 23.2 | 24 | % | 76.2 | 81.9 | ||||||||||||||
| Integrated Cattle Farm (SJAP) | 35.5 | 27.9 | 27 | % | 108.2 | 79.7 | ||||||||||||||
| Organic Fertilizer (HSA) | 4.9 | 5.8 | -16 | % | 14.0 | 15.8 | ||||||||||||||
| Cattle Farms (MEIJI) | 9.6 | 6.8 | 41 | % | 27.4 | 21.5 | ||||||||||||||
| Plantation | 7.4 | 5.8 | 27 | % | 11.6 | 9.1 | ||||||||||||||
| Seafood & Meat Trading | 10.1 | 13.1 | -23 | % | 27.5 | 36.0 | ||||||||||||||
| Sale of goods total | 96.3 | 82.6 | 17 | % | 264.9 | 244.0 | ||||||||||||||
| Aquaculture | 28.4 | 24.6 | 15 | % | 62.3 | 49.6 | ||||||||||||||
| Cattle Farms | - | - | n.a. | - | - | |||||||||||||||
| Seafood & Meat Trading | - | - | n.a. | 3.8 | 1.6 | |||||||||||||||
| Project development total | 28.4 | 24.6 | 15 | % | 66.1 | 51.2 | ||||||||||||||
| Group total | 124.7 | 107.2 | 16 | % | 331.0 | 295.2 | ||||||||||||||
*Including commission & management fees from Prawn Farm 2
| Sino Agro Food, Inc. Interim report third quarter 2015 | Page 2 |
Gross profit decreased 7 percent to USD 32.3M (34.5), equivalent to a margin of 25.9% (32.2%). The decrease was mainly due to lower margins at the Integrated Cattle Farm and Aquaculture segments.
| · | Aquaculture gross profit decreased by 22 percent to USD 5.7M (7.2) equivalent to a margin of 19.7% (31.3%). The decrease is mainly due to a lower eel gross profit of USD 5.1M offset by an increase in mixed seafood gross profit of USD 1.8M |
| · | Integrated Cattle Farm gross profit decreased by 26 percent to USD 6.7M (9.1) equivalent to a margin of 18.9% (32.7%). Live cattle gross profit decreased by USD 3.9M, offset by an increase in the gross profit of quarter cut imported beef deboning of USD 1.6M |
| · | Project development gross profit increased by 2 percent to USD 11.3 (11.0) equivalent to a margin of 39.6% (44.7%) |
G&A expenses increased by 11 percent to USD 4.0M (3.6) reflecting ongoing heightened expenses related to various corporate exercises including listing costs.
Stockholders’ equity increased by 24 percent to USD 464.3M (373.3) or USD 24.66 per share, based on the weighted average number of fully diluted outstanding shares in the quarter, an increase of USD 21.0M or USD 1.12 per share in Q3 2015.
As of September 30 2015, the Company had unrestricted cash and cash equivalents of USD 9.6M (4.7) and net working capital of USD 304.6M.
As of August 11, 2015, there were 18,951,737 shares of common stock outstanding
Net of 280,000 shares securing a new trade facility, as of November, 12, 2015 the outstanding common share count increased less than .7% compared to 18,951,737 as of the last previously reported date, August 11, 2015.
| Gross profit (USD M) | Q3 '15 | Q3 '14 | % | 9M '15 | 9M '14 | |||||||||||||||
| Aquaculture* | 5.7 | 7.2 | -22 | % | 18.3 | 27.3 | ||||||||||||||
| Integrated Cattle Farm (SJAP) | 6.7 | 9.1 | -26 | % | 27.2 | 26.5 | ||||||||||||||
| Organic Fertilizer (HSA) | 1.9 | 1.1 | 75 | % | 5.8 | 5.4 | ||||||||||||||
| Cattle Farms (MEIJI) | 0.6 | 0.4 | 72 | % | 1.3 | 1.1 | ||||||||||||||
| Plantation | 4.9 | 4.1 | 20 | % | 8.0 | 6.4 | ||||||||||||||
| Seafood & Meat Trading | 1.1 | 1.6 | -28 | % | 3.6 | 4.3 | ||||||||||||||
| Sale of goods total | 21.0 | 23.5 | -11 | % | 64.1 | 71.0 | ||||||||||||||
| Aquaculture | 11.3 | 11.0 | 2 | % | 23.3 | 24.3 | ||||||||||||||
| Cattle Farms | - | - | n.a. | - | - | |||||||||||||||
| Seafood & Meat Trading | - | - | n.a. | 2.4 | 0.1 | |||||||||||||||
| Project development total | 11.3 | 11.0 | 2 | % | 25.7 | 24.4 | ||||||||||||||
| Group total | 32.3 | 34.5 | -7 | % | 89.8 | 95.4 | ||||||||||||||
*Including commission & management fees from Prawn Farm 2
| Sino Agro Food, Inc. Interim report third quarter 2015 | Page 3 |
CEO commentary
“Third quarter results met expectations, returning to top-line growth. Sale of goods in both aquaculture and beef continue to perform well, growing revenue by a combined USD 13M.
Due to external factors, lower profitability in eels and live cattle sales reduced operating margins, mitigated by higher volumes of mixed seafood and beef imports.
We have seen some challenges in 2015. These include structurally lower prices for domestic beef in China, exceptionally heavy rains at the wrong time in Zhongshan, a cyclically weak supply of eel elvers, and a restriction on seafood exports in Madagascar. Overcoming each enhances opportunities for 2016. Historically we have adapted well to adversities that are unavoidable in the agriculture business.
Likewise, now at SJAP we are countering currently moderating margins by transitioning the herd, while still growing revenue by deboning imported beef. We are also engaging new export suppliers to replace those in Madagascar, while expanding import and distribution of beef from Australia.
In Aquaculture, similar to the second quarter, the cyclically weak supply of eel elvers resulted in reduced sales of eels. New fresh water species were introduced partially offsetting the decrease in sales, as a response to changing market conditions and prices.
Project development activity and profitability in the third quarter was restored compared to the second quarter. I look forward to reporting stocking and sales at ZSNPP during 2016.
Investments made in previous years at the HU-plantation to increase resilience and yield have paid off in the third quarter, with good performance despite challenging weather throughout this year’s season.
The value of our individual assets has rarely been perceived according to potential. It was not until we proved compelling economics that outside perceptions improved materially, broadening our opportunities. This is why the time is right to begin to spin-off self-sufficient businesses.
Restructuring our businesses as standalone organizations will create better understood and more appreciated businesses, enhancing more value to our shareholders. As announced last week, a separate listing of our aquaculture operations is now underway in Norway; the leading capital market for seafood and the perfect home for our Aquaculture business.”
Mr. Solomon Lee
Chief Executive Officer and Chairman of the Board of Directors
Subsequent events and outlook
A three-year secured trade finance facility amounting to USD 15M was entered into with a China based lender.
The Agricultural Development Bank of China renewed SJAP’s credit facility of RMB 60M, supplemented by an additional new project loan of RMB 35M for new development or possible M&A activity. Under certain conditions, the project loan may be converted to long-term debt.
First stocking of the Zhongshan project is expected in early 2016 with completion of phase 1 and 10 000 MT of seafood capacity targeted to be achieved in 2016. The delay of the stocking is due to certain workmanship in smoothing all tanks that has not been up to standard, thus requiring refurbishment that delayed the installation work of various filters of the tanks. The delay is not expected to have a material impact on the long-term plan of the project. In the meantime, most of the basic infrastructure work for stage 2 of phase 1 has been carried out, preparing for construction of stage 2 tanks starting in December.
At Prawn farm 2 the Company is finalizing roof work for newly developed RAS covered dams using newly improved APM technology. The aim is to improve production capacity to 6-7 harvests per year instead of 2-3 harvests per year of traditional Chinese open dams, while saving water and power costs and better utilizing land.
SJAP plans to expand its deboning capacity to 12 500 MT/year and its freezer capacity to 10 000 MT. The USD 15M trade finance facility provides revolving working capital for imports. Hence, the Company expects trading revenue to grow faster in the remaining months of 2015 and beyond.
| Sino Agro Food, Inc. Interim report third quarter 2015 | Page 4 |
Business divisions
Aquaculture (CA & Tri-Way)
| (USD M) | Q3 '15 | Q3 '14 | % | 9M '15 | 9M '14 | % | ||||||||||||||||||
| Sleepy cod | 2.5 | 1.5 | 62 | % | 6.2 | 7.2 | -14 | % | ||||||||||||||||
| Eels | 8.9 | 14.4 | -38 | % | 29.8 | 56.8 | -48 | % | ||||||||||||||||
| Prawns | 11.1 | 6.8 | 63 | % | 31.9 | 16.7 | 91 | % | ||||||||||||||||
| Prawn post-larvae | 0.2 | 0.5 | -50 | % | 1.3 | 1.2 | 5 | % | ||||||||||||||||
| Mixed seafoods | 6.1 | - | n.a. | 7.1 | - | n.a. | ||||||||||||||||||
| Revenue | 28.8 | 23.2 | 24 | % | 76.2 | 81.9 | -7 | % | ||||||||||||||||
| Sleepy cod | 0.5 | 0.3 | 54 | % | 1.2 | 1.6 | -21 | % | ||||||||||||||||
| Eels | 0.2 | 5.4 | -96 | % | 7.3 | 21.0 | -65 | % | ||||||||||||||||
| Prawns | 2.9 | 1.1 | 164 | % | 6.4 | 3.5 | 82 | % | ||||||||||||||||
| Prawn post-larvae | 0.2 | 0.5 | -50 | % | 1.3 | 1.2 | 5 | % | ||||||||||||||||
| Mixed seafoods | 1.8 | - | n.a. | 2.1 | - | n.a. | ||||||||||||||||||
| Gross profit | 5.7 | 7.2 | -22 | % | 18.3 | 27.3 | -33 | % | ||||||||||||||||
| Sleepy cod | 20.6 | % | 21.7 | % | 20.2 | % | 21.8 | % | ||||||||||||||||
| Eels | 2.5 | % | 37.3 | % | 24.6 | % | 37.0 | % | ||||||||||||||||
| Prawns | 26.0 | % | 16.1 | % | 20.2 | % | 21.2 | % | ||||||||||||||||
| Prawn post-larvae | 100.0 | % | 100.0 | % | 100.0 | % | 100.0 | % | ||||||||||||||||
| Mixed seafoods | 30.2 | % | n.a. | 29.0 | % | n.a. | ||||||||||||||||||
| Gross profit margin | 19.7 | % | 31.3 | % | 24.0 | % | 33.3 | % | ||||||||||||||||
Revenue from Aquaculture sale of goods increased by 24 percent to USD 28.8M (23.2). The increase was primarily due to productivity improvement and introducing new species of fish into our Recirculating Aquaculture System. A reduction in the sale of eel due to a cyclically weak supply of eel elvers was offset by increases in the sale of prawns.
Gross profit decreased by 22 percent to USD 5.7M (7.2) equivalent to a margin of 19.7% (31.3%). The decrease was primarily due to the lower profit generated from the sale of eels. Eel prices were 16 percent lower in 2015, while unit costs rose. The opposite was true of prawns, as prices increased 14 percent year on year while costs remained relatively flat, resulting in a 164% increase in gross profits.
The variation in prices is not atypical, with some species rising and some falling. In this respect, the vitality of the Company’s farms to adapt when supply or price conditions change lends flexibility to optimize overall margins and profitability, within the overall business and market environments. This was evident in Q3 with the introduction of higher margin new fish species, replacing reduced production of eels.
During the quarter and to date, at PF2 the Company approached completion of covering open dams and converting from traditional to modern, using the latest APM technology. Projected cost savings, and yield improvements are significant, potentially tripling the number of harvests per year. If and when proven, the same technique will be applied at ZSNPP with very significant product development savings in time and cost.
Stocking of the first Phase 1, Stage 1 tanks at ZSNPP was delayed due to needed refurbishments causing delayed installation of tank filters. Most of the basic infrastructure work for Phase 1, Stage 2 was carried out, preparing for constructing Stage 2 tanks starting in December.
| Sino Agro Food, Inc. Interim report third quarter 2015 | Page 5 |
| Q3 '15 | Q3 '14 | 2014 | 2013 | |||||||||||||
| Sleepy cod | ||||||||||||||||
| Harvest volume (MT) | 145 | 98 | 1 326 | 2 616 | ||||||||||||
| ASP / kg (USD) | 17.1 | 15.7 | 15.3 | 15.2 | ||||||||||||
| Gross profit / kg (USD) | 3.5 | 3.4 | 3.4 | 2.7 | ||||||||||||
| - Gross profit margin | 21 | % | 22 | % | 22 | % | 18 | % | ||||||||
| Giant mottled eel | ||||||||||||||||
| Harvest volume (MT) | 425 | 577 | 2 461 | 1 661 | ||||||||||||
| ASP / kg (USD) | 21.1 | 25.0 | 23.9 | 16.6 | ||||||||||||
| Gross profit / kg (USD) | 0.5 | 9.3 | 9.8 | 7.7 | ||||||||||||
| - Gross profit margin | 2 | % | 37 | % | 41 | % | 46 | % | ||||||||
| Giant river prawn | ||||||||||||||||
| Harvest volume (MT) | 676 | 483 | 1 802 | 417 | ||||||||||||
| ASP / kg (USD) | 16.4 | 14.1 | 14.8 | 12.3 | ||||||||||||
| Gross profit / kg (USD) | 4.3 | 2.3 | 2.9 | 2.5 | ||||||||||||
| - Gross profit margin | 26 | % | 16 | % | 20 | % | 20 | % | ||||||||
| Mixed Fish | ||||||||||||||||
| Harvest volume (MT) | 1 609 | - | - | - | ||||||||||||
| ASP / kg (USD) | 3.8 | - | - | - | ||||||||||||
| Gross profit / kg (USD) | 1.1 | - | - | - | ||||||||||||
| - Gross profit margin | 30 | % | n.a. | n.a. | n.a. | |||||||||||
Project development
| (USD M) | Q3 '15 | Q3 '14 | % | 9M '15 | 9M '14 | % | ||||||||||||||||||
| Revenue | 28.4 | 24.6 | 15 | % | 62.3 | 49.6 | 26 | % | ||||||||||||||||
| Gross profit | 11.3 | 11.0 | 2 | % | 23.3 | 24.3 | -4 | % | ||||||||||||||||
| Gross profit margin | 39.6 | % | 44.7 | % | 37.3 | % | 49.1 | % | ||||||||||||||||
Revenue from Project development increased by 15 percent to USD 28.4M (24.6). Revenue from the construction and development work done on the Zhongshan New Prawn Project amounted to USD 19.4M, contributing 68% of total Project development revenue. Compared to the second quarter 2015, revenue at ZSNPP increased by USD 10.6M or 120 percent. Heavy rains dampened revenue in Q2. They continued through the first month of Q3.
Gross profit increased by 2 percent to USD 11.3M (11.0) equivalent to a margin of 39.6% (44.7%).
| Sino Agro Food, Inc. Interim report third quarter 2015 | Page 6 |
Integrated Cattle Farm (SJAP) – Cattle operation
| (USD M) | Q3 '15 | Q3 '14 | % | 9M '15 | 9M '14 | % | ||||||||||||||||||
| Live cattle | 16.4 | 17.6 | -7 | % | 48.7 | 52.9 | -8 | % | ||||||||||||||||
| Bulk livestock feed | 1.6 | 1.1 | 47 | % | 5.1 | 3.9 | 33 | % | ||||||||||||||||
| Concentrated livestock feed | 2.7 | 3.1 | -12 | % | 9.5 | 10.1 | -6 | % | ||||||||||||||||
| Fertilizer | 0.6 | 0.4 | 34 | % | 1.8 | 5.4 | -67 | % | ||||||||||||||||
| Revenue | 21.3 | 22.2 | -4 | % | 65.1 | 72.2 | -10 | % | ||||||||||||||||
| Live cattle | 1.1 | 5.0 | -78 | % | 8.1 | 14.9 | -46 | % | ||||||||||||||||
| Bulk livestock feed | 0.9 | 0.6 | 52 | % | 2.7 | 1.9 | 40 | % | ||||||||||||||||
| Concentrated livestock feed | 1.1 | 1.1 | 0 | % | 3.9 | 4.1 | -7 | % | ||||||||||||||||
| Fertilizer | 0.2 | 0.2 | -10 | % | 0.6 | 2.7 | -76 | % | ||||||||||||||||
| Gross profit | 3.3 | 7.0 | -52 | % | 15.3 | 23.7 | -35 | % | ||||||||||||||||
| Live cattle | 6.7 | % | 28.6 | % | 16.6 | % | 28.3 | % | ||||||||||||||||
| Bulk livestock feed | 53.6 | % | 52.0 | % | 52.3 | % | 49.5 | % | ||||||||||||||||
| Concentrated livestock feed | 42.1 | % | 36.8 | % | 40.6 | % | 41.0 | % | ||||||||||||||||
| Fertilizer | 35.0 | % | 52.0 | % | 36.3 | % | 49.8 | % | ||||||||||||||||
| Gross profit margin | 15.6 | % | 31.3 | % | 23.5 | % | 32.8 | % | ||||||||||||||||
Revenue from SJAP's cattle operation decreased by 4 percent to USD 21.3M (22.2). Gross profit from the division decreased by 52 percent to USD 3.3M (7.0) equivalent to a margin of 15.6% (31.3%) mainly due to the lower live cattle prices.
The average of live cattle prices fell by more than USD 450/head based on average prices of RMB25 / Kg (live weight) compared to the average of RMB32 / Kg in Q3 2014 representing a drop of 22 percent in averaged live weight prices of the local cattle.
The increase of bulk livestock feed sales by some 2 891 MT in the quarter is mainly due to the natural increases of cattle being kept by the regional farmers in preparation for the coming winter season.
| Live beef cattle | Q3 '15 | Q3 '14 | 2014 | 2013 | ||||||||||||
| Reared head of Beef cattle (#) | 5 136 | 4 777 | 18 585 | 9 375 | ||||||||||||
| - o/w sold externally as live cattle | 3 936 | 3 932 | 17 185 | 9 375 | ||||||||||||
| - o/w sold internally for valued added processing | 1 200 | 845 | 1 400 | - | ||||||||||||
| ASP per head (USD) | 3 185 | 3 648 | 3 397 | 3 461 | ||||||||||||
| Gross profit per head (USD) | 213 | 1 016 | 1 034 | 1 196 | ||||||||||||
| Gross profit margin | 7 | % | 28 | % | 30 | % | 35 | % | ||||||||
| Animal feed | Q3 '15 | Q3 '14 | 2014 | 2013 | ||||||||||||
| Bulk livestock feed | ||||||||||||||||
| Produced volume (MT) | 8 939 | 6 048 | 37 390 | 38 194 | ||||||||||||
| ASP / MT (USD) | 182 | 182 | 167 | 155 | ||||||||||||
| Gross profit / MT (USD) | 98 | 95 | 83 | 45 | ||||||||||||
| Gross profit margin | 54 | % | 52 | % | 50 | % | 29 | % | ||||||||
| Concentrated livestock feed | ||||||||||||||||
| Produced volume (MT) | 6 000 | 7 625 | 32 191 | 31 717 | ||||||||||||
| ASP / MT (USD) | 452 | 406 | 1 034 | 1 196 | ||||||||||||
| Gross profit / MT (USD) | 200 | 149 | 158 | 162 | ||||||||||||
| Gross profit margin | 44 | % | 37 | % | 15 | % | 14 | % | ||||||||
| Sino Agro Food, Inc. Interim report third quarter 2015 | Page 7 |
Integrated Cattle Farm (SJAP) – Value added processing
| (USD M) | Q3 '15 | Q3 '14 | % | 9M '15 | 9M '14 | % | ||||||||||||||||||
| Slaughter | 0.4 | 0.3 | 29 | % | 0.9 | 0.3 | 175 | % | ||||||||||||||||
| Deboning of locally supplied livestock | 3.4 | 3.6 | -6 | % | 9.1 | 4.3 | 111 | % | ||||||||||||||||
| Deboning of imported beef | 8.3 | 1.7 | 379 | % | 30.9 | 1.7 | 1 686 | % | ||||||||||||||||
| Other | 2.1 | - | n.a. | 2.1 | 1.1 | 96 | % | |||||||||||||||||
| Revenue | 14.2 | 5.7 | 151 | % | 28.9 | 1.8 | 1 506 | % | ||||||||||||||||
| Slaughter | 0.2 | 0.1 | 51 | % | 0.5 | 0.1 | 238 | % | ||||||||||||||||
| Deboning of locally supplied livestock | 0.8 | 1.2 | -37 | % | 2.3 | 1.2 | 90 | % | ||||||||||||||||
| Deboning of imported beef | 2.3 | 0.8 | 199 | % | 9.0 | 0.8 | 1 057 | % | ||||||||||||||||
| Other | 0.1 | - | n.a. | 0.1 | 0.7 | -91 | % | |||||||||||||||||
| Gross profit | 3.4 | 2.1 | 58 | % | 11.9 | 2.8 | 326 | % | ||||||||||||||||
| Slaughter | 50.9 | % | 43.5 | % | 53.4 | % | 43.5 | % | ||||||||||||||||
| Deboning of locally supplied livestock | 22.7 | % | 33.9 | % | 24.7 | % | 27.4 | % | ||||||||||||||||
| Deboning of imported beef | 28.2 | % | 45.1 | % | 29.2 | % | 45.1 | % | ||||||||||||||||
| Other | 2.9 | % | n.a. | 2.9 | % | 63.1 | % | |||||||||||||||||
| Gross profit margin | 23.9 | % | 37.9 | % | 41.1 | % | 155.0 | % | ||||||||||||||||
Revenue from SJAP's Value added processing operation increased by 151 percent to USD 14.2 M (5.7) mainly due to higher volumes of imported quarter cut beef. Gross profit from the division increased by 58 percent to USD 3.4M (2.1) equivalent to a margin of 23.9% (37.9%) mainly due to the lower live cattle prices.
Changing domestic live cattle prices as well as prices of imported beef affect the pricing of final VAP products. However packed and dressed meat prices are not a simple derivation of live cattle prices mainly due to different cuts of meats having different demands and prices. Hence it is difficult for the Company to itemize each and every cut of meat. Therefore, these are presented as averaged figures instead.
| Value added processing | Q3 '15 | Q3 '14 | 2014 | 2013 | ||||||||||||
| Slaughter | ||||||||||||||||
| Sales of associated products (# pieces) | 1 200 | 999 | 1 554 | - | ||||||||||||
| ASP (USD) | 358 | 335 | 346 | - | ||||||||||||
| Gross profit / piece (USD) | 178 | 142 | 158 | - | ||||||||||||
| - Gross profit margin | 50 | % | 42 | % | 46 | % | n.a. | |||||||||
| Packaged meat - local cattle | ||||||||||||||||
| Processed volume (MT) | 301 | 286 | 575 | - | ||||||||||||
| ASP / kg (USD) | 11.3 | 12.6 | 13.5 | - | ||||||||||||
| Gross profit / kg (USD) | 2.6 | 4.3 | 4.0 | - | ||||||||||||
| - Gross profit margin | 23 | % | 34 | % | 30 | % | n.a. | |||||||||
| Packaged meat - imported beef | ||||||||||||||||
| Processed volume (MT) | 996 | 84 | 289 | - | ||||||||||||
| ASP / kg (USD) | 11.3 | 8.7 | 9.5 | - | ||||||||||||
| Gross profit / kg (USD) | 2.6 | 4.1 | 2.6 | - | ||||||||||||
| - Gross profit margin | 23 | % | 47 | % | 27 | % | n.a. | |||||||||
| Sino Agro Food, Inc. Interim report third quarter 2015 | Page 8 |
Organic Fertilizer (HSA)
| (USD M) | Q3 '15 | Q3 '14 | % | 9M '15 | 9M '14 | % | ||||||||||||||||||
| Organic fertilizer | 0.9 | 1.1 | -16 | % | 2.6 | 3.1 | -17 | % | ||||||||||||||||
| Organic mixed fertilizer | 3.9 | 4.7 | -16 | % | 11.4 | 12.6 | -10 | % | ||||||||||||||||
| Revenue | 4.9 | 5.8 | -16 | % | 14.0 | 15.8 | ||||||||||||||||||
| Organic fertilizer | 0.2 | 0.3 | -22 | % | 0.6 | 0.8 | -17 | % | ||||||||||||||||
| Organic mixed fertilizer | 1.7 | 0.8 | 108 | % | 5.1 | 4.6 | 11 | % | ||||||||||||||||
| Gross profit | 1.9 | 1.1 | 75 | % | 5.8 | 5.4 | 7.4 | % | ||||||||||||||||
| Organic fertilizer | 23.9 | % | 25.8 | % | 25.1 | % | 25.0 | % | ||||||||||||||||
| Organic mixed fertilizer | 43.0 | % | 17.3 | % | 45.0 | % | 36.4 | % | ||||||||||||||||
| Gross profit margin | 39.3 | % | 18.9 | % | 41.4 | % | 34.2 | % | ||||||||||||||||
Revenue from HSA decreased by 16 percent to USD 4.9M (5.8). Gross profit increased by 75 percent to USD 1.9M (1.1) equivalent to a margin of 39.3% (18.9%) mainly due to a 32% reduction in raw material costs for organic mixed fertilizer.
Organic Fertilizer remained fairly constant year over year in terms of unit prices received, unit cost prices and volumes sold.
Organic mixed fertilizer accounted for 81 percent of HSA revenue in the quarter and 82 percent of the gross profit. Volumes declined by 14 percent to 8 884 MT (10 383) due to lake fishermen planning fertilizer inventories based on the price of carp. However, eventually they must use Organic mixed fertilizer to provide enough nutrients in the lakes to support their overall production levels and goals. Usually, these type of purchases occur over one or two quarters.
HSA is currently constructing on-site cattle farm facilities.
| Q3 '15 | Q3 '14 | 2014 | 2013 | |||||||||||||
| Organic fertilizer | ||||||||||||||||
| Traded volume (MT) | 3 355 | 4 080 | 14 128 | 19 230 | ||||||||||||
| ASP / MT (USD) | 264 | 264 | 260 | 323 | ||||||||||||
| Gross profit / MT (USD) | 60 | 66 | 84 | 85 | ||||||||||||
| Gross profit margin | 23 | % | 25 | % | 32 | % | 26 | % | ||||||||
| Organic mixed fertilizer | ||||||||||||||||
| Traded volume (MT) | 8 884 | 10 383 | 35 868 | 12 775 | ||||||||||||
| ASP / MT (USD) | 444 | 453 | 452 | 413 | ||||||||||||
| Gross profit / MT (USD) | 191 | 79 | 208 | 220 | ||||||||||||
| - Gross profit margin | 43 | % | 17 | % | 46 | % | 53 | % | ||||||||
| Fertilizer for retail market | ||||||||||||||||
| Traded volume (MT) | 51 | 20 | 120 | - | ||||||||||||
| ASP / MT (USD) | 738 | 927 | 928 | - | ||||||||||||
| Gross profit / MT (USD) | 356 | 584 | 582.0 | - | ||||||||||||
| - Gross profit margin | 48 | % | 63 | % | 63 | % | n.a. | |||||||||
| Sino Agro Food, Inc. Interim report third quarter 2015 | Page 9 |
Cattle Farms (MEIJI)
| (USD M) | Q3 '15 | Q3 '14 | % | 9M '15 | 9M '14 | % | ||||||||||||||||||
| Sale of live cattle | 9.6 | 6.8 | 41 | % | 27.4 | 21.5 | 28 | % | ||||||||||||||||
| Revenue | 9.6 | 6.8 | 41 | % | 27.4 | 21.5 | 28 | % | ||||||||||||||||
| Sale of live cattle | 0.6 | 0.4 | 72 | % | 1.3 | 1.1 | 22 | % | ||||||||||||||||
| Gross profit | 0.6 | 0.4 | 72 | % | 1.3 | 1.1 | 22 | % | ||||||||||||||||
| Sale of live cattle | 6.6 | % | 5.5 | % | 4.8 | % | 5.0 | % | ||||||||||||||||
| Gross profit margin | 6.6 | % | 5.5 | % | 4.8 | % | 5.0 | % | ||||||||||||||||
Revenue from MEIJI increased by 41 percent to USD 9.6M (6.8) mainly due to a 56 percent increase in the volume of cattle sold.
Gross profit from the division increased by 72 percent to USD 0.6M (0.4) equivalent to a margin of 6.6% (5.5%) mainly due to lower per unit production costs despite average sales price per head of cattle sold declined by 10 percent.
| Q3 '15 | Q3 '14 | 2014 | 2013 | |||||||||||||
| Reared head of Beef cattle (#) | 4 449 | 2 846 | 7 842 | 5 597 | ||||||||||||
| ASP per head (USD) | 2 166 | 2 395 | 4 194 | 3 157 | ||||||||||||
| Gross profit per head (USD) | 144 | 131 | 222 | 806 | ||||||||||||
| - Gross profit margin | 7 | % | 5 | % | 5 | % | 26 | % | ||||||||
| Sino Agro Food, Inc. Interim report third quarter 2015 | Page 10 |
HU Plantation (JHST)
| (USD M) | Q3 '15 | Q3 '14 | % | 9M '15 | 9M '14 | % | ||||||||||||||||||
| Fresh HU-flowers | 0.5 | 0 | 15 | % | 1.0 | 0.5 | 114 | % | ||||||||||||||||
| Dried HU-flowers | 6.5 | 4 | 53 | % | 8.7 | 6.4 | 35 | % | ||||||||||||||||
| Immortal vegetables | 0.3 | 1 | -72 | % | 1.8 | 2.2 | -17 | % | ||||||||||||||||
| Vegetable products | 0.1 | - | n.a. | 0.1 | - | n.a. | ||||||||||||||||||
| Revenue | 7.3 | 5.8 | 26 | % | 11.5 | 9.1 | ||||||||||||||||||
| Fresh HU-flowers | 0.3 | 0 | 3 | % | 0.7 | 0.3 | 115 | % | ||||||||||||||||
| Dried HU-flowers | 4.4 | 3 | 43 | % | 6.1 | 4.6 | 31 | % | ||||||||||||||||
| Immortal vegetables | 0.2 | 1 | -73 | % | 1.2 | 1.5 | -19 | % | ||||||||||||||||
| Vegetable products | 0.0 | - | n.a. | 0.0 | - | n.a. | ||||||||||||||||||
| Gross profit | 4.9 | 4.1 | 19 | % | 7.9 | 6.4 | ||||||||||||||||||
| Fresh HU-flowers | 60.5 | % | 67.5 | % | 67.8 | % | 67.5 | % | ||||||||||||||||
| Dried HU-flowers | 67.5 | % | 72.1 | % | 69.7 | % | 71.8 | % | ||||||||||||||||
| Immortal vegetables | 66.3 | % | 66.7 | % | 66.2 | % | 67.8 | % | ||||||||||||||||
| Vegetable products | 54.2 | % | n.a. | 54.2 | % | n.a. | ||||||||||||||||||
| Gross profit margin | 66.9 | % | 70.7 | % | 69.0 | % | 70.6 | % | ||||||||||||||||
Revenue from HU Plantation increased by 26 percent to USD 7.3M (5.8) mainly due to added production of 91 MT (+30%) of dried HU flowers and average unit prices were 18 percent higher. Gross profit from the division increased by 19 percent to USD 4.9M (4.1) equivalent to a margin of 66.9% (70.7%).
This year, the extremely wet season created severe problems for local growers, who contributed very little to this quarter’s volume of 398 MT. Persistent improvements in past years at the HU plantation have succeeded in providing a more reliable, healthy harvest.
| Q3 '15 | Q3 '14 | 2014 | 2013 | |||||||||||||
| Dried HU flower sales | ||||||||||||||||
| Produced volume (MT) | 398 | 307 | 465 | 1 504 | ||||||||||||
| ASP / MT (USD) | 16 294 | 13 802 | 13 832 | 12 412 | ||||||||||||
| Gross profit / MT (USD) | 10 993 | 9 948 | 9 991 | 6 569 | ||||||||||||
| - Gross profit margin | 67 | % | 72 | % | 72 | % | 53 | % | ||||||||
| Fresh HU flower sales | ||||||||||||||||
| Million pieces (#) | 3.0 | 3.0 | 4.0 | 14.4 | ||||||||||||
| ASP / MT (USD) | 0.18 | 0.15 | 0.15 | 0.15 | ||||||||||||
| Gross profit / MT (USD) | 0.11 | 0.10 | 0.10 | 0.10 | ||||||||||||
| - Gross profit margin | 61 | % | 67 | % | 67 | % | 67 | % | ||||||||
| Immortal vegetables | ||||||||||||||||
| Produced volume (MT) | 4 | 15 | 50 | 10 | ||||||||||||
| ASP / MT (USD) | 87 859 | 74 412 | 81 078 | 152 534 | ||||||||||||
| Gross profit / MT (USD) | 58 234 | 49 615 | 54 034 | 103 592 | ||||||||||||
| - Gross profit margin | 66 | % | 67 | % | 67 | % | 68 | % | ||||||||
| Sino Agro Food, Inc. Interim report third quarter 2015 | Page 11 |
SIAF Corporate (Import / Export)
| (USD M) | Q3 '15 | Q3 '14 | % | 9M '15 | 9M '14 | % | ||||||||||||||||||
| Seafood | 2.7 | 11.8 | -77 | % | 12.4 | 34.7 | -64 | % | ||||||||||||||||
| Beef & mutton | 7.3 | 1.4 | 440 | % | 15.1 | 1.4 | 1 015% | |||||||||||||||||
| Revenue | 10.1 | 13.1 | -23 | % | 27.5 | 36.0 | -24 | % | ||||||||||||||||
| Seafood | 0.3 | 1.1 | -73 | % | 1.4 | 3.9 | -64 | % | ||||||||||||||||
| Beef & mutton | 0.8 | 0.4 | 86 | % | 2.2 | 0.4 | 405 | % | ||||||||||||||||
| Gross profit | 1.1 | 1.6 | -28 | % | 3.6 | 4.3 | -16 | % | ||||||||||||||||
| Seafood | 11.1 | % | 9.6 | % | 11.1 | % | 11.1 | % | ||||||||||||||||
| Beef & mutton | 11.1 | % | 32.4 | % | 14.7 | % | 32.4 | % | ||||||||||||||||
| Gross profit margin | 11.1 | % | 11.9 | % | 13.1 | % | 11.9 | % | ||||||||||||||||
Revenue from Import / Export decreased by 23 percent to USD 10.1M (13.1) mainly due to lower seafood sales not entirely offset by the increased import of beef and mutton. The Madagascar government imposed export restrictions, resulting in the Company’s import of seafood decreasing USD 9.0M year on year. Import of beef from Australia increased by USD 6.0M (440%), accounting for 73 percent of sales.
Gross profit from the division decreased by 28 percent to USD 1.1M (1.6) equivalent to a margin of 11.1% (11.9%), roughly in line with the overall revenue decrease.
The Company is confident that this business segment will show rapid growth for several reasons:
| · | Management believes that the Company is positioned to capitalize on the high demand in China for meat and seafood, particularly as the disposable income of China’s middle class rises |
| · | The Company is importing seafood from other countries to bridge the shortfall from Madagascar, and is engaged in establishing new suppliers. |
| · | Subsequent to the end of the quarter, the Company secured a three-year trade finance facility of up to USD 15M to provide revolving working capital for imports. Hence, mainly applied to imported meats, the Company expects trading revenue to grow significantly faster in the remaining months of 2015 and beyond. With a cash conversion cycle of an average of 72 days from first deposit to collection of accounts receivable combined with an operating margin of 11 percent, the implied annual return amount to over 50 percent on the working capital invested into the beef import business |
| Q3 '15 | Q3 '14 | 2014 | 2013 | |||||||||||||
| Mixed seafood | ||||||||||||||||
| Traded volume (MT) | 132 | 728 | 3 152 | 1 521 | ||||||||||||
| ASP / kg (USD) | 20.8 | 16.2 | 15.1 | 14.5 | ||||||||||||
| Gross profit / kg (USD) | 2.3 | 1.5 | 1.4 | 1.9 | ||||||||||||
| Gross profit margin | 11 | % | 10 | % | 9 | % | 13 | % | ||||||||
| Beef & lamb | ||||||||||||||||
| Traded volume (MT) | 955 | 206 | 590 | - | ||||||||||||
| ASP / kg (USD) | 7.7 | 7 | 5.7 | - | ||||||||||||
| Gross profit / kg (USD) | 0.9 | 2 | 2.8 | - | ||||||||||||
| Gross profit margin | 11 | % | 32 | % | 49 | % | n.a. | |||||||||
| Sino Agro Food, Inc. Interim report third quarter 2015 | Page 12 |
Definitions and SEC filings
Please refer to our Form 10-K for definitions of terms used in this report. Filings with the SEC of Sino Agro Food's annual report to stockholders, annual report on Form 10-K, quarterly reports on Form 10-Q, proxy statements, management certifications, press releases, current reports on Form 8-K and other documents are available at the SEC’s website www.sec.gov and at Sino Agro Food's corporate website.
Accounting policies
Sino Agro Food prepares its financial statements in accordance with the Generally Accepted Accounting Principles (US-GAAP) as adopted by the Financial Accounting Standards Board.
Review
The consolidated balance sheets of Sino Agro Food, Inc. and subsidiaries as of September 30, 2015 and September 30, 2014, and the consolidated statements of income and other comprehensive income, the consolidated statements of stockholders’ equity, and the consolidated statements of cash flows for the three months ended September 30, 2015 and September 30, 2014 have been reviewed by the Company's independent registered public accounting firm in accordance with interim standard AU 722 Interim Financial Information as applicable to US public companies and governed by the Public Chartered Accountant Oversight Board, PCAOB.
Safe Harbor Statement
This report contains statements that are not historical facts but rather forward-looking statements within the meaning of the Private Securities Litigation Reform Act of 1995. Such forward-looking statements include those that adress activities, events or developments that Sino Agro Food, Inc. or its management believes or anticipates may occur in the future. All forward-looking statements, including without limitation, management’s examination of historical operating trends and data, as well as estimates of future sales, operating margin, cash flow, effective tax rate or other future operating performance or financial results, are based upon our current expectations, various assumptions and data available from third parties. Our expectations and assumptions are expressed in good faith and we believe there is a reasonable basis for them. However, there can be no assurance that such forward-looking statements will materialize or prove to be correct as forward-looking statements are inherently subject to known and unknown risks, uncertainties and other factors which may cause actual future results, performance or achievements to differ materially from the future results, performance or achievements expressed in or implied by such forward-looking statements. Because these forward-looking statements involve risks and uncertainties, the outcome could differ materially from those set out in the forward-looking statements for a variety of reasons, including without limitation, changes in global light vehicle production; fluctuation in vehicle production schedules for which the Company is a supplier, changes in general industry and market conditions, changes in and the successful execution of our capacity alignment, restructuring and cost reduction initiatives discussed herein and the market reaction thereto; loss of business from increased competition; higher raw material, fuel and energy costs; changes in consumer and customer preferences for end products; customer losses; changes in regulatory conditions; customer bankruptcies or divestiture of customer brands; unfavorable fluctuations in currencies or interest rates among the various jurisdictions in which we operate; component shortages; market acceptance of our new products; costs or difficulties related to the integration of any new or acquired businesses and technologies; continued uncertainty in pricing negotiations with customers, our ability to be awarded new business; product liability, warranty and recall claims and other litigation and customer reactions thereto; higher expenses for our pension and other postretirement benefits; work stoppages or other labor issues; possible adverse results of pending or future litigation or infringement claims; negative impacts of antitrust investigations or other governmental investigations and associated litigation (including securities litigation) relating to the conduct of our business; tax assessments by governmental authorities and changes in our effective tax rate; dependence on key personnel; legislative or regulatory changes limiting our business; political conditions; dependence on and relationships with customers and suppliers; and other risks and uncertainties identified under the headings “Risk Factors” and “Management’s Discussion and Analysis of Financial Condition and Results of Operations” in our Annual Reports and Quarterly Reports on Forms 10-K and 10-Q and any amendments thereto. The Company undertakes no obligation to update publicly or revise any forward-looking statements in light of new information or future events. For any forward-looking statements contained in this or any other document, we claim the protection of the safe harbor for forward-looking statements contained in the Private Securities Litigation Reform Act of 1995, and we assume no obligation to update any such statement.
| Sino Agro Food, Inc. Interim report third quarter 2015 | Page 13 |
Key figures
| (USD M, except for share data) | Q3 2015 | Q3 2014 | % | 9M 2015 | 9M 2014 | % | ||||||||||||||||||
| Earnings | ||||||||||||||||||||||||
| Revenue | 124.7 | 107.2 | 16 | % | 331.0 | 295.2 | 12 | % | ||||||||||||||||
| Gross profit | 32.3 | 34.5 | -7 | % | 89.8 | 95.4 | -6 | % | ||||||||||||||||
| EBITDA | 29.3 | 32.1 | -9 | % | 79.5 | 90.2 | -12 | % | ||||||||||||||||
| Net income attributable to SIAF | 21.5 | 24.5 | -12 | % | 54.6 | 68.4 | -20 | % | ||||||||||||||||
| Share data | ||||||||||||||||||||||||
| Earnings per share (USD) – basic | 1.14 | 1.49 | -23 | % | 3.02 | 4.46 | -32 | % | ||||||||||||||||
| Earnings per share (USD) – fully diluted | 1.14 | 1.43 | -20 | % | 3.02 | 4.26 | -29 | % | ||||||||||||||||
| Weighted average number of shares (million) | 18.8 | 16.5 | 14 | % | 18.1 | 15.5 | 17 | % | ||||||||||||||||
| Diluted weighted average number of shares (millions) | 18.8 | 17.2 | 10 | % | 18.1 | 16.2 | 12 | % | ||||||||||||||||
| Cash flow | ||||||||||||||||||||||||
| Net cash provided by operating activities | -9.2 | -28.0 | -67 | % | 37 | 26 | 40 | % | ||||||||||||||||
| Net cash used in investing activities | -7.4 | 28.5 | -126 | % | -44.5 | -25.6 | 74 | % | ||||||||||||||||
| Net cash provided by (used in) financing activities | 12.8 | 1.1 | n.r. | 9.7 | 3.6 | n.r. | ||||||||||||||||||
| Financial position* | ||||||||||||||||||||||||
| Total assets | 625.8 | 481.0 | 30 | % | ||||||||||||||||||||
| Total liabilities | 80.8 | 49.7 | 63 | % | ||||||||||||||||||||
| Total stockholder's equity | 544.9 | 431.3 | 26 | % | ||||||||||||||||||||
| Net debt | 29.9 | 9.8 | 205 | % | ||||||||||||||||||||
| Capital employed | 574.8 | 439.3 | 31 | % | ||||||||||||||||||||
| Ratios | ||||||||||||||||||||||||
| Gross margin (%) | 25.9 | % | 32.2 | % | 27.1 | % | 32.3 | % | ||||||||||||||||
| EBITDA margin (%) | 23.5 | % | 29.9 | % | 24.0 | % | 30.6 | % | ||||||||||||||||
| Return on capital employed (%) | 20.5 | % | 29.5 | % | 29.0 | % | 44.5 | % | ||||||||||||||||
| Total equity ratio (%) | 87.1 | % | 89.7 | % | ||||||||||||||||||||
| *Closing | balance for relevant period |
| Sino Agro Food, Inc. Interim report third quarter 2015 | Page 14 |
Consolidated income statement
| (USD M) | Q3 2015 | Q3 2014 | 9M 2015 | 9M 2014 | ||||||||||||
| Sale of goods | 96.0 | 82.2 | 263.6 | 242.8 | ||||||||||||
| Consulting and service income from development contracts | 28.4 | 24.6 | 66.1 | 51.2 | ||||||||||||
| Commission and management fee | 0.2 | 0.5 | 1.3 | 1.2 | ||||||||||||
| Total revenue | 124.7 | 107.2 | 331.0 | 295.2 | ||||||||||||
| Sale of goods | -75.3 | -59.1 | -200.8 | -173.0 | ||||||||||||
| Consulting and service income from development contracts | -17.2 | -13.6 | -40.5 | -26.8 | ||||||||||||
| Commission and management fee | - | - | - | - | ||||||||||||
| Cost of goods sold and services | -92.4 | -72.7 | -241.2 | -199.8 | ||||||||||||
| Sale of goods | 20.8 | 23.0 | 62.9 | 69.8 | ||||||||||||
| Consulting and service income from development contracts | 11.3 | 11.0 | 25.7 | 24.4 | ||||||||||||
| Commission and management fee | 0.2 | 0.5 | 1.3 | 1.2 | ||||||||||||
| Total gross profit | 32.3 | 34.5 | 89.8 | 95.4 | ||||||||||||
| General and administrative expenses | -4.0 | -3.6 | -13.9 | -9.5 | ||||||||||||
| Net income from operations | 28.3 | 30.9 | 75.9 | 85.8 | ||||||||||||
| Government grant | 0.7 | 0.1 | 0.9 | 0.3 | ||||||||||||
| Other income | - | 0.2 | 0.2 | 0.2 | ||||||||||||
| Gain of extinguishment of debts | - | 0.0 | - | 0.3 | ||||||||||||
| Interest expense | -1.3 | -0.3 | -3.4 | -0.5 | ||||||||||||
| Net income (expenses) before income taxes | 27.7 | 30.9 | 73.5 | 86.1 | ||||||||||||
| Provision for income taxes | - | - | - | - | ||||||||||||
| Net income | 27.7 | 30.9 | 73.5 | 86.1 | ||||||||||||
| Less: Net (income) loss attributable to the NCI | -6.2 | -6.4 | -18.9 | -17.7 | ||||||||||||
| Net income attributable to SIAF | 21.5 | 24.5 | 54.6 | 68.4 | ||||||||||||
| Foreign currency translation gain (loss) | -4.6 | 0.8 | -3.8 | -0.0 | ||||||||||||
| Less: other comprehensive income attributable to the NCI | -0.6 | -0.1 | -0.8 | 0.0 | ||||||||||||
| Comprehensive income attributable to SIAF | 16.2 | 25.1 | 50.0 | 68.4 | ||||||||||||
| Earnings per share attributable to SIAF: | ||||||||||||||||
| Basic (USD per share) | 1.14 | 1.49 | 3.02 | 4.46 | ||||||||||||
| Diluted (USD per share) | 1.14 | 1.43 | 3.02 | 4.23 | ||||||||||||
| Weighted average number of shares outstanding: | ||||||||||||||||
| Basic (in shares) | 18.8 | 16.5 | 18.8 | 16.5 | ||||||||||||
| Diluted (in shares) | 18.8 | 17.2 | 18.8 | 17.2 | ||||||||||||
| Sino Agro Food, Inc. Interim report third quarter 2015 | Page 15 |
Consolidated balance sheet
| September 30, | June 30, | Dec. 31, | ||||||||||
| (USD M) | 2015 | 2015 | 2015 | |||||||||
| Cash and cash equivalents | 9.6 | 9.2 | 3.0 | |||||||||
| Inventories | 51.1 | 50.2 | 46.0 | |||||||||
| Costs and estimated earnings in excess of billings on uncompleted contracts | 1.3 | 1.3 | 0.0 | |||||||||
| Deposits and prepayments | 85.0 | 84.8 | 76.0 | |||||||||
| Accounts receivable, net of allowance for doubtful accounts | 129.3 | 106.5 | 104.5 | |||||||||
| Other receivables | 66.6 | 68.0 | 52.3 | |||||||||
| Total current assets | 342.9 | 320.0 | 281.8 | |||||||||
| Plant and equipment, net of accumulated depreciation | 76.2 | 68.3 | 64.4 | |||||||||
| Construction in progress | 93.1 | 100.9 | 69.1 | |||||||||
| Land use rights, net of accumulated amortization | 60.0 | 62.6 | 63.3 | |||||||||
| Total plant and equipment | 229.2 | 231.8 | 196.8 | |||||||||
| Goodwill | 0.7 | 0.7 | 0.7 | |||||||||
| Proprietary technologies, net of accumulated amortization | 11.0 | 11.2 | 11.5 | |||||||||
| Long term investment | 0.8 | 0.8 | 0.8 | |||||||||
| Temporary deposits paid to entities for investments in SFJV companies | 41.1 | 41.1 | 41.1 | |||||||||
| Total other assets | 53.6 | 53.8 | 54.1 | |||||||||
| TOTAL ASSETS | 625.8 | 605.6 | 532.7 | |||||||||
| Accounts payable and accrued expenses | 20.5 | 19.6 | 22.1 | |||||||||
| Billings in excess of costs and estimated earnings on uncompleted contracts | 3.9 | 4.6 | 8.1 | |||||||||
| Due to a director | 0.7 | 0.2 | 1.2 | |||||||||
| Series F Non-convertible preferred stock redemption payable | 0.0 | 0.0 | 3.1 | |||||||||
| Other payables | 16.4 | 14.6 | 11.7 | |||||||||
| Borrowings - Short term bank debts | 0.0 | 4.4 | 4.4 | |||||||||
| Bonds payable | 1.7 | 1.7 | 1.7 | |||||||||
| Current liabilities | 43.2 | 45.2 | 52.3 | |||||||||
| Other payables | 0.0 | 0.0 | 0.0 | |||||||||
| Borrowings - Long term debts | 2.2 | 2.3 | 2.3 | |||||||||
| Convertible notes payables | 35.5 | 34.9 | 15.8 | |||||||||
| Non-current liabilities | 37.7 | 42.0 | 18.1 | |||||||||
| TOTAL LIABILITIES | 80.8 | 87.2 | 70.5 | |||||||||
| Common stock: $0.001 par value | 0.0 | 0.0 | 0.0 | |||||||||
| Additional paid - in capital | 134.3 | 130.8 | 121.2 | |||||||||
| Retained earnings | 327.8 | 306.3 | 273.3 | |||||||||
| Accumulated other comprehensive income | 3.4 | 7.4 | 6.5 | |||||||||
| Treasury stock | -1.3 | -1.3 | -1.3 | |||||||||
| Total SIAF stockholders' equity | 464.3 | 443.2 | 399.6 | |||||||||
| Non - controlling interest | 80.7 | 75.1 | 62.6 | |||||||||
| TOTAL STOCKHOLDER'S EQUITY | 544.9 | 518.4 | 462.2 | |||||||||
| TOTAL LIABILITIES AND STOCKHOLDER'S EQUITY | 625.8 | 605.6 | 532.7 | |||||||||
| Sino Agro Food, Inc. Interim report third quarter 2015 | Page 16 |
Consolidated statement of cash flows
| (USD M) | Q3 2015 | Q3 2014 | 9M 2015 | 9M 2014 | ||||||||||||
| Net income for the period | 27.7 | 30.9 | 73.5 | 86.1 | ||||||||||||
| Adjustments to reconcile net income from operations to net cash from operations: | ||||||||||||||||
| Depreciation | 0.5 | 0.6 | 2.1 | 1.8 | ||||||||||||
| Amortization | 0.4 | 0.6 | 1.5 | 1.6 | ||||||||||||
| Common stock issued for services | 0.2 | -0.3 | 1.9 | -0.3 | ||||||||||||
| Gain on extinguishment of debts | - | 0.5 | 0.0 | 0.3 | ||||||||||||
| Other amortized cost | 1.2 | 0.1 | 2.8 | 0.2 | ||||||||||||
| Cash flow from operating activities before change in working capital | 30.1 | 32.4 | 81.9 | 89.7 | ||||||||||||
| (Increase) in inventories | -1.0 | -11.5 | -5.2 | -29.3 | ||||||||||||
| (Increase) in costs and estimated earnings in excess of billings on uncompleted contacts | - | -0.5 | -1.3 | -0.6 | ||||||||||||
| (Increase) decrease in deposits and prepaid expenses | 1.0 | -36.2 | -1.8 | -0.6 | ||||||||||||
| Increase in due to a director | -16.7 | 0.5 | 1.6 | 2.5 | ||||||||||||
| Change in accounts payable and accrued expenses | 0.8 | -3.4 | -1.7 | 5.4 | ||||||||||||
| Increase in other payables | -3.2 | 1.9 | 4.5 | 12.4 | ||||||||||||
| (Increase) in accounts receivable | -22.8 | -5.6 | -24.8 | -40.7 | ||||||||||||
| (Decrease) increase in billings in excess of costs and estimated earnings on uncompleted contracts | -0.8 | -0.1 | -4.2 | 0.2 | ||||||||||||
| (Increase) in other receivables | 3.3 | -5.4 | -12.4 | -12.7 | ||||||||||||
| Change in working capital | -39.2 | -60.3 | -45.2 | -63.4 | ||||||||||||
| Net cash provided by operating activities | -9.2 | -28.0 | 36.7 | 26.3 | ||||||||||||
| Purchases of plant and equipment | -0.0 | -0.0 | -3.9 | -3.4 | ||||||||||||
| Payment for investment in Sino Joint Venture Companies | - | 35.1 | 0.0 | 0.0 | ||||||||||||
| Payment for construction in progress | -7.3 | -6.6 | -40.6 | -22.2 | ||||||||||||
| Net cash used in investing activities | -7.4 | 28.5 | -44.5 | -25.6 | ||||||||||||
| Short term bank loan repaid | -4.1 | - | -4.1 | - | ||||||||||||
| Series F Non-convertible preferred stock redemption | - | - | -3.1 | - | ||||||||||||
| Net proceeds from convertible note payable | 13.4 | - | 13.4 | - | ||||||||||||
| Net proceeds from negotiable promissory notes | 3.5 | - | 3.5 | - | ||||||||||||
| Proceeds from long term debts | - | -2.4 | 0.0 | - | ||||||||||||
| Net cash (used in) provided by financing activities | 12.8 | 1.1 | 9.7 | 3.6 | ||||||||||||
| Effects on exchange rate changes on cash | 4.1 | -0.6 | 4.7 | -0.8 | ||||||||||||
| Increase in cash and cash equivalents | 0.4 | 1.1 | 6.5 | 3.4 | ||||||||||||
| Cash and cash equivalents, beginning of period | 9.2 | 3.6 | 3.0 | 1.3 | ||||||||||||
| Cash and cash equivalents, end of period | 9.6 | 4.7 | 9.6 | 4.7 | ||||||||||||
| Sino Agro Food, Inc. Interim report third quarter 2015 | Page 17 |
Multi-year summary
| (USD M, except for share data) | 2014 | 2013 | 2012 | 2011 | 2010 | |||||||||||||||
| Earnings | ||||||||||||||||||||
| Revenue | 404.3 | 261.4 | 138.6 | 51.9 | 40.6 | |||||||||||||||
| Gross profit | 129.3 | 101.5 | 69.8 | 24.9 | 22.5 | |||||||||||||||
| EBITDA | 119.6 | 98.3 | 63.8 | 21.1 | 21.1 | |||||||||||||||
| Net income attributable to SIAF | 92.1 | 74.2 | 57.5 | 15.7 | 8.5 | |||||||||||||||
| Share data | ||||||||||||||||||||
| Earnings per share (USD) – basic | 5.81 | 6.14 | -0.05 | 1.87 | 2.91 | |||||||||||||||
| Earnings per share (USD) – fully diluted | 5.56 | 5.76 | -0.03 | 1.87 | 2.78 | |||||||||||||||
| Weighted average number of shares (million) | 15.8 | 12.1 | 8.3 | 6.1 | 5.5 | |||||||||||||||
| Diluted weighted average number of shares (millions) | 16.6 | 12.9 | 9.3 | 6.8 | 6.2 | |||||||||||||||
| Cash flow | ||||||||||||||||||||
| Net cash provided by operating activities | 22.0 | 84.2 | 44.4 | 4.6 | 1.4 | |||||||||||||||
| Net cash used in investing activities | -31.5 | -93.3 | -44.4 | -5.4 | -3.9 | |||||||||||||||
| Net cash provided by (used in) financing activities | 9.9 | 0.9 | 6.9 | -0.6 | -0.4 | |||||||||||||||
| Financial position | ||||||||||||||||||||
| Total assets | 532.7 | 367.5 | 243.1 | 151.8 | 107.8 | |||||||||||||||
| Total liabilities | 70.5 | 35.9 | 26.0 | 16.4 | 6.7 | |||||||||||||||
| Total shareholders equity | 462.2 | 331.6 | 217.1 | 135.4 | 101.1 | |||||||||||||||
| Net debt (cash) | 24.2 | 7.8 | -4.1 | -1.2 | 0.1 | |||||||||||||||
| Capital employed | 486.4 | 339.4 | 213.0 | 134.2 | 101.2 | |||||||||||||||
| Ratios | ||||||||||||||||||||
| Gross margin (%) | 32.0 | % | 38.8 | % | 50.4 | % | 48.0 | % | 55.4 | % | ||||||||||
| EBITDA margin (%) | 29.6 | % | 37.6 | % | 46.0 | % | 40.7 | % | 52.0 | % | ||||||||||
| Return on capital employed (%) | 22.3 | % | 26.9 | % | 33.1 | % | 13.3 | % | 8.4 | % | ||||||||||
| Total equity ratio (%) | 86.8 | % | 90.2 | % | 89.3 | % | 89.2 | % | 93.8 | % | ||||||||||
| Sino Agro Food, Inc. Interim report third quarter 2015 | Page 18 |
RECONCILIATION OF NON-U.S. GAAP MEASURES TO U.S. GAAP
In this report we sometimes refer to non-U.S. GAAP measures that we and securities analysts use in measuring Sino Agro Food's performance. We believe that these measures assist investors and management in analyzing trends in the Company's business for the reasons given below. Investors should not consider these non-U.S. GAAP measures as substitutes, but rather as additions, to financial reporting measures prepared in accordance with U.S. GAAP. It should be noted that these measures, as defined, may not be comparable to similarly titled measures used by other companies.
Use of non-U.S. GAAP financial information
Sino Agro Food’s (“SIAF”) financial information includes information prepared in conformity with U.S. Generally Accepted Accounting Principles (US GAAP) as well as non-U.S. GAAP information. It is management’s intent to provide non-U.S. GAAP financial information to enhance understanding of our consolidated financial information as prepared in accordance with U.S. GAAP. This non-U.S. GAAP information should be considered by the reader in addition to, but not instead of, the financial reporting measures prepared in accordance with U.S. GAAP. The non-U.S. GAAP financial information presented may be determined or calculated differently by other companies.
Earnings Before Interest, Taxes, Depreciation and Amortization (“EBITDA”)
EBITDA is a non-U.S. GAAP measurement. Management uses EBITDA because it believes that such measurements are widely accepted financial indicators used by investors and analysts to analyze and compare companies on the basis of operating performance and that these measurements may be used by investors to make informed investment decisions.
| (USD M) | Q3 2015 | Q3 2014 | 9M 2015 | 9M 2014 | ||||||||||||
| Net income from operations | 28.3 | 30.9 | 76 | 86 | ||||||||||||
| Depreciation and Amortization | 1.0 | 1.2 | 3.7 | 4.4 | ||||||||||||
| EBITDA (Non-U.S. GAAP Measure) | 29.3 | 32.1 | 79.5 | 90.2 | ||||||||||||
Return on Capital Employed (“ROCE”)
SIAF believes Return on Capital Employed (ROCE) is a good indicator of long-term company and management performance, both absolute and relative to SIAF's primary peer group. ROCE is a measure of the profitability of SIAF's capital employed in its business compared with that of its peers. SIAF calculates ROCE as a ratio, the numerator of which is Net income plus Interest expense, and the denominator of which is average Total stockholder’s equity plus total interest bearing liabilities.
| (USD M) | Q3 2015 | Q3 2014 | 9M 2015 | 9M 2014 | ||||||||||||
| Numerator | ||||||||||||||||
| Net income | 27.7 | 30.9 | 73.5 | 86.1 | ||||||||||||
| Interest Expense | 1.3 | 0.3 | 3.4 | 0.5 | ||||||||||||
| ROCE Earnings (Non-U.S. GAAP Measure) | 29.0 | 31.1 | 76.9 | 86.5 | ||||||||||||
| Denominator | ||||||||||||||||
| Average capital employed* (Non-U.S. GAAP Measure) | 566 | 422 | 530 | 389 | ||||||||||||
| ROCE (Non-U.S. GAAP Measure) | 20.5 | % | 29.5 | % | 29.0 | % | 44.5 | % | ||||||||
*Average of current and previous period Total stockholder's equity and Interest bearing liabilities minus cash and cash equivalents
| Sino Agro Food, Inc. Interim report third quarter 2015 | Page 19 |
Net Debt
Management uses Net Debt, along with other factors, to evaluate SIAF’s financial condition. Management believe that Net Debt is an appropriate supplemental measure of financial condition and may be useful to investors because it provides a more complete understanding of our financial condition before the impact of our decisions regarding the appropriate use of cash and liquid investments.
Net Debt include the aggregate interest bearing debt obligations in SIAF’s consolidated balance sheet, less the balance sheet line item Cash and cash equivalents.
| (USD M) | September 30, 2015 | September 30, 2014 | ||||||
| Short term bank loan | - | - | ||||||
| Series F Non-convertible preferred stock | - | 3.1 | ||||||
| Other non-current payables | - | - | ||||||
| Long term debts | 2.2 | 2.6 | ||||||
| Bonds payable | 1.7 | 1.7 | ||||||
| Convertible bond payables | 35.5 | 7.0 | ||||||
| Cash and cash equivalents | -9.6 | -4.7 | ||||||
| Net Debt (Non-U.S. GAAP Measure) | 29.9 | 9.8 | ||||||
| Sino Agro Food, Inc. Interim report third quarter 2015 | Page 20 |
This is Sino Agro Food
SIAF is an agriculture technology and natural food holding company with principal operations in the People’s Republic of China. The Company acquires and maintains equity stakes in a cohesive portfolio of companies that SIAF forms according to its core mission to produce, distribute, market and sell natural, sustainable protein food and produce, primarily seafood and cattle, to the rapidly growing middle class in China. SIAF provides financial oversight and strategic direction for each company, and for the interoperation between companies, stressing vertical integration between the levels of the Company’s subsidiary food chain. The Company owns or licenses patents, proprietary methods, and other intellectual properties in its areas of expertise. SIAF provides consulting and services to joint venture partners to construct and operate food businesses, primarily producing wholesale fish and cattle. Further joint ventures market and distribute the wholesale products as part of an overall “farm to plate” concept and business strategy.
Aquaculture (CA and Tri-Way)
Aquaculture refers to the operations of Capital Award Inc. (CA) and Tri-way (holding company of Fish Farm 1) covering its engineering, technology and consulting service management of fishery farms and seafood sales operations and marketing. CA generates revenue as the sole marketing, sales and distribution agent of the fishery farms (covering both of the fish, prawns and eel farms) developed by CA itself in China. Also, it generates sales to and derived from the unincorporated companies EBAPCD and ZSAPP (Prawn Farm 1 & Prawn farm 2). In addition, CA sells Engineering and Technology Services via Consulting and Service Contracts for the development, construction, and supply of plant and equipment, and management of fishery (and prawn or shrimp) farms and related business operations, including the Zhongshan New Prawn Project ("ZSNP").
Integrated Cattle Farm (SJAP)
Integrated Cattle Farm refers to the operation of SJAP in manufacturing and sales of Organic Fertilizer, bulk livestock feed, concentrated livestock feed, and the sales of live cattle inclusive of:
(b). Cattle that are not being slaughtered in our own slaughterhouse operated by Qinghai Zhong He Meat Products Co.,
Limited (“QZH”. These are sold live to third party livestock wholesalers.
(a). Cattle that are sold to QZH and slaughtered, deboned and packed by QZH. The sales of deboned and packed meats by QZH are sold to various meat distributors, wholesalers and super market chains and our own retail butcher stores
Organic Fertilizer (HSA)
Hunan Shenghua A Power Agriculture Co. Ltd. (“HSA”) manufactures and sells Organic Fertilizer.
Cattle Farms (MEIJI)
Cattle Farm refers to the operations of Cattle Farm (1) under Jiangmen City Hang Mei Cattle Farm Development Co. Ltd
(“JHMC”). Cattle are sold live to third party livestock wholesalers who in turn resell them mainly in Guangzhou and Beijing livestock wholesale markets. The financial statements of JHMC are consolidated into MEIJI as one entity along with MEIJI’s operation in the consulting and service for development of other Cattle Farms (i.e., Cattle Farm 2) or related projects.
HU Plantation (JHST)
Plantation refers to the operations of Jiangmen City Heng Sheng Tai Agriculture Development Co. Ltd. (“JHST”) The HU
Plantation business grows, harvests and sells dragon fruit flowers (dried and fresh) and immortal vegetables to wholesale and retail markets JHST’s financial statements are consolidated into the financial statements of Macau EIJI Company Ltd. (“MEIJI”) as one entity.
SIAF Corporate / Seafood & Meat Trading
SIAF Corporate / Seafood & Meat Trading refers to the business operations of Sino Agro Food, Inc., including import / export business and consulting and service operations provided to projects that are not included in the above categories, and are not limited to corporate affairs.
| Sino Agro Food, Inc. Interim report third quarter 2015 | Page 21 |
For further information
| The Company | Auditor |
| Peter Grossman | Anthony Kam |
| Investor Relations | Suite 2105, |
| +1 (775) 901-0344 | 21st floor, |
| info@sinoagrofood.com | Wing On Centre |
| 111 Connaught Road Central | |
| Erik Ahl | Hongkong |
+46 (0) 760 495 885
se-info@sinoagrofood.com
Report on the fourth quarter 2015
Sino Agro Food intends to publish the 2015 annual report and the fourth quarter 2015 results on Thursday, March 31, 2016.
| Sino Agro Food, Inc. Interim report third quarter 2015 | Page 22 |