Attached files
| file | filename |
|---|---|
| 8-K - 8-K - STATE STREET CORP | form8-kbamlinvestorpresent.htm |

State Street Global Advisors Building on Core Strengths to Drive Growth Bank of America Merrill Lynch Banking & Financial Services Conference Ronald P. O’Hanley CEO, State Street Global Advisors Executive Vice President, State Street November 17, 2015 State Street Corporation (STT: NYSE)

2 Forward-looking statements This presentation contains forward-looking statements within the meaning of U.S. securities laws, including statements about our goals and expectations regarding our business, financial and capital condition, results of operations, investment portfolio performance and strategies, financial portfolio performance, dividend and stock purchase programs, expected outcomes of legal proceedings, market growth, acquisitions, joint ventures and divestitures and new technologies, services and opportunities, as well as regarding industry, regulatory, economic and market trends, initiatives and developments, the business environment and other matters. Terminology such as “estimate,” “priority,” “outlook,” “expect,” “objective,” “intend,” “plan,” “forecast,” “believe,” “anticipate,” “seek,” “may,” “will,” “trend,” “target,” “strategy” and “goal,” or similar statements or variations of such terms, are intended to identify forward looking statements, although not all forward looking statements contain such terms. These statements are not guarantees of future performance, are inherently uncertain, are based on current assumptions that are difficult to predict and involve a number of risks and uncertainties. Therefore, actual outcomes and results may differ materially from what is expressed in those statements, and those statements should not be relied upon as representing our expectations or beliefs as of any date subsequent to November 17, 2015. Important factors that may also affect future results and outcomes include, but are not limited to: The financial strength and continuing viability of the counterparties with which we or our clients do business and to which we have investment, credit or financial exposure, including, for example, the direct and indirect effects on counterparties of the sovereign-debt risks in the U.S., Europe and other regions; increases in the volatility of, or declines in the level of, our net interest revenue, changes in the composition or valuation of the assets recorded in our consolidated statement of condition (and our ability to measure the fair value of investment securities) and the possibility that we may change the manner in which we fund those assets; the liquidity of the U.S. and international securities markets, particularly the markets for fixed-income securities and inter-bank credits, and the liquidity requirements of our clients; the level and volatility of interest rates, the valuation of the U.S. dollar relative to other currencies in which we record revenue or accrue expenses and the performance and volatility of securities, credit, currency and other markets in the U.S. and internationally; the credit quality, credit-agency ratings and fair values of the securities in our investment securities portfolio, a deterioration or downgrade of which could lead to other-than-temporary impairment of the respective securities and the recognition of an impairment loss in our consolidated statement of income; our ability to attract deposits and other low-cost, short-term funding, our ability to manage levels of such deposits and the relative portion of our deposits that are determined to be operational under regulatory guidelines and our ability to deploy deposits in a profitable manner consistent with our liquidity requirements and risk profile; the manner and timing with which the Federal Reserve and other U.S. and foreign regulators implement changes to the regulatory framework applicable to our operations, including implementation of the Dodd-Frank Act, the Basel III final rule and European legislation (such as the Alternative Investment Fund Managers Directive, Undertakings for Collective Investment in Transferable Securities Directives and Markets in Financial Instruments Directive II); among other consequences, these regulatory changes impact the levels of regulatory capital we must maintain, acceptable levels of credit exposure to third parties, margin requirements applicable to derivatives, and restrictions on banking and financial activities. In addition, our regulatory posture and related expenses have been and will continue to be affected by changes in regulatory expectations for global systemically important financial institutions applicable to, among other things, risk management, liquidity and capital planning and compliance programs, and changes in governmental enforcement approaches to perceived failures to comply with regulatory or legal obligations; adverse changes in the regulatory ratios that we are required or will be required to meet, whether arising under the Dodd-Frank Act or the Basel III final rule, or due to changes in regulatory positions, practices or regulations in jurisdictions in which we engage in banking activities, including changes in internal or external data, formulae, models, assumptions or other advanced systems used in the calculation of our capital ratios that cause changes in those ratios as they are measured from period to period; increasing requirements to obtain the prior approval of the Federal Reserve or our other U.S. and non-U.S. regulators for the use, allocation or distribution of our capital or other specific capital actions or programs, including acquisitions, dividends and stock purchases, without which our growth plans, distributions to shareholders, share repurchase programs or other capital initiatives may be restricted; changes in law or regulation, or the enforcement of law or regulation, that may adversely affect our business activities or those of our clients or our counterparties, and the products or services that we sell, including additional or increased taxes or assessments thereon, capital adequacy requirements, margin requirements and changes that expose us to risks related to the adequacy of our controls or compliance programs; financial market disruptions or economic recession, whether in the U.S., Europe, Asia or other regions; our ability to promote a strong culture of risk management, operating controls, compliance oversight and governance that meet our expectations and those of our clients and our regulators; the results of, and costs associated with, governmental or regulatory inquiries and investigations, litigation and similar claims, disputes, or proceedings; our ability to develop, finalize and execute our plan to accelerate the next phase of our program to create cost efficiencies through changes in our operational processes and to further digitize our processes and interfaces with our clients. The objectives of this plan are to enhance the value and delivery of our products and services to clients and to identify and implement significant reductions in our cost structure. Any failure in whole or in part to achieve these objectives may, among other things, limit the attractiveness of our products or services to clients. This could reduce our competitive position, diminish the cost- effectiveness of our systems and processes or provide an insufficient return on our associated investment; the potential for losses arising from our investments in sponsored investment funds; the possibility that our clients will incur substantial losses in investment pools for which we act as agent, and the possibility of significant reductions in the liquidity or valuation of assets underlying those pools; our ability to anticipate and manage the level and timing of redemptions and withdrawals from our collateral pools and other collective investment products; the credit agency ratings of our debt and depository obligations and investor and client perceptions of our financial strength; adverse publicity, whether specific to State Street or regarding other industry participants or industry-wide factors, or other reputational harm; our ability to control operational risks, data security breach risks and outsourcing risks, our ability to protect our intellectual property rights, the possibility of errors in the quantitative models we use to manage our business and the possibility that our controls will prove insufficient, fail or be circumvented; our ability to expand our use of technology to enhance the efficiency, accuracy and reliability of our operations and our dependencies on information technology and our ability to control related risks, including cyber-crime and other threats to our information technology infrastructure and systems and their effective operation both independently and with external systems, and complexities and costs of protecting the security of our systems and data; our ability to grow revenue, manage expenses, attract and retain highly skilled people and raise the capital necessary to achieve our business goals and comply with regulatory requirements and expectations; changes or potential changes to the competitive environment, including changes due to regulatory and technological changes, the effects of industry consolidation and perceptions of State Street as a suitable service provider or counterparty; changes or potential changes in the amount of compensation we receive from clients for our services, and the mix of services provided by us that clients choose; our ability to complete acquisitions, joint ventures and divestitures, including the ability to obtain regulatory approvals, the ability to arrange financing as required and the ability to satisfy closing conditions; the risks that our acquired businesses and joint ventures will not achieve their anticipated financial and operational benefits or will not be integrated successfully, or that the integration will take longer than anticipated, that expected synergies will not be achieved or unexpected negative synergies or liabilities will be experienced, that client and deposit retention goals will not be met, that other regulatory or operational challenges will be experienced, and that disruptions from the transaction will harm our relationships with our clients, our employees or regulators; our ability to recognize emerging needs of our clients and to develop products that are responsive to such trends and profitable to us, the performance of and demand for the products and services we offer, and the potential for new products and services to impose additional costs on us and expose us to increased operational risk; changes in accounting standards and practices; and changes in tax legislation and in the interpretation of existing tax laws by U.S. and non-U.S. tax authorities that affect the amount of taxes due. Other important factors that could cause actual results to defer materially from those indicated by any forward-looking statements are set forth in our 2014 Annual Report on Form 10-K and our subsequent SEC filings. We encourage investors to read these filings, particularly the sections on risk factors, for additional information with respect to any forward-looking statements and prior to making any investment decision. The forward-looking statements contained in this presentation speak only as of the date hereof, November 17, 2015, and we do not undertake efforts to revise those forward-looking statements to reflect events after that date.

3 SSGA well positioned to benefit from asset management industry trends and State Street’s global scale, infrastructure and relationships Americas: Revenue: $5.9B AUA: $21.22T AUM: $1,568B Europe, Middle East & Africa: Revenue: $3.4B AUA: $5.63T AUM: $559B Asia Pacific: Revenue: $0.9B AUA: $1.34T AUM: $321B All data as of or for the year-ended December 31, 2014, as applicable. AUA: assets under custody and administration (based on location in which the assets are serviced). AUM: assets under management (based on client location or fund management location). Of STT’s top 100 clients, 63 are also SSGA clients Core investment focus and positioning enables extension opportunities SSGA well positioned to take advantage of disruptive industry trends Global client base highly leveragable and supports SSGA’s business development strategy State Street Overall: Revenue: $10.3B AUA: $28.2T AUM: $2.45T

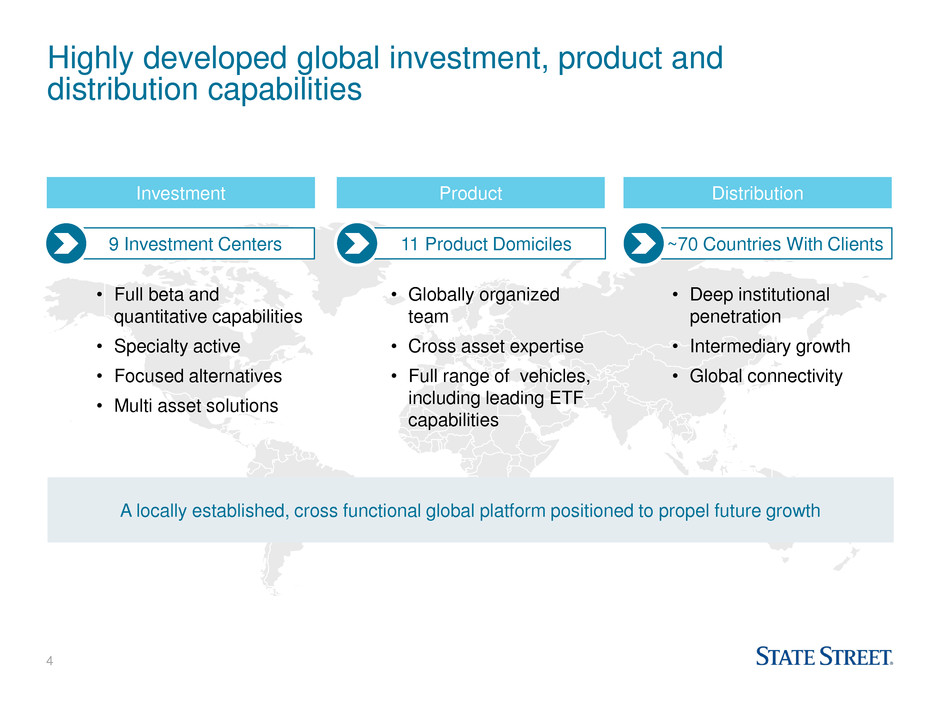
4 Distribution • Globally organized team • Cross asset expertise • Full range of vehicles, including leading ETF capabilities • Deep institutional penetration • Intermediary growth • Global connectivity Highly developed global investment, product and distribution capabilities Product • Full beta and quantitative capabilities • Specialty active • Focused alternatives • Multi asset solutions Investment A locally established, cross functional global platform positioned to propel future growth 9 Investment Centers 11 Product Domiciles ~70 Countries With Clients

5 Top three global asset manager advising significant share of investable assets Ranking Asset Manager AUM ($B) 1 BlackRock $4,652 2 Vanguard $3,148 3 SSGA $2,448 4 Allianz $2,189 5 Fidelity Investments $1,974 6 J.P. Morgan Chase $1,749 7 Bank of New York Mellon $1,710 8 AXA Group $1,491 9 Capital Group $1,397 10 Deutsche Bank $1,263 Source: The Pensions and Investments Research Center/Towers Watson global 500 research and ranking 2014.

6 $66 $44 $32 $25 $19 SSGA VAN WMC NTRS BK $497 $376 $205 $177 $176 BLK SSGA BK NTRS PRU $166 $153 $123 $36 $31 SSGA Pioneer BLK NTRS JPM $126 $113 $93 $88 $72 BK SSGA BLK LM NTRS Deep penetration of world’s most sophisticated clients AUM $B #1 US Endowment and Foundation #2 US Defined Benefit #1 Worldwide Central Bank #2 Worldwide Sovereign Wealth Source: Pensions and Investments Research Center December 31, 2014.

7 $1,996 $1,959 $1,522 $456 $430 VAN BLK SSGA NTRS L&G $1,024 $469 $416 $94 $83 BLK VAN SSGA IVZ DB $706 $620 $585 $409 $289 $273 VAN Fidelity BLK TIAA TROW SSGA Well positioned in fast growing core segments AUM $B Index Managers Excluding ETFs1 Global ETFs2 US Defined Contribution3 1. Pensions and Investments Research Center Data as of June 30, 2015. 2. Blackrock Global ETP Landscape as of September 30 2015. 3. Pensions and Investments Research Center Data as of December 31, 2014.

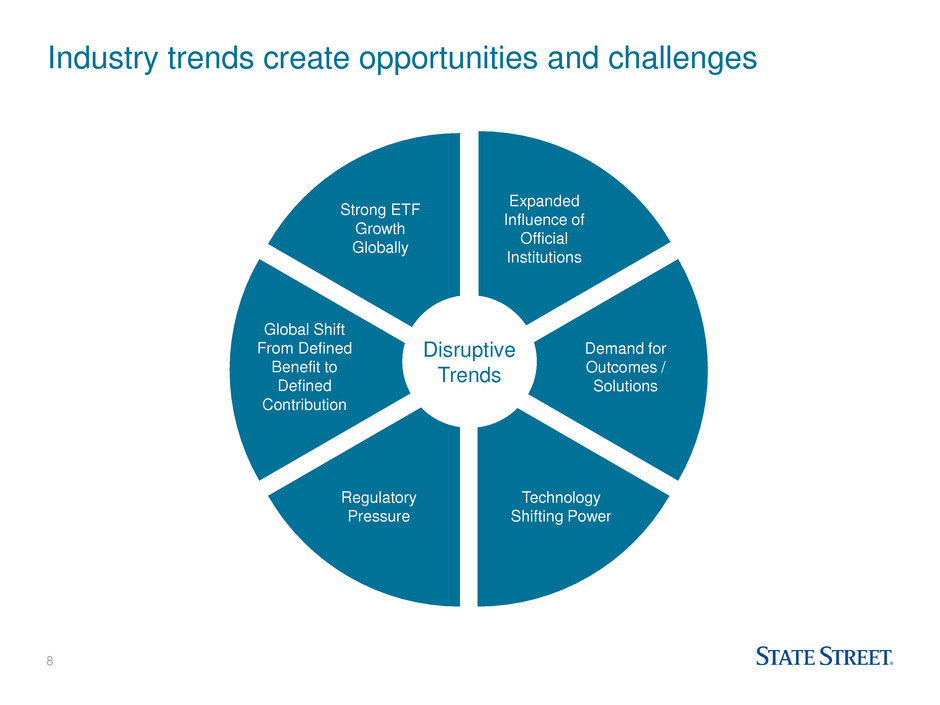
8 Industry trends create opportunities and challenges Defined benefit shrinkage Defined contribution expansion Growth in alternatives Barbell product mix shift Solutions continue to grow Disruptive technology Margin and fee compression Disruptive Trends Strong ETF Growth Globally Demand for Outcomes / Solutions Global Shift From Defined Benefit to Defined Contribution Technology Shifting Power Regulatory Pressure Expanded Influence of Official Institutions

9 Solutions 37% Solutions, Passives and Alternatives growing at expense of Active 5% 9% 11% $21 / 59% $29 / 39% $8 / 21% $18 / 24% $2 / 6 % $8 / 11% $3 / 8% $11 / 14% $2 / 6% $9 / 13% 2003 2014 AUM CAGR 2003-2014 $36 $74 +15% +13% +13% +8% +3% Estimated Share of Cumulative Net Flows 2015 – 2018 Source: BCG Global Asset Management Market Sizing Database 2015. Global Asset Management Industry AUM ($T) Passive / ETFs 35% Alternatives 14% Specialty 22% Active Core -8%

10 Growth Priorities Extend core investment capabilities to deepen and broaden penetration of client base while capitalizing on industry trends Global ETFs Talent Investment Capabilities Operations / Information Technology Risk Excellence Global Defined Contribution Solutions Official Institutions Beta Revolution Continue to leverage strategic product and platform partnerships

11 • Equities • Credit • Rates • Real Assets • Currency • Low Valuation • Small Size • High Momentum • High Quality • Low Volatility • High Term • High Credit • High Liquidity • High Yield • Multi-Factor • Market Neutral Value / Quality / Momentum • Risk Neutral Low Volatility • Currency Carry • Interest Rate Curve • Merger Arbitrage • Commodity Roll • Multi-Factor Priority: Beta Revolution Extend deep beta and quant expertise to provide next generation solutions Alternative Beta Smart Beta Traditional Beta Core Strength and Capability Natural Extension Focus on exposure and fee productivity driving interest in factor-based beta management

12 $12.0 $12.0 $13.0 $15.0 $17.0 2010 2011 2012 2013 2014 Priority: Global Defined Contribution Capture disproportionate share of the retirement shift to DC • Extend Global Reach: ‒ Leverage current DB footprint and presence ‒ Help plan sponsors provide better outcomes to plan participants ‒ Expand coverage to small / medium-sized plans through technology and partnerships • Product Innovation: ‒ Custom Target Date ‒ UK Target Date Funds ‒ Retirement Income in DC plan Key Initiatives CAGR 9% Global DC Market ($T)1 1. Morgan Stanley Research October 7, 2015. Includes IRA assets.

13 $1.5 $1.5 $1.9 $2.4 $2.8 $3.3 $3.8 $4.4 $5.1 2010 2011 2012 2013 2014 2015E 2016E 2017E 2018E Priority: Global ETF Meet growing client demand as the ETF market evolves and use cases broaden Global ETF Market ($T)1 CAGR 17% • Grow market share in EMEA and APAC: ̶ Expand intermediary outlets ̶ Broaden salesforce • Leverage deep institutional client relationships as ETF uses broaden • Continue to innovate and partner: ̶ Active ETFs: TOTL ̶ Smart Beta: Quality Mix ETFs • Offer value-added applications of ETFs: ̶ Models ̶ Asset Allocation / Solutions Key Initiatives 1. Goldman Sachs Global Investment Research June 7, 2015

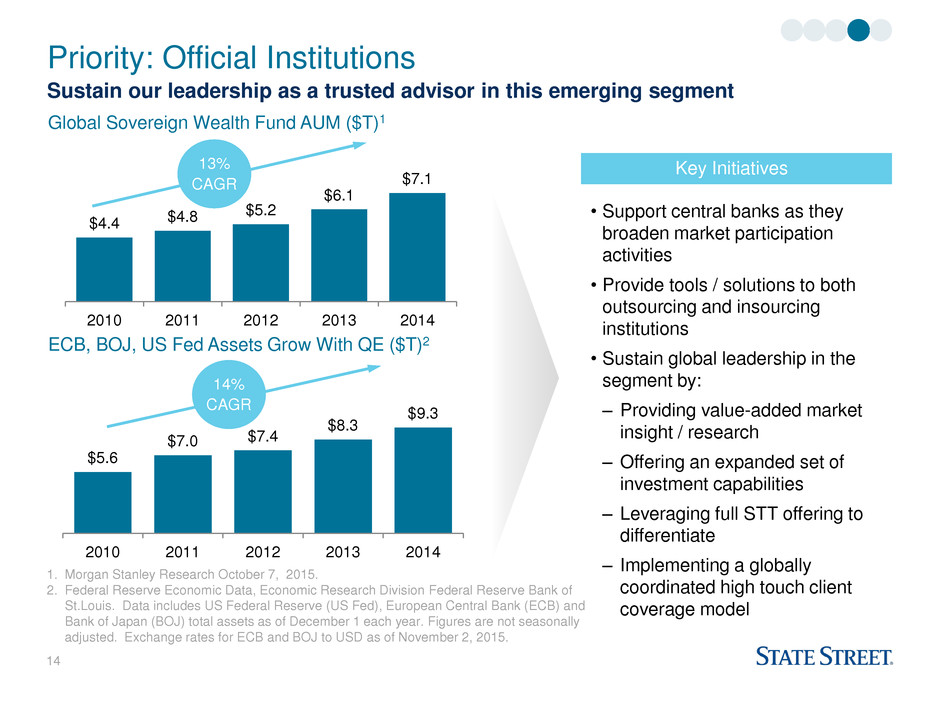
14 Priority: Official Institutions Sustain our leadership as a trusted advisor in this emerging segment Global Sovereign Wealth Fund AUM ($T)1 $4.4 $4.8 $5.2 $6.1 $7.1 2010 2011 2012 2013 2014 13% CAGR ECB, BOJ, US Fed Assets Grow With QE ($T)2 $5.6 $7.0 $7.4 $8.3 $9.3 2010 2011 2012 2013 2014 14% CAGR • Support central banks as they broaden market participation activities • Provide tools / solutions to both outsourcing and insourcing institutions • Sustain global leadership in the segment by: ‒ Providing value-added market insight / research ‒ Offering an expanded set of investment capabilities ‒ Leveraging full STT offering to differentiate ‒ Implementing a globally coordinated high touch client coverage model Key Initiatives 1. Morgan Stanley Research October 7, 2015. 2. Federal Reserve Economic Data, Economic Research Division Federal Reserve Bank of St.Louis. Data includes US Federal Reserve (US Fed), European Central Bank (ECB) and Bank of Japan (BOJ) total assets as of December 1 each year. Figures are not seasonally adjusted. Exchange rates for ECB and BOJ to USD as of November 2, 2015.

15 Priority: Solutions Deliver outcome-oriented solutions to meet clients’ customized and packaged needs Global Solutions AUM ($T)1 $5.1 $5.6 $6.0 $6.6 $7.2 2014E 2015E 2016E 2017E 2018E CAGR 9% • Continue to act as trusted advisor by providing benchmark-agnostic solutions: ‒ Customized outcomes to meet specific institutional client needs ‒ Scalable goal-oriented packaged product • Leverage DC and Intermediary presence and multi-asset class capability to meet broadening needs (e.g. retirement income; “LDI for individual”) • Support ongoing corporate and nascent public plan derisking Key Initiatives 1. Casey Quirk Global Demand Model as of February, 2015.

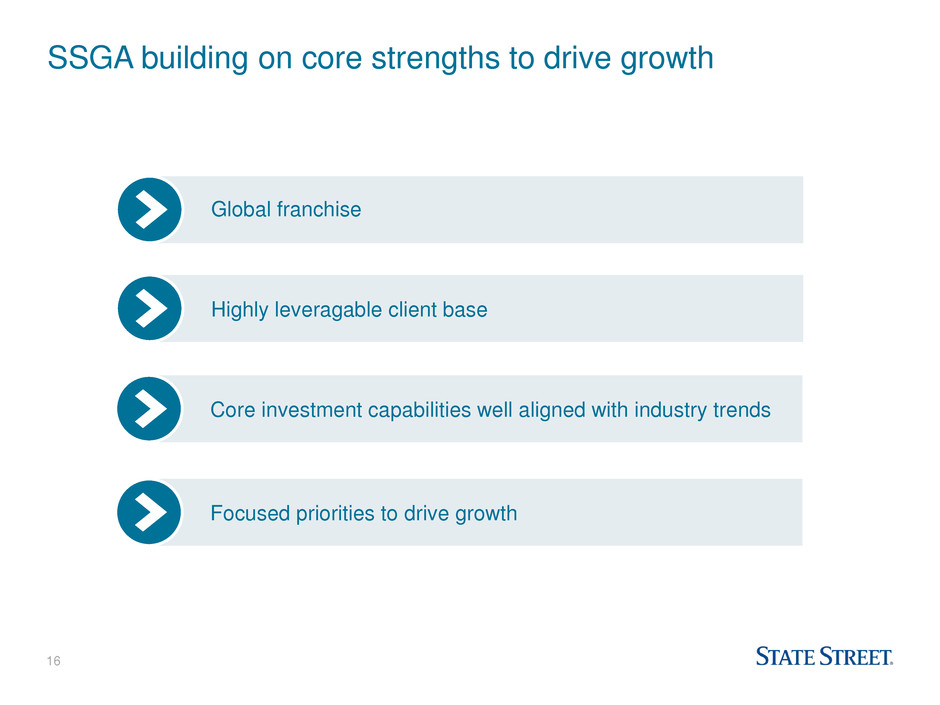
16 SSGA building on core strengths to drive growth Global franchise Highly leveragable client base Core investment capabilities well aligned with industry trends Focused priorities to drive growth

17 Q&A
