Attached files
| file | filename |
|---|---|
| 8-K - FORM 8-K - RCS Capital Corp | v425003_8k.htm |
Exhibit 99.1
1 2 Forward - Looking Statements Certain statements made in this presentation are forward - looking statements . Those statements include statements regarding the intent, belief or current expectations of RCS Capital Corporation (“us,” “our,” “RCAP ” or the “Company”) and members of its management team, as well as the assumptions on which such statements are based, and generally are identified by the use of words such as “may,” “will,” “seeks,” “anticipates,” “believes,” “estimates,” “expects,” “plans,” “intends,” “should” or similar expressions . Actual results may differ materially from those contemplated by such forward - looking statements . Further, forward - looking statements speak only as of the date they are made, and we undertake no obligation to update or revise forward - looking statements to reflect changed assumptions, the occurrence of unanticipated events or changes to future operating results over time, unless required by law . The following are some of the possible risks and uncertainties, although not all risks and uncertainties, that could cause our actual results to differ materially from those presented in our forward - looking statements : • the impact on our business of the events relating to American Realty Capital Properties, Inc . announcement concerning errors in its financial statements • our ability to integrate our recently acquired businesses into our existing businesses ; • our ability to complete our pending acquisitions on the anticipated terms, in the anticipated timeframes or at all ; • whether and when we will be able to realize the anticipated benefits from our recent acquisitions ; • significant dilution could result from future issuances of our Class A common stock ; • future sales of our Class A common stock could lower the market price of our Class A common stock ; • adverse developments in the direct investment program industry ; • deterioration in the business environment in the specific sectors of the economy in which we focus or a decline in the market for securities of companies within these sectors ; • substantial fluctuations in our financial results ; • our ability to retain our senior professionals and key management personnel of our recently acquired businesses ; • pricing and other competitive pressures ; • changes in laws and regulations and industry practices that adversely affect our business ; • incurrence of losses in the future ; • competition from larger firms ; • limitations on our access to capital ; • malfunctioning or failure in our operations and infrastructure ; • failure to achieve and maintain effective internal controls ; and • the factors included in our most recent Annual Report on Form 10 - K and any subsequent Quarterly Reports on Form 10 - Q or Current Reports on Form 8 - K . All information presented and prepared as of June 30, 2015 and may not reflect the current facts or assumptions of the Compan y o r management that may exist as of the date hereof.
Exhibit 99.1

2 2 Disclaimer This presentation also contains estimates and information concerning our industry, including market position, market size, and growth rates of the markets in which we participate, that are based on industry publications and reports . This information involves a number of assumptions and limitations, and you are cautioned not to give undue weight to these estimates . We have not independently verified the accuracy or completeness of the data contained in these industry publications and reports . The industry in which we operate is subject to a high degree of uncertainty and risk due to variety of factors, including those described in the “Risk Factors” section of the Company’s Annual Report on Form 10 - K and any subsequent Quarterly Reports on Form 10 - Q or Current Reports on Form 8 - K and “Forward Looking Statements” . These and other factors could cause results to differ materially from those expressed in these publications and reports . All information presented and prepared as of June 30, 2015 and may not reflect the current facts or assumptions of the Compan y o r management that may exist as of the date hereof.
Exhibit 99.1
3 2 Non - GAAP Measure Disclosure We use EBITDA, adjusted EBITDA and adjusted net income, which are non - GAAP measures, as supplemental measures of our performance that are not required by, or presented in accordance with GAAP. None of the non - GAAP measures should be considered as an alternative to any other performance measure derived in accordance with GAAP. We use EBITDA, adjusted EBITDA and adjusted net income as an integral part of our report and planning processes and as one of the primary measures to, among other things : • our ability to integrate the acquired businesses into our existing businesses; • monitor and evaluate the performance of our business operations; • facilitate management’s internal comparisons of the historical operating performance of our business operations; • facilitate management’s external comparisons of the results of our overall business to the historical operating performance o f o ther companies that may have different capital structures and debt levels; • analyze and evaluate financial and strategic planning decisions regarding future operating investments; • provide useful information to investors regarding financial and business trends related to our results of operations; and • plan for and prepare future annual operating budgets and determine appropriate levels of operating investments. We define EBITDA as earnings before taxes, depreciation and amortization and interest. We define adjusted EBITDA as earnings bef ore taxes, depreciation and amortization, interest, adjusted to exclude equity - based compensation, acquisition and related integration costs (including integration - relate d employee compensation and related costs), amortization of capitalized advisor costs, change in the fair value of contingent and deferred consideration, impairment char ges for goodwill and intangible assets and other items. We define adjusted net income as net income attributable to the Company (using the effective tax rate) and adjusted to exclud e e quity - based compensation, acquisition related expenses, amortization of capitalized advisor compensation, change in contingent and deferred consideration, amortization of int angible assets and other items. We believe similarly titled, but not necessarily similarly comprised, measures are frequently used by securities analysts, in ves tors and other interested parties in the evaluation of companies in our industry, many of which present EBITDA, adjusted EBITDA and adjusted net income and other similar metrics wh en reporting their financial results. Our presentation of EBITDA, adjusted EBITDA and adjusted net income should not be construed to imply that our future results will be unaffected by unusual or nonrecurring items. The non - GAAP measures have limitations as analytical tools, and you should not consider any of these measures in isolation or as a substitute for analyses of our income or cash flows as reported under GAAP. See additional disclosure regarding our calculation of EBITDA and adjusted EBITDA in our Annual Report on Form 10 - K and subsequent Quarterly Reports on Form 10 - Q. All information presented and prepared as of June 30, 2015 and may not reflect the current facts or assumptions of the Compan y o r management that may exist as of the date hereof.
Exhibit 99.1
4 2 Non - GAAP Measure Disclosure In evaluating Adjusted EBITDA, you should be aware that in the future we may incur expenses that are the same as or similar t o s ome of the adjustments in this presentation. Our presentation of Adjusted EBITDA should not be construed as an inference that our future results will be unaffected by unu sua l or non - recurring items or other items discussed herein, some of which may be the same or different from those described above. In addition, other companies in our industry may calculate these measures differently than we do, limiting their usefulness a s a comparative measure. We compensate for these limitations by relying primarily on our GAAP results and using the non - GAAP measures only for supplemental purposes. Please see our consolidated financial statements and the related notes thereto. All information presented and prepared as of June 30, 2015 and may not reflect the current facts or assumptions of the Compan y o r management that may exist as of the date hereof.
Exhibit 99.1

American Realty Capital 5 Cetera Overview All information presented and prepared as of June 30, 2015 and may not reflect the current facts or assumptions of the Compan y o r management that may exist as of the date hereof.
Exhibit 99.1

Regional Director Model # of Advisors 2,525 AUA $75.0bn AUM $20.2bn Financial Institutions # of Advisors 1,783 AUA $34.5bn AUM $2.2bn Specialized Target Markets # of Advisors 1,700 AUA $25.6bn AUM $7.7bn Traditional # of Advisors 3,497 AUA $103.6bn AUM $29.6bn FINANCIAL SPECIALISTS ADVISORS FINANCIAL INSTITUTIONS ADVISOR NETWORKS 1 1H 2015 revenue annualized # of Advisors 9,505 AUA $238.7bn AUM $59.7bn Revenue 1 $2,066 mm Four highly customized platforms to attract and retain a diverse set of financial advisors with individualized needs 6 All information presented and prepared as of June 30, 2015 and may not reflect the current facts or assumptions of the Compan y o r management that may exist as of the date hereof.
Exhibit 99.1
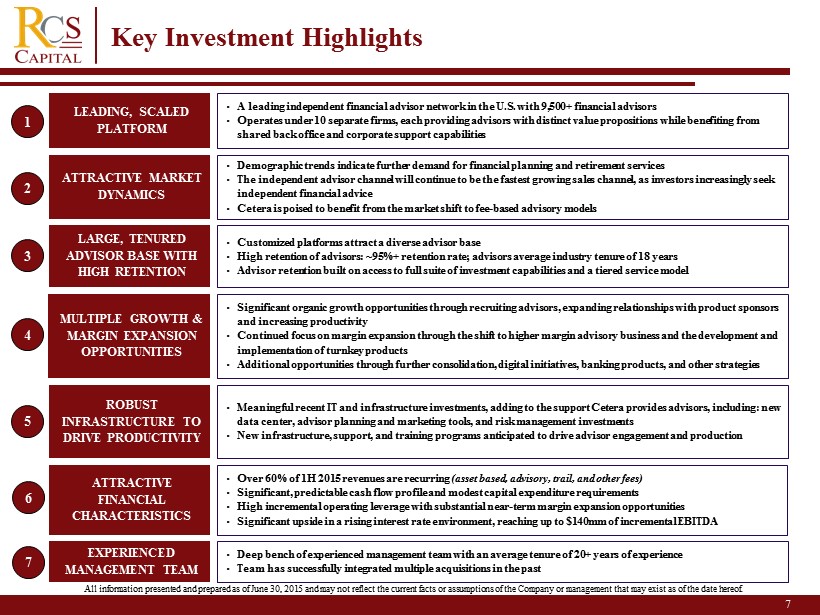
Key Investment Highlights LEADING, SCALED PLATFORM • A leading independent financial advisor network in the U.S. with 9,500+ financial advisors • Operates under 10 separate firms, each providing advisors with distinct value propositions while benefiting from shared back office and corporate support capabilities • Customized platforms attract a diverse advisor base • High retention of advisors: ~95%+ retention rate; advisors average industry tenure of 18 years • Advisor retention built on access to full suite of investment capabilities and a tiered service model LARGE, TENURED ADVISOR BASE WITH HIGH RETENTION 1 3 MULTIPLE GROWTH & MARGIN EXPANSION OPPORTUNITIES • Significant organic growth opportunities through recruiting advisors, expanding relationships with product sponsors and increasing productivity • Continued focus on margin expansion through the shift to higher margin advisory business and the development and implementation of turnkey products • Additional opportunities through further consolidation, digital initiatives, banking products, and other strategies 5 ATTRACTIVE FINANCIAL CHARACTERISTICS • Over 60% of 1H 2015 revenues are recurring (asset based, advisory, trail, and other fees) • Significant, predictable cash flow profile and modest capital expenditure requirements • High incremental operating leverage with substantial near - term margin expansion opportunities • Significant upside in a rising interest rate environment, reaching up to $140mm of incremental EBITDA 4 • Meaningful recent IT and infrastructure investments, adding to the support Cetera provides advisors, including: new data center, advisor planning and marketing tools, and risk management investments • New infrastructure, support, and training programs anticipated to drive advisor engagement and production ROBUST INFRASTRUCTURE TO DRIVE PRODUCTIVITY 7 • Deep bench of experienced management team with an average tenure of 20+ years of experience • Team has successfully integrated multiple acquisitions in the past EXPERIENCED MANAGEMENT TEAM 6 2 • Demographic trends indicate further demand for financial planning and retirement services • The independent advisor channel will continue to be the fastest growing sales channel, as investors increasingly seek independent financial advice • Cetera is poised to benefit from the market shift to fee - based advisory models ATTRACTIVE MARKET DYNAMICS Key Investment Highlights 7 All information presented and prepared as of June 30, 2015 and may not reflect the current facts or assumptions of the Compan y o r management that may exist as of the date hereof.
Exhibit 99.1
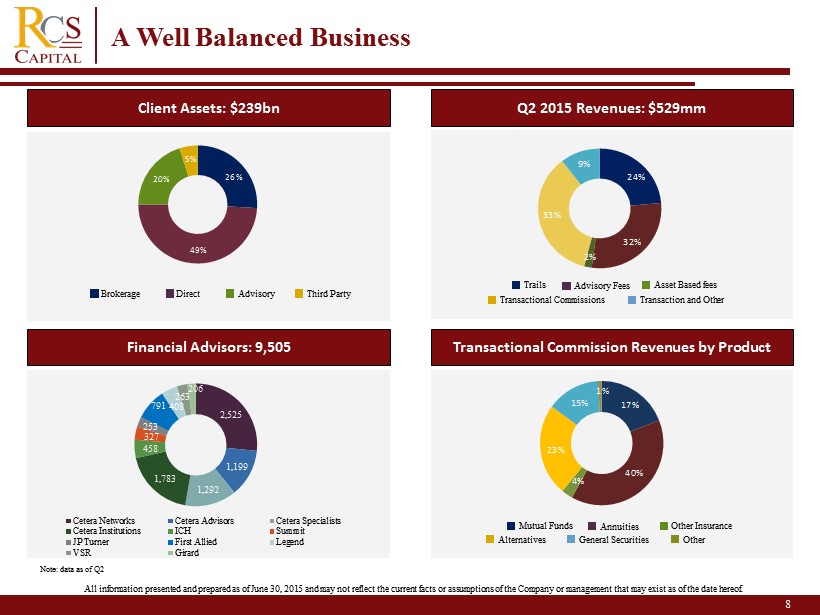
Financial Advisors: 9,505 Q2 2015 Revenues: $529mm Transactional Commission Revenues by Product 26% 49% 20% 5% Brokerage Direct Advisory Third Party 24% 32% 2% 33% 9% Trails Advisory Fees Asset Based fees Transactional Commissions Transaction and Other 17% 40% 4% 23% 15% 1% Mutual Funds Annuities Other Insurance Alternatives General Securities Other Note: data as of Q2 2,525 1,199 1,292 1,783 458 327 253 791 408 263 206 Cetera Networks Cetera Advisors Cetera Specialists Cetera Institutions ICH Summit JP Turner First Allied Legend VSR Girard Client Assets: $239bn A Well Balanced Business 8 All information presented and prepared as of June 30, 2015 and may not reflect the current facts or assumptions of the Compan y o r management that may exist as of the date hereof.
Exhibit 99.1
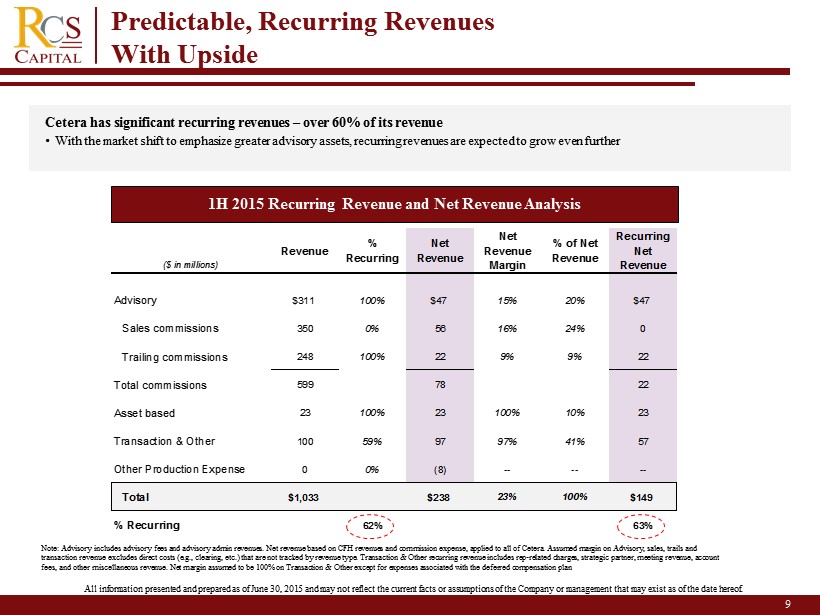
($ in millions) Revenue % Recurring Net Revenue Net Revenue Margin % of Net Revenue Recurring Net Revenue Advisory $311 100% $47 15% 20% $47 Sales commissions 350 0% 56 16% 24% 0 Trailing commissions 248 100% 22 9% 9% 22 Total commissions 599 78 22 Asset based 23 100% 23 100% 10% 23 Transaction & Other 100 59% 97 97% 41% 57 Other Production Expense 0 0% (8) -- -- -- Total $1,033 $238 23% 100% $149 % Recurring 62% 63% Cetera has significant recurring revenues – over 60% of its revenue • With the market shift to emphasize greater advisory assets, recurring revenues are expected to grow even further Note : Advisory includes advisory fees and advisory admin revenues. Net revenue based on CFH revenues and commission expense, appl ied to all of Cetera. Assumed margin on Advisory, sales, trails and transaction revenue excludes direct costs (e.g., clearing, etc.) that are not tracked by revenue type. Transaction & Other recurring revenue includes rep - related charges, strategic partner, meeting revenue, account fees, and other miscellaneous revenue. Net margin assumed to be 100% on Transaction & Other except for expenses associated wi th the deferred compensation plan 1H 2015 Recurring Revenue and Net Revenue Analysis Predictable, Recurring Revenues With Upside 9 All information presented and prepared as of June 30, 2015 and may not reflect the current facts or assumptions of the Compan y o r management that may exist as of the date hereof.
Exhibit 99.1
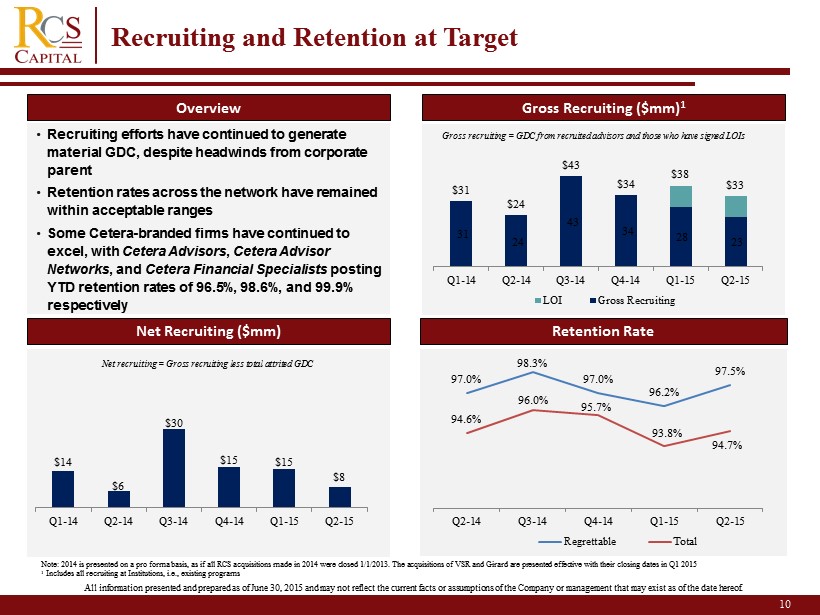
Recruiting and Retention at Target Gross Recruiting ($mm) 1 Retention Rate Overview 31 24 43 34 28 23 $31 $24 $43 $34 $38 $33 Q1-14 Q2-14 Q3-14 Q4-14 Q1-15 Q2-15 LOI Gross Recruiting Net Recruiting ($mm) $14 $6 $30 $15 $15 $8 Q1-14 Q2-14 Q3-14 Q4-14 Q1-15 Q2-15 Note: 2014 is presented on a pro forma basis, as if all RCS acquisitions made in 2014 were closed 1/1/2013. The acquisitions of VSR and Girard are pr ese nted effective with their closing dates in Q1 2015 1 Includes all recruiting at Institutions, i.e., existing programs Gross recruiting = GDC from recruited advisors and those who have signed LOIs Net recruiting = Gross recruiting less total attrited GDC • Recruiting efforts have continued to generate material GDC, despite headwinds from corporate parent • Retention rates across the network have remained within acceptable ranges • Some Cetera - branded firms have continued to excel, with Cetera Advisors , Cetera Advisor Networks , and Cetera Financial Specialists posting YTD retention rates of 96.5%, 98.6%, and 99.9% respectively 97.0% 98.3% 97.0% 96.2% 97.5% 94.6% 96.0% 95.7% 93.8% 94.7% Q2-14 Q3-14 Q4-14 Q1-15 Q2-15 Regrettable Total Recruiting and Retention at Target 10 All information presented and prepared as of June 30, 2015 and may not reflect the current facts or assumptions of the Compan y o r management that may exist as of the date hereof.
Exhibit 99.1
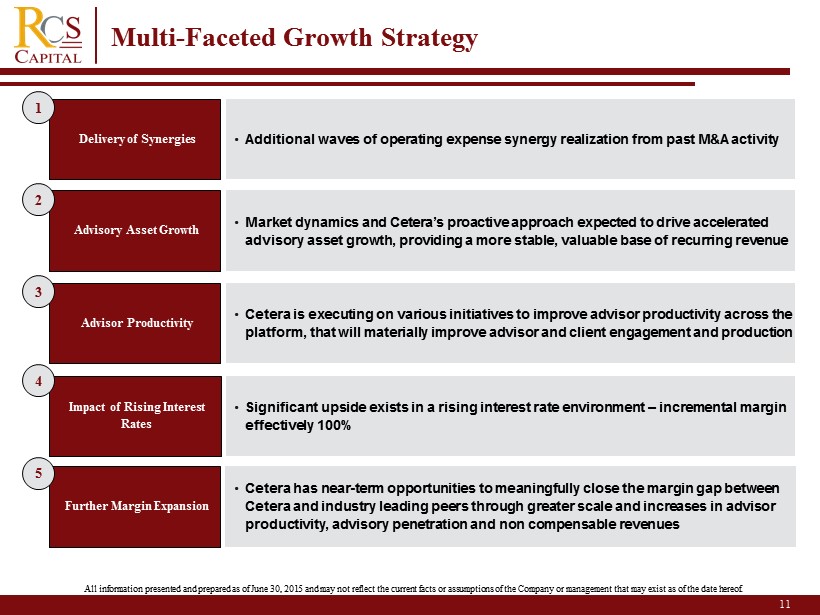
Delivery of Synergies Advisor Productivity Impact of Rising Interest Rates Advisory Asset Growth Further Margin Expansion • Additional waves of operating expense synergy realization from past M&A activity • Cetera is executing on various initiatives to improve advisor productivity across the platform, that will materially improve advisor and client engagement and production 1 2 • Significant upside exists in a rising interest rate environment – incremental margin effectively 100% 4 • Market dynamics and Cetera’s proactive approach expected to drive accelerated advisory asset growth, providing a more stable, valuable base of recurring revenue 3 • Cetera has near - term opportunities to meaningfully close the margin gap between Cetera and industry leading peers through greater scale and increases in advisor p roductivity , advisory penetration and non compensable revenues 5 Multi - Faceted Growth Strategy 11 All information presented and prepared as of June 30, 2015 and may not reflect the current facts or assumptions of the Compan y o r management that may exist as of the date hereof.
Exhibit 99.1
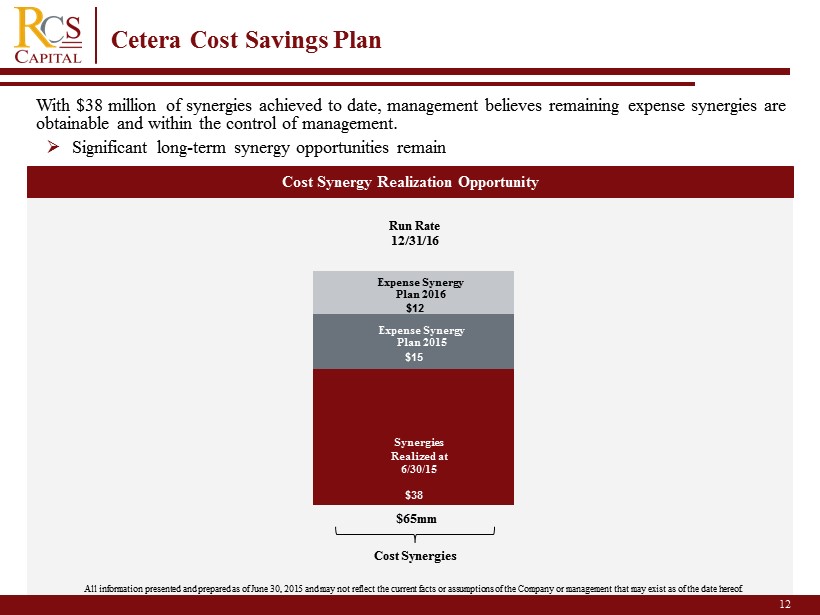
12 Cetera Cost Savings Plan Cost Synergy Realization Opportunity With $38 million of synergies achieved to date, management believes remaining expense synergies are obtainable and within the control of management . $38 $15 $12 $65mm Run Rate 12/31/16 Synergies Realized at 6/30/15 Expense Synergy Plan 2015 Expense Synergy Plan 2016 Cost Synergies » Significant long - term synergy opportunities remain All information presented and prepared as of June 30, 2015 and may not reflect the current facts or assumptions of the Compan y o r management that may exist as of the date hereof.
Exhibit 99.1
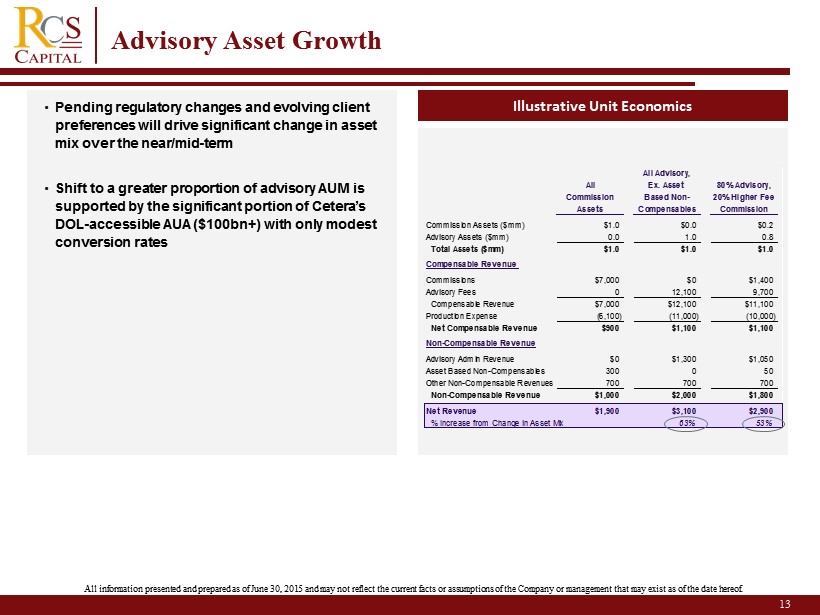
13 Advisory Asset Growth Illustrative Unit Economics • Pending regulatory changes and evolving client preferences will drive significant change in asset mix over the near/mid - term • Shift to a greater proportion of advisory AUM is supported by the significant portion of Cetera’s DOL - accessible AUA ($100bn+) with only modest conversion rates All Advisory, All Ex. Asset 80% Advisory, Commission Based Non- 20% Higher Fee Assets Compensables Commission Commission Assets ($mm) $1.0 $0.0 $0.2 Advisory Assets ($mm) 0.0 1.0 0.8 Total Assets ($mm) $1.0 $1.0 $1.0 Compensable Revenue Commissions $7,000 $0 $1,400 Advisory Fees 0 12,100 9,700 Compensable Revenue $7,000 $12,100 $11,100 Production Expense (6,100) (11,000) (10,000) Net Compensable Revenue $900 $1,100 $1,100 Non-Compensable Revenue Advisory Admin Revenue $0 $1,300 $1,050 Asset Based Non-Compensables 300 0 50 Other Non-Compensable Revenues 700 700 700 Non-Compensable Revenue $1,000 $2,000 $1,800 Net Revenue $1,900 $3,100 $2,900 % Increase from Change in Asset Mix 63% 53% All information presented and prepared as of June 30, 2015 and may not reflect the current facts or assumptions of the Compan y o r management that may exist as of the date hereof.
Exhibit 99.1
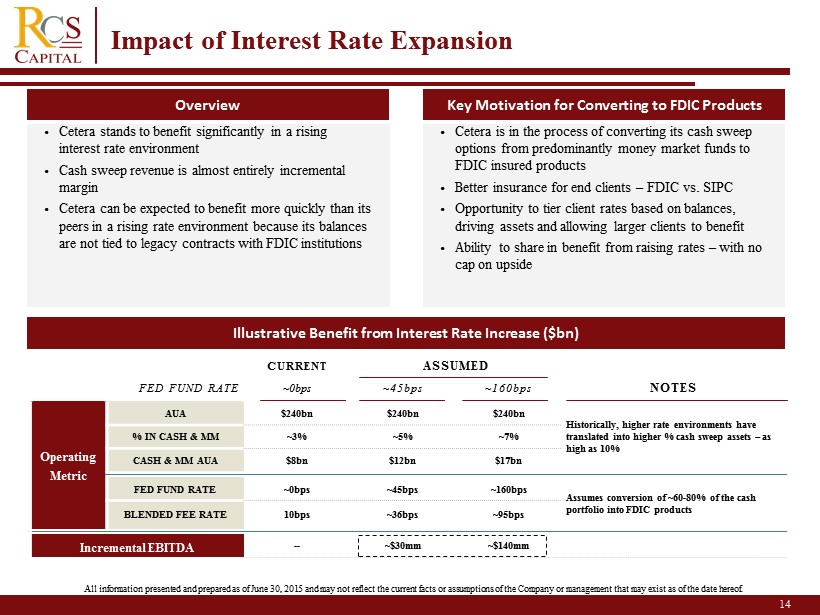
14 Impact of Interest Rate Expansion Key Motivation for Converting to FDIC Products Overview Illustrative Benefit from Interest Rate Increase ($bn) • Cetera stands to benefit significantly in a rising interest rate environment • Cash sweep revenue is almost entirely incremental margin • Cetera can be expected to benefit more quickly than its peers in a rising rate environment because its balances are not tied to legacy contracts with FDIC institutions • Cetera is in the process of converting its cash sweep options from predominantly money market funds to FDIC insured products • Better insurance for end clients – FDIC vs. SIPC • Opportunity to tier client rates based on balances, driving assets and allowing larger clients to benefit • Ability to share in benefit from raising rates – with no cap on upside CURRENT ASSUMED FED FUND RATE ~0bps ~45bps ~160bps NOTES Operating Metric AUA $240bn $240bn $240bn Historically, higher rate environments have translated into higher % cash sweep assets – as high as 10% % IN CASH & MM ~3% ~5% ~7% CASH & MM AUA $8bn $12bn $17bn FED FUND RATE ~0bps ~45bps ~160bps Assumes conversion of ~60 - 80% of the cash portfolio into FDIC products BLENDED FEE RATE 10bps ~36bps ~95bps Incremental EBITDA -- ~$30mm ~$140mm All information presented and prepared as of June 30, 2015 and may not reflect the current facts or assumptions of the Compan y o r management that may exist as of the date hereof.
Exhibit 99.1
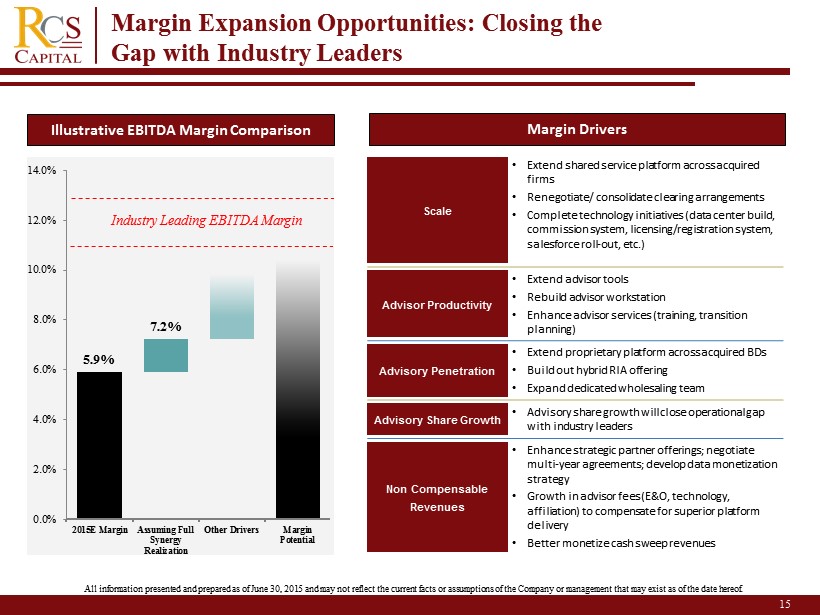
5.9% 7.2% 0.0% 2.0% 4.0% 6.0% 8.0% 10.0% 12.0% 14.0% 2015E Margin Assuming Full Synergy Realization Other Drivers Margin Potential Margin Drivers Illustrative EBITDA Margin Comparison Scale • Extend shared service platform across acquired firms • Renegotiate/ consolidate clearing arrangements • Complete technology initiatives (data center build, commission system, licensing/registration system, salesforce roll - out, etc.) Advisor Productivity • Extend advisor tools • Rebuild advisor workstation • Enhance advisor services (training, transition planning) Advisory Penetration • Extend proprietary platform across acquired BDs • Build out hybrid RIA offering • Expand dedicated wholesaling team Advisory Share Growth • Advisory share growth will close operational gap with industry leaders Non Compensable Revenues • Enhance strategic partner offerings; negotiate multi - year agreements; develop data monetization strategy • Growth in advisor fees (E&O, technology, affiliation) to compensate for superior platform delivery • Better monetize cash sweep revenues Industry Leading EBITDA Margin Margin Expansion Opportunities: Closing the Gap with Industry Leaders 15 All information presented and prepared as of June 30, 2015 and may not reflect the current facts or assumptions of the Compan y o r management that may exist as of the date hereof.
Exhibit 99.1

Digital/ Small Account Strategy • Cetera is developing a hybrid digital/advisor - oriented model targeting small and orphaned accounts • Will provide automated services to enable advisors and internal resources to profitably service small accounts Home Office - Owned Region Build - Out • Cetera has been establishing home office - owned regions within Cetera Advisor Networks to accelerate organic growth − Home - office owned regions offer greater profitability as Cetera retains a larger share of the commissions Hybrid RIA Strategy • Ability to offer advisory products to advisors operating their own RIAs (either with or without a brokerage affiliation) • Potential ability to self - clear these advisory products on Cetera’s own clearing platform Non Purpose Lending and Banking Product • Cetera is currently testing non - purpose lending with two third parties – opportunity to expand more broadly to advisors • Additional possible products: Mortgage lending referral program, high - yield savings, credit cards, syndicate activities Additional Consolidation Opportunities • Regulatory pressures and competitive dynamics driving smaller players out of market • Cetera positioned as consolidator of choice given multi - brand structure, connectivity to multiple - clearing platforms, and shared service infrastructure − Can absorb other BDs as either standalone businesses or folded into an existing BD Additional Opportunities for Cetera 16 All information presented and prepared as of June 30, 2015 and may not reflect the current facts or assumptions of the Compan y o r management that may exist as of the date hereof.