Attached files
| file | filename |
|---|---|
| 8-K - 8-K - PIPER SANDLER COMPANIES | a15-23557_18k.htm |
| EX-2.1 - EX-2.1 - PIPER SANDLER COMPANIES | a15-23557_1ex2d1.htm |
| EX-99.1 - EX-99.1 - PIPER SANDLER COMPANIES | a15-23557_1ex99d1.htm |
Exhibit 99.2
Piper Jaffray and Simmons & Company International Investor Presentation November 2015
Cautionary Note Regarding Forward-Looking Information 2 This presentation contains forward-looking statements. Statements that are not historical or current facts, including statements about beliefs and expectations, are forward-looking statements. These forward-looking statements cover, among other things, the future prospects of the Company and the growth of our investment banking business. Forward-looking statements involve inherent risks and uncertainties, and important factors could cause actual results to differ materially from those anticipated, including the following: (1) the transaction described in this presentation is subject to regulatory approval and other closing conditions and may not close on the expected timing or at all; (2) the costs or difficulties relating to the combination of the businesses may be greater than expected and may adversely affect our results of operations and financial condition; (3) the expected benefits of the transaction, including revenue growth and realizable synergies for our investment banking business, may take longer than anticipated to achieve and may not be achieved in their entirety or at all, and will in part depend on the ability of the Company to retain and hire key personnel and maintain relationships with its clients; (4) developments in market and economic conditions have in the past adversely affected, and may in the future adversely affect, the business and profitability of the Company generally and of its investment banking business specifically; (5) the transaction will expose the Company to the energy sector which is currently experiencing an economic downturn; (6) other factors identified under “Risk Factors” in Part I, Item 1A of our Annual Report on Form 10-K for the year ended December 31, 2014, and updated in our subsequent reports filed with the SEC. These reports are available at www.piperjaffray.com or www.sec.gov. Forward-looking statements speak only as of the date they are made, and we undertake no obligation to update them in light of new information or future events.
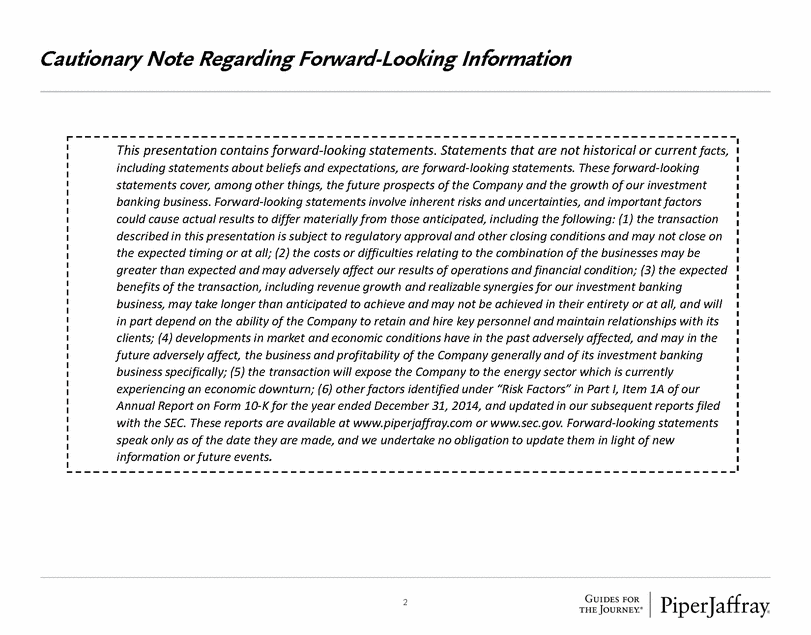
Piper Jaffray + Simmons & Company International - Combination Highlights Combining Industry Leaders Driving to a $500 million IB Franchise 3 Market leadership built on trusted relationships & industry expertise Increases addressable market significantly with move into energy Diversifies Investment Banking with Energy #2 after Health Care Revenue synergies across Advisory, ECM & DCM Expands research coverage by over 20% $250mm in Advisory revenue (Proforma)
Fit With Firm’sStrategic Priorities Favorable shift in our business mix Higher margin Advisory business Lower volatility Business Characteristics Differentiated value proposition Strong and defensible market position Sustainable/growing markets Firm Characteristics Strong cultural fit High quality leadership and professionals Cohesion with our existing business Transaction Characteristics Accretive to Non-GAAP EPS and ROE Adequate retention incentives 4
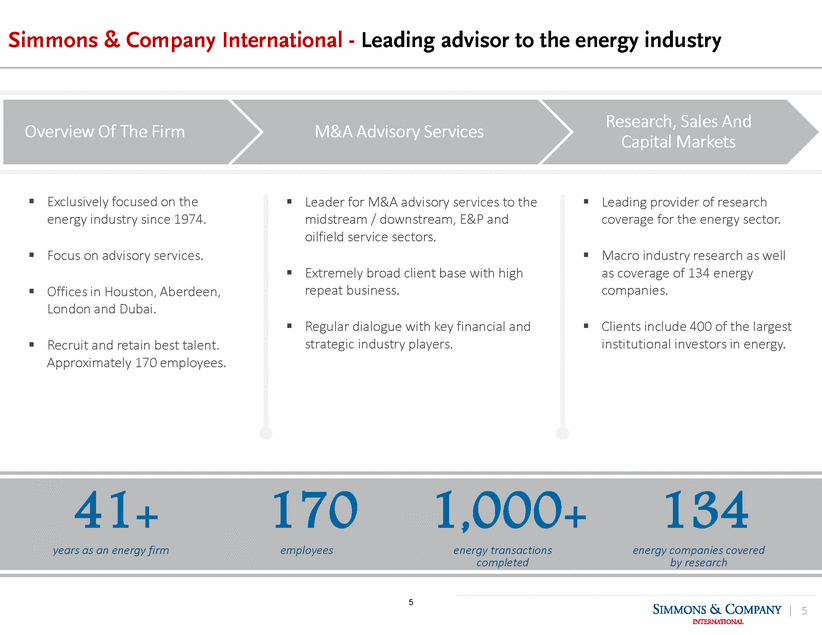
Simmons & Company International - Leading advisor to the energy industry Research, Sales And Capital Markets Overview Of The Firm M&A Advisory Services Exclusively focused on the energy industry since 1974. Leader for M&A advisory services to the midstream / downstream, E&P and oilfield service sectors. Leading provider of research coverage for the energy sector. Focus on advisory services. Macro industry research as well as coverage of 134 energy companies. Extremely broad client base with high repeat business. Offices in Houston, Aberdeen, London and Dubai. Regular dialogue with key financial and strategic industry players. Clients include 400 of the largest institutional investors in energy. Recruit and retain best talent. Approximately 170 employees. 41+ years as an energy firm 170 employees 1,000+ energy transactions completed 134 energy companies covered by research 5 5
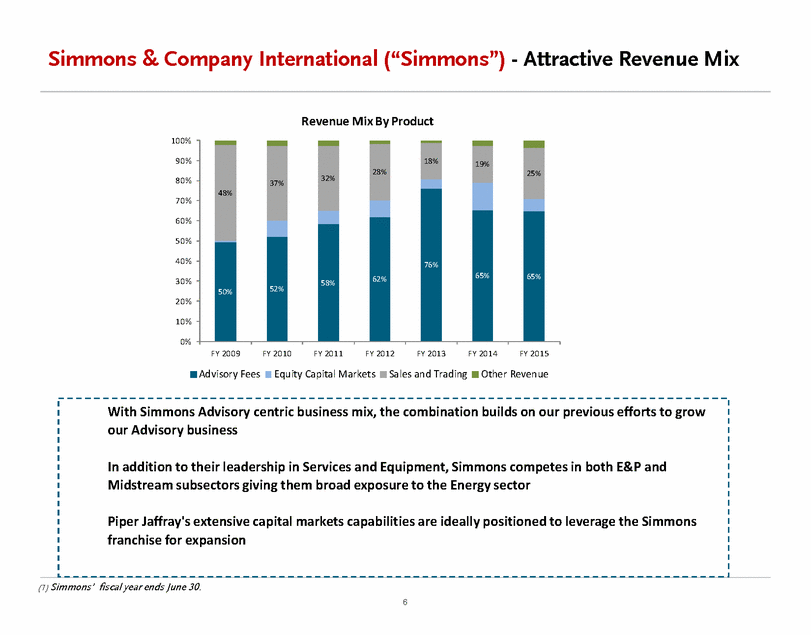
Simmons & Company International (“Simmons”) - Attractive Revenue Mix Revenue Mix By Product 100% 90% 19% 32% 80% 37% 70% 60% 50% 40% 30% 20% 10% 0% FY 2009 FY 2010 FY 2011 FY 2012 FY 2013 FY 2014 FY 2015 Advisory Fees Equity Capital Markets Sales and Trading Other Revenue (1) Simmons’ fiscal year ends June 30. 6 With Simmons Advisory centric business mix, the combination builds on our previous efforts to grow our Advisory business In addition to their leadership in Services and Equipment, Simmons competes in both E&P and Midstream subsectors giving them broad exposure to the Energy sector Piper Jaffray's extensive capital markets capabilities are ideally positioned to leverage the Simmons franchise for expansion 48% 28% 18% 25% 76% 65% 65% 62% 58% 52% 50%
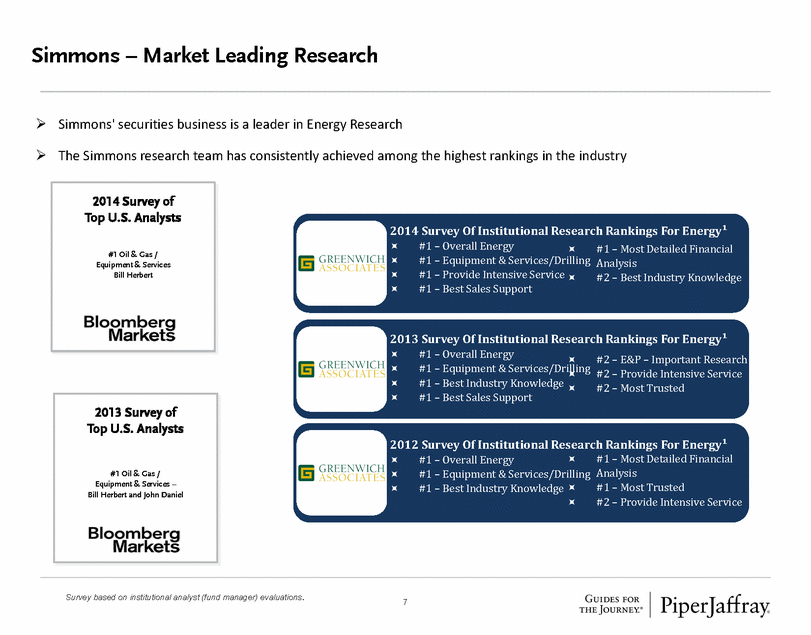
Simmons – Market Leading Research Simmons' securities business is a leader in Energy Research The Simmons research team has consistently achieved among the highest rankings in the industry 2014 Survey Of Institutional Research Rankings For Energy¹ #1 – Overall Energy #1 – Most Detailed Financial Analysis #2 – Best Industry Knowledge #1 – Equipment & Services/Drilling #1 – Provide Intensive Service #1 – Best Sales Support 2013 Survey Of Institutional Research Rankings For Energy¹ #1 – Overall Energy #2 – E&P – Important Research #2 – Provide Intensive Service #2 – Most Trusted #1 – Equipment & Services/Drilling #1 – Best Industry Knowledge #1 – Best Sales Support 2012 Survey Of Institutional Research Rankings For Energy¹ #1 – Most Detailed Financial Analysis #1 – Most Trusted #2 – Provide Intensive Service #1 – Overall Energy #1 – Equipment & Services/Drilling #1 – Best Industry Knowledge Survey based on institutional analyst (fund manager) evaluations. 7 2013 Survey of Top U.S. Analysts #1 Oil & Gas / Equipment & Services – Bill Herbert and John Daniel 2014 Survey of Top U.S. Analysts #1 Oil & Gas / Equipment & Services Bill Herbert
Transaction Terms (“Simmons”) Number of shares issued based on average price of last 10 trading days prior to Retention and stock consideration tied to employment with 3 year vesting Key employees signed retention and employment agreements Bill Herbert will become head of global energy research 8 Transaction Piper Jaffray & Co. (“PJC”) to acquire 100% of Simmons and Company International Consideration Simmons’ shareholders to receive approximately $139 million, consisting of $92 million in cash and $47 million in restricted stock closing of the transaction (Target close date anticipated at end of Q1 2016) Additional Retention Piper Jaffray has committed an additional $21 million in cash and stock for retention purposes requirements Earn out arrangement in place to reward growth in business Management Michael Frazier, Simmons’ Chairman, President and CEO, has entered into a consulting agreement and will continue to serve in a senior role that leverages his relationships and experience Fred Charlton will be appointed chairman of energy investment banking and will serve as co-head of energy investment banking together with James Baker Will Britt will continue to lead specialized energy equity sales Ira Green will become head of energy capital markets Colin Welsh will become chairman of Piper Jaffray’s U.K. subsidiary, and continue to lead Simmons international activities Capital Transaction funded with PJC’s existing resources We intend to repurchase shares to offset equity dilution from the transaction

Transaction – Financial Framework Incremental revenue related to Piper’s broader product expertise (1) Simmons and Company’s fiscal year ends June 30. 9 Revenue FY 2015 revenues of $95MM Revenues below historical levels due to challenging market conditions in the Energy sector Compensation Non-GAAP compensation expected to be 61-63% on Piper’s platform Non-Compensation Net of cost synergies non-compensation expenses anticipated to be $13-$14MM a year Simmons adds incremental scale that leverages Piper’s existing infrastructure resulting in a reduced non-compensation ratio going forward EPS Accretion and Financial Benefits Transaction expected to be accretive to Non-GAAP EPS by 10 to 15% in the first full year on Piper’s platform Significant tax savings from amortization of acquired goodwill Significant opportunities exist to drive earnings growth in the medium term Earnings Growth Opportunities Full realization of cost synergies Improvement in market conditions
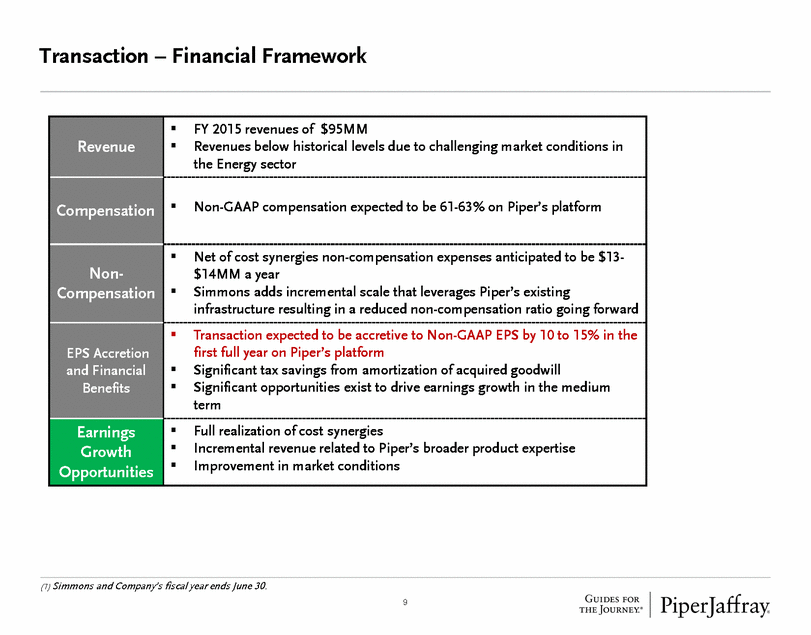
Piper Jaffray – Building on Investment Banking Momentum Over the past two years, Piper has invested significantly in the investment banking platform leading to meaningful growth – outpacing both our core and bulge bracket competitors and Acquisitions of the Year” 60% 50% 40% 30% 20% 10% 0% -10% 49% 28% 26%26% 24% 23% 19% 17% 13% 8% 3% -1% Core Comparable Group Bulge (1) Source: SEC Filings; fiscal year 2013 vs. fiscal year 2014 investment banking revenue. 10 OPY SFMC LAZEVRRJFJEFMS GSJPMBAML 2013 – 2014 INVESTMENT BANKING REVENUE GROWTH(1) 2016 2015 2014 2014 Named Merger “ Investment Bank June 2015 Expansion of FIG Equities and Banking teams and acquisition of River Branch February 2015 Expansion of Debt Capital Markets team ecember 2013 lthy, Active & stainable Living roup from PCG July 2013 Acquisition of Edgeview Partners D Hea Su G 2013 Q1 2016 Acquisition of Simmons & Company International
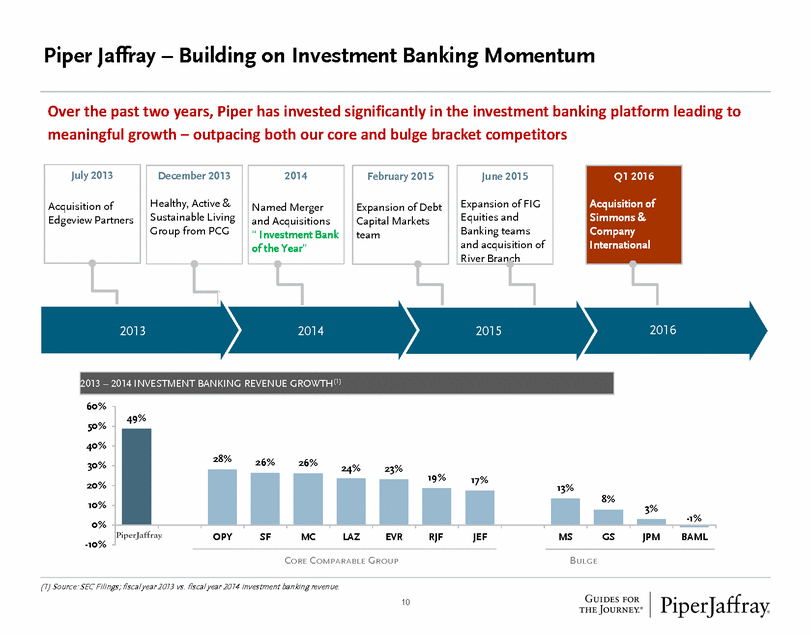
Expanded Market Opportunities – Sectors & Products The addition of Simmons significantly expands our market opportunities Increases our target fee pool to 80% of the total ECM pool, and about 95% of the M&A pool Energy firms are consumers of all of our products including ECM, DCM and Private Placements (1) (2) (3) (4) ECM data through 10/31/15; Source: Piper Jaffray ECM and Dealogic M&A data through 10/31/15 Source: Thomson Reuters Energy Fee Pool data through 9/30/15 Source: Freeman Consulting Focus Sectors: Clean Tech, Consumer, Health Care & TMT/BS 11 100% 80% 60% 40% 20% 0% 201020112012201320142015 YTD R R M&AECMLevraged Finance -Bonds and LoansInv Grade Debt - Bonds and Loans 18% 23% 23% 22% 23% 29% 25% 28% 31% 28% 31% 33% 26% 25% 25% 22% 27% 18% 32% 23% 23% 24% 20% 20% Energy Fee Pool By Product 2007 - 2015 M&A Deals 6% PJC Historical Focus (Growth Sectors) Energy 8% Financials 74%Non PJC Sectors 2007 - 2015 Equity Capital Markets Fee Pool PJC Historical Focus 21% (Growth Sectors) 38% Energy Financials 23% Non PJC Sectors 18%
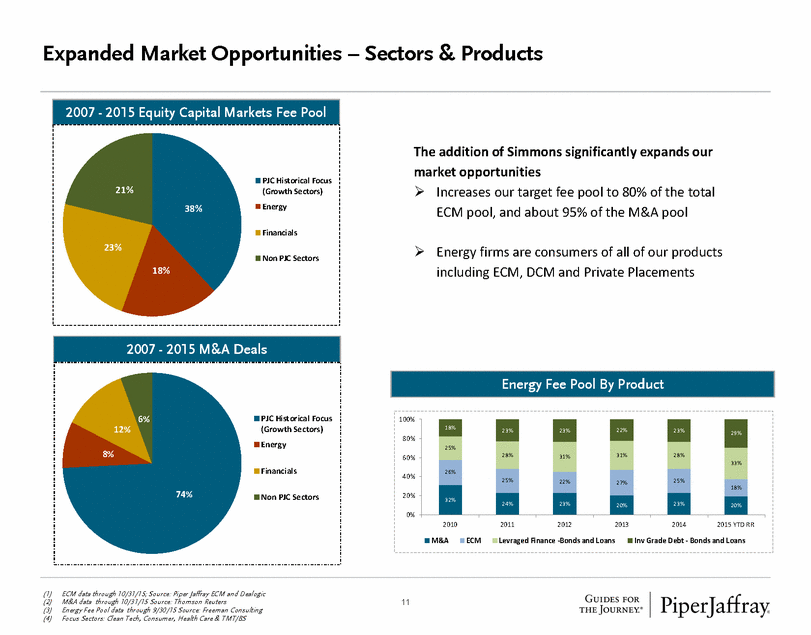
Advisory Strength & Opportunity $74.4 $74.4 12 Key Synergy Drivers •Growing our advisory business has been a key strategic priority •The combination results in a potential $250 million advisory business (proforma) with Simmons’ revenue mix weighted towards advisory •Based on our experience with prior acquisitions: •We expect to leverage Piper’s deeper resume to pitch and win larger deals while continuing to serve Simmons core franchise •Broader financial sponsor relationships and increased idea generation as part of the combined firm should drive higher win rate with financial sponsors Advisory Fees $300 $250 $200 $150 $100 $50 $-20112012201320142014 + Simmons $250.0 $186.0 $86.1 Investment Banking Mix 100% 90% 80% 70% 60% 50% 40% 30% 20% 10% 0% 20112012201320142014 + Simmons Advisory FeesEquity Ca pita l Markets 50% 46% 57% 39% 34% 66% 61% 54% 50% 43%
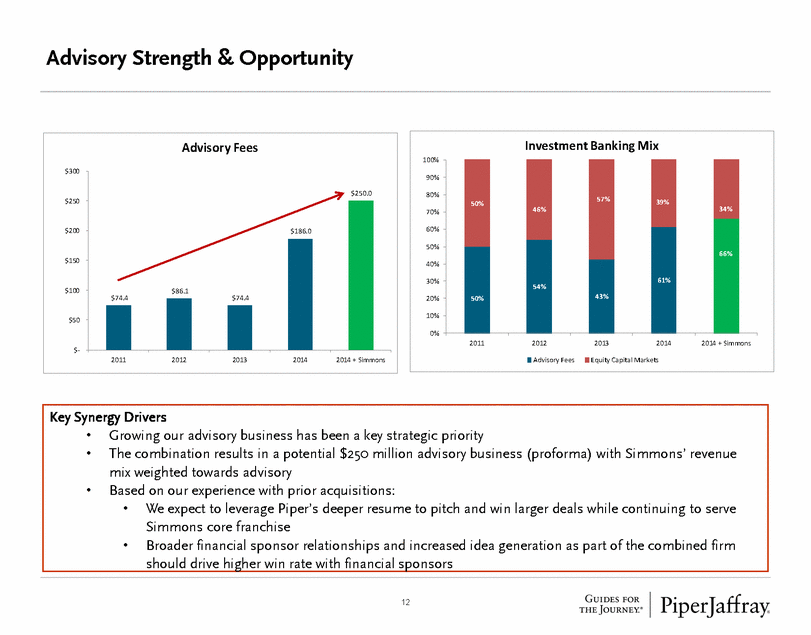
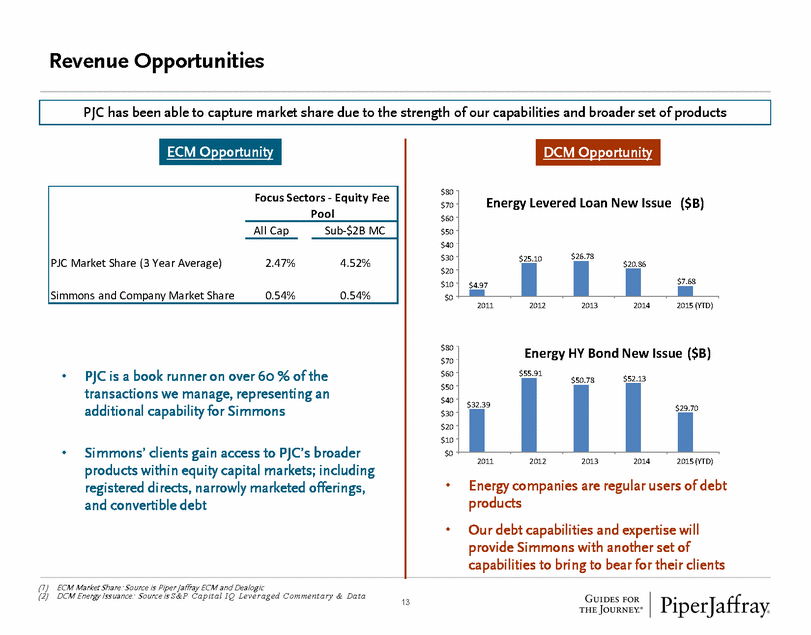
Revenue Opportunities $70 2011 2012 2013 2014 2015 (YTD) $70 $60 $50 $30 2011 2012 2013 2014 2015 (YTD) (1) ECM Market Share: Source is Piper Jaffray ECM and Dealogic (2) DCM Energy Issuance: Source is S & P C a p i t al I Q L e v e r age d C o m m e nt ar y & D a t a 13 •PJC is a book runner on over 60 % of the transactions we manage, representing an additional capability for Simmons •Simmons’ clients gain access to PJC’s broader products within equity capital markets; including registered directs, narrowly marketed offerings, and convertible debt $80 $60 $50 $40 $30 $20 $10 $0 $80 $50.78$52.13 $40 $20 $10 $0 •Energy companies are regular users of debt products •Our debt capabilities and expertise will provide Simmons with another set of capabilities to bring to bear for their clients Energy HY Bond New Issue ($B) $55.91 $32.39 $29.70 Energy Levered Loan New Issue ($B) $25.10$26.78 $4.97 $20.86 $7.68 PJC Market Share (3 Year Average) Simmons and Company Market Share Focus Sectors - Equity Fee Pool All Cap 2.47% 0.54% Sub-$2B MC 4.52% 0.54% DCM Opportunity ECM Opportunity PJC has been able to capture market share due to the strength of our capabilities and broader set of products
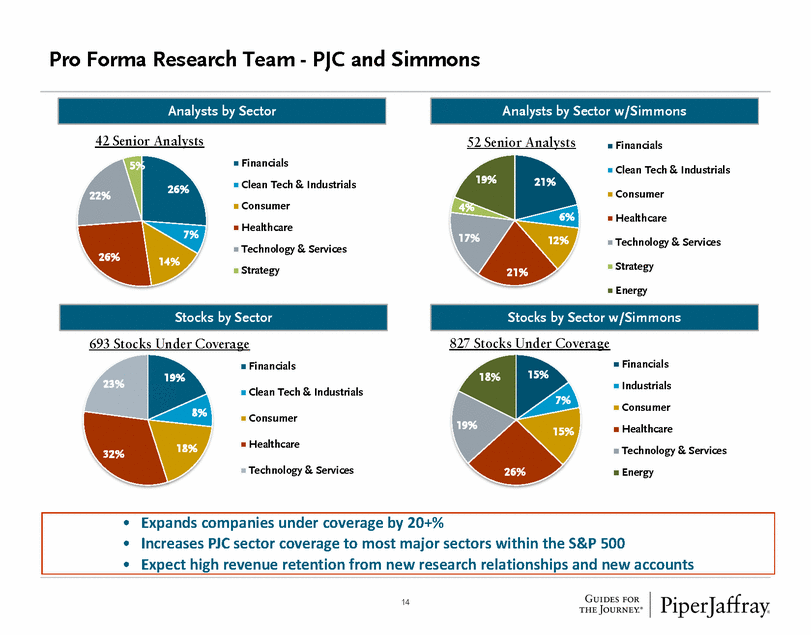
Pro Forma Research Team - PJC and Simmons 42 Senior Analysts 52 Senior Analysts Financials Financials Clean Tech & Industrials Consumer Healthcare Technology & Services Strategy Clean Tech & Industrials 19% 21% 26% Consumer 22% 4% Healthcare 7% 17% Technology & Services 26% 14% Strategy 21% Energy 827 Stocks Under Coverage 693 Stocks Under Coverage Financials Industrials Consumer Healthcare Technology & Services Energy Financials 15% 18% 19% 23% Clean Tech & Industrials 7% 8% Consumer 19% Healthcare 18% 32% Technology & Services 26% 14 •Expands companies under coverage by 20+% •Increases PJC sector coverage to most major sectors within the S&P 500 •Expect high revenue retention from new research relationships and new accounts Stocks by Sector Stocks by Sector w/Simmons Analysts by Sector Analysts by Sector w/Simmons
Piper Jaffray and Simmons & Company International Investor Presentation November 2015 15
