Attached files
| file | filename |
|---|---|
| 8-K - FORM 8-K - PATTERSON UTI ENERGY INC | d73071d8k.htm |
 Patterson-UTI Energy, Inc. Meetings with Investors November 17-18, 2015 Exhibit 99.1 |
 Forward Looking Statements This material and any oral statements made in connection with this material
include "forward-looking statements" within the
meaning of the Securities Act of 1933 and the
Securities Exchange Act of 1934. Statements made which provide the Company’s or management’s intentions, beliefs, expectations or predictions for
the future are forward-looking statements and are inherently
uncertain. The opinions, forecasts, projections or
other statements other than statements of
historical fact, including, without limitation, plans and
objectives of management of the Company are
forward-looking statements. It is important to note that actual results could differ materially from those discussed in such forward-looking
statements. Important factors that could cause actual
results to differ materially include the risk
factors and other cautionary statements contained from time to time in the Company’s SEC filings, which may be obtained by contacting the
Company or the SEC. These filings are also available through the
Company’s web site at http://www.patenergy.com or through the SEC’s Electronic Data Gathering and Analysis Retrieval System (EDGAR) at http://www.sec.gov. We undertake no
obligation to publicly update or revise any
forward-looking statement. Statements
made in this presentation include non-GAAP financial
measures. The required reconciliation to
GAAP financial measures are included on our website and/or at the end of this presentation. 2 |
 Contract Drilling • High quality fleet of land drilling rigs including 160 APEX ® rigs • Leader in walking rig technology for pad drilling applications • Large footprint across North American drilling markets Pressure Pumping 38% Oil & Natural Gas 1% Contract Drilling 61% Components of Revenue Patterson-UTI reported results for the nine months ended September 30, 2015
3 |
 Pressure Pumping • High quality fleet of modern pressure pumping equipment • Strong reputation for regional knowledge and efficient operations • Concentrated footprint provides economies of scale 4 Pressure Pumping 38% Oil & Natural Gas 1% Contract Drilling 61% Components of Revenue Patterson-UTI reported results for the nine months ended September 30, 2015 |
 Scaling The Business Scaling our business effectively is key to our success…
…both in upturns and downturns
5
Patterson-UTI U.S. rig count and U.S. drilling staff size
through November 4, 2015 Patterson-UTI U.S. Rig
Count vs. U.S. Drilling Staff Size Rig
Count Drilling Staff Size
|
 Managing Supply Chain 6 • Sourcing and Supply Security – Negotiated critical cost elements for both Drilling and Pressure Pumping – Solidified availability of strategic commodities • Reduced Costs in 2015 – Sand costs down 25% - 35% – Sand hauling costs down 25% - 35% – Pump parts costs down 15% - 20% – Chemical costs down as much as 40% |
 Contract Drilling |
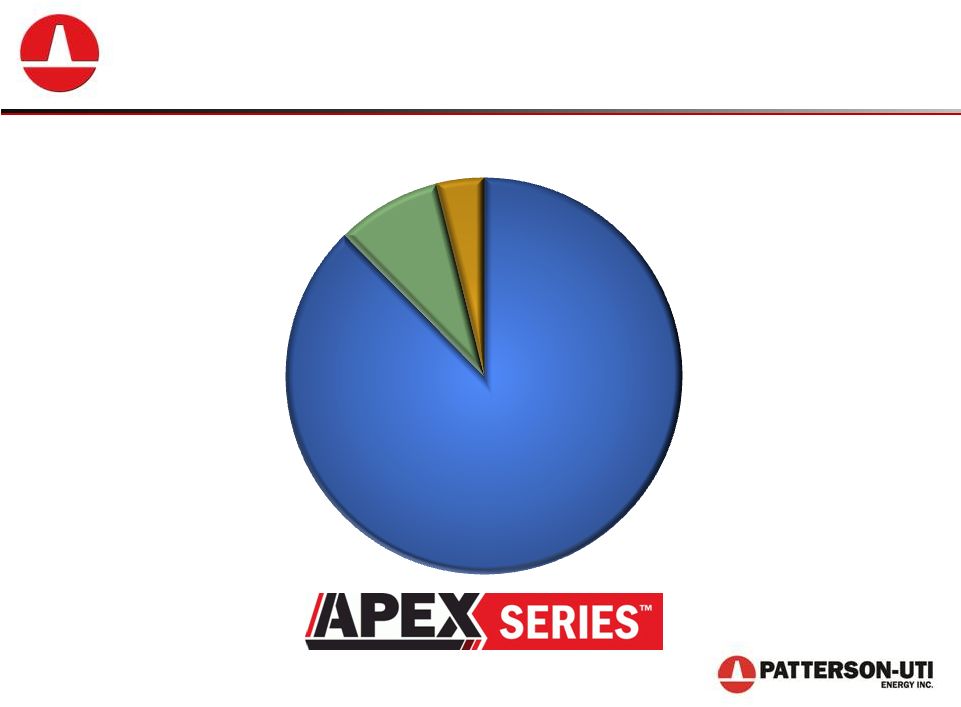
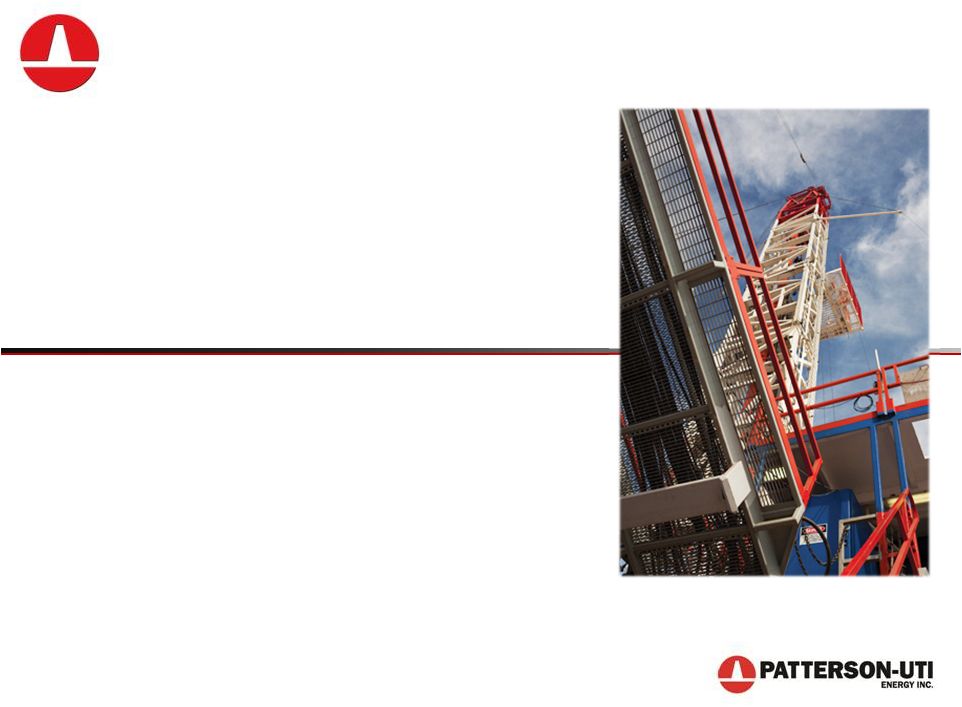
 High Quality Drilling Rigs 127 30 3 APEX ® Rig Fleet by Drawworks Horsepower 1500hp 1000hp 2000hp 8 160 APEX ® Rigs |
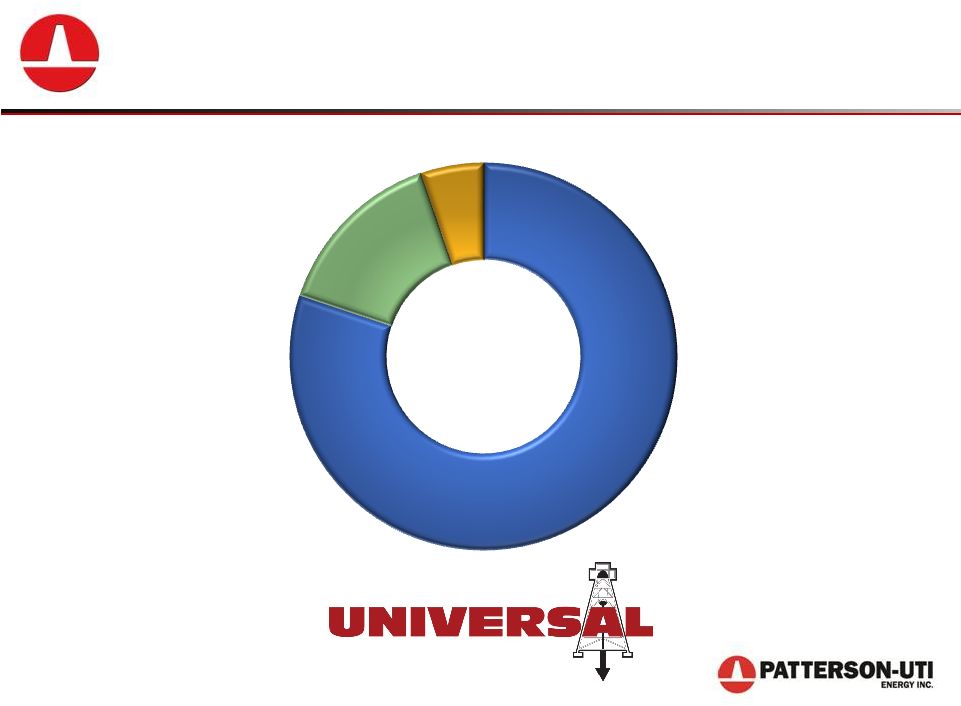
 Majority of Adjusted EBITDA from APEX ® Rigs APEX ® Other Electric Mechanical Adjusted EBITDA Contribution by Rig Class *Adjusted EBITDA contribution by rig class excluding early termination revenues for the nine months ended September 30,
2015. 9 |
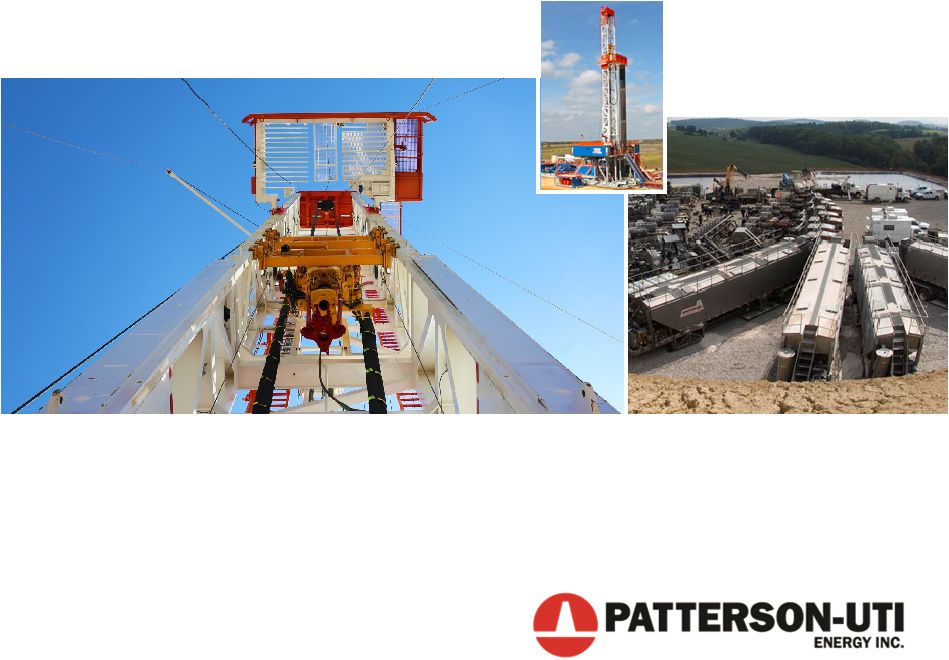
 The APEX-XK ® • Enhanced X-Y mobility – Walk with full set-back of pipe in mast – More efficient rig up / rig down – Walking times average 45 minutes for 10’ – 15’ well spacing • Advanced environmental spill control integrated into drilling floor • Reduced number of truck loads for rig moves • 52 APEX-XK 1500 ® and four APEX- XK 1000™ rigs in fleet http://patenergy.com/drilling/technology 10 |
 APEX-XK ® Integrated Walking System 11 |
 APEX-XK ® Rig Walking on Pad 12 http://patenergy.com/drilling/technology/apexwalk/ Video of APEX-XK ® Rig 12 |
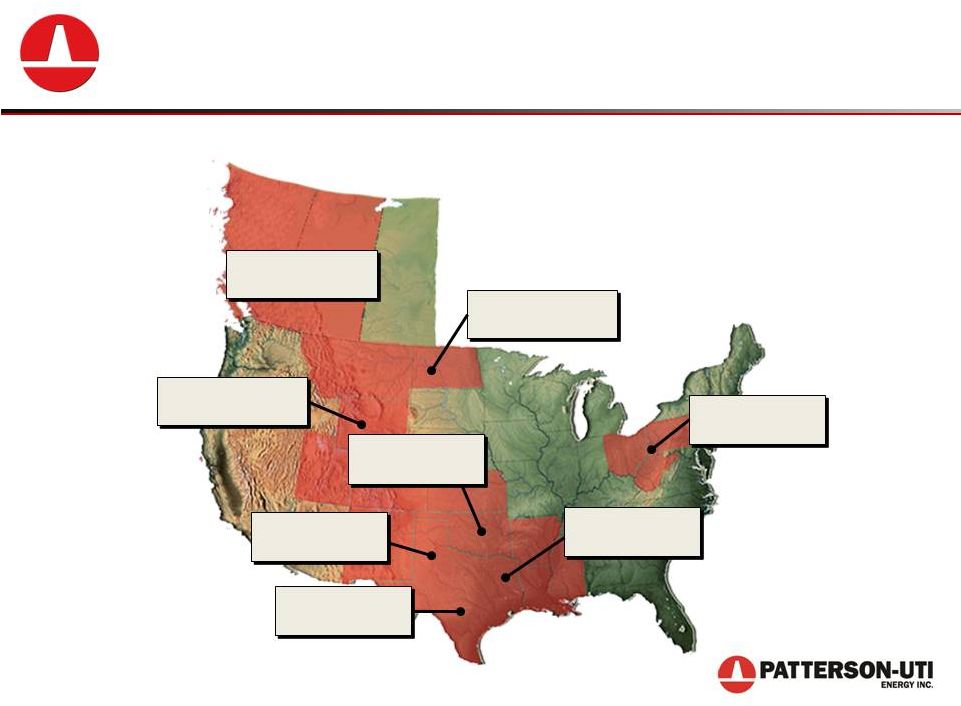 West Texas 20 Rigs Large Geographic Footprint PTEN’s Active Rig Count by Region as of November 13, 2015 Appalachia 21 Rigs East Texas 10 Rigs Mid-Continent 8 Rigs Rockies 8 Rigs South Texas 14 Rigs North Dakota 11 Rigs 13 Canada 4 Rigs http://patenergy.com/ |
 Pressure Pumping |
 Modern Pumping Equipment < 5 Years 70% 5 - 10 Years 25% >10 Years 5% Frac Horsepower by Age 4 Years Average Age 15 |
 Modern Pumping Equipment Quintuplex 80% Modern Triplex 15% Legacy Triplex 5% Frac Horsepower by Pump Type 1Million Horsepower 16 Modern triplex pumps defined as being placed in service within the last seven years. |
 Southwest Region: Northeast Region: 35% 65% Frac Horsepower Fracturing horsepower: 663,800 Other horsepower: 32,165 Fracturing horsepower: 353,800 Other horsepower: 55,400 Market Concentration Provides Economies of Scale Pressure Pumping Areas Horsepower distribution as of September 30, 2015 17 |
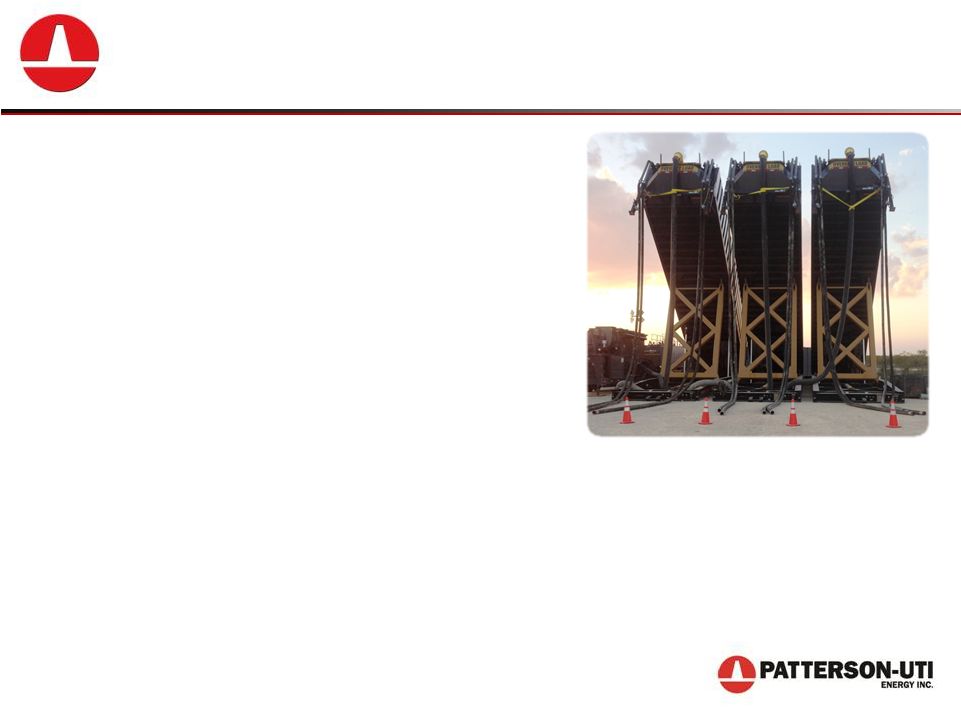
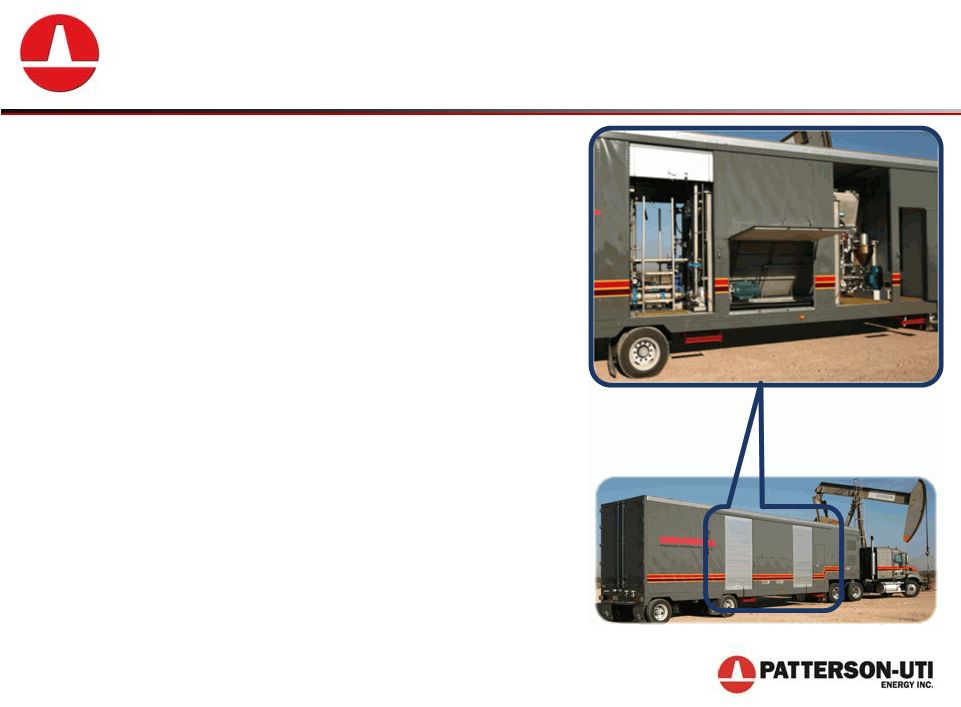
 Technology Focused PropLogic™ Sand Management System 18 • Fully enclosed well-site sand management system • More accurate than conventional sand trailers/bins • More efficient use of proppant as less sand is wasted |
 Technology Focused PowderStim ® Dry Friction Reducer 19 • System hydrates powder form of friction reducer directly into the fluid stream • Logistically safer and more efficient compared to liquefied friction reducers • Successful with both fresh water and heavy brines • More cost effective by utilizing produced water |
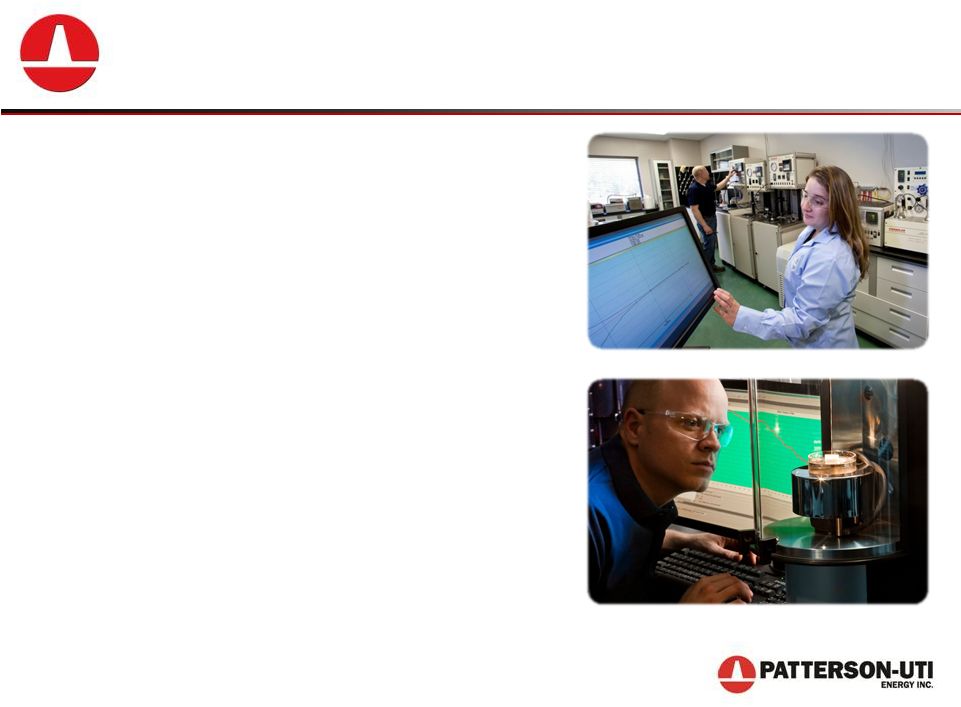 Technology Focused Comprehensive Lab Services 20 • Ability to test vendors’ chemicals enhances quality controls • Unique in-house friction flow loop test assembly for faster test results • In-house lab services are faster and more cost efficient than outsourcing |
 Strong Financial Position |
 Investing in Our Company 22 $598 $637 $445 $453 $976 $1,012 $974 $662 $1,229 $700 <$200 2006 2007 2008 2009 2010 2011 2012 2013 2014 2015E 2016E Year End Capital Expenditures and Acquisitions ($ in millions) 2015 and 2016 Capital expenditure forecast as of October 22, 2015 |
 Strong Financial Position $300 $300 $265 $2,631 Capital Structure ($ in Millions) 25% Debt/ Total Cap Stockholder’s Equity 4.97% Series A notes Due October 5, 2020 4.27% Series B notes Due June 14, 2022 Bank Term Loans Maturing September 27, 2017 23 * Debt and equity balances as of September 30, 2015. $265 million of bank term loans includes quarterly
payments totaling $10 million in the fourth
quarter of 2015 and $63.8 million in total for 2016. |
 Total Liquidity $500 $76 $ in Millions Line of Credit Availability Cash 24 * Cash and debt balances as of September 30, 2015. $265 million of bank term loans includes quarterly
payments totaling $10 million in the fourth quarter of 2015 and
$63.8 million in total for 2016. •
$76.5 million cash
• $500 million revolver availability • Of $865 million debt – $265 million matures September 2017 – $300 million matures October 2020 – $300 million matures June 2022 |
 Why Invest in Patterson-UTI Energy? • High Quality Assets – 160 APEX ® rigs comprised primarily of 1500 horsepower and pad capable rigs – Creating value through focus on well site execution • Technology leader – Leader in walking rigs for pad drilling – Innovator in deploying latest technologies for pressure pumping • Financially flexible – Strong balance sheet – History of share buybacks – Dividends – Scalable business structure 25 |
 Patterson-UTI Energy, Inc. Meetings with Investors November 2015 |
 Additional References |
 Three Months Ended September 30, Nine Months Ended September 30, 2015 2014 2015 2014 Adjusted Earnings Before Interest, Taxes, Depreciation and Amortization
(Adjusted EBITDA)(1):
Net income (loss)
$
(225,978)
$
15,976
$(235,828)
$
105,081
Income tax expense (benefit)
(112,452)
7,556
(120,452)
50,403
Net interest expense
8,931
6,759
26,120
20,812
Depreciation, depletion, amortization and
impairment 332,151
237,825
689,457
538,573
Impairment
of
goodwill
124,561
-
124,561
-
Adjusted EBITDA
$
127,213
$
268,116
$
483,858
$
714,869
Total revenue
$
422,251
$
845,628
$1,552,711
$2,281,072
Adjusted EBITDA margin
30.1%
31.7%
31.2%
31.3%
Adjusted EBITDA by operating segment:
Contract drilling
$
123,500
$
202,804
$
431,523
$
557,674
Pressure pumping
11,791
62,795
73,211
157,913
Oil and natural gas
3,508
11,449
12,247
29,423
Corporate and other
(11,586)
(8,932)
(33,123)
(30,141)
Consolidated Adjusted EBITDA
$
127,213
$
268,116
$
483,858
$
714,869
(1)
The company makes use of financial measures that are not
calculated in accordance with U.S. generally accepted accounting principles (“GAAP”) to help in the assessment of ongoing operating performance. These non-GAAP financial measures are reconciled to their most directly
comparable GAAP measures in the tables above. We
define Adjusted EBITDA as net income plus net interest expense, income tax expense and depreciation, depletion, amortization and impairment expense. We present Adjusted EBITDA because we believe it provides additional information with respect to both the performance of
our fundamental business activities and our
ability to meet our capital expenditures and working capital requirements. Adjusted EBITDA is not defined by GAAP and, as such, should not be construed as an
alternative
to
net
income
(loss)
or
operating
cash
flow.
We
define
margin
as
revenues
less
direct
operating
costs.
We
present
margin
because
we
believe
it
to
be
the
component of our earnings most impacted by the variability in
our contract drilling and pressure pumping operations. Margin is not defined by GAAP and, as such, should not be construed as an alternative to net income (loss).
PATTERSON-UTI ENERGY, INC.
Non-GAAP Financial Measures (Unaudited)
(dollars in thousands)
Non-GAAP Financial Measures
28 |
 Non-GAAP Financial Measures 2014 2013 2012 2011 2010 Adjusted Earnings Before Interest, Taxes, Depreciation and Amortization
(Adjusted EBITDA)(1):
Net income (loss)
$
162,664
$
188,009
$
299,477
$
322,413
$
116,942
Income tax expense (benefit)
91,619
108,432
176,196
187,938
72,856
Net interest expense (income)
28,846
27,441
22,196
15,465
11,098
Depreciation, depletion, amortization and
impairment 718,730
597,469
526,614
437,279
333,493
Net
impact of discontinued operations
-
-
-
(209)
1,778
Adjusted EBITDA
$
1,001,859
$
921,351
$
1,024,483
$
962,886
$
536,167
Total revenue
$
3,182,291
$
2,716,034
$
2,723,414
$
2,565,943
$
1,462,931
Adjusted EBITDA margin
31.5%
33.9%
37.6%
37.5%
36.7%
(1) The company makes use of
financial measures that are not calculated in accordance with U.S. generally accepted accounting principles (“GAAP”) to help in the assessment of
ongoing operating performance. These
non-GAAP financial measures are reconciled to their most directly comparable GAAP measures in the tables above. We define Adjusted EBITDA as net income plus net interest expense, income tax expense and depreciation, depletion, amortization and
impairment expense. We present Adjusted EBITDA because we believe it provides additional information with respect to both the performance of our fundamental business activities and our ability to meet our capital expenditures and working capital requirements. Adjusted EBITDA is not defined by GAAP and, as such, should not be construed as an alternative to net income (loss) or operating cash flow. We define margin as revenues less direct operating costs. We present margin because we believe it to be the component of our earnings most impacted by the variability in our
contract drilling and pressure pumping operations.
Margin is not defined by GAAP and, as such, should not be construed as an alternative to net income (loss). PATTERSON-UTI ENERGY, INC. Non-GAAP Financial Measures (Unaudited) (dollars in thousands) 29 |