Attached files
| file | filename |
|---|---|
| 8-K - FORM 8-K - GOLUB CAPITAL BDC, Inc. | v424950_8k.htm |

0 GOLUB CAPITAL BDC, INC. INVESTOR PRESENTATION Quarter Ended September 30, 2015 GOLUBCAPITALBDC.COM GBDC

1 DISCLAIMER Some of the statements in this presentation constitute forward - looking statements, which relate to future events or our future performance or financial condition. The forward - looking statements contained in this presentation involve risks and uncertainties, including statements as to: our future operating results; our business prospects and the prospects of our portfolio companies; the effect of investments that we expect to make and the competition for those investments; our contractual arrangements and relationships with third parties; actual and potential conflicts of interest with GC Advisors LLC ("GC Advisors"), our investment adviser, and other affiliates of Golub Capital LLC (collectively, "Golub Capital"); the dependence of our future success on the general economy and its effect on the industries in which we invest; the ability of our portfolio companies to achieve their objectives; the use of borrowed money to finance a portion of our investments; the adequacy of our financing sources and working capital; the timing of cash flows, if any , from the operations of our portfolio companies; general economic trends and other external factors; the ability of GC Advisors to locate suitable investments for us and to monitor and administer our investments; the ability of GC Advisors or its affiliates to attract and retain highly talented professionals; our ability to qualify and maintain our qualification as a regulated investment company and as a business development company; general price and volume fluctuations in the stock markets; the impact on our business of the Dodd - Frank Wall Street Reform and Consumer Protection Act and the rules and regulations issued thereunder; and the effect of changes to tax legislation and our tax position. Such forward - looking statements may include statements preceded by , followed by or that otherwise include the words “may,” “might,” “will,” “intend,” “should,” “could,” “can,” “would,” “expect,” “believe,” “estimate,” “anticipate,” “predict,” “potential,” “plan” or similar words . We have based the forward - looking statements included in this presentation on information available to us on the date of this presentation. Actual results could differ materially from those anticipated in our forward - looking statements and future results could differ materially from historical performance. You are advised to consult any additional disclosures that we may make directly to you or through reports that we have filed or in the future may file with the Securities and Exchange Commission (“SEC”), including annual reports on Form 10 - K, quarterly reports on Form 10 - Q, current reports on Form 8 - K and registration statements on Form N - 2. This presentation contains statistics and other data that have been obtained from or compiled from information made available by third - party service providers. We have not independently verified such statistics or data . In evaluating prior performance information in this presentation, you should remember that past performance is not a guarantee, prediction or projection of future results, and there can be no assurance that we will achieve similar results in the future.

2 SUMMARY OF QUARTERLY RESULTS Fourth Fiscal Quarter 2015 Highlights Net increase in net assets resulting from operations (i.e. net income) for the quarter ended September 30, 2015 was $19.5 mil lio n, or $0.38 per share, as compared to $18.3 million, or $0.36 per share, for the quarter ended June 30, 2015. Net investment income for the quarter ended September 30, 2015 was $15.5 million, or $0.30 per share, as compared to $15.2 million, or $0.30 per share, for the quarter ended June 30, 2015. Excluding a $0.8 million accrual for the capital gain incentive fee under GAAP, net investment income for the quarter ended S ept ember 30, 2015 was $16.3 million, or $0.32 1 per share, as compared to $15.9 million, or $0.32 1 per share, when excluding a $0.7 million accrual for the capital gain incentive fee under GAAP for the quarter ended June 30, 2 015. Net asset value per share rose from $15.74 to $15.80, the thirteenth consecutive quarterly increase. Net realized and unrealized gains on investments and secured borrowings of $4.0 million, or $0.08 per share, for the quarter end ed September 30, 2015 were the result of $0.9 million of net unrealized depreciation and $4.9 million of net realized gains. New middle - market investment commitments totaled $187.4 million for the quarter ended September 30, 2015. Including investments of $12.0 million in Senior Loan Fund LLC (“SLF”), total new investment commitments were $199.4 million. Approximately 19% of the new investment commitments were senior secured loans, 74 % w ere one stop loans, 6 % were investments in SLF, and 1% were investments in equity securities. Overall, total investments in portfolio companies at fair value decreased by $40.9 million dur ing the three months ended September 30, 2015. 1. As a supplement to generally accepted accounting principles in the United States of America (“GAAP ”) financial measures, the Company has provided this non - GAAP performance result. The Company believes that this non - GAAP financial measure is useful as it excludes the accrual of the capital gain incentive fee which is not contractually payable under the terms of our investment advisory agreement with GC Ad vis ors ( the “Investment Advisory Agreement”). The capital gain incentive fee payable as calculated under the Investment Advisor y A greement for the period ended September 30, 2015 is $0 . However, in accordance with GAAP, we are required to include aggregate unrealized appreciation on investments in the calculat ion and accrue a capital gain incentive fee on a quarterly basis as if such unrealized capital appreciation were realized, even though such unrealized capital appreciation is not permitted to be considered in calculating the fee actually payable under the Investmen t A dvisory Agreement. Although this non - GAAP financial measure is intended to enhance investors’ understanding of the Company’s business and performance, this non - GAAP financial measure should not be considered an alternative to GAAP. Refer to slide 3 for a reconciliation to the nearest GAAP measure, net investment income per share.

3 FINANCIAL HIGHLIGHTS Q4 2 015 Q3 2015 Q2 2 015 Q1 2 015 Q4 2 014 Earnings per share $ 0.38 $ 0.36 $ 0.38 $ 0.32 $ 0.43 Net investment income per share 0.30 0.30 0.29 0.31 0.32 Accrual for capital gain incentive fee per share 0.02 0.02 0.02 N/A N/A Net investment income before accrual for capital gain incentive fee per share 1 0.32 0.32 0.31 0.31 0.32 Net realized /unrealized gain (loss) per share 0.08 0.06 0.09 0.01 0.11 Net asset value per share 15.80 15.74 15.61 15.55 15.55 Distributions paid per share 0.32 0.32 0.32 0.32 0.32 Q4 2015 Q3 2015 Q2 2 015 Q1 2 015 Q4 2 014 Investments in Portfolio Companies, at Fair Value (000s) $ 1,430,848 $ 1,482,822 $ 1,366,048 $ 1,361,021 $ 1,312,781 Investments in SLF, at Fair Value (000s) $ 98,936 $ 87,865 $ 57,015 $ 39,705 $ 34,831 Total Fair Value of Investments (000s) $ 1,529,784 $ 1,570,687 $ 1,423,063 $ 1,400,726 $ 1,347,612 Number of Portfolio Company Investments 2 164 157 146 147 145 Average Investment Size (000s) $ 8,725 $ 9,445 $ 9,356 $ 9,259 $ 9,054 Fair Value as a Percentage of Principal (Loans) 98.5% 98.6% 98.6% 98.5% 98.7% 1. As a supplement to GAAP financial measures, the Company has provided this non - GAAP performance result. The Company believes that this non - GAAP financial measure is useful as it excludes the accrual of the capital gain incentive fee which is not contractually payable under the terms of the Investment Advisory Agreement. The capital gain incentive fee payable as calculated under the Investment Advisory Agreement for the period ended September 30, 2015 is $0. However, in accordance with GAAP, we are required to include aggregate unrealized appreciation on investments in the calculation and accrue a capital gain incentive fee on a quarterly basis as if such unrealized capital app reciation were realized, even though such unrealized capital appreciation is not permitted to be considered in calculating th e f ee actually payable under the Investment Advisory Agreement. Although this non - GAAP financial measure is intended to enhance investors’ understanding of the C ompany’s business and performance, this non - GAAP financial measure should not be considered an alternative to GAAP. 2. Excludes SLF.

4 PORTFOLIO HIGHLIGHTS – NEW ORIGINATIONS Originations and Net Funds Growth New investment commitments totaled $199.4 million for the quarter ended September 30, 2015, including investments totaling $1 2.0 million in SLF. Total investments at fair value decreased by 2.6%, or $40.9 million, for the quarter ended September 30, 2015 from June 30, 2015. During the quarter ended September 30, 2015, SLF purchased $85.9 million of senior secured loans at fair valu e f rom GBDC. Select Portfolio Funds Roll Data (in millions) Q4 2 015 Q3 2 015 Q2 2 015 Q1 2 015 Q4 2 014 New Investment Commitments $ 199.4 $ 401.4 $ 179.0 $ 146.5 $ 332.6 Exits and Sales of Investments 1 237.6 233.6 147.0 80.9 286.6 Net Funds Growth 2 (40.9) 147.6 22.3 53.1 22.7 Asset Mix of New Investments Q4 2 015 Q3 2 015 Q2 2 015 Q1 2 015 Q4 2 014 Senior Secured 19% 13% 31% 53% 11% One Stop 74% 78% 58% 43% 81% Second Lien 0% 0% 0% 0% 6% Subordinated Debt 0% 0% 0% 0% 0% Investment in SLF 6% 8% 9% 3% 0% 3 Equity 1% 1% 2% 1% 2% 1. Includes full and partial payoffs and sales of $85.9 million to SLF. 2. Net funds growth includes the impact of new investments and exits of investments as noted in the table above, as well as other va ria bles such as net fundings on revolvers, net change in unamortized fees, net change in unrealized appreciation (depreciation), etc. 3. Represents an amount less than 1%.

5 $1,348 $1,401 $1,423 $1,571 $1,530 $- $200 $400 $600 $800 $1,000 $1,200 $1,400 $1,600 Q4 2014 Q1 2015 Q2 2015 Q3 2015 Q4 2015 3 % 3% <1% 3% 3% <1% 4 % 4 % <1% 5 % 4% <1% 6 % 4% <1% PORTFOLIO HIGHLIGHTS ― PORTFOLIO DIVERSITY AS OF SEPTEMBER 30, 2015 14% 15% 14% 12% 9% 9% 6% 4% 4% 3% 2% 6% 16% Healthcare, Education and Childcare – 15% Diversified/Conglomerate Service – 14% Retail Stores – 12% Electronics – 9% Beverage, Food and Tobacco – 9% Aerospace and Defense – 6% Diversified/Conglomerate Manufacturing – 4% Leisure, Amusement, Motion Pictures, Entertainment – 4% Personal, Food and Miscellaneous Services – 3% Personal and Non Durable Consumer Products (Mfg. Only) – 2% SLF – 6% Other – 16% 99.7% Interest Rate on Loans 2 Fixed – 0.3% 1. Excludes investment in SLF. 2. The percentage of fixed rate loans and floating rate loans is calculated using total debt investments at fair value and exclu des equity investments . Diversity by Investment Size Top 10 Investments 20% Top 25 Investments 41% Remaining 139 Investments 53% SLF 6% INVESTMENT PORTFOLIO $1,431MM 1 // 164 INVESTMENTS 1 – AVERAGE SIZE $8.7MM Historical Investment Portfolio ($mm) Industry Diversity of Investments Floating 70% 72% 73% 74% 74% 20% 18% 15% 13% 4 % 4 % 4 % 3% 3%

6 9.3% 8.3% 8.4% 8.4% 8.8% 8.2% 7.8% 7.9% 7.6% 8.0% 3.2% 3.3% 3.3% 3.2% 3.2% 6.1% 5.0% 5.1% 5.2% 5.6% 0.2% 0.3% 0.3% 0.3% 0.3% 0.0% 1.0% 2.0% 3.0% 4.0% 5.0% 6.0% 7.0% 8.0% 9.0% 10.0% 11.0% Q4 2014 Q1 2015 Q2 2015 Q3 2015 Q4 2015 Investment income yield Income yield Weighted average cost of debt Weighted average net investment spread 3-Month London Interbank Offered Rate ("LIBOR") 3 5 4 2 PORTFOLIO HIGHLIGHTS – SPREAD ANALYSIS 1. Weighted average interest rate on new investments is based on the contractual interest rate at the time of funding. For varia ble rate loans, the contractual rate is calculated using current LIBOR, the spread over LIBOR and the impact of any LIBOR floor. Fo r fixed rate loans, the contract rate is the stated fixed rate. 2. Investment income yield is calculated as (a) the actual amount earned on earning investments , including interest and fee income and amortization of capitalized fees and discounts, divided by (b ) the daily average of total earning investments at fair value. 3. Income yield is calculated as (a) the actual amount earned on earning investments, including interest and fee income but excluding amortization of capitalized fees and discounts, divided by (b ) the daily average of total investments at fair value. 4. The weighted average cost of debt is calculated as (a) the actual amount incurred on debt obligations divided by (b) the daily average of total debt obligations. 5. The weighted average net investment spread is calculated as (a) the investment income yield less (b) the weighted average cost of debt . Portfolio Rotation – Debt Investments Q4 2 015 Q3 2 015 Q2 2 015 Q1 2 015 Q4 2 014 Weighted average interest rate of new investments 1 6.8% 6.8% 6.5% 6.8% 6.7% Weighted average interest rate on investments that were sold or paid - off 6.9% 6.8% 6.5% 6.5% 7.0% Weighted average spread over LIBOR of new floating rate investments 5.8% 5.8% 5.4% 5.8% 5.7% Weighted average interest rate of new fixed rate investments N/A N/A 10.8% N/A N/A Weighted average fees on new investments 1.5% 1.4% 1.3% 1.8% 1.1%

7 PORTFOLIO HIGHLIGHTS – CREDIT QUALITY Credit Quality – Investment Portfolio Fundamental credit quality remains strong with non - accrual investments as a percentage of total investments at fair value increa sing slightly to 0.4% as of September 30, 2015 from 0.2% as of June 30, 2015. During the quarter, one additional investment was classified as non - accrual. Internal Performance Ratings 1 on our investments have remained relatively stable for the past several quarters and over 90.0% of the investments in our por tf olio had an Internal Performance Rating of 4 or higher as of September 30, 2015. The fair value of debt investments as a percentage of principal amount remained stable at 98.5% for the quarter ended September 30, 2015. Non - Accrual – Debt Investments Q4 2 015 Q3 2 015 Q2 2 015 Q1 2 015 Q4 2 014 Non - accrual investments at amortized cost (000s) $ 17,078 $ 8,019 $ 10,834 $ 6,987 $ 3,021 Non - accrual investments / Total investments at amortized cost 1.1% 0.5% 0.8% 0.5% 0.2% Non - accrual investments at fair value (000s) $ 6,487 $ 3,204 $ 3,209 $ 2,233 $ 5 Non - accrual investments / Total investments at fair value 0.4% 0.2% 0.2% 0.2% 0.0% 2 1. Please see Internal Performance Ratings definitions on the following page. 2. Represents an amount less than 0.1%.

8 PORTFOLIO HIGHLIGHTS – PORTFOLIO RATINGS Rating Definition 5 Borrower is performing above expectations and the trends and risk factors are generally favorable 4 Borrower is generally performing as expected and the risk factors are neutral to favorable 3 Borrower may be out of compliance with debt covenants; however, loan payments are generally not past due 2 Borrower is performing materially below expectations and the loan’s risk has increased materially since origination 1 Borrower is p erforming substantially below expectations and the loan’s risk has substantially increased since origination September 30, 2015 June 30, 2015 March 31, 2015 Internal Performance Rating Investments at Fair Value (in thousands) % of Total Portfolio Investments at Fair Value (in thousands) % of Total Portfolio Investments at Fair Value (in thousands) % of Total Portfolio 5 $ 134,142 8.8% $ 203,990 13.0% $ 152,434 10.7% 4 $ 1,298,558 84.9% $ 1,274,300 81.1% $ 1,167,998 82.1% 3 $ 87,687 5.7% $ 81,529 5.2% $ 91,513 6.4% 2 $ 9,397 0.6% $ 10,868 0.7% $ 11,113 0.8% 1 $ - 0.0% $ - 0.0% $ 5 0.0% Total $ 1,529,784 1 00.0% $ 1,570,687 1 00.0% $ 1,423,063 1 00.0% Strong Portfolio Risk Ratings Internal Performance Rating Definition * Represents an amount less than 0.1%. *
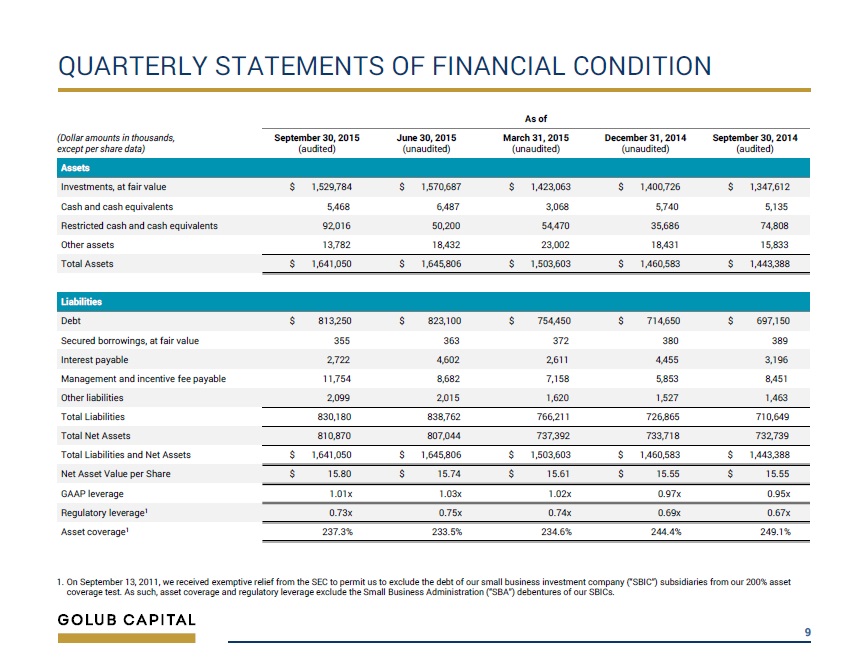
9 QUARTERLY STATEMENTS OF FINANCIAL CONDITION As of ( Dollar amounts in thousands , except per share data) September 30, 2015 (audited) June 30, 2015 (unaudited) March 31, 2015 (unaudited) December 31, 2014 (unaudited) September 30, 2014 (audited ) Assets Investments, at fair value $ 1,529,784 $ 1,570,687 $ 1,423,063 $ 1,400,726 $ 1,347,612 Cash and cash equivalents 5,468 6,487 3,068 5,740 5,135 Restricted cash and cash equivalents 92,016 50,200 54,470 35,686 74,808 Other assets 13,782 18,432 23,002 18,431 15,833 Total Assets $ 1,641,050 $ 1,645,806 $ 1,503,603 $ 1,460,583 $ 1,443,388 Liabilities Debt $ 813,250 $ 823,100 $ 754,450 $ 714,650 $ 697,150 Secured borrowings, at fair value 355 363 372 380 389 Interest payable 2,722 4,602 2,611 4,455 3,196 Management and incentive fee payable 11,754 8,682 7,158 5,853 8,451 Other liabilities 2,099 2,015 1,620 1,527 1,463 Total Liabilities 830,180 838,762 766,211 726,865 710,649 Total Net Assets 810,870 807,044 737,392 733,718 732,739 Total Liabilities and Net Assets $ 1,641,050 $ 1,645,806 $ 1,503,603 $ 1,460,583 $ 1,443,388 Net Asset Value per Share $ 15.80 $ 15.74 $ 15.61 $ 15.55 $ 15.55 GAAP leverage 1.01x 1.03x 1.02x 0.97x 0.95x Regulatory leverage 1 0.73x 0.75x 0.74x 0.69x 0.67x Asset coverage 1 237.3% 233.5% 234.6% 244.4% 249.1% 1. On September 13, 2011, we received exemptive relief from the SEC to permit us to exclude the debt of our small business inves tme nt company (“SBIC”) subsidiaries from our 200% asset coverage test. As such , asset coverage and regulatory leverage exclude the Small Business Administration (“SBA”) debentures of our SBICs.

10 QUARTERLY OPERATING RESULTS For the three months ended ( Dollar amounts in thousands , except share and per share data) September 30, 2015 (unaudited) June 30, 2015 (unaudited) March 31, 2015 (unaudited) December 31, 2014 (unaudited) September 30, 2014 (unaudited) Investment Income Interest income $ 31,495 $ 29,838 $ 27,489 $ 27,319 $ 28,840 Dividend income 675 492 377 18 536 Fee income 1,382 80 595 208 1,282 Total Investment Income 33,552 30,410 28,461 27,545 30,658 Expenses Interest and other debt financing expenses 6,657 6,142 6,017 5,694 5,987 Base management fee 5,428 5,226 4,855 4,821 4,650 Incentive fee 4,514 2,383 2,258 1,071 3,833 Other operating expenses 1,472 1,454 1,577 1,402 1,338 Total Expenses 18,071 15,205 14,707 12,988 15,808 Net Investment Income 15,481 15,205 13,754 14,557 14,850 Net Gain (Loss) on Investments and Secured Borrowings Net realized gain (loss) on investments 4,851 (1,746) 4,523 1,726 10,290 Net unrealized appreciation (depreciation) on investments and secured borrowings (862) 4,829 (416) (1,111) (4,958) Net gain (loss) on investments and secured borrowings 3,989 3,083 4,107 615 5,332 Net Increase in Net Assets Resulting from Operations $ 19,470 $ 18,288 $ 17,861 $ 15,172 $ 20,182 Per Share Earnings P er Share $ 0.38 $ 0.36 $ 0.38 $ 0.32 $ 0.43 Net Investment Income Per Share $ 0.30 $ 0.30 $ 0.29 $ 0.31 $ 0.32 Distributions Paid $ 0.32 $ 0.32 $ 0.32 $ 0.32 $ 0.32 Weighted average common shares outstanding 51,260,320 50,491,035 47,174,501 47,121,194 47,067,990 Common shares outstanding at end of period 51,300,193 51,259,434 47,225,212 47,171,518 47,119,498

11 0.32 0.31 0.29 0.30 0.30 0.11 0.01 0.09 0.06 0.08 $0.43 $0.32 $0.38 $0.36 $0.38 $0.00 $0.10 $0.20 $0.30 $0.40 $0.50 Q4'14 Q1'15 Q2'15 Q2'15 Q4'15 NII Gains/Loss 8.1% 7.9% 7.6% 7.7% 7.6% 11.0% 8.2% 9.8% 9.2% 9.5% 0% 2% 4% 6% 8% 10% 12% 14% Q4'14 Q1'15 Q2'15 Q3'15 Q4'15 NII Net Income $14.56 $14.53 $14.69 $14.58 $14.60 $14.66 $14.80 $15.12 $15.21 $15.23 $15.41 $15.44 $15.55 $15.55 $15.61 $15.74 $15.80 $14.00 $14.20 $14.40 $14.60 $14.80 $15.00 $15.20 $15.40 $15.60 $15.80 Q4'11 Q1'12 Q2'12 Q3'12 Q4'12 Q1'13 Q2'13 Q3'13 Q4'13 Q1'14 Q2'14 Q3'14 Q4'14 Q1'15 Q2'15 Q3'15 Q4'15 FINANCIAL PERFORMANCE HIGHLIGHTS Quarterly EPS Composition Annualized Return on Average Equity 1, 2 GBDC Quarterly NAV per Common Share Since FY 2011 Q4 1. The net investment income (“NII”) annualized return on average equity is calculated as (a) the net investment income for the per iod presented divided by (b) the daily average of total net assets. 2. The net income annualized return on average equity is calculated as (a) the net increase in assets resulting from operations for the period presented divided by (b) the daily average of total net assets.

12 PORTFOLIO HIGHLIGHTS – SENIOR LOAN FUND LLC Net growth in investments, at fair value, for the quarter ended September 30, 2015 was $62.1 million, a 24.3% increase from J une 30, 2015 as SLF purchased $85.9 million 1 of loans from GBDC at fair value. The annualized quarterly return for the quarter ended September 30, 2015 of 4.8% was lower than the previous qua rter due to mark - to - market unrealized losses on some broadly syndicated and middle - market loans. Subject to leverage and borrowing base restrictions, as of September 30, 2015, SLF had approximately $87.7 million of remaini ng commitments and $1.0 million of availability on its revolving credit facility with Wells Fargo which was increased to $300 million from $200 million on September 10, 2015. (Dollar amounts in thousands) As of Balance Sheet September 30, 2015 (unaudited) June 30, 2015 (unaudited) March 31, 2015 (unaudited) December 31, 2014 (unaudited) Total investments, at fair value $ 317,623 $ 255,523 $ 189,151 $ 121,676 Cash and other assets 8,236 9,379 4,846 4,694 Total assets $ 325,859 $ 264,902 $ 193,997 $ 126,370 Senior credit facility $ 212,300 $ 159,455 $ 121,300 $ 74,750 Other liabilities 489 5,030 7,537 6,244 Total liabilities 212,789 164,485 128,837 80,994 Subordinated debt and members’ equity 113,070 100,417 65,160 45,376 Total liabilities and net assets $ 325,859 $ 264,902 $ 193,997 $ 126,370 Senior leverage 1.88x 1.59x 1.86x 1.65x (Dollar amounts in thousands) For the three months ended GBDC Return on Investments in SLF September 30, 2015 (unaudited) June 30, 2015 (unaudited) March 31, 2015 (unaudited) December 31, 2014 (unaudited) Total income $ 1,119 $ 1,455 $ 1,214 $ 524 Annualized total return 2 4.8% 8.5% 11.0% 5.7% 1. Total investment commitments purchased were $85.9 million , of which $74.7 million was outstanding at fair value at the date of sale. 2. GBDC’s annualized total return is calculated by dividing total income earned on our investments in SLF subordinated notes and SLF LL C e quity interests by the combined daily average of our investments in (1) the principal of the SLF subordinated notes and (2) t he net asset value of the SLF LLC equity interests. Annualized total return excludes the impact of management fees and incentive fees that may be cha rged by GC Advisors based on GBDC’s investments in SLF and the income from such investments .

13 LIQUIDITY AND INVESTMENT CAPACITY Cash and Cash Equivalents Unrestricted cash and cash equivalents totaled $5.5 million as of September 30, 2015. Restricted cash and cash equivalents totaled $92.0 million as of September 30, 2015. Restricted cash is held in our securitiz ati on vehicles, SBIC subsidiaries and our revolving credit facility subsidiaries and is reserved for quarterly interest payments and is also available for new investments that qualify for acquisition by the se entities. Debt Facilities - Availability Revolving Credit Facilities - As of September 30, 2015, subject to leverage and borrowing base restrictions, we had approximately $72.7 million of remaining commitments and $40.1 million of availability on our $200.0 million revolving credit facility with Wells Fargo. As of September 30, 2015, subject to leverage and borrowing base restrictions, we had approximately $15.0 million of remaining commitments and $ 2.9 million of availability on our $15.0 million revolving credit facility with PrivateBank. Debt Facilities - Amendments Revolving Credit Facilities – On October 21, 2015, we terminated the revolving credit facility with PrivateBank. There were no borrowings outstanding on t h e facility at the time of termination.

14 Tranche Rating (M/S) Par Amount ($mm) Interest Rate Stated Maturity Reinvestment Period Class A - 1 Notes Aaa/AAA $191.0 3 Month LIBOR + 1.75% April 25, 2026 April 28, 2018 Class A - 2 Notes 2 Aaa/AAA $20.0 3 Month LIBOR + 1.45% April 25, 2026 April 28, 2018 Class B Notes Aa2/AA $35.0 3 Month LIBOR + 2.50% April 25, 2026 April 28, 2018 Total Notes Issued 3 $246.0 Tranche Rating (M/S) Par Amount ($mm) Interest Rate Stated Maturity Reinvestment Period Class A Notes Aaa/AAA $203.0 3 Month LIBOR + 1.74% July 20, 2023 July 20, 2017 Class B Notes Aa/AA $12.0 3 Month LIBOR + 2.40% July 20, 2023 July 20, 2017 Total Notes Issued 1 $215.0 Issuer Amount Outstanding ($mm) Maximum Commitment ($mm) Interest Rate Stated Maturity Reinvestment Period Wells Fargo Revolving Credit Facility $127.3 $200.0 1 Month LIBOR + 2.25% July 30, 2020 July 29, 2017 PrivateBank Revolving Credit Facility 4, 5 $0.0 $15.0 LIBOR + 3.50% November 22, 2020 November 22, 2015 SBIC IV $150.0 $150.0 3.7% 6 10 - year maturity after drawn June 6, 2017 SBIC V $75.0 $75.0 3.7% 6 10 - year maturity after drawn May 27, 2019 2010 Debt Securitization 2014 Debt Securitization 1. The Subordinated Notes issued in the 2010 Debt Securitization, as amended in February 2013, totaling $135 million were retain ed by us. 2. The Class A - 2 Notes issued in the 2014 Debt Securitization bear interest at 3 - month LIBOR + 1.45% through December 4, 2015 and 3 - month LIBOR + 1.95% thereafter. 3. The Class C Notes and LLC Equity Interests issued in the 2014 Debt Securitization, totaling $37.5 million and $119.1 million, re spectively, were retained by us. 4. The PrivateBank Revolving Credit Facility bears interest at a rate of either 1, 2 or 3 month LIBOR plus 3.50% per annum or PrivateBank’s prime rate plus 1.50% per annum through November 22, 2015 and either 1, 2 or 3 month LIBOR plus 2.50% per annum or PrivateBank’s prime rate plus 0.50% per annum thereafter . 5. On October 21, 2015 we terminated the revolving credit facility with PrivateBank. 6. The SBA debentures have interest rates that are fixed at various pooling dates and have an average annualized rate of 3.7%. Debt Facilities DEBT FACILITIES

15 COMMON STOCK AND DISTRIBUTION INFORMATION Common Stock Data Distribution Data Date Declared Record Date Payment Date Amount Per Share Total Amount (in thousands) August 6, 2013 September 13, 2013 September 27, 2013 $0.32 $12,733 November 26, 2013 December 17, 2013 December 27, 2013 $0.32 $13,851 February 4, 2014 March 17, 2014 March 28, 2014 $0.32 $13,864 May 6, 2014 June 16, 2014 June 27, 2014 $0.32 $15,048 August 5, 2014 September 16, 2014 September 26, 2014 $0.32 $15,061 November 17, 2014 December 18, 2014 December 29, 2014 $0.32 $15,078 February 3, 2015 March 20, 2015 March 27, 2015 $0.32 $15,095 May 11, 2015 June 18, 2015 June 29, 2015 $0.32 $16,393 August 4, 2015 September 7, 2015 September 29, 2015 $0.32 $16,403 November 17, 2015 December 11, 2015 December 29, 2015 $0.32 $16,416 Fiscal Year Ended September 30, 2 014 High Low End of Period First Quarter $19.11 $16.74 $19.11 Second Quarter $19.26 $17.64 $17.84 Third Quarter $17.97 $15.94 $17 .70 Fourth Quarter $17.80 $15.95 $15.95 Fiscal Year Ended September 30, 2 015 First Quarter $18.15 $16.15 $17.93 Second Quarter $18.04 $17.05 $17.55 Third Quarter $17.90 $16.56 $16.56 Fourth Quarter $17.13 $15.90 $15.98 1. Estimated based on the number of shares outstanding on November 17, 2015. 1